Crypto World
Nasdaq 100 May Retest This Year’s Low

As the chart of the Nasdaq 100 index (US Tech 100 mini on FXOpen) shows, bearish sentiment currently dominates the equity market. Yesterday, the technology index fell by around 2%.
Why Is the Nasdaq 100 Declining?
According to media reports, developments linked to the expansion of AI are weighing on the market:
→ Major technology firms are sharply increasing capital expenditure on infrastructure, yet there is little clarity on when these investments will begin to generate returns. For instance, Google issued bonds this week, including 100-year debt.
→ The impact of AI on traditional business models, particularly companies operating in the software sector.

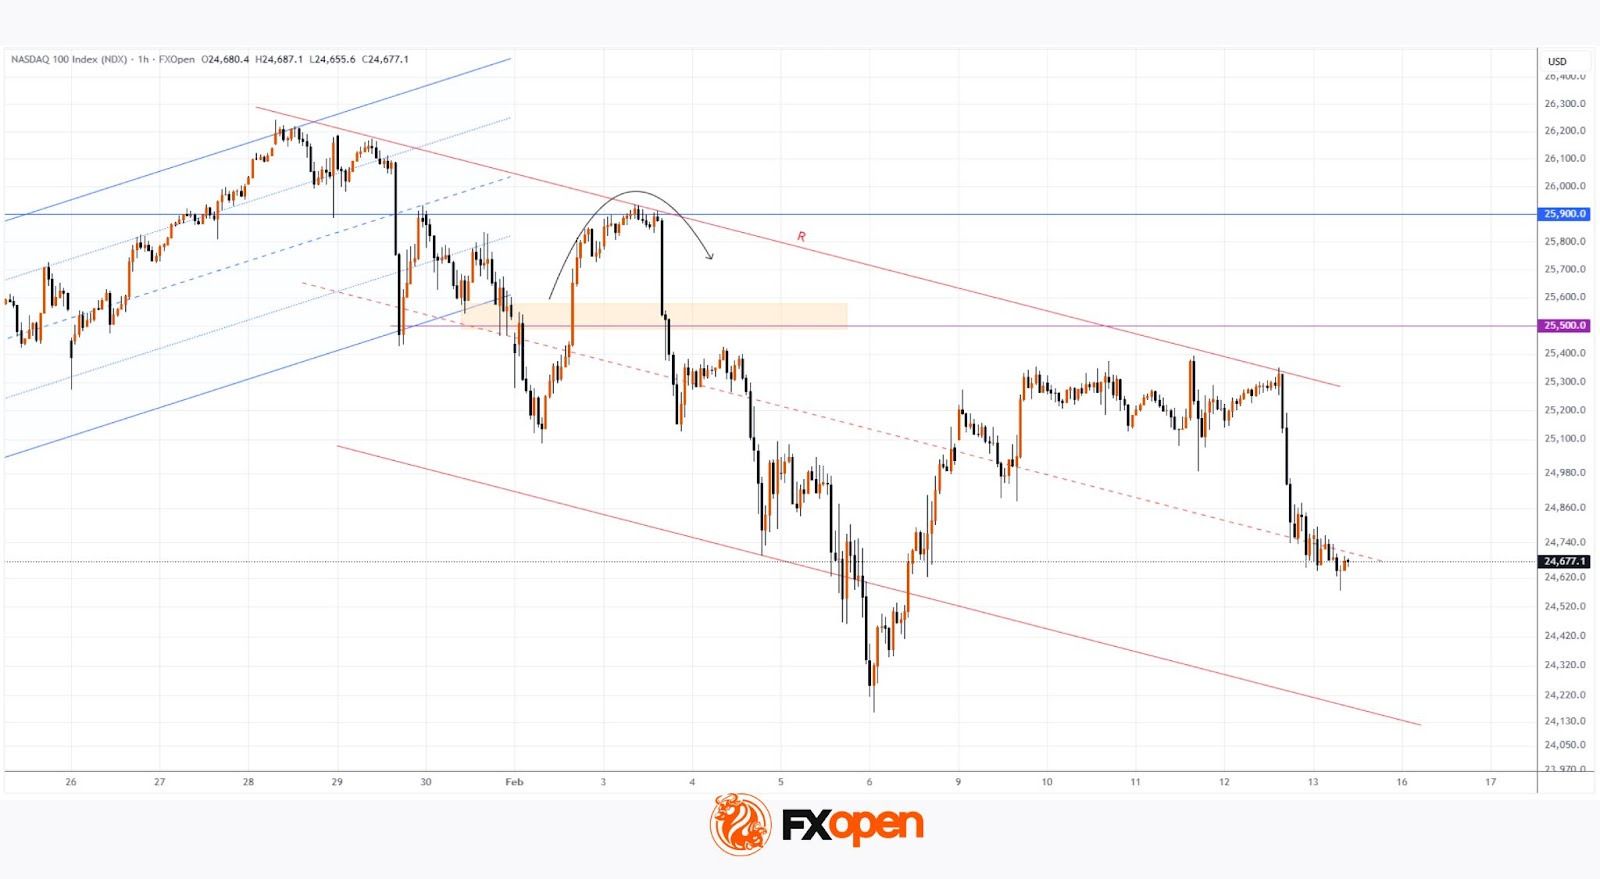
Technical Analysis of the Nasdaq 100 Chart
When analysing Nasdaq 100 price action (US Tech 100 mini on FXOpen) on 2 February, we:
→ identified a resistance zone (highlighted in orange) and marked the key 25,900 resistance level;
→ noted that bears had taken the initiative and suggested they would need to maintain control around the 25,500 area — where the ascending channel had previously been broken.
Since then, bulls managed to break above this zone, but only briefly, testing the 25,900 level. As indicated by the arrow, the move was short-lived and prices soon fell back below, signalling the bulls’ inability to sustain upward momentum.
A sequence of lower highs has allowed a descending trend line (R) to be drawn. If the consolidation that began last evening reflects a temporary balance between supply and demand, a median line can be plotted, with a lower channel boundary beneath it.
Under a continued downward trend scenario, this configuration points to the potential for the Nasdaq 100 to set a fresh low for the year. Whether this outlook materialises will largely depend on US inflation data. The CPI report is due for release today at 16:30 (GMT+3). Traders should be prepared for heightened volatility.
Trade global index CFDs with zero commission and tight spreads (additional fees may apply). Open your FXOpen account now or learn more about trading index CFDs with FXOpen.
This article represents the opinion of the Companies operating under the FXOpen brand only. It is not to be construed as an offer, solicitation, or recommendation with respect to products and services provided by the Companies operating under the FXOpen brand, nor is it to be considered financial advice.
You must be logged in to post a comment Login