Crypto World
Netflix Analysis: Trend Breakout and Price Move Beyond the Profile

On 25 August, Wolfe Research analysts raised their price target for Netflix shares from $84.00 to $95.00. According to Wolfe Research, the company’s weak second-quarter subscriber and engagement figures were driven by the timing of content releases rather than a decline in demand. Previous seasons of shows returning in the third quarter generated 1.3 billion hours viewed in the top 10, compared with 765 million hours for second-quarter releases. Based on this, Wolfe Research expects stronger results in the second half of the year and a solid outlook for 2027.
Technical Analysis of Netflix

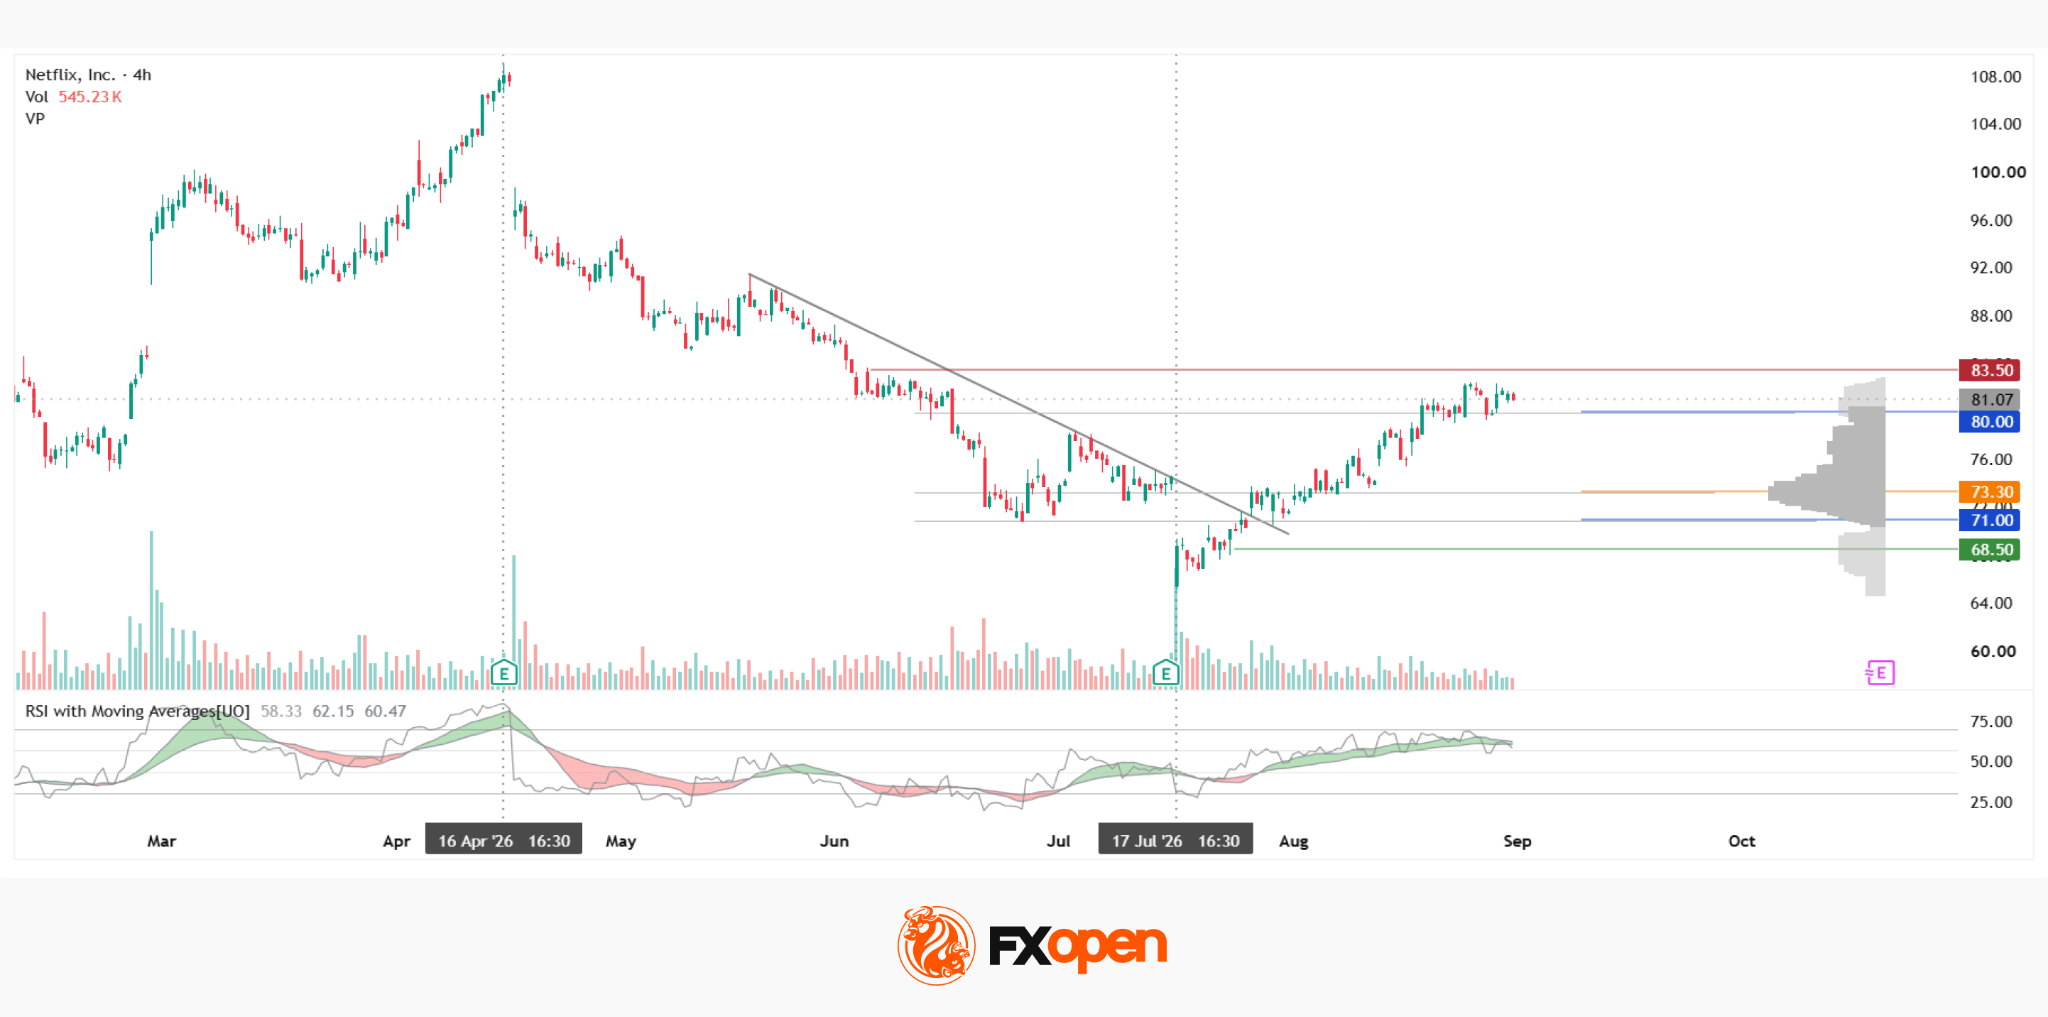
The four-hour NFLX chart shows a short-term downtrend, within which a descending trendline had formed. On 17 July, the final bar of the trend was accompanied by a pronounced spike in vertical volume, prompting an upward reversal that was followed by a breakout above the trendline.
The stock is now trading above the upper boundary of the current market profile at $80.00, potentially setting the stage for further tests of higher levels. The nearest significant resistance is around $83.50.
If the market reverses or the price is rejected at the red resistance level, Netflix could move back into the market-profile range. Before attempting to break below the profile, however, the price would need to overcome a substantial cluster of levels, including the POC at $73.30 and the lower profile boundary at $71.00.
Immediately below this cluster lies the green support level around $68.50.
The RSI + MAs indicator currently shows readings of 58, 62 and 60. The oscillator and both moving averages remain above the neutral zone and continue to display bullish signals. Notably, RSI has not entered overbought territory at any point during the rebound.
Key Takeaways
The move above the market profile, combined with the bullish RSI + MAs readings, could indicate that the previous downtrend has come to an end. The surge in volume at the trend low also marked a potential structural reversal point.
The stock’s further performance may depend not only on the technical setup but also on whether upcoming content releases validate analysts’ expectations for stronger results in the second half of the year.
Buy and sell stocks of the world’s biggest publicly-listed companies with CFDs on FXOpen’s trading platform. Open your FXOpen account now or learn more about trading share CFDs with FXOpen.
This article represents the opinion of the Companies operating under the FXOpen brand only. It is not to be construed as an offer, solicitation, or recommendation with respect to products and services provided by the Companies operating under the FXOpen brand, nor is it to be considered financial advice.
You must be logged in to post a comment Login