
Crypto World
New ChatGPT Predicts the Price of XRP, Solana and Shiba Inu By the End of 2026

News feeds may be rocked by war news, but markets are weathering it; ChatGPT even predicts a strong year ahead for XRP, SOL and SHIB HODLers.
It seems the market already priced in war news during the downturns following Trump’s previous threats of US military escalation on Greenland and Iran earlier in the year.
Given all the uncertainties, however, just how likely are ChatGPT’s forecasts?
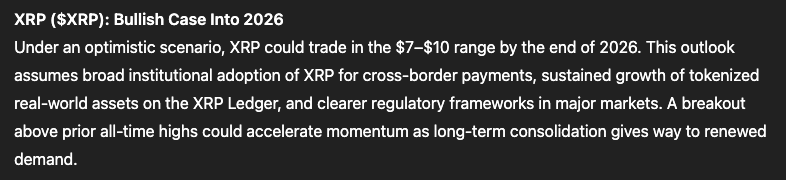
XRP ($XRP): ChatGPT Predicts a Clean 7x Surge by Christmas
In a recent update, Ripple reiterated that XRP ($XRP) remains fundamental to its vision to transform the XRP Ledger (XRPL) into a global, enterprise-grade payments network.
Powered by elite infrastructure, instant settlement and minimal fees, XRPL is likely to capitalise greatly on two of crypto’s fastest-expanding niches: stablecoins and tokenised real-world assets.
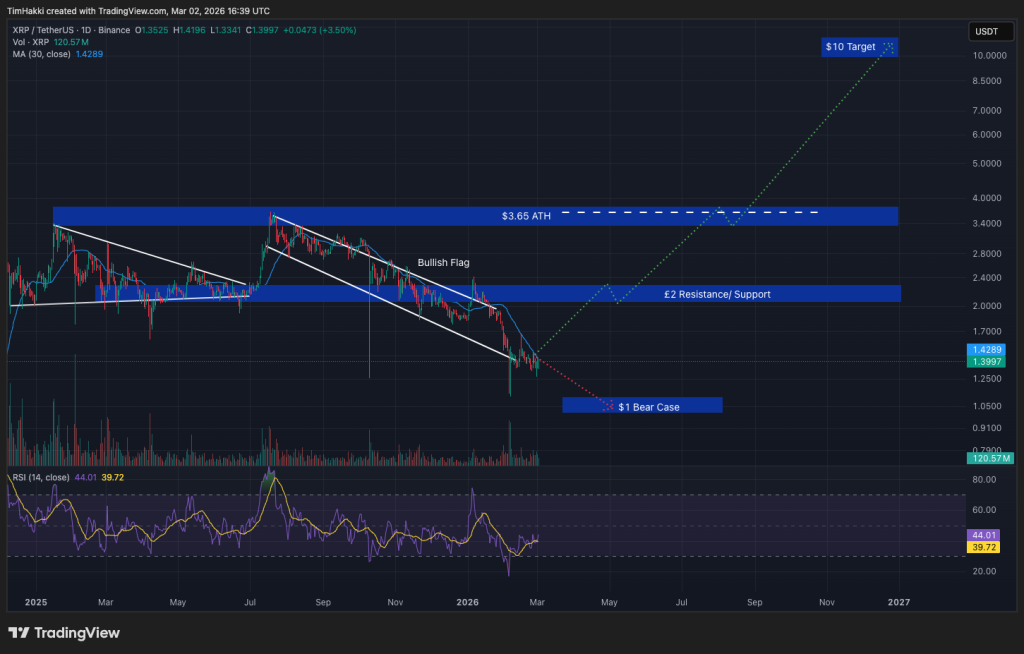
With XRP currently trading around $1.41, ChatGPT projects a potential rally toward $10 in 2026, a move that would represent 7x for current holders.
Technical indicators also support upward movement. XRP’s relative strength index (RSI) hovers near 44, while price action has stabilised around the 30-day moving average, hinting the prolonged consolidation phase may be over
Additional bullish catalysts could include growing institutional participation following the rollout of U.S.-listed XRP ETFs, Ripple’s expanding global partnership network, and improved regulatory clarity if the CLARITY bill passes in the U.S. this year.
Solana (SOL): Will Solana Double ATH Soon?
Solana ($SOL) hosts $6.5 billion in total value locked (TVL) and carries a market capitalisation of $51 billion.
Institutional demand grew after the recent launch of Solana exchange-traded funds from major asset managers, including Bitwise and Grayscale.
Even so, SOL suffered a deep correction in late 2025 and spent much of February trading below the $100 level.
Under ChatGPT’s most optimistic scenario, Solana could climb from its current price near $89 to roughly $600 by Christmas. Such a move would deliver close 7x upside and double Solana’s all-time high (ATH) of $293, recorded in January 2025.
Further reinforcing Solana’s outlook, asset management giants such as Franklin Templeton and BlackRock are actively issuing tokenised assets on the network, underscoring the network’s headstart as a scalable, institution-friendly blockchain.
Shiba Inu (SHIB): ChatGPT AI Predicts a Possible 2,000% Rally
Launched in 2020 as a playful parody of Dogecoin, Shiba Inu ($SHIB) has since evolved into a multi-faceted ecosystem with a market capitalisation around $3.4 billion.
At its current price near $0.0000057, ChatGPT’s analysis indicates that a decisive breakout above the $0.000025–$0.00003 resistance zone could ignite strong bullish momentum, potentially driving SHIB toward $0.00012 before year-end.
That scenario would imply eye watering gains of around 21x (+2,000%), placing SHIB above its October 2021 ATH of $0.00008616.
Beyond meme coin hype, the project offers real utility. Shiba Inu’s Ethereum Layer-2 solution, Shibarium, offers faster transactions, lower fees, enhanced privacy and a more developer-friendly environment.
Maxi Doge: Early-Stage Meme Coin Targets Explosive Growth
According to ChatGPT, Shiba Inu’s likelihood of a 21x run indicates strong conviction that a bull market could usher the start of meme season. However, newer stage meme coins offer more room for growth
One such buzzy new project is Maxi Doge ($MAXI). It has already raised $4.7 million during its ongoing presale, as early investors stack what some are calling the next Dogecoin.
Maxi Doge is Dogecoin’s louder, more aggressive gym-bro cousin, driven by envy and fuelled by a viral degen marketing strategy that taps into the chaotic energy of the 2021 meme coin cycle.
MAXI is an ERC-20 token on Ethereum’s proof-of-stake network, offering a significantly lower environmental footprint compared to Dogecoin’s proof-of-work architecture.
Early presale buyers can currently stake MAXI for yields of up to 67% APY, with rewards gradually decreasing as the staking pool expands.
The token is $0.0002806 in the current presale stage, with automatic price increases programmed at each funding milestone. Purchases are supported via wallets such as MetaMask and Best Wallet.
Stay updated through Maxi Doge’s official X and Telegram pages.
Visit the Official Website Here.
The post New ChatGPT Predicts the Price of XRP, Solana and Shiba Inu By the End of 2026 appeared first on Cryptonews.

Kooc Media, a specialist PR distribution agency serving the crypto, fintech and iGaming industries, has announced the launch of dedicated PR services designed specifically for online casino and sportsbook brands. The new offering gives gambling operators, affiliates and iGaming startups access to guaranteed media placements across a network of high-authority news websites, combined with full newswire distribution to hundreds of partner outlets.
The iGaming industry continues to grow rapidly worldwide. New online casinos, sportsbook platforms and betting apps launch every month, all competing for visibility in a crowded market. For many of these brands, getting meaningful press coverage has been a persistent challenge. Traditional PR agencies often lack the specialist knowledge needed to work with gambling companies, and many mainstream publications refuse to cover iGaming content altogether.
Kooc Media has built its gambling PR services to address this gap directly. The agency operates its own network of in-house news websites, which means it can guarantee publication rather than relying on pitching journalists who may never respond. This model removes the uncertainty that has frustrated gambling brands working with conventional PR firms for years.
“Online casino and sportsbook brands face unique challenges when it comes to public relations,” said Michelle De Gouveia, spokesperson for Kooc Media. “Many agencies either don’t understand the iGaming space or won’t work with gambling companies at all. We built these services because we saw a real need for reliable, guaranteed PR distribution that actually delivers results for this industry.”
What the New iGaming PR Services Include
Kooc Media’s gambling PR packages cover everything an online casino or sportsbook brand needs to build media presence quickly. Services include press release writing, sponsored article creation, homepage feature placements on in-house websites, and distribution through partner news networks.
The agency’s in-house editorial team can handle the entire process from start to finish. Clients provide the key details about their brand, product launch or announcement, and Kooc Media writes the press release, publishes it across its owned media network, and distributes it through its newswire partners. Every campaign comes with full reporting and live links to each placement.
For brands that need wider reach, Kooc Media also offers distribution through major financial and business news networks. Depending on the package selected, press releases can appear on sites such as Business Insider, Bloomberg, Benzinga, MarketWatch and other well-known platforms. This gives iGaming companies access to the same calibre of media coverage that mainstream businesses receive.
All articles are published on Google News indexed websites, which means they can appear in Google News results and gain organic search visibility. For online casino and sportsbook brands competing in a market where search engine rankings matter enormously, this is a significant advantage.

Why Online Casinos and Sportsbooks Need Specialist PR
The online gambling industry operates under heavy regulation in most markets. Advertising restrictions, licensing requirements and compliance rules make it difficult for casino and sportsbook brands to promote themselves through standard marketing channels. Many social media platforms restrict gambling advertising, and paid search options are limited in several jurisdictions.
This makes earned media and PR coverage more important than ever for iGaming companies. A well-placed press release on a respected news website can drive brand awareness, build trust with potential players, and improve search engine rankings through high-quality backlinks. For new online casinos entering the market, PR coverage can be the difference between getting noticed and getting lost in the noise.
Kooc Media’s approach works well for iGaming brands because the agency already operates in this space. Its network of in-house websites includes publications that regularly cover finance, technology and digital entertainment topics. This means gambling-related content fits naturally within the editorial environment, rather than being forced into publications where it looks out of place.
The agency also understands the compliance side of iGaming PR. Press releases for online casinos and sportsbooks need to meet specific standards around responsible gambling messaging and regulatory accuracy. Kooc Media’s team is familiar with these requirements and ensures all content meets industry standards before publication.
Serving a Growing Market
The global online gambling market is projected to continue its strong growth over the coming years, driven by ongoing legalisation in new markets, the rise of mobile betting, and increasing consumer interest in live casino games and sports wagering. As more operators enter the market, the competition for player attention will only intensify.
Kooc Media sees its iGaming PR services as a long-term commitment to serving this sector. The agency already works with crypto projects, fintech companies and technology brands through its crypto PR services, and the expansion into dedicated gambling PR is a natural extension of its existing capabilities.
“The iGaming industry is moving fast, and the brands that succeed will be the ones that invest in building their public profile early,” said De Gouveia. “We offer same-day distribution, guaranteed placements, and access to major news networks. That combination is hard to find anywhere else, especially for gambling companies that have traditionally been underserved by the PR industry.”

How Kooc Media’s Model Differs from Traditional PR
Most traditional PR agencies work on a pitch-based model. They write a press release, send it to a list of journalists, and hope for coverage. There are no guarantees, and many campaigns result in little or no published coverage despite significant spend.
Kooc Media takes a different approach. Because the agency owns and operates its own media brands, it can guarantee that every press release will be published. Clients know exactly where their content will appear before they commit to a campaign. This performance-driven model has made the agency popular with crypto and fintech brands, and the company expects the same appeal among online casino and sportsbook operators.
The agency’s packages are designed to be straightforward. Clients choose a package based on the level of distribution they need, from in-house website placements through to full newswire distribution across hundreds of outlets. There are no hidden fees and no waiting weeks for results. Most campaigns are completed within 24 hours of approval.
About Kooc Media
Kooc Media is a specialist PR distribution agency founded in 2017. The company operates a network of in-house news websites including Blockonomi, CoinCentral, MoneyCheck, Parameter, Beanstalk and Computing. The agency provides PR services for the crypto, fintech, technology and iGaming industries, offering guaranteed media placements, newswire distribution and managed PR creation. Kooc Media serves clients worldwide from its UK headquarters.
Kooc Media’s gambling PR packages are available now through the company’s website at https://kooc.co.uk.
Disclaimer: This is a Press Release provided by a third party who is responsible for the content. Please conduct your own research before taking any action based on the content.


Omnes and Apex Group have announced plans to launch a tokenized debt note tied to Bitcoin mining activity on Base. The product will package Bitcoin hashrate exposure into an onchain financial instrument aimed at professional investors outside the United States.
Summary
- Omnes and Apex will issue OMN on Base, bringing Bitcoin hashrate exposure to approved investors.
- The secured debt note targets institutions seeking Bitcoin mining exposure without managing hardware or facilities exposure without managing hardware or facilities.
- The launch comes as tokenized real-world assets remain near $23 billion across public blockchains.
Meanwhile, financial technology firm Omnes and financial services provider Apex Group said they will tokenize the Omnes Mining Note, or OMN, on Base. Base is Coinbase’s Ethereum layer-2 network, and the companies said the note will be issued and managed there.
The OMN is structured as a secured debt note backed by Bitcoin hashrate. The product is designed to give approved investors exposure to new Bitcoin production without requiring them to operate mining machines or manage mining sites.
Apex said the note offers institutional investors “direct economic exposure to new Bitcoin production measured in hashrate.” The structure is meant to remove the need to handle hardware, power sourcing, and facility management.
The companies said the product will use hashrate as its core reference point. Hashrate refers to the computing power used to secure the Bitcoin network and generate new coins through mining activity.
Moreover, the OMN applies a familiar debt note structure while adding blockchain-based transfer features. According to the announcement, approved investors will be able to transfer the note onchain within a regulated framework. Omnes CEO Emmanuel Montero said,
“Bitcoin mining is the only mechanism that creates new Bitcoin through protocol issuance.”
He added that this model differs from yield strategies that depend on existing Bitcoin already in circulation.
While the structure expands access to Bitcoin mining exposure, some parts of the product remain unclear. The announcement did not fully explain how hashrate performance will convert into investor returns.
The companies also did not provide full details on the note’s liquidity terms or its risk profile. Those details may matter for investors assessing how the product would perform under changing mining and market conditions.
Additionally, the launch comes as tokenized real-world assets keep expanding in 2026. Data from DefiLlama showed on March 11 that tokenized RWAs on public blockchains reached about $23.6 billion, up 66% since the start of the year.
At the time of reporting, the onchain market cap for tokenized RWAs stood near $23 billion. The OMN adds another category to that market by linking a structured note to Bitcoin mining output.
Crypto World
Foundation launches developer platform for institutions, taps Mastercard, Western Union and Worldpay

The Solana Foundation is launching a new developer platform aimed at making it easier for financial institutions to build blockchain-based products, with early users including Mastercard, Western Union and Worldpay.
The Solana Developer Platform (SDP), currently available for developers to test, is a toolkit that enables enterprises to create and scale financial applications on Solana without deep crypto infrastructure expertise. The SDP will also integrate AI tools such as Anthropic’s Claude Code and OpenAI’s Codex.
The platform bundles services from more than 20 infrastructure providers — spanning custody, compliance, wallets and payments — into a single interface, streamlining what has traditionally been a fragmented process for institutions entering the space.
At launch, SDP includes two live modules. The issuance module enables companies to create tokenized deposits, stablecoins and tokenized real-world assets, while the payments module supports fiat and stablecoin flows, including on- and off-ramps and onchain transactions. A trading module is expected later in 2026.
The involvement of traditional payments firms underscores growing institutional interest in blockchain-based settlement. Mastercard is exploring stablecoin settlement on Solana, while Western Union is testing cross-border payments on the platform. Worldpay is focusing on merchant settlement and tokenized assets.
“As Solana continues to be the most trusted and innovative infrastructure for payments and financial companies worldwide, SDP provides an accessible and familiar experience for institutions and enterprises to start building products on Solana today,” the Solana Foundation wrote in a press release shared with CoinDesk.
Read more: Solana Foundation’s Liu: Focus on finance, not gaming ‘misadventures’


The Financial Stability Board has raised fresh concerns about the spread of foreign currency stablecoins in emerging markets.
Summary
- FSB said dollar stablecoins can weaken payments, monetary policy, and capital controls across emerging markets.
- Regulators still face gaps in applying the FSB’s global framework for crypto and stablecoin oversight.
- The FSB said stablecoins still show limited use in real economy payments despite market growth.
In its 2025 annual report, the global watchdog said US dollar stablecoins used across borders can create financial and policy risks for developing economies.
Meanwhile, the FSB said foreign currency-denominated stablecoins can create pressure for emerging market and developing economies. It stated that US dollar stablecoins moving across several jurisdictions may carry “potentially more acute” risks for those markets.
According to the report, these risks include currency substitution and weaker use of local payment systems. The board also said they can reduce the effectiveness of domestic monetary policy and create pressure on fiscal resources.
The FSB said regulators still need to track how the stablecoin sector develops. It noted that authorities must understand risks tied to liquidity, operational issues, and links with the wider financial system.
The report also referred to the FSB’s 2023 global framework for crypto asset activity and stablecoin arrangements. After reviewing that framework in 2025, the board said there are still clear gaps and inconsistencies in how it is being applied across jurisdictions.
Moreover, the board said crypto assets and stablecoins still have limited use in real economic activity, including payments. It stated,
“Despite growth in these markets in recent years, crypto-assets and stablecoins are not widely used in financial services supporting the real economy.”
At the same time, the FSB said stablecoins may offer some benefits. Still, it added that regulators should keep watching vulnerabilities as connections with core financial markets and institutions continue to grow.
FSB sets focus areas for 2026
The report said the board will continue to monitor digital innovation linked to crypto assets in 2026. Stablecoin-related risks remain part of that work, especially in areas tied to market structure and financial resilience.
The FSB also listed other priorities for the coming year. These include private credit, nonbank financial intermediation, cross-border payments, crisis preparedness, and further work on regulatory modernization.
Crypto World
Wall Street broker Bernstein calls bitcoin (BTC) bottom, keeps $150,000 year-end target


Bitcoin has likely found its bottom and is primed for further gains, Wall Street broker Bernstein said in a Tuesday note to clients, reiterating its $150,000 year-end price target.
“We believe Bitcoin has found its trough and is now heading higher,” wrote analysts led by Gautam Chhugani. The world’s largest cryptocurrency was trading around $71,000 at publication time.
The broker also maintained its bullish view on bitcoin treasury company Strategy (MSTR), calling it a high-beta proxy for bitcoin with a “resilient, liquid and pressure-tested” balance sheet. The firm, led by Executive Chairman Michael Saylor, holds roughly 3.6% of the total bitcoin supply, worth about $53.5 billion.
Bernstein has an outperform rating on Strategy with a $450 price target. The shares were unchanged in early trading, around $138.10.
The analysts also highlighted growing demand for Strategy’s preferred instrument, STRC, which offers an 11.5% monthly dividend with low volatility.
STRC’s perpetual structure helps reduce equity dilution while providing long-term capital, with trading volumes rising 65% over the past three months, the report noted.
Bitcoin’s recent pullback comes after a sharp run-up to record highs in late 2025, with prices falling as much as 45% from the peak amid a mix of macro and market-driven pressures. Analysts point to a higher-for-longer interest rate backdrop, geopolitical risk tied to the Middle East and intermittent exchange-traded fund (ETF) outflows weighing on risk appetite.
The unwind of leveraged positions and profit-taking by long-term holders accelerated the decline, triggering bouts of forced liquidations and adding to volatility.
Despite the scale of the correction, Bernstein analysts characterized the move as a temporary reset in sentiment rather than a breakdown in fundamentals, noting the absence of systemic stress typically seen in prior crypto downturns.
On the macro side, the analysts noted bitcoin has outperformed gold by 25% since the onset of the Iran conflict at the end of February, underscoring the cryptocurrency’s appeal as a portable, censorship-resistant asset during periods of geopolitical stress.
Institutional demand remains a key driver. The broker pointed to resilient ETF flows and increasing participation from banks offering bitcoin-related financial services.
Read more: Bitcoin’s quantum threat is real, but far from an existential crisis, Galaxy says


- Dogecoin price was around $0.094, up 4% in the past 24 hours.
- Bulls continue to show resilience as the technical picture suggests a potential breakout.
- Despite geopolitical headwinds, the $0.15 target remains in play.
Dogecoin (DOGE) is holding near the psychologically important $0.09–$0.10 range, as the broader crypto market navigates the geopolitical tensions linked to Iran.
The digital asset space has shown pockets of resilience, with Bitcoin remaining close to the $70,000 level, helping support sentiment.
Dogecoin had briefly climbed to around $0.15 in early 2026, and that level could remain relevant if buying interest returns, despite continued selling pressure over the past month.
DOGE eyes $0.10 retest
Dogecoin (DOGE) is trading around $0.094 at the time of writing, having slipped below the $0.10 level after a roughly 9% decline over the past week.
The $0.092 area has continued to provide near-term support through much of February and March.
The token is slightly higher on the day, after recently testing the lower band of its daily Bollinger Bands.
Broader market direction remains key. Bitcoin is attempting to stabilise near $70,000 despite ongoing geopolitical pressures, a level closely watched by market participants.
A sustained move higher in Bitcoin could support sentiment across altcoins.
For DOGE, the $0.10 mark remains a critical inflection point.
A break above this level could shift momentum in favour of buyers, while continued macroeconomic and geopolitical uncertainty may test the token’s ability to hold current support levels.
Dogecoin price outlook: $0.15 target remains
From a technical perspective, the case for Dogecoin (DOGE) revisiting the $0.15 level in the near term rests on two key factors.
First, the token has continued to hold above the $0.090 support zone.
Second, the Bollinger Bands on the daily chart are tightening, a setup that often precedes a stronger directional move.
These conditions have coincided with repeated rebounds from the lower Bollinger Band, suggesting that the $0.09–$0.10 range is acting as an intermediate support area.
Some analysts view this price action as indicative of a potential double bottom formation.
This structure implies that, for now, a sharp breakdown into a sustained free-fall scenario appears less likely.
At present, DOGE is trading close to the middle band of its Bollinger Bands, hovering near a key psychological level that has defined recent price action.
The continued contraction in the bands points to building pressure, with a breakout likely to determine the next directional move.

Dogecoin price chart by TradingViewIf the squeeze resolves upward, DOGE could retest the upper band and potentially post a sharp directional move.
Fundamentally, strong trading volume that’s up 120% in the last 24 hours to $1.69 billion suggests buyer interest.
This, aligned with whale accumulation, indicates a structural floor just beneath the current price.
As long as Dogecoin avoids an extended breakdown below $0.08–$0.09, the $0.15 target continues to appear technically plausible.


Institutional investors aren’t just betting on ‘number go up’ strategy for crypto anymore, they are shifting to hunting for steady sources of income.
Many institutions already hold bitcoin and ether (ETH) on their balance sheets. While they are holding these assets for the long-term price appreciation, investors are increasingly seeking to put them to work to earn income while waiting, said Brett Tejpaul, Coinbase’s (COIN) head of institutional, in an interview with CoinDesk, noting that this is how the next phase of institutional money entering the digital asset sector will look.
“The second wave of institutions… is underway. It’s happening.”
That shift is shaping a new wave of products, he said. Coinbase last week launched a tokenized share class of its Bitcoin Yield Fund on Base in partnership with Apex Group, a $3.5 trillion fund services provider. The fund aims to generate yield through strategies such as selling call options or lending bitcoin, with target returns in the mid-single digits, depending on market conditions.
The push for yield is not limited to just crypto-native firms.
BlackRock, the world’s largest asset manager, has also moved in this direction. The firm recently launched the iShares Staked Ethereum Trust ETF (ETHB), giving investors exposure to rewards generated by helping secure the network. The product signals that demand for yield-bearing crypto strategies is spreading across traditional finance.
This is a similar strategy to what traditional investors call ‘structured products.’ These financial instruments include assets with options that are designed to deliver certain returns or yields. With many options and yield-generating strategies now available in the digital assets sector, traditional investors are seeking similar products in crypto, especially as lawmakers set clearer regulations for the sector.
Read more: Regulation, derivatives helping drive TradFi institutions into crypto
Moving money faster
This “second wave” of institutional money is also focusing on how to use blockchain technology for payments, settlements, cost and transparency.
The structure reflects a broader trend: tokenization. By putting fund shares onchain, asset managers can make ownership easier to track and transfer while opening the door to round-the-clock markets. For institutions used to waiting days for settlement, the appeal is practical.
He said almost half the conversations with institutions right now include stablecoins and tokenization, pointing to a surge in interest following recent regulatory movement in the U.S. Large financial firms are exploring how to use blockchain systems to move money faster and at lower cost, especially across borders.
That interest is gaining momentum as policymakers move to set clearer rules. The passage of the GENIUS Act has already provided a framework for stablecoins, while the proposed CLARITY Act is expected to further define how digital assets and tokenized products can be issued and traded. Together, they are giving institutions more confidence to commit capital and build products tied to blockchain-based systems.
The appeal is straightforward. Tokenization allows traditional assets such as bonds, funds, and private credit to be represented onchain, enabling faster movement and quicker settlement. Stablecoins, often pegged to fiat currencies, offer a way to move value globally at low cost without relying on legacy payment rails.
Some of the largest firms in traditional finance are already moving in this direction. BlackRock has launched a tokenized Treasury fund, while JPMorgan has tested tokenized deposits and blockchain-based payments. Franklin Templeton has also brought tokenized money market funds onchain, signaling growing comfort with the model among asset managers.
As a result, both traditional financial institutions and crypto-native firms are racing to build or integrate stablecoin infrastructure, seeing it as a foundation for the next phase of financial markets.
This is directly tied to what Tejpaul called the ‘second wave’ of institutional money entering crypto. The first wave of institutional money came from hedge funds, endowments and wealthy investors seeking exposure or arbitrage. But this next group looks different. It includes banks and payments firms building products on top of crypto rails.
That shift ties closely to yield. Stablecoins, often backed by short-term government debt, can produce income streams that resemble traditional cash management products. Tokenized funds extend that idea to a wider set of assets.
At the same time, institutions are paying closer attention to market structure. Around-the-clock trading and near-instant settlement are becoming part of the pitch, with the two largest stock exchanges in the U.S., the New York Stock Exchange and Nasdaq, soon bringing 24/7 trading to their clients. In traditional markets, trades can take days to settle, leaving capital tied up and exposed to counterparty risk.
Blockchain-based systems aim to reduce that friction, thereby increasing transparency and lowering costs.
“People want to know where their capital is at all times, and they don’t want it to be in transit or be lost in the settlement process,” Tejpaul said.
Still, adoption is uneven.
Most institutional capital remains concentrated in a small set of major tokens, with limited appetite for smaller assets after recent market volatility. And large firms tend to move slowly, often taking years to evaluate new technologies.
But the direction is becoming clearer. Institutions are no longer asking only how to buy crypto. They are asking what it can do for their portfolios and their businesses. And with more regulations coming to clear that path, it will likely open the door to more institutional money in the future.
“All of a sudden, all the dots are connecting… what was opaque is becoming clear,” Tejpaul said.
Crypto World
Seven Methods for Finding and Closing AI Services Clients When You’re Starting from Zero Followers and Zero Case Studies

Host a Local AI Meetup
Business owners feel curious about AI but overwhelmed. They distrust strangers offering solutions. When you host a community event, you’re automatically positioned as the local authority.
Find free venues: libraries, coworking spaces, coffee shops with meeting areas. Create a simple event page. Post in local business groups and LinkedIn. Keep the format straightforward: a 20-minute presentation on how local businesses currently leverage AI, followed by questions.
Critical element: demonstrate something live. Open your computer. Show a workflow executing. Display a lead arriving and receiving an automatic response. When people witness value operating in real-time, the conversation fundamentally shifts.
Collect email addresses. Follow up within 24 hours. That becomes your pipeline.
Direct Outreach to Local Markets
Traditional. Proven. Underutilized. Walk into 10 local businesses this week: dental offices, real estate brokerages, law firms, contracting companies. Or send 20 LinkedIn messages daily to business owners managing 10-50 employees in your geography.
Don’t lead with your solution. Begin with diagnosis: what’s the most expensive bottleneck in your daily operations? Start conversations about their specific problems, not your services. Those who respond are self-selecting—they already know something requires fixing.
Withhold pitches in initial outreach. Understand their situation completely. Propose solutions mapped directly to their stated problems. This approach converts 3-5x more consistently than leading with I build AI automations.
The Speed-to-Response Diagnosis
This technique is exceptionally effective for speed-to-lead sales. Select a niche. Use Google to identify local businesses. Find ones with website contact forms. Submit test inquiries. Track response time.
Most respond after hours. Many after days. Some never respond. You’ve collected data. Now email them: I submitted an inquiry through your website 3 days ago. Still waiting. How many leads do you estimate you’re losing? I build systems responding within 60 seconds, 24/7.
This isn’t a cold pitch. It’s a diagnosis. You identified and quantified a problem, then offered a solution. Completely different conversation.
Free Discovery Audits
You know business owners: colleagues, acquaintances, former coworkers, gym contacts. Offer complimentary 20-minute audits. I’ll review your current processes and identify automation opportunities. No charge—I’m building my portfolio.
Yes, you’re working for free initially. But you gain practical experience, they receive legitimate value, and they’ll recommend you. The audit itself becomes your sales conversation. By its conclusion, you understand their problems better than they do. The proposal writes itself.
After establishing case studies, start charging for audits. The audit becomes a paid service.
Partner with Service Providers
Other service providers already possess your target clients. Marketing agencies, business coaches, accountants, web developers—they consult with business owners constantly. Many get asked about AI and lack confidence answering.
Approach them: I specialize in AI automation for small businesses. When your clients ask about AI, I’d appreciate being your referral partner. Happy to split revenue on closed deals. You just built a sales team without employment. In tight-knit industries, one solid partnership generates sustained pipeline.
The best partnerships are with providers whose services complement AI but aren’t competitive. Web developers, accountants, and business coaches all have hungry clients who need automation.
Coworking Community Office Hours
Contact local coworking spaces. Volunteer to host free weekly AI Office Hours for members. Two hours weekly. Members arrive with questions. You provide solutions on the spot.
You gain credibility as the resident AI expert, access to warm prospects who already trust you, and content fodder—every question becomes potential social media material. Most spaces accept because it adds member value. Paying clients develop naturally.
The implicit positioning is powerful: you’re the person who knows AI in this community. When someone needs help, they think of you first.
Consistent Social Documentation
Document every client success. Built a lead response system for an HVAC contractor. 2 hours setup. Now responds to every lead within 60 seconds. Automated appointment reminders for a dental practice. Reduced no-shows 40%. Runs entirely on autopilot.
You don’t need massive following. You need consistency. Post 3-5 times weekly for 90 days. Mix wins with educational content. The objective isn’t virality. It’s staying top-of-mind so when someone needs AI implementation, they think of you first.
Post everywhere: LinkedIn, Twitter, even TikTok or YouTube if that fits your style. Different platforms reach different people. Consistency matters more than platform choice.
Building Your Personal Sequencing
Start with methods 2 and 4: direct outreach and free audits. These generate first clients fastest with zero infrastructure required. You can start today.
Once you have case studies, add method 3: the speed-to-response diagnosis. This is most effective once you have a success story to reference.
As you establish credibility, layer in methods 1, 5, and 6. These take more setup but generate steady referrals.
Use method 7 throughout. Social documentation works best when you have wins to document, but you can start immediately.

Key Takeaways
- Bitcoin briefly surged to $71,200 after President Trump announced a five-day pause on strikes against Iran, pulling it further from the critical $65,000 liquidation zone.
- Over $400 million in crypto positions were liquidated within hours as markets swung sharply on conflicting headlines between Washington and Tehran.
- With BTC now hovering around $70,000, the $3 billion in long positions clustered below $65,000 remains a live threat as geopolitical uncertainty persists.
Bitcoin caught a brief but significant boost on Monday after U.S. President Donald Trump announced a five-day pause on military strikes targeting Iran’s energy infrastructure, describing the move as the result of “very good and productive” talks aimed at a complete resolution of hostilities. The announcement sent Bitcoin surging from $67,500 to above $71,200 within hours, temporarily widening the distance between BTC’s price and a critical $65,000 liquidation zone.
The move followed a weekend of geopolitical threats and a subsequent de-escalation, with broader asset classes and benchmark indices reacting together. For Bitcoin bulls sitting on leveraged positions, the rally offered a moment of relief.
Relief, Then Reversal
The rally did not hold. Iran’s Foreign Ministry denied any communication had taken place with the United States, framing the five-day suspension as a retreat rather than diplomacy. Bitcoin, shown at $70,464 in one snapshot, retreated to levels seen in early February after multiple failed attempts to convincingly surpass $75,000. The $400 million in liquidations indicates positions were both sizable and tightly clustered around optimistic breakouts toward $75,000. Bitcoin settled back around $70,000, although still above $65,000, but not a comfortable price level. Investors also weighed the potential impact on other risk assets.
The $3 Billion Risk Remains
Before Monday’s geopolitical headlines, Coinglass data had already flagged a dangerous build-up of over $3 billion in long positions concentrated below the $65,000 level across Binance, OKX, and Bybit. That exposure has not disappeared. Bitcoin has traded between $70,533 and $64,700 since early February, forming a tight range. Heavy liquidation clusters remain around $70,500 on the upside and $65,000 on the downside.
Analysts describe such concentrations as “liquidation magnets,” that is, price levels where a large volume of forced closures can compound selling pressure once breached. The October 10 event, which saw $19 billion wiped from the crypto market in a single day, followed a near-identical pattern of heavy leveraged build-up before a key level broke.
What Comes Next
As traders watch whether Bitcoin can reclaim $70,000 and fill the CME gap, one open question persists: will current liquidity and geopolitical developments allow BTC to return to breakout attempts near $75,000, or has this episode reset expectations for a lower, more volatile trading band?
For now, the Trump ceasefire announcement has bought the market some breathing room. But with Iran denying any talks and a break above $70,000 still needed to signal renewed bullish momentum toward $75,000.
🚨 ALERT: Over $3 billion in long positions risk liquidation if $BTC drops below $65,000. pic.twitter.com/EaiPNwDt1E
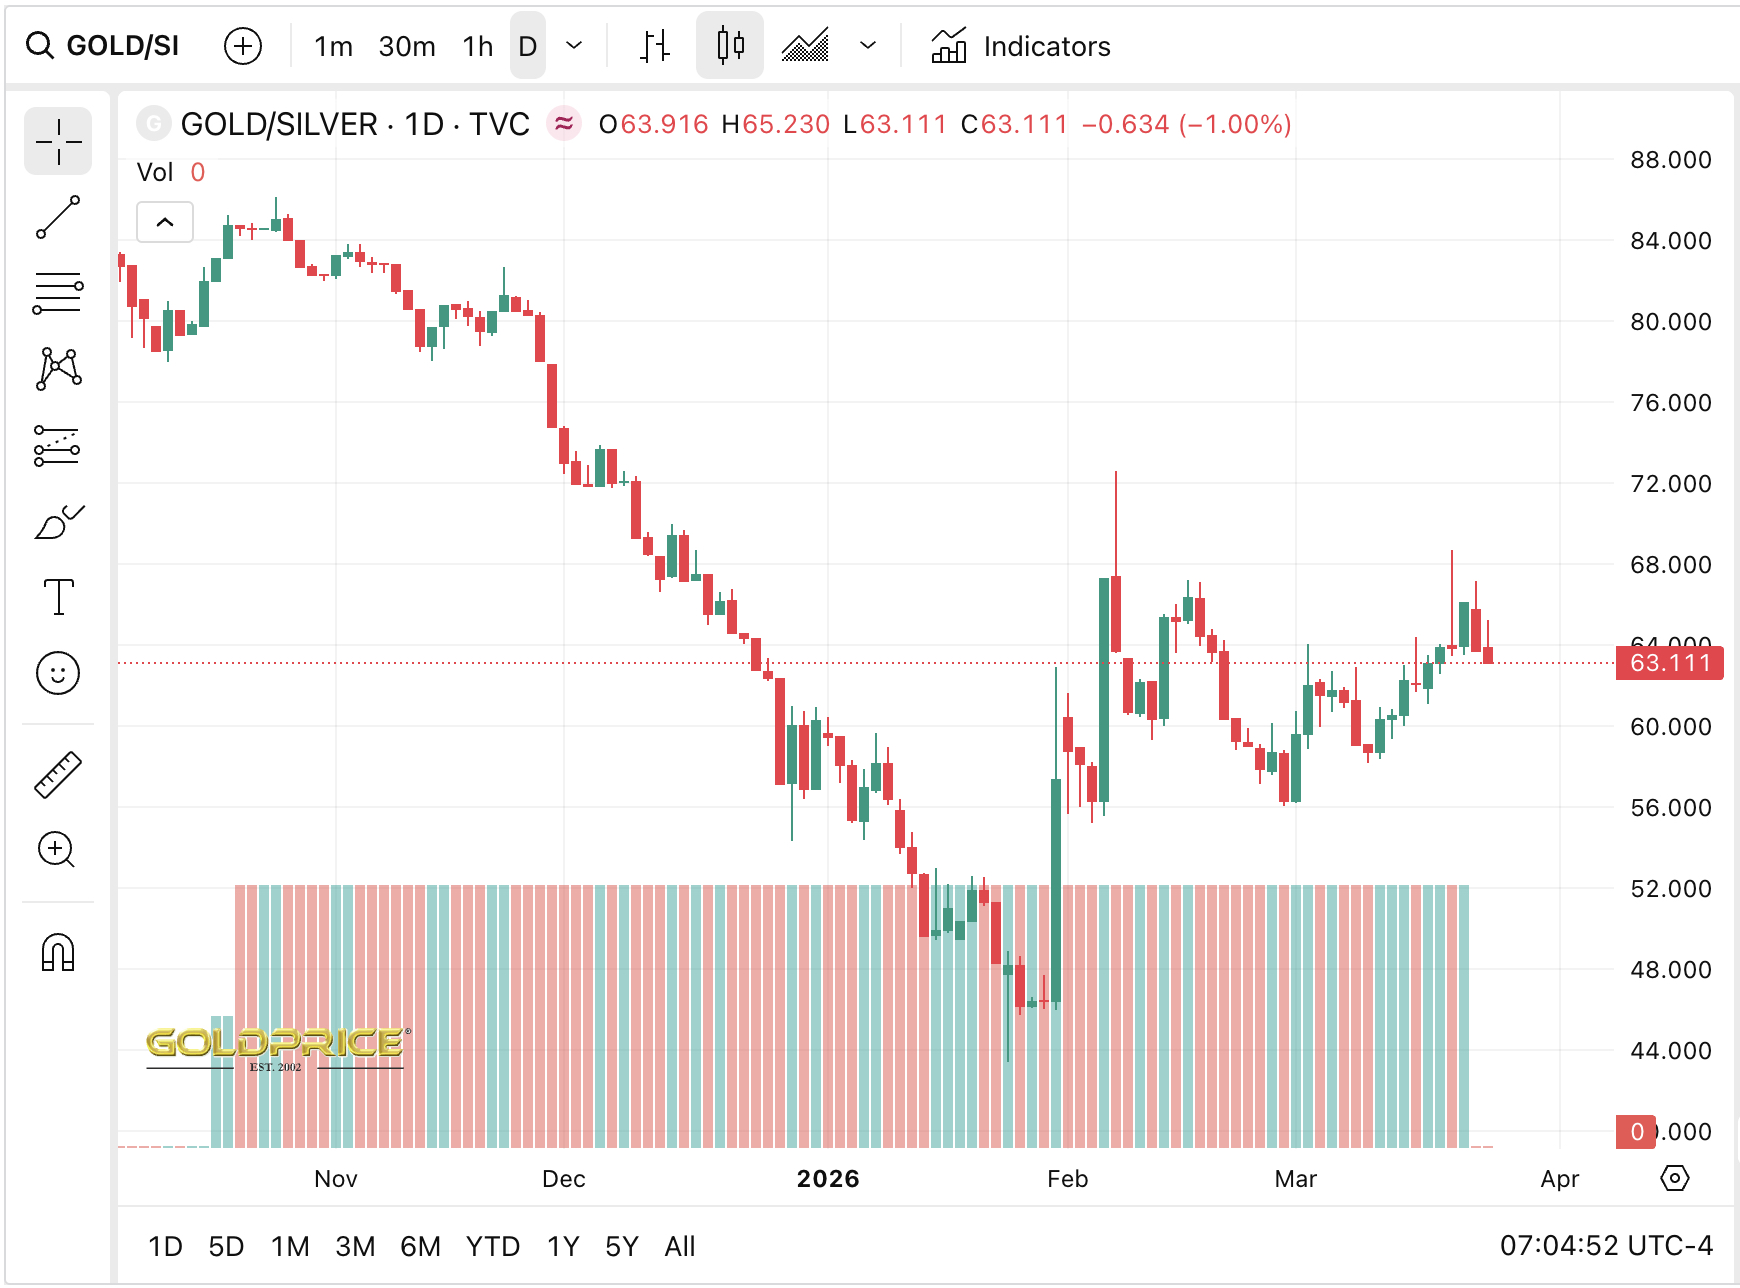
Silver price has retreated sharply in the last 48 hours, defying last week’s prediction and analysis of $200. While the metal had climbed 161% year-over-year from $33 area, recent sessions saw XAG/USD slump as real yields surged and the dollar strengthened, widening the gold-to-silver ratio toward a precarious 63:1.
This pullback comes despite supply constraints from imminent China export restrictions effective 2026, which many analysts expected to floor prices.

The market is currently wrestling with contradictory signals: safe-haven bids from geopolitical tensions versus industrial demand fears triggered by inflation. Is the structural deficit enough to hold the line? As silver price forecasts recalibrate for a “higher-for-longer” rate environment, traders are eyeing critical support levels that could define the trend through Q2.
Discover: The best pre-launch token sales
Silver Price Analysis: Can It Reclaim $100 Amid PPI Volatility?
As of today, prior to the PPI shock, silver traded at $69 level. The metal is currently falling but might be hitting a bottom at the same time, testing the patience of bulls who bought near the January peak above $120.
Crucial support lies here, and a break below this level could expose the widely watched $58 magnet, a psychological floor for institutional accumulation. Conversely, reclaiming the $90 resistance is essential to target.

Institutional outlooks remain divergent, creating a complex landscape for position traders. While J.P. Morgan forecasts a conservative 2026 average of $81/oz, others are eyeing significantly higher ceilings. Bank of America has set a target of $135/oz by 2026, and aggressive models from analysts like Rashad Hajiyev point toward targets as high as $240–$260.
The disparity suggests that while short-term downside risks persist, the long-term supply deficit remains a potent catalyst for commodities investors willing to weather the volatility.
Discover: The best pre-launch token sales
LiquidChain Targets Early Mover Upside as Silver Consolidates
While silver arguably offers a safe hedge against currency debasement, its recent heavy price action highlights the limitations of commodities in a high-yield environment.
Capital seeking aggressive multipliers is increasingly rotating out of stagnant traditional assets and into infrastructure plays that solve fragmentation issues in the crypto economy. Enter LiquidChain ($LIQUID), a Layer 3 protocol gaining traction by unifying liquidity across Bitcoin, Ethereum, and Solana.
LiquidChain distinguishes itself with a “deploy-once” architecture, fusing the three largest ecosystems into a single execution environment. This effectively eliminates the friction of cross-chain bridging—a multi-billion dollar headache for developers.
The project is currently in a presale phase that has raised more than $600K at the moment. Early participants are securing tokens at $0.0143, and enjoying more than 1700% APY of staking rewards.
For those tired of waiting for silver to break $100, LiquidChain represents a high-beta pivot into the plumbing of the next bull cycle.
The LiquidChain presale is open now for investors researching unified liquidity layers.
Disclaimer: This article is not financial advice. Cryptocurrency and commodities markets are highly volatile. Do your own research before investing.
The post Silver Price Analysis: XAG to XAU Ratio Drops as Metals Fall appeared first on Cryptonews.

Kooc Media Launches PR Services for Online Casino and Sportsbook Brands

Taylor Frankie Paul Slams Resurfaced Assault, Says Kid Has To ‘Relive’ Pain
Wings Over Scotland | Let’s Call The Whole Thing Off


-
 Crypto World4 days ago
NIO (NIO) Stock Plunges 6.5% as Shelf Registration Sparks Dilution Worries
-

 Fashion4 days ago
Weekend Open Thread: Adidas – Corporette.com
-

 Politics4 days ago
Jenni Murray, Long-Serving Woman’s Hour Presenter, Dies Aged 75
-
 Tech7 days ago
Are Split Spacebars the Next Big Gaming Keyboard Trend?
-

 Crypto World3 days ago
Best Crypto to Buy Now: Strategy Just Spent $1.57 Billion on Bitcoin During Fear While Early Investors Quietly Enter Pepeto for 150x Potential
-

 News Videos6 days ago
RBA board divided on rate cut, unusually buoyant share market | Finance Report | ABC NEWS
-

 Crypto World3 days ago
Bitcoin Price News: Bhutan Sells $72 Million in BTC Under Fiscal Pressure, but the Smart Money Entering Pepeto Sees What the Market Does Not
-

 Politics6 days ago
The House | The new register to protect children from their abusers shows Parliament at its best
-

 Tech4 days ago
inKONBINI Lets You Spend Summer Days Behind the Register
-
 Politics7 days ago
Real-time pollution monitoring calls after boy nearly dies
-

 Crypto World6 days ago
Canada’s FINTRAC revokes registrations of 23 crypto MSBs in AML crackdown
-

 Sports1 day ago
Remo Stars and Kano Pillars Strengthen Survival Hopes in NPFL
-
 NewsBeat6 days ago
Residents in North Lanarkshire reminded to register to vote in Scottish Parliament Election
-

 News Videos6 days ago
PARLIAMENT OF MALAWI – PAC MEETING WITH REGISTRAR OF FINANCIAL ON AMARYLLIS HOTEL – INQUIRY LIVE
-

 Politics5 days ago
Gender equality discussions at UN face pushbacks and US resistance
-

 Business2 days ago
No Winner in March 21 Drawing as Prize Rolls to $133 Million for Next
-

 Business6 days ago
Who Was Alex Pretti? 5 Key Facts About the ICU Nurse Killed by Federal Agents in Minneapolis
-

 Sports1 day ago
Gary Kirsten Accuses Pakistan Cricket Board Of ‘Interference’, Mohsin Naqvi Responds
-

 Tech2 days ago
Give Your Phone a Huge (and Free) Upgrade by Switching to Another Keyboard
-

 Sports4 days ago
2026 Kentucky Derby horses, odds, futures, preview, date: Expert who nailed 12 Derby-Oaks Doubles enters picks
You must be logged in to post a comment Login