
Crypto World
NFT Sales Slide 38% as Crypto Market Weakness Deepens
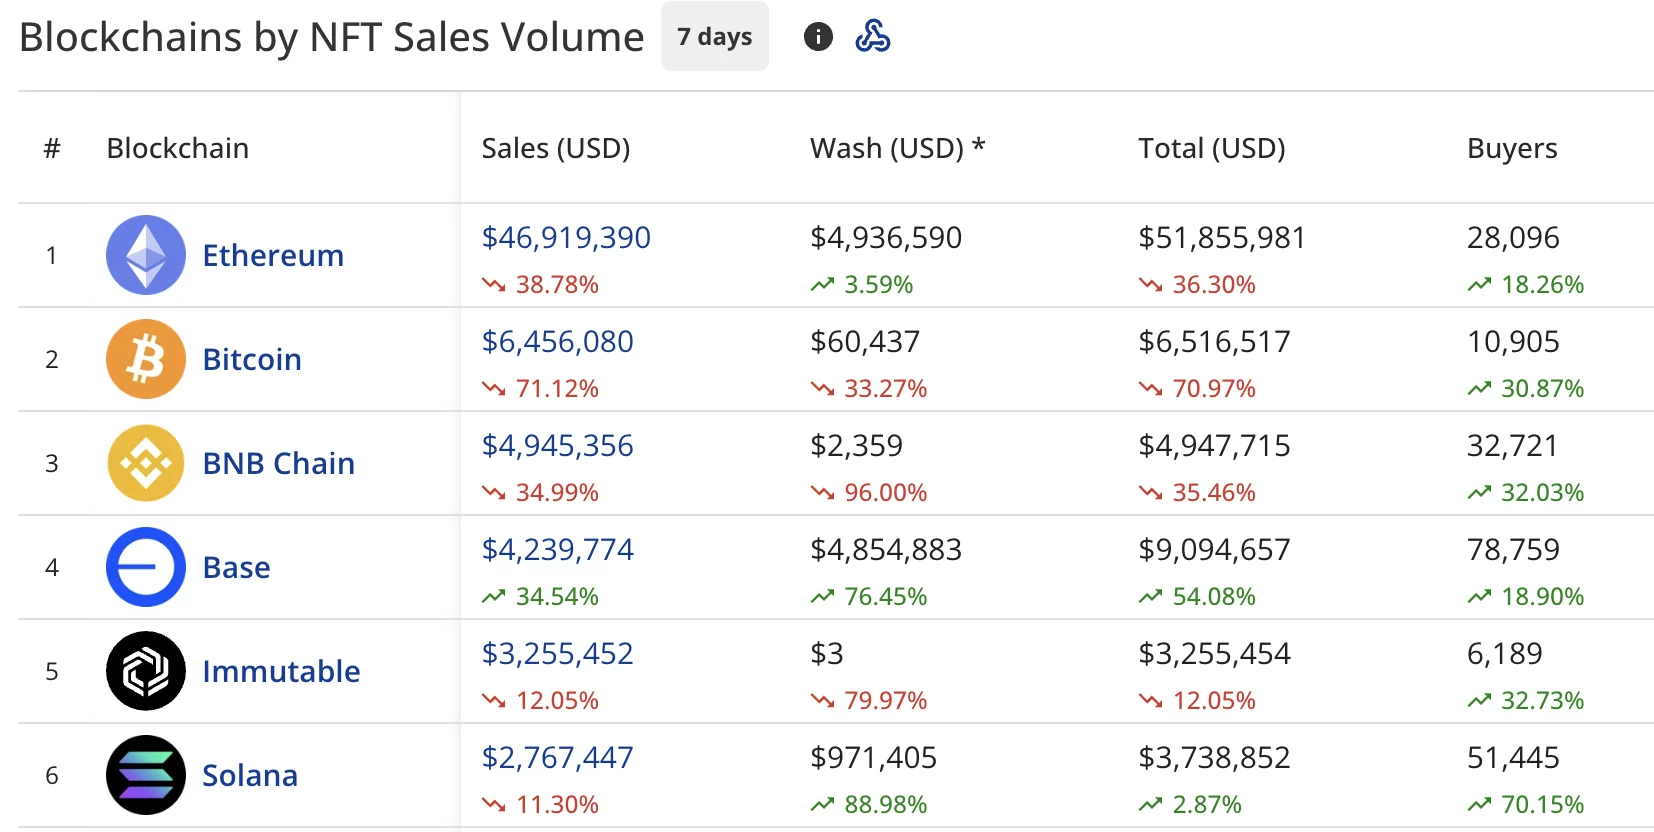
The NFT market recorded $74.88 million in sales volume over the past week, plunging 38.25% from the previous period.
Summary
- NFT weekly sales plunged 38% to $74.88M even as market participation rose.
- Ethereum led NFTs with $46.9M in sales despite a sharp weekly decline.
- Bitcoin NFTs collapsed 71% as broader crypto prices slid lower.
NFT buyers climbed 29.75% to 242,824, while sellers jumped 32.02% to 217,181. Transaction volume increased 8.29% to 726,723.
At the same time, Bitcoin (BTC) has plummeted to the $83,000 level, while Ethereum (ETH) has fallen below the $2,700 mark. The global crypto market cap now stands at $2.83 trillion, down from last week’s $3.02 trillion.
Ethereum maintains lead despite 38% decline
Ethereum continued to dominate all blockchains with $46.92 million in NFT sales, falling 38.78% over the seven-day period.
The network drew 28,096 buyers, up 18.26% from the prior week. Wash trading on Ethereum totaled $4.94 million during this timeframe.

Bitcoin suffered the steepest drop among major blockchains, securing second place with $6.46 million in sales, collapsing 71.12% week-over-week. The network attracted 10,905 buyers, up 30.87% despite the sales decline.
BNB Chain (BNB) ranked third with $4.95 million in sales, declining 34.99% while drawing 32,721 buyers who increased by 32.03%.
Base claimed fourth position at $4.24 million in sales, climbing 34.54% and attracting 78,759 buyers who rose 18.90%.
Immutable (IMX) dropped to fifth with $3.26 million in sales, down 12.05%, while Solana (SOL) rounded out the top six with $2.77 million, falling 11.30% compared to the previous week.
Flying Tulip PUT retains top spot
Flying Tulip PUT on Ethereum maintained its dominance in the collection rankings with $22.39 million in sales, dropping 56.59% from last week’s performance.
The collection processed 898 transactions from 432 buyers, while sellers surged 292.31% to 51.
Moonbirds on Ethereum claimed second place with $3.89 million in sales, exploding 108.91% over the week.

The collection completed 1,737 transactions, up 538.60%, from 412 buyers who increased 219.38%.
Pudgy Penguins took third position with $2.28 million in sales, climbing 23.11%. Meld Bank Manager v on Cardano landed in fourth with $2.01 million from a single transaction.
Guild of Guardians Heroes posted $1.93 million in sales, down 16.21%, while CryptoPunks rounded out the top six with $1.91 million, plummeting 52.35% after last week’s 46.74% recovery.
Cardano NFT leads high-value sales
The week’s highest-value sale came from Meld Bank Manager v on Cardano, fetching $2.01 million (5,907,801.2774 ADA) five days ago in a single transaction that accounted for the collection’s entire weekly volume.
- A $X@AI BRC-20 NFT on Bitcoin followed with $1.36 million (15.3783 BTC) six days ago.
- Known Origin #88517 sold for $199,771 (69 ETH) five days ago.
CryptoPunks claimed two spots in the top five individual sales.
- CryptoPunks #8804 sold for $186,431 (63 ETH) six days ago.
- CryptoPunks #5405 brought in $185,602 (63.99 ETH) four days ago.


Disclosure: This article does not represent investment advice. The content and materials featured on this page are for educational purposes only.
AI trading apps reshape investing in 2026 as beginners adopt automated stock and crypto strategies.
Summary
- AI trading apps surge in 2026, helping beginners automate stock and crypto strategies for passive income
- MoneyFlare leads with fully automated AI trading across stocks and crypto, requiring no manual setup
- Platforms like Pionex and 3Commas offer flexible AI tools as demand for hands-free trading grows
In 2026, the world of investing is being transformed by artificial intelligence (AI). Whether someone is looking to trade stocks or cryptocurrencies, AI-powered trading apps have made it easier than ever for beginners to get started with automated trading.
These platforms are designed to eliminate the complexity of traditional trading, offering hands-off solutions that allow users to generate passive income with minimal effort. For those who are beginners and are looking to dive into AI trading, this guide is an introduction to the top 8 AI stock and crypto trading apps for 2026.
1. MoneyFlare – Best fully automated AI Trading system for stocks and crypto
Overview:
MoneyFlare stands out as the top choice for beginners looking for a truly automated trading experience. This platform uses AI-driven quantitative strategies to handle both stock and cryptocurrency trading, eliminating the need for manual intervention.
Key Features:
- Fully managed AI quant trading system for both stocks and cryptocurrencies
- No setup required, pre-built strategies
- Works seamlessly across both asset classes
- Continuous optimization of strategies without user management
Why choose it:
Perfect for those who want a completely hands-off trading experience, MoneyFlare operates 24/7, ensuring that users don’t need to monitor the market actively, whether in stocks or crypto.
Click to visit and register to receive a free $10 real reward and a $50 trial credit!
2. Pionex – Best for no-code crypto trading automation
Overview:
Pionex is a crypto trading app that offers AI-powered automation without the need for APIs. Pionex integrates its trading bots directly into its exchange, making it simpler for beginners to start trading cryptocurrencies.
Key Features:
- Built-in trading bots (16+ options)
- No API integration required
- Automatic grid trading and DCA
- User-friendly interface
Why choose it:
With Pionex, there is no need for technical knowledge to use the bots, making it an ideal choice for crypto newbies looking to automate their trading.
3. TradeSanta – Best for entry-level crypto trading automation
Overview:
TradeSanta is an AI trading platform designed for beginners who want to automate their crypto trading with minimal complexity. It provides a straightforward setup and allows users to get started quickly with cryptocurrency trading.
Key Features:
- 24/7 automated trading for crypto
- Smart trading terminal with customizable settings
- Cloud-based platform for easy access
- Affordable pricing and demo options
Why choose it:
TradeSanta is great for entry-level users, offering an intuitive interface and access to both grid and DCA bots without the need for complex configuration, making it perfect for crypto beginners.
4. 3Commas – Best for flexible stock & crypto trading strategies
Overview:
For those who want a little more control over their strategies while still benefiting from automation, 3Commas provides a flexible AI platform. Users can fine-tune their strategies while letting the AI handle execution, whether for stocks or cryptocurrencies.
Key Features:
- SmartTrade terminal with advanced features
- Customizable trading strategies for both stocks and crypto
- Multiple integrations with popular exchanges
- Backtesting for strategy optimization
Why choose it:
3Commas is a versatile choice for beginners who want to move beyond basic bots and explore more tailored trading approaches in both stock and crypto markets.
5. Cryptohopper – Best for copy trading in crypto and stocks
Overview:
Cryptohopper is a top-rated platform for beginners interested in copy trading. With its marketplace of pre-built strategies, even beginners can follow successful traders’ strategies without needing to know the intricacies of trading in either stocks or cryptocurrencies.
Key Features:
- Copy trading and marketplace for stocks and crypto
- AI-powered optimization of strategies
- Supports stocks and cryptocurrencies
- Mobile-friendly interface for on-the-go trading
Why choose it:
Cryptohopper allows beginners to harness the expertise of professional traders, making it an easy entry point into AI trading for those who prefer to follow established strategies in both asset classes.
6. Coinrule – Best for no-code strategy building in crypto
Overview:
Coinrule offers an intuitive, no-code interface for building personalized trading strategies. It’s great for beginners who want to customize their approach to cryptocurrency trading without needing to learn how to code.
Key Features:
- No-code strategy builder for crypto trading
- Pre-built templates for easy setup
- Automatic execution of strategies
- Supports a wide range of exchanges
Why choose it:
Coinrule is a fantastic option for beginners who want to experiment with their own strategies without needing technical expertise in crypto trading. Its ease of use makes it ideal for users who prefer a DIY approach.
7. HaasOnline – Best for advanced automation in stocks and crypto
Overview:
HaasOnline is a powerful platform that caters to beginners and experienced traders alike, offering advanced automation features without requiring technical expertise. Its AI-powered system enables users to set up automated trading strategies for both stocks and cryptocurrencies.
Key Features:
- Advanced technical analysis tools
- AI-powered trading strategies for both asset classes
- Customizable bots for stocks and crypto
- Supports a wide range of exchanges
Why Choose It:
HaasOnline is ideal for those who want both simplicity and powerful trading features. It’s great for beginners who want to explore advanced automation without a steep learning curve in both stocks and crypto markets.
8. Botcrypto – Best for simple crypto trading automation
Overview:
Botcrypto is a beginner-friendly AI trading app designed for those looking to automate their cryptocurrency trading with minimal setup. It’s perfect for those who want a straightforward approach to crypto trading.
Key Features:
- Drag-and-drop interface for strategy creation
- Integration with multiple crypto exchanges
- Cloud-based for easy access
- Pre-set strategies available
Why choose it:
Botcrypto offers an easy way to get started in crypto trading with automated strategies. Its drag-and-drop feature makes it one of the simplest platforms for beginners to use, especially for crypto.
Conclusion
As AI continues to reshape the financial landscape, these 8 AI stock and crypto trading apps are at the forefront of helping beginners get started with automated trading. Whether someone is looking to trade stocks or cryptocurrencies, these platforms offer user-friendly interfaces, AI-driven automation, and risk management features that make it easier to generate passive income.
For beginners in 2026, there’s no better time to take advantage of AI-powered trading tools. Start with platforms like MoneyFlare or Pionex for a completely hands-off experience in stocks and crypto, or explore more customizable options like 3Commas or Coinrule to fine-tune trading strategies.
Whichever platform someone chooses, make sure to start with small investments, understand the risks involved, and adjust their strategies as needed to maximize profits. Happy trading!
Disclosure: This content is provided by a third party. Neither crypto.news nor the author of this article endorses any product mentioned on this page. Users should conduct their own research before taking any action related to the company.
MEXC appointed Vugar Usi as CEO on Wednesday, elevating the executive as the exchange steps up its push for global licensing, including under the European Union’s Markets in Crypto-Assets Regulation (MiCA) framework.
MEXC said Usi joined the company as chief operating officer in late 2025 after previously serving in the same position at rival exchange Bitget.
In his new role, Usi said MEXC plans to preserve its low-fee trading focus while expanding broader multi-asset access on the platform.
The CEO told Cointelegraph that MEXC is actively pursuing licensing opportunities globally, including a MiCA license in the EU.
MEXC’s changes come alongside a broader brand update, highlighting an industry-wide shift toward “everything exchange” models amid growing competition from decentralized rivals.
MiCA license a “top strategic priority”
Operating across multiple regions worldwide, MEXC “consistently maintains a close watch” on the global regulatory landscape, Usi told Cointelegraph.
“The MiCA license application is a top strategic priority for the company,” he said, adding that the company is engaged in proactive preparations to establish a fully compliant business entity within the EU.

MEXC did not provide additional details on its MiCA licensing plans. The company is currently labeled non-compliant by European regulators after Dutch authorities flagged the platform in September 2025 for providing crypto services in the Netherlands without holding the required license.
Related: Centralizing crypto: Why Malta’s clash with ESMA is about more than one small state
Some major exchanges are still working through Europe’s MiCA process, showing how competitive and politically sensitive the licensing race has become. Binance, the world’s largest exchange by reported volume, applied for a MiCA license in Greece in January.
MEXC posts rapid growth in crypto market
Founded in April 2018, MEXC has emerged as one of the fastest-growing CEXs globally, with reported daily trading volumes of around $2.2 billion, according to CoinGecko.
Crypto analytics platform CryptoQuant named MEXC as one of the top three exchanges in its Exchange Leader Index alongside Binance and Gate, with the exchange also ranking among those with the strongest growth alongside Gate and Coinbase.
Related: Binance led Q1 crypto derivatives as Hyperliquid cracked top 10: CoinGlass
The company has scored major partnerships, including an auditing collaboration with the blockchain security platform Hacken. MEXC also closely collaborated with The Open Network (TON), which secured funding from its venture arm, MEXC Ventures, in late 2023.
Magazine: AI agents will kill the web as we know it: Animoca’s Yat Siu
Crypto World
BeInCrypto Institutional 100 Awards Nomination: Fireblocks for Best Digital Asset Custody Provider

The digital asset market has officially outgrown its era of speculation. The real story of 2026 isn’t about price swings; it’s about the quiet, massive re-engineering of global finance happening behind the scenes. At the heart of this shift is Fireblocks.
While others focused on the hype, Fireblocks focused on the plumbing, creating the secure, high-velocity rails that now allow the world’s largest institutions to move value at the speed of the internet.
Fireblocks is the infrastructure layer behind many of the largest names in digital finance. Its MPC-based custody technology powers wallets and transactions for Robinhood, Revolut, Wintermute, Bybit, BtcTurk, BNY Mellon, BNP Paribas, Galaxy, Bakkt, FalconX, among others. While its NYDFS-chartered Trust Company, granted in August 2024, now provides direct qualified custody for institutional clients.
In July 2025, the platform routed an estimated 15-20% of all global on-chain stablecoin volume through its Network for Payments product alone (Fortune, Sep 2025; denominator via Dune Analytics). [BIC Verified]
Fireblocks submitted a formal memo to the SEC Crypto Task Force in February 2025 and was invited as a panelist alongside Fidelity, Anchorage, and Kraken at the SEC’s custody roundtable.
Enter the BeInCrypto Institutional 100 Awards.
On-chain forensics from Arkham Intelligence identify 59 entities and 999+ addresses tied to its infrastructure; a fraction of its reported client base. 26 SEC filings in 2026 year-to-date reference the company by name.
Beyond Storage: The Case for Fireblocks
Fireblocks is nominated for Best Digital Asset Custody Provider because they have successfully bridged the gap between “Bank-Grade Security” and “Fintech Speed.” During an exclusive interview with BeInCrypto’s Global Head of News, Brian McGleenon, Varun Paul, Senior Director for Financial Markets at Fireblocks, outlined how the company is moving beyond mere storage to facilitate the massive movement of institutional value.
Discussing the shifting demands of the industry, Paul noted to McGleenon that the challenge of custody has evolved from simple protection to complex, high-velocity scalability:
“Security is the first requirement… but it goes beyond that. It’s about the integrations, the connectivity, and the scalability because the market is growing so rapidly that we now need to be prepared for a financial system on these rails.”
In 2025 alone, Fireblocks processed $5 trillion in transactions, with nearly half of that volume in stablecoins, a metric that underscores their role as the primary engine for global value transfer. Their defense-in-depth approach provides the “governance and security upfront” that has allowed institutions to scale securely into the digital asset space.
Looking toward an agentic future, Paul emphasized to McGleenon that Fireblocks is already building the necessary guardrails. While AI agents and programmable ledgers are set to drive the next wave of institutional adoption, they require a sophisticated governance layer to prevent risk. As Paul explained: “
You need the smart contracts to be able to work between these blockchains… Interoperability becomes critically important.”
By providing the connectivity that prevents “fragmented islands” of liquidity, Fireblocks is ensuring that by 2030, the $30 trillion in projected tokenized assets will have a secure, high-velocity home. Through their collaboration with institutions and their commitment to building the rails of the future, Fireblocks is not just participating in the market, they are defining the next decade of finance.
The post BeInCrypto Institutional 100 Awards Nomination: Fireblocks for Best Digital Asset Custody Provider appeared first on BeInCrypto.


Stabble, a decentralized crypto exchange on Solana, shed 62% of its total value locked in a single trading session Tuesday after the protocol’s new management team issued an emergency withdrawal notice – cutting TVL from approximately $1.75 million to less than $663,000 within hours, according to DeFiLlama data.
The drawdown was protocol-directed rather than attacker-driven, making it an unusual but measurable risk event in its own right.
The triggering condition: on-chain investigator ZachXBT identified an alleged North Korean operative, working under the name Keisuke Watanabe, as Stabble’s former chief technology officer – a role the individual reportedly held through 2025.
The new management team, which assumed control of the protocol approximately four weeks prior, posted an unambiguous alert to X at 9:34 a.m. ET, roughly seven hours after ZachXBT’s identification surfaced publicly.
- Stabble’s TVL collapsed 62% – from $1.75 million to under $663,000 – within hours of the emergency alert on April 7, 2026.
- On-chain investigator ZachXBT identified Stabble’s former CTO, operating under the name Keisuke Watanabe, as an alleged North Korean operative.
- No exploit or fund breach has been confirmed; the new Stabble team is conducting audits while urging full liquidity withdrawal as a precautionary measure.
- The alert follows a pattern of DPRK-linked IT worker infiltration documented across the DeFi sector for at least seven years.
Explore: The best pre-launch token sales with asymmetric upside potential
Former CTO Flagged as DPRK Operative – What the Architecture Exposure Actually Means
The structural risk in this scenario is not a live exploit – it is the possibility of dormant backdoors, compromised key management infrastructure, or embedded logic in smart contracts written or audited by a state-linked actor with undisclosed access.
A former CTO would have had direct write access to core protocol code, administrative keys during the development phase, and visibility into the full contract architecture.
Stabble’s new team has not disclosed whether smart contract upgradability mechanisms were in place, nor whether the former CTO retained any multi-sig signing authority post-transition.
Those details are material: upgradeable proxy contracts controlled even partially by a compromised key represent an active vector, not a historical one. The team confirmed it is conducting audits to assess the full scope of the exposure.
The developer also reportedly worked on Elemental, a related Solana DeFi project – a detail that extends the potential attack surface beyond Stabble’s own liquidity pools and into connected protocol infrastructure. No exploit has been disclosed on either platform as of publication.
This infiltration model – DPRK-linked IT workers securing developer roles at crypto firms under false identities – represents a documented operational pattern spanning at least seven years, with increasing operational sophistication in targeting DeFi protocols specifically.
The Solana ecosystem has faced sustained pressure from state-linked actors, and the pace of confirmed incidents is accelerating through early 2026.
New Stabble Crypto Team Issues Emergency Alert
The Stabble team’s public response was direct and unambiguous. Posted to X, the alert read: “EMERGENCY! Guys, please temporarily withdraw your liquidity instantly! Better safe than sorry.”
The statement carries operational weight precisely because it came from the new management – quants and early DeFi participants by their own description, not communications professionals managing narrative.
A follow-up post clarified the team’s posture: “We received a message and are acting on it, our primary focus is the safety of our LPs. We’re not PR people, we’re quants and early DeFi degens. We hear you, and your feedback matters.”
The messaging prioritized LP capital protection over protocol optics – a defensible position given the confirmed identity of the former CTO.
The seven-hour gap between ZachXBT’s public identification and the official emergency alert suggests the team spent that time assessing internal exposure before going public. Whether that assessment produced actionable findings has not been disclosed.
Discover: The Best Crypto Presales Live Right Now
The post Stabble Crypto Urges Liquidity Withdrawal After North Korean Hacker Scare appeared first on Cryptonews.


Key takeaways
- HYPE is up 10% in the last 24 hours, outperforming the other major cryptocurrencies.
- The coin could surge towards the $50 psychological level in the near term.
Hyperliquid (HYPE) nears $40 as US-Iran ceasefire boosts market sentiment
HYPE, the native coin of the Hyperliquid DEX, is approaching the $40 mark on Wednesday, extending its recovery linked to the US-Iran ceasefire.
Retail demand for HYPE continues to rise, driving increased futures Open Interest amid a broader market rally. Technically, HYPE has broken out of a falling channel pattern on the 4-hour chart, signaling a bullish near-term outlook.
Throughout the US-Iran conflict, Hyperliquid showed resilience, with its 24/7 trading platform for crude oil and other commodities gaining traction during the crisis. The ongoing recovery in the crypto market, driven by the ceasefire, has increased anticipation for HYPE’s recovery.
According to CoinGlass data, HYPE futures Open Interest (OI) reached $1.64 billion on Wednesday, marking a 9% increase in the last 24 hours. Typically, such an OI expansion during a spot market rally signals growing demand entering the leverage market.
Liquidations in the last 24 hours totaled $4.49 million, led by $4.28 million in short liquidations, indicating a sell-side weakness. Additionally, the OI-weighted funding rate remains positive at 0.0082%, showing sustained bullish sentiment among traders.
Will HYPE rally towards the $50 mark?
The HYPE/USD 4-hour chart is bullish and efficient as Hyperliquid is the best performer among the leading cryptocurrencies.
HYPE is trading above the 50- and 200-period Exponential Moving Averages (EMAs) on the 4-hour chart, reflecting a potential trend reversal.
At the time of writing, HYPE trades around $39.00, extending the breakout gains of a falling channel pattern.
The Moving Average Convergence Divergence (MACD) line is above its signal and the zero line, suggesting strengthening upside momentum.

The Relative Strength Index (RSI) at 66 remains below overbought territory, suggesting firm buying pressure without clear exhaustion at this stage.
If the rally persists, HYPE would likely surge towards the first major resistance level at $43. A daily candle close above this level would pave the way for further rally towards the $50 psychological zone.
However, if the market reverses, HYPE could test the 200-period EMA at $37.10. A drop below this support zone would nullify the bullish breakout and deepen the downside risk.

TLDR
- President Trump announced on Truth Social that nations providing military equipment to Iran will face immediate 50% tariffs on all exports to America.
- The declaration followed shortly after Washington and Tehran reached a two-week ceasefire agreement, including Iran’s temporary reopening of the Strait of Hormuz.
- Constitutional scholars are questioning the president’s legal authority to enact such tariffs following a Supreme Court decision in February that eliminated his primary enforcement mechanism.
- Beijing emerges as the principal target, given its supply of drones and military-capable components to Iran, complicating an upcoming Trump-Xi meeting scheduled for next month.
- Both Iranian and Israeli officials have accepted the ceasefire terms, with Tehran presenting a comprehensive 10-point framework to guide future diplomatic discussions.
President Donald Trump issued a warning on Wednesday that any nation providing military armaments to Iran would face a 50% tariff penalty on all goods exported to the United States.
The president issued his statement via Truth Social, declaring: “A Country supplying Military Weapons to Iran will be immediately tariffed, on any and all goods sold to the United States of America, 50%, effective immediately. There will be no exclusions or exemptions!”
This announcement arrived mere hours following the conclusion of a two-week ceasefire arrangement between Washington and Tehran. The diplomatic breakthrough occurred just before Trump’s previously established deadline for military escalation.
Under the ceasefire terms, Iranian officials consented to temporarily lifting their blockade of the Strait of Hormuz, a critical waterway for international petroleum shipments. The White House verified that Israeli authorities also endorsed the agreement.
Tehran submitted a comprehensive 10-point diplomatic proposal that now serves as the foundation for continued bilateral discussions.
Celebrating the diplomatic achievement on Truth Social, Trump proclaimed it “a big day for World Peace!”
Questions Over Legal Authority
Despite the forceful rhetoric, legal analysts remain uncertain whether Trump possesses the constitutional authority to implement such sweeping tariff measures.
This past February, the Supreme Court struck down the president’s primary enforcement mechanism — an emergency statute from 1977 — which had previously enabled him to impose tariffs rapidly without extensive justification.
The remaining tariff instruments available to Trump demand more precise legal justification and comprehensive investigations before implementation. The White House has declined to clarify which statutory authority the administration intends to invoke.
Among Trump’s available options is Section 338 of the Tariff Act of 1930, which permits tariffs reaching 50%. Nevertheless, this statute was crafted to counter discriminatory foreign trade barriers against American products, not weapons transactions with third-party nations.
The president’s most legally defensible tariff approach — grounded in comprehensive investigations into unfair commercial practices spanning multiple nations — remains under development and is not yet operational.
China in the Crosshairs
Beijing stands as the primary target of this tariff warning. The Chinese government provides Iran with unmanned aerial vehicles, replacement components, and various dual-purpose materials that Tehran converts for military applications.
Reuters revealed last month that Iranian officials were nearing completion of negotiations to acquire Chinese-manufactured anti-ship cruise missiles.
Trump retains access to a China-focused trade investigation from his initial presidential term, which could theoretically justify targeted tariffs against Beijing.
Nevertheless, any decision to penalize China for its Iranian commerce could strain relations before the scheduled summit between Trump and Chinese President Xi Jinping in Beijing next month.
The Chinese diplomatic mission in Washington has not provided commentary on the matter.
Previously in February, Washington had imposed sanctions on over 30 individuals, organizations, and maritime vessels linked to Iran’s petroleum exports and weapons manufacturing operations.
Those enforcement actions were structured to compel international businesses to select between maintaining Iranian partnerships or preserving their access to American markets.

Key Highlights
- Major Swiss financial institutions create joint testing environment for CHF stablecoin
- Pilot program focuses on enhanced payment efficiency and reduced transaction costs
- Controlled testing environment enables secure simulation of blockchain transactions
- Banks examine programmable currency capabilities for automated financial operations
- Initiative positions Switzerland in competitive global digital currency landscape
A consortium of six prominent Swiss banking institutions has initiated a collaborative CHF Stablecoin testing program scheduled for implementation in 2026. This strategic partnership establishes a regulated digital framework where participating banks can evaluate blockchain-powered payment mechanisms. The development represents a systematic approach to incorporating tokenized currency into Switzerland’s established financial infrastructure.
Banking Consortium Establishes CHF Stablecoin Testing Platform
The collaboration includes UBS, PostFinance, Sygnum, Raiffeisen, Zürcher Kantonalbank, and BCV, working alongside Swiss Stablecoin AG. Their collective objective centers on evaluating the CHF Stablecoin through a protected sandbox framework. This configuration provides a controlled space for testing blockchain payment systems.
The testing platform permits financial institutions to conduct realistic payment simulations utilizing the CHF Stablecoin within established parameters. These boundaries ensure risk mitigation while preserving authentic transaction scenarios. Banks can analyze performance enhancements without compromising existing market infrastructure.
The consortium maintains an open invitation for other Swiss banks and financial entities to participate. This collaborative framework promotes comprehensive ecosystem growth for the CHF Stablecoin initiative. The inclusive model facilitates knowledge sharing and collective technical advancement.
Evaluating Payment Applications and System Performance
The partnership emphasizes real-world payment scenarios for the CHF Stablecoin throughout financial service operations. Target areas include accelerated settlement processes, decreased operational expenses, and enhanced transaction visibility. The program seeks quantifiable performance improvements in digital payment infrastructure.
The consortium will additionally examine smart contract functionality associated with the CHF Stablecoin. These capabilities allow for automated financial workflows through predetermined conditions executed on blockchain platforms. Banks can investigate innovative service offerings leveraging tokenized financial instruments.
Swiss Stablecoin AG delivers the underlying technology platform for CHF Stablecoin issuance and administration. The infrastructure connects with established banking systems via application programming interfaces. This integration strategy minimizes operational disruption and preserves existing customer interactions.
International Landscape and Strategic Positioning
Switzerland presently operates without a mainstream regulated CHF Stablecoin despite its sophisticated financial ecosystem. This absence has motivated prominent banking institutions to investigate blockchain-based monetary instruments. The testing initiative evaluates preparedness for potential commercial deployment.
The program aligns with international movements toward developing sovereign currency-backed digital assets. Financial institutions across Europe have backed ventures like Qivalis targeting digital euro alternatives. The Swiss collaborative effort establishes the CHF Stablecoin within this competitive international environment.
Stablecoins persistently transform financial ecosystems by facilitating accelerated and more efficient digital value transfer. The Swiss testing program aims to balance technological advancement with regulatory adherence and operational reliability. The CHF Stablecoin sandbox will generate essential data to inform subsequent deployment strategies.
The evaluation phase extends throughout 2026, enabling participating institutions to compile comprehensive operational intelligence. These results will determine viability for full-scale CHF Stablecoin market introduction. The project constitutes a methodical progression toward embedding digital currency within Switzerland’s banking framework.


Pharos Network, a layer 1 blockchain focused on tokenized real-world assets, said it raised $44 million in a Series A round led by a mix of traditional finance and crypto investors.
Backers include Sumitomo Corporation’s venture arm, SNZ Holding, Chainlink and Flow Traders, along with unnamed financial institutions the firm described as “giants in global finance.” The funding comes as interest grows in bringing assets like bonds, energy projects and private credit onto blockchain rails.
Pharos says it is building an “asset-native” network designed to handle regulated financial activity at scale. Its system uses parallel processing to support large volumes of transactions, with compliance features aimed at institutions that need audit trails and identity checks.
The company targets a market it values at $50 trillion. While far from that figure, the tokenization space has been growing, with data showing total real-world assets onchain are now at $24.3 billion. That’s up from $14 billion at the beginning of the year.
Pharos also pointed to activity on its testnet, which it said includes millions of users and unique addresses, and a partnership with energy firm GCL tied to solar-backed assets. These figures, common in pre-launch networks, are often driven by incentives and are hard to verify independently.
The raise follows an earlier seed round where the firm raised $8 million. That round was co-led by Lightspeed Faction and Hack VC. It also comes after a recent investment from GCL New Energy (0451) that valued the firm near $1 billion.
Its mainnet is expected to debut in the near future.


A White House report released Wednesday directly challenges the banking industry’s claims that stablecoin yields would drain deposits and weaken lending to households and small businesses.
Instead, banning those stablecoin rewards would have only a negligible impact on credit creation, the analysis, released by the Council of Economic Advisers (CEA), found.
The White House economists behind the 21-page report said their findings are based on a stylized economic model calibrated with Federal Reserve and FDIC data on deposits, lending and bank liquidity, as well as industry disclosures on stablecoin reserves and academic estimates of how consumers shift funds between assets.
The report, which specifically analyzes the GENIUS Act, signed in July 2025, also warns that proposed updates to the Digital Asset Market Clarity Act to further restrict “yield-like” rewards from intermediaries like Coinbase could be counterproductive.
“In short, a yield prohibition would do very little to protect bank lending, while forgoing the consumer benefits of competitive returns on stablecoin holdings,” the report emphasized. It added that “the conditions for finding a positive welfare effect from prohibiting yield are simply implausible.”
The report marks the latest development in the ongoing conflict between U.S. banks and the cryptocurrency industry that has stalled digital asset legislation in Congress, where senators are seeking a compromise to unlock the stalled Clarity Act. President Donald Trump and his advisers have been eager for negotiators — including the crypto industry, bankers and senators from both sides of the aisle — to strike a deal that advances the long-awaited bill, which is one of the administration’s legislative priorities.
While the crypto firms and their legislative supporters argue they should be allowed to offer yield-like rewards on stablecoins, banks warn that would lead to funds being siphoned away from the traditional financial system. But Wednesday’s findings could undercut a core argument from banking groups: Even a full ban on stablecoin yield would increase lending only marginally.
Ban does little to protect lending
In other words, the report claimed, the prohibition would do little to protect lending while stripping consumers of competitive returns.
The American Bankers Association (ABA) insists that if stablecoins begin offering yields comparable to high-yield savings accounts, depositors will move money out of banks and into digital dollars, reducing the funds banks use to make loans. The banking lobbyists have argued that community bankers will be especially harmed — an argument that caught the ear of lawmakers such as Senators Thom Tillis, a Republican, and Angela Alsobrooks, a Democrat, who have been seeking a legislative compromise that won’t harm Main Street institutions.
However, the White House economists said that the bankers’ argument misunderstands how stablecoins interact with the broader financial system. In one example, the report describes how funds used to buy stablecoins are often reinvested in Treasury bills and ultimately redeposited into other banks, leaving overall deposit levels largely unchanged,
The report also addresses concerns that community banks could lose out as funds flow into Treasuries and large institutions, finding the impact on smaller lenders is limited. It estimates community banks would account for just 24% of any incremental lending under a yield ban or about $500 million, and notes that stablecoin activity is already concentrated among large financial institutions, suggesting the real-world effect on smaller banks may be even smaller.
“The answer lies not in the level of deposits, but in their composition,” the report explained. Under the current “ample reserves” regime, these shifts between banks do not force lenders to shrink their balance sheets.
Rather than disappearing from the banking sector, much of the money backing stablecoins is recycled through it. When issuers invest reserves in Treasury bills or similar instruments, those funds typically end up redeposited elsewhere in the banking system, preserving overall deposit levels even if individual banks see outflows.
Only a small share of stablecoin reserves, estimated at about 12% in the report’s baseline, is held in forms that could meaningfully restrict lending. Even then, the effect is heavily diluted by bank reserve requirements and liquidity buffers, which absorb much of the potential impact before it reaches borrowers.
The result is a multi-step dampening effect: tens of billions of dollars may move between stablecoins and deposits, but only a fraction ultimately translates into new loans.
That dynamic also weakens the argument that stablecoin yields pose a particular threat to community banks. According to the report, smaller lenders would see just $500 million in additional lending under a yield ban, an increase of roughly 0.026%.
In other words, the White House economists contend that the policy delivers minimal benefits to the very institutions it is often framed as protecting.
The report said generating large lending effects requires hypothetically stacking several extreme conditions at once: a stablecoin market many times larger than today’s, reserves fully locked away from lending and a shift in Federal Reserve policy away from its current ample-reserves framework. Absent those scenarios, the impact remains marginal, it said.
Costs fall on consumers
The report also reinforced the crypto industry’s arguments in consumer terms. By eliminating yield, policymakers would effectively reduce returns on a growing category of dollar-based assets that compete with traditional deposits.
The economists estimated that such a prohibition would carry a net welfare cost, as users give up yield without receiving meaningful improvements in credit availability in return. Rather than assuming stablecoin yields are destabilizing, the report suggested policymakers must demonstrate that restricting them would deliver tangible benefits to the real economy, particularly to small businesses and households that rely on bank lending.
So far, according to the administration’s own economists, that case remains unproven.
Crypto World
Adam Back denies he’s Satoshi Nakamoto after a new report claims he’s Bitcoin’s (BTC) creator


Adam Back has denied claims that he is Satoshi Nakamoto after a New York Times story argued that the British cryptographer is the strongest candidate yet for Bitcoin’s pseudonymous creator.
In a post on X after the article was published, Back said his long record in cryptography, privacy tools and electronic cash research explains why reporters keep finding links between his work and Bitcoin’s design.
“I’m not satoshi,” Back wrote. He said he had been “early in laser focus on the positive societal implications of cryptography, online privacy and electronic cash,” and that his work from about 1992 onward, including discussions on the cypherpunks mailing list, led to Hashcash and other ideas later echoed in Bitcoin.
Back, said NYT reporter John Carreyrou, had found “many interesting bitcoin analogs in early attempts to create a decentralized ecash,” adding that early researchers explored concepts such as peer-to-peer systems, proof-of-work, and routing models that looked like prototypes for Bitcoin.
He also disputed one line in the story that treated a comment he made in an interview as a possible slip. Back’s remark — “I’m not saying I’m good with words, but I sure did a lot of yakking on these lists actually” — referred to confirmation bias. Because he wrote so often about electronic cash, he said, his old comments are easier to match with Satoshi’s than those of others who posted far less.
“The rest is a combination of coincidence and similar phrases from people with similar experience and interests,” Back wrote.
He added that he does not know who Satoshi is and said that it may be good for Bitcoin. In his view, the mystery helps frame Bitcoin as “a new asset class, the mathematically scarce digital commodity.”
Others also questioned the conclusions. Joe Weisenthal, a Bloomberg columnist and co-host of the Odd Lots podcast, said he was “not 100% convinced by the evidence or the conclusion.”
“The stylometry is interesting, but on content, ofc all the cypherpunks had similar thoughts on politics and privacy and the architecture of the internet,” he wrote on X. He also questioned why Back would speak openly about earlier work like Hashcash under his real name but use strict anonymity for Bitcoin.
“None of us are that consistent with hyphenization,” Weisenthal added, arguing that shared writing quirks may not be meaningful. He noted that Back was already among those closest to assembling Bitcoin-like ideas before its launch, which could explain his later involvement.
The question of Satoshi’s identity has drawn speculation for years. Several books, documentaries and articles have claimed to have solved it, only for those cases to unravel or fail to persuade the wider Bitcoin community. In 2024, one high-profile documentary pointed to developer Peter Todd, who denied the claim.
Nicholas Gregory, a U.K.-based early Bitcoin participant, also pushed back on the latest theory.
“I don’t believe Adam Back is Satoshi based on my personal interactions with him,” Gregory said. “However, if he were, we would have to respect the extraordinary lengths he has gone to in order to ensure no one thinks it’s him. In that case, we should honor his clear desire for privacy.”
Gregory said the longer the search continues, the more extreme the theories become. He added that many reporters miss key parts of Bitcoin’s early history and make avoidable errors.
He also warned that publicly identifying Satoshi could put that person and their family at risk.
Leicester lose appeal against points deduction

Intel joins Musk’s Terafab as foundry partner in $25B chip megaproject
Jefferies reiterates Woodward stock rating on aerospace upside

Why Israel is blocking foreign journalists from entering

Bitcoin: We’re Entering The Most Dangerous Phase

Alan Cumming Brands Baftas Ceremony A ‘Triggering S**tshow’

15 Most Valuable Money Making Skills in 2026 (Ranked)

Joe Rogan on Ferrari Suing Philipp Plein! #money #finance #changeyourmindsetchangeyourlife

Monthly Subsidy of 70,000 Rupees Announced | Big Financial Relief| Hum News | Pakistan
-

 NewsBeat6 days ago
Steven Gerrard disagrees with Gary Neville over ‘shock’ Chelsea and Arsenal claim | Football
-

 Business6 days ago
No Jackpot Winner and $194 Million Prize Rolls Over
-

 Fashion5 days ago
Weekend Open Thread: Spanx – Corporette.com
-

 Crypto World7 days ago
Gold Price Prediction: Worst Month in 17 Years fo Save Haven Rock
-

 Business4 days ago
Expert Picks for Every Need
-

 Business3 days ago
Three Gulf funds agree to back Paramount’s $81 billion takeover of Warner, WSJ reports
-

 Sports4 days ago
India men’s 4x400m and mixed 4x100m relay teams register big progress | Other Sports News
-

 Business7 days ago
Login and Checkout Issues Spark Merchant Frustration
-

 Tech18 hours ago
How Long Can You Drive With Expired Registration? What Florida Law Says
-
Business3 days ago
No Jackpot Winner, Prize to Climb to $231 Million
-

 Tech6 days ago
Commonwealth Fusion Systems leans on magnets for near-term revenue
-

 Fashion2 days ago
Massimo Dutti Offers Inspiration for Your Summer Mood Board
-

 Crypto World7 days ago
Ripple rolls out enterprise crypto treasury platform for corporates
-

 Tech7 days ago
Drawing Tablet Controls Laser In Real-Time
-

 Fashion23 hours ago
Let’s Discuss: DEI in 2026
-
Politics5 days ago
Wings Over Scotland | The quality of mercy
-

 Crypto World7 days ago
Why It’s Partnering, Not Issuing
-
 Sports7 days ago
Steal Gary Woodland’s subtle power move for longer drives
-
Sports7 days ago
Tom Pelissero Drives the Final Nail in the Coffin
-
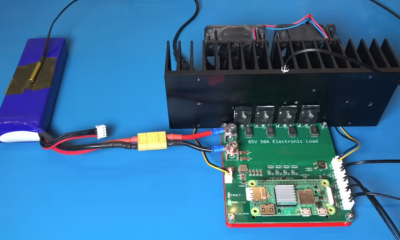
 Tech7 days ago
Battery Tester Outperforms Cheaper Options
You must be logged in to post a comment Login