
Crypto World
NIO (NIO) Stock Plunges 6.5% as Shelf Registration Sparks Dilution Worries

TLDR
- Chinese EV manufacturer submitted major shelf registration filing for potential future stock issuance
- Shares plummeted more than 6.5% in Thursday trading, erasing portion of recent ~20% surge
- Company achieved historic first quarterly GAAP operating profit of $40.4 million announced March 10
- Fourth-quarter vehicle deliveries reached all-time high of 124,807 units, representing 71.7% annual increase
- Cash reserves declined to $1.61 billion while current liabilities surpass current assets
Shares of NIO Inc. tumbled over 6.5% during Thursday’s session following the Chinese electric vehicle manufacturer’s submission of a shelf registration filing that opens the door for potential future equity issuance. The regulatory document spooked investors who had recently enjoyed substantial gains, with share dilution anxieties rapidly dominating market sentiment.
The shelf registration emerged mere days after NIO announced a historic operational achievement: the company’s inaugural quarterly GAAP operating profit. The automaker posted net income of $40.4 million during Q4 2025, accompanied by record-setting deliveries totaling 124,807 vehicles — marking a substantial 71.7% increase compared to the prior year period. Investment bank HSBC reacted by elevating the stock to a Buy rating and raising their price target by 42%. Shares surged approximately 20% in subsequent trading sessions.
That momentum has now evaporated. While the shelf registration didn’t announce an immediate equity offering, the mere possibility of future share dilution proved sufficient to trigger a wave of selling.
The situation presents a notable contradiction, as NIO’s operational performance has demonstrated considerable strength. The manufacturer celebrated delivering its 80,000th unit of the third-generation ES8 SUV and crossed the 550,000-unit threshold for cumulative in-house semiconductor production. Both its Shenji NX9031 processor and Yangjian chip are currently in production, representing critical components of the company’s strategy toward proprietary autonomous driving capabilities.
Financial Position Raises Ongoing Questions
Notwithstanding the profitability breakthrough, NIO’s balance sheet continues to display warning signals. Cash and cash equivalents decreased to $1.61 billion, while current liabilities have now surpassed current assets — a financial position that makes any discussion of potential share issuance appear more necessary than procedural.
The company’s subsidiary brands haven’t yet contributed meaningful volume. Firefly recorded merely 2,657 deliveries during February. Onvo is demonstrating gradual momentum growth, though progress remains measured.
From a broader market perspective, NIO confronts possible challenges from 100% U.S. import duties and European Union protectionist policies, although the automaker qualifies for China’s RMB 62.5 billion trade-in subsidy initiative for 2026, which could deliver substantial domestic support.
What Analysts Are Saying
Market observers at Traders Union express divergent perspectives. One group views the bullish technical formation as maintained above critical moving averages, citing semiconductor production expansion and subsidy program eligibility as justification for positive outlook. The opposing view highlights ongoing selling momentum and cautions that a breach below the $5.31 support threshold could trigger increased downside vulnerability.
NIO’s Q1 2026 projections anticipate deliveries between 80,000 and 83,000 units alongside revenue ranging from $3.5 billion to $3.6 billion — representing growth if realized, though representing a deceleration from Q4’s record performance.
Shares maintain approximately 12% gains over the trailing month, yet remain more than 80% below their historical peak. A single profitable quarter hasn’t eliminated years of accumulated losses, and a single shelf registration filing proved adequate to remind market participants of that reality.
NIO traded near $5.50 during Thursday’s session, hovering just above the critical $5.50 threshold that market participants are closely monitoring.


Bitcoin is grappling with a shift in momentum after failing to sustain a rally above $76,000, slipping back under $70,000 as crude oil prices rise and inflation concerns roil risk markets. The move underscores how macro forces—oil, policy expectations, and stock weakness—continue to shape the crypto narrative, even as traders parse chart patterns for clues about the path forward.
Among the most watched signals is a potential bearish wedge that market technicians say could herald further downside if the lower boundary gives way. Analysts are weighing whether BTC is building a fresh base or entering a renewed leg lower, with key targets circulating in the $50,000s to $60,000s range in the event of a breakdown.
Key takeaways
- Bitcoin failed to sustain a break above $76,000 and dropped below $70,000, renewing questions about a sustained base formation.
- Aksel Kibar, a chartered market technician, warned that a bearish wedge pattern could be forming, with a breakdown of the lower boundary potentially targeting around $52,500.
- The pattern similarities to late 2025 and early 2026 have observers watching whether BTC can respect larger-timeframe averages as part of a chops-and-base process.
- Macro factors—higher oil prices, inflation expectations, and shifting Fed rate expectations—continue to influence crypto risk sentiment and price action.
Bitcoin price action and the wedge argument
BTC’s retreat from its recent highs followed a rapid test of the $76,000 level, after which selling pressure pushed the price back toward the $70,000 area. The move fed a narrative among traders that the bottom might not be in yet, as momentum faded and a broader range began to reassert itself.
In a widely cited note, Aksel Kibar, a veteran chart analyst, described the possibility of a wedge pattern that mirrors the setup seen from December 2025 into early January 2026. He cautioned that a breakdown of the wedge’s lower boundary would be a signal for a potential move toward $52,500.
“Breakdown of the lower boundary will be the signal for a possible move towards $52.5K.”
Kibar also linked BTC’s need to respect its year-long moving average as part of a broad chop-and-base phase, a dynamic he described as a process of digestion before any meaningful directional move. He suggested the pattern could evolve into a rising wedge that would test a support zone around $73.7k–$76.5k, a scenario that would again place BTC within a crowded technical crosshair.
Macro backdrop: oil, inflation, and policy expectations
The price action comes as oil markets remain volatile, with higher crude prices contributing to inflation concerns that weigh on risk assets across the board. A number of market participants flagged that the confluence of elevated energy costs, geopolitical tensions, and policy uncertainty is complicating the near-term outlook for cryptocurrencies.
In discussing how policy may flow into inflation and asset prices, observers pointed to commentary about U.S. rate expectations. The Kobeissi Letter noted a shift in expectations, stating that “the market now sees a 50% chance of a US Fed rate HIKE by the end of 2026. Just months ago, markets saw as many as four rate CUTS this year.” This framing underscores how crypto traders are increasingly tethered to macro bets that can swing on a single data release or a shift in central-bank tone. Kobeissi Letter highlighted the dynamic as part of the evolving macro narrative surrounding BTC.
The broader market mood is also reflected in derivatives commentary. In its BTC Options Weekly, Glassnode observed that Bitcoin has reintegrated into its range after briefly trading above the $75,000 level. The report notes that “short gamma at $75K has been unwound”, implying less immediate upside pressure and suggesting ranges are reasserting themselves rather than a fresh breakout driving new highs.
“Beneath the pullback, the breakout has lost momentum and range conditions are returning.”
These observations align with a period of cautious stance among traders, who are trying to differentiate between a temporary pause and a larger structural shift in BTC’s price action. The market’s sensitivity to oil-related inflation and Fed guidance means that any shift in those drivers could quickly tilt the balance of risk assets, including Bitcoin.
What to watch next for Bitcoin and the market
For investors and traders, the near term hinges on whether BTC can stabilize above or near the $70,000 threshold and how it behaves around the key wedge/technical levels discussed by analysts. The potential test zone near $73.7k–$76.5k remains a focal point, with a breakdown signaling the possibility of a deeper drawdown toward the $50,000s or below if macro conditions stay adverse.
From a macro perspective, oil prices, inflation expectations, and policy signals will continue to feed into crypto pricing. If oil prices ease and inflation expectations cool, there could be room for a renewed risk-on tilt. Conversely, if energy costs stay elevated and central banks maintain a wary stance on inflation, Bitcoin could remain tethered to wider market volatility.
Derivative markets will also offer clues about how traders are positioning for the next move. A reversion to a tighter range and unwinding of near-term gamma could reflect a cautious stance ahead of key data or policy events, rather than a conviction of a swift new leg higher.
In the near term, market watchers will be paying close attention to how BTC behaves around the $70,000 level and whether it can mount a sustained base above that line. The coming weeks will likely reveal whether the current price action represents a temporary pause in a sideways pattern or the prelude to a more meaningful directional move shaped by macro developments and evolving market structure.
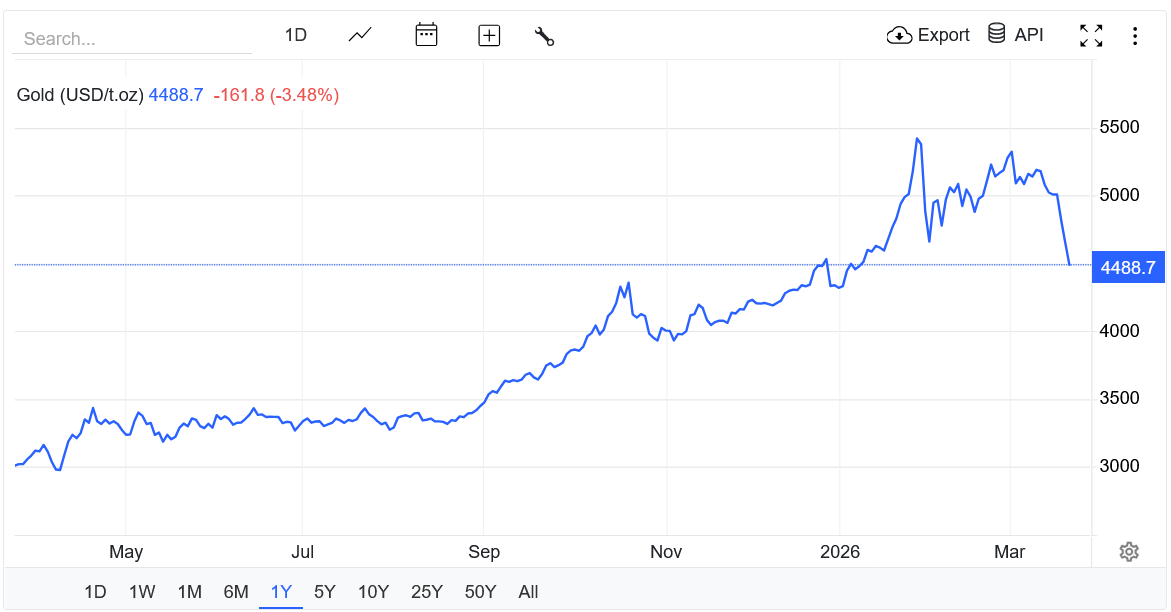
Gold tumbled another 3.5% to $4,488 per ounce on Friday, marking an 11% fall for the week and the largest weekly loss the precious metal has seen since 1983 as geopolitical instability and uncertainty in the Middle East continue to weigh on the markets.
Gold has fallen more than 15% since Feb. 28, when the US and Israel first attacked Iran, erasing part of the rally that pushed its price up to the $5,500 mark in late January and casting doubt on its safe haven status.
TradingView confirmed that March 16-20 was gold’s worst-performing week since 1983. The 11% weekly fall was slightly larger than the last week of January, when gold shot up to about $5,320 before diving to $4,650, a drop that saw more than $2 trillion shaved off the precious metal’s market cap in days.

The war with Iran is also disrupting global oil flows, particularly in the Strait of Hormuz, causing fears of a prolonged energy crisis.
US President Donald Trump said on Friday that he is considering “winding down” its military efforts in the Middle East. However, the US has sent thousands of additional troops to the region as airstrikes continue.
At the same time, traders are anticipating that the US Federal Reserve will hold interest rates steady this year, making bonds and other yield-bearing investments more appealing than gold.
The Federal Reserve chair, Jerome Powell, also noted on Wednesday that higher energy prices would push up inflation, at least over the short term.
Bitcoin has clawed back lost ground on gold this month
Gold has outperformed Bitcoin (BTC) over the past 12 months, increasing 48.5% while the cryptocurrency has retraced 16.5% over the same timeframe.
Related: Bitcoin price aims to hold $70K amid rising inflation concerns
Bitcoin has responded better to the Iran conflict, however, up more than 11.6% to $70,535 since the US and Israel’s first attack on Iran.
Magazine: Is China hoarding gold so yuan becomes global reserve instead of USD?

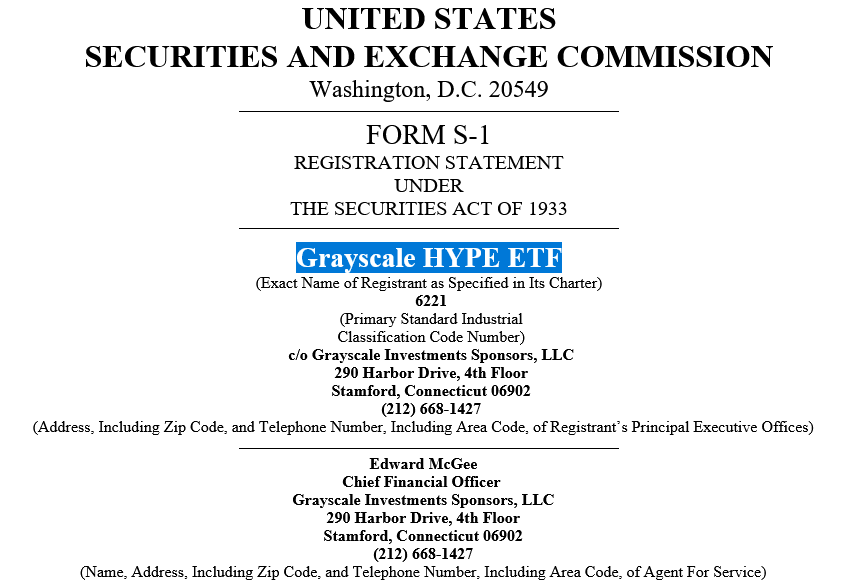
Grayscale has moved to bring a spot Hyperliquid exchange-traded fund to market, filing for a product that would track the Hyperliquid (HYPE) token and potentially trade on Nasdaq under the ticker GHYP if approved. The filing positions Grayscale alongside Bitwise and 21Shares in pursuing a dedicated on-exchange vehicle tied to Hyperliquid’s perpetual futures protocol and associated assets.
The company’s S-1 registration with the U.S. Securities and Exchange Commission confirms Coinbase as the custodian for the proposed ETF, though it does not disclose a management fee for GHYP. Notably, Grayscale indicates in the filing that staking rewards could be added to the ETF in the future, provided certain conditions are met.
Key takeaways
- Grayscale filed an S-1 with the SEC for a spot Hyperliquid ETF (GHYP) that would trade on Nasdaq if approved, marking a continued push by traditional asset managers into tokenized, 24/7-trading instruments.
- Coinbase is named as the custodian, but no management fee for the proposed ETF is disclosed in the filing.
- The filing leaves open the possibility of incorporating staking rewards into GHYP later, subject to regulatory and other conditions.
- Hyperliquid remains a dominant force in perpetual futures trading, with weekly volumes typically ranging from $40 billion to $100 billion, according to DeFiLlama data, while total weekly perps volume hovers between $125 billion and $300 billion this year.
Grayscale’s Hyperliquid bet and what it signals for investors
The S-1 filing outlines a strategy for offering a spot ETF that would provide direct exposure to the Hyperliquid ecosystem through the HYPE token. If cleared by regulators, GHYP would give investors a traditional market access path to a crypto-native instrument designed to track the price movements of Hyperliquid’s tokenized futures protocol. Grayscale’s choice of Nasdaq as a potential listing venue reflects a broader trend of bridging traditional exchanges with crypto-native assets, aiming to attract institutional participants seeking regulated, familiar trading rails.
Crucially, the document confirms Coinbase as the ETF’s custodian, anchoring the product to a widely used on-ramp and custody provider in the crypto ecosystem. However, the filing does not reveal a management fee, leaving a key detail for future disclosure and regulatory review.
Beyond current exposure, Grayscale notes a potential expansion: staking rewards could be integrated into GHYP at a later date if certain conditions are satisfied. That possibility would offer an additional yield channel for investors, on top of potential price appreciation of the HYPE token. The idea of staking-enabled ETFs has floated around in contemporaneous filings by peers, signaling growing appetite for yield-bearing crypto products among institutional issuers.
Hyperliquid’s enduring role in the perpetuals market
Hyperliquid has established itself as a central venue for perpetual futures trading, a niche that blends crypto assets with continuous, derivatives-like exposure. Even as weekly trading volume for the platform cooled from its August peak, DeFi analytics show Hyperliquid handling between roughly $40 billion and $100 billion in weekly volume, keeping it at the top among perps platforms. DeFiLlama’s data corroborates Hyperliquid’s dominant position in the space, even as newer entrants emerged in 2025—Aster, Lighter, and edgeX—each carving out their own slices of the market but typically handling far less weekly volume than Hyperliquid.
Industry observers note that the broader perps market continues to move in sizable increments. Total weekly perps trading volume for the sector has hovered roughly between $125 billion and $300 billion this year, still well above levels from a year ago and signaling sustained demand for tokenized leverage and cross-asset exposure, particularly in a 24/7 trading environment that Hyperliquid helps to showcase.
Grayscale’s filing arrives amid a wave of interest in Hyperliquid-linked products from other asset managers. Bitwise filed for its own Hyperliquid spot ETF last year and amended the prospectus in December to include staking, while 21Shares signaled in its October filing that staking could be incorporated at a later date. These filings collectively illustrate a broader push to bring synthetic, crypto-native trading paradigms into regulated, exchange-traded formats that would be palatable to traditional financial audiences.
What to watch next
Regulatory review will determine whether GHYP can proceed to a Nasdaq listing. Investors should monitor not only the SEC’s assessment of the product’s structure and disclosures but also how Grayscale and other issuers address staking provisions, which could add yield opportunities while introducing new considerations around risk, custody, and volatility. As Hyperliquid and its competitors evolve, readers should track whether staking becomes a standard feature across spot Hyperliquid ETFs and how market liquidity and regulatory expectations shape those trajectories.
Unlike Bitwise, Grayscale doesn’t plan to incorporate staking for its Hyperliquid ETF but hasn’t ruled out integrating it in the future.
Crypto asset manager Grayscale has filed for a spot Hyperliquid exchange-traded fund, joining Bitwise and 21Shares in seeking to offer a product tied to the Hyperliquid perpetual futures protocol and blockchain.
The Grayscale HYPE ETF would track the price movement of the Hyperliquid (HYPE) token and trade under the ticker GHYP on the Nasdaq if approved, according to Grayscale’s S-1 registration statement filed with the Securities and Exchange Commission on Friday.
Grayscale listed Coinbase as the custodian but didn’t disclose a management fee for the proposed Hyperliquid product.

Grayscale’s filing comes as Hyperliquid continues to be integrated by crypto platforms and be increasingly relied on by TradFi when traditional markets are closed, as it offers 24/7 trading for tokenized real-world assets like oil and gold.
Grayscale said it may consider incorporating staking rewards into its Hyperliquid ETF at a later date, provided certain conditions are met.
Related: Morgan Stanley files amended S-1 for MSBT Bitcoin ETF
Staking would enable GHYP investors to earn yield on top of potential price appreciation from the HYPE token.
Bitwise filed for its Hyperliquid ETF in September and amended it in December to include staking, while 21Shares also contemplated incorporating staking at a later date in its October filing.
Hyperliquid continues to dominate perps trading
While trading volume on Hyperliquid has cooled off from its August highs, it continues to see between $40 billion and $100 billion in weekly volume — maintaining its position as the most traded perps futures platform, DeFiLlama data shows.
Several competitor platforms like Aster, Lighter and edgeX emerged in 2025, eating into Hyperliquid’s dominance, but still see far less trading volume on most weeks.
Total weekly perps trading volume has been hovering between the $125 billion and $300 billion mark this year — not quite as high as in November but still more than double the trading volumes seen this time a year ago.

Magazine: Human brain cell wetware plays Doom, fly’s mind uploaded: AI Eye

Key Highlights
- Kalshi secured more than $1 billion in fresh capital from a financing round spearheaded by Coatue Management, bringing its valuation to $22 billion—a doubling from its previous round just months ago.
- The platform’s annualized revenue has reached $1.5 billion, while February alone saw trading activity surpass $10 billion.
- Arizona authorities have filed criminal charges against Kalshi, alleging the operation of an unlicensed gambling enterprise.
- A Nevada appellate court ruling has paved the way for state officials to prohibit Kalshi’s activities within their jurisdiction.
- The company previously identified and sanctioned users for insider trading violations, including an individual associated with content creator MrBeast.
The prediction market operator Kalshi has successfully closed a funding round exceeding $1 billion, elevating the company’s valuation to $22 billion. Investment firm Coatue Management spearheaded the round, as reported by Bloomberg and The Wall Street Journal.
This latest valuation represents a remarkable doubling from December 2025, when the platform secured $1 billion at an $11 billion price tag. That previous financing was anchored by Paradigm and attracted participation from notable investors including Sequoia Capital, Andreessen Horowitz, ARK Invest, and CapitalG, the investment arm of Alphabet.
Kalshi was established in 2018 by co-founders Tarek Mansour and Luana Lopes Lara. The platform functions as a federally regulated financial exchange under the supervision of the Commodity Futures Trading Commission, holding the distinction of being America’s first regulated prediction market exchange.
The service enables participants to trade contracts based on real-world events—spanning political elections, commodity prices like oil, and even speculative scenarios such as the official confirmation of extraterrestrial life. Its user ecosystem encompasses retail traders, institutional market-makers, and corporations utilizing the platform for hedging specific event risks.
February marked a significant milestone as platform trading volume exceeded $10 billion. This figure represents approximately twelve times the volume registered half a year prior, based on data from KalshiData. Currently, the company reports annualized revenue of $1.5 billion.
According to an individual with knowledge of the matter cited by the Wall Street Journal, investor enthusiasm for this funding round has been partially fueled by expansion in Kalshi’s institutional business segment.
Polymarket, Kalshi’s primary competitor, has experienced comparable growth trajectories but primarily serves markets outside U.S. borders. Recent valuations for both platforms have clustered around the $20 billion mark.
Mounting Legal Challenges From State Authorities
Notwithstanding its impressive expansion, Kalshi confronts significant legal obstacles. This week, Arizona prosecutors filed 20 criminal counts against the platform, charging it with operating an illegal gambling operation without proper licensing and facilitating election betting within state boundaries. Kalshi has characterized these state-level allegations as “seriously flawed.”
On Thursday, the Ninth Circuit Court of Appeals rejected Kalshi’s motion to prevent an anticipated temporary restraining order in Nevada. This judicial decision enables Nevada authorities to move forward with banning the platform’s operations throughout the state.
Kalshi has initiated litigation against several states attempting to implement similar prohibitions. The company maintains that it operates under federal CFTC jurisdiction and therefore lies outside the scope of state gambling regulations. Currently, more than a dozen state-level enforcement actions are proceeding nationwide.
Insider Trading Investigations Draw Additional Attention
Last month, Kalshi publicly disclosed that it had identified and sanctioned two users for insider trading violations. One individual among those penalized was an editor with connections to MrBeast, the widely followed social media influencer.
The company further revealed it maintains more than a dozen active insider trading investigations from a total of approximately 200 cases it has examined.
When approached by media organizations regarding the new financing round, Kalshi representatives declined to provide comment.

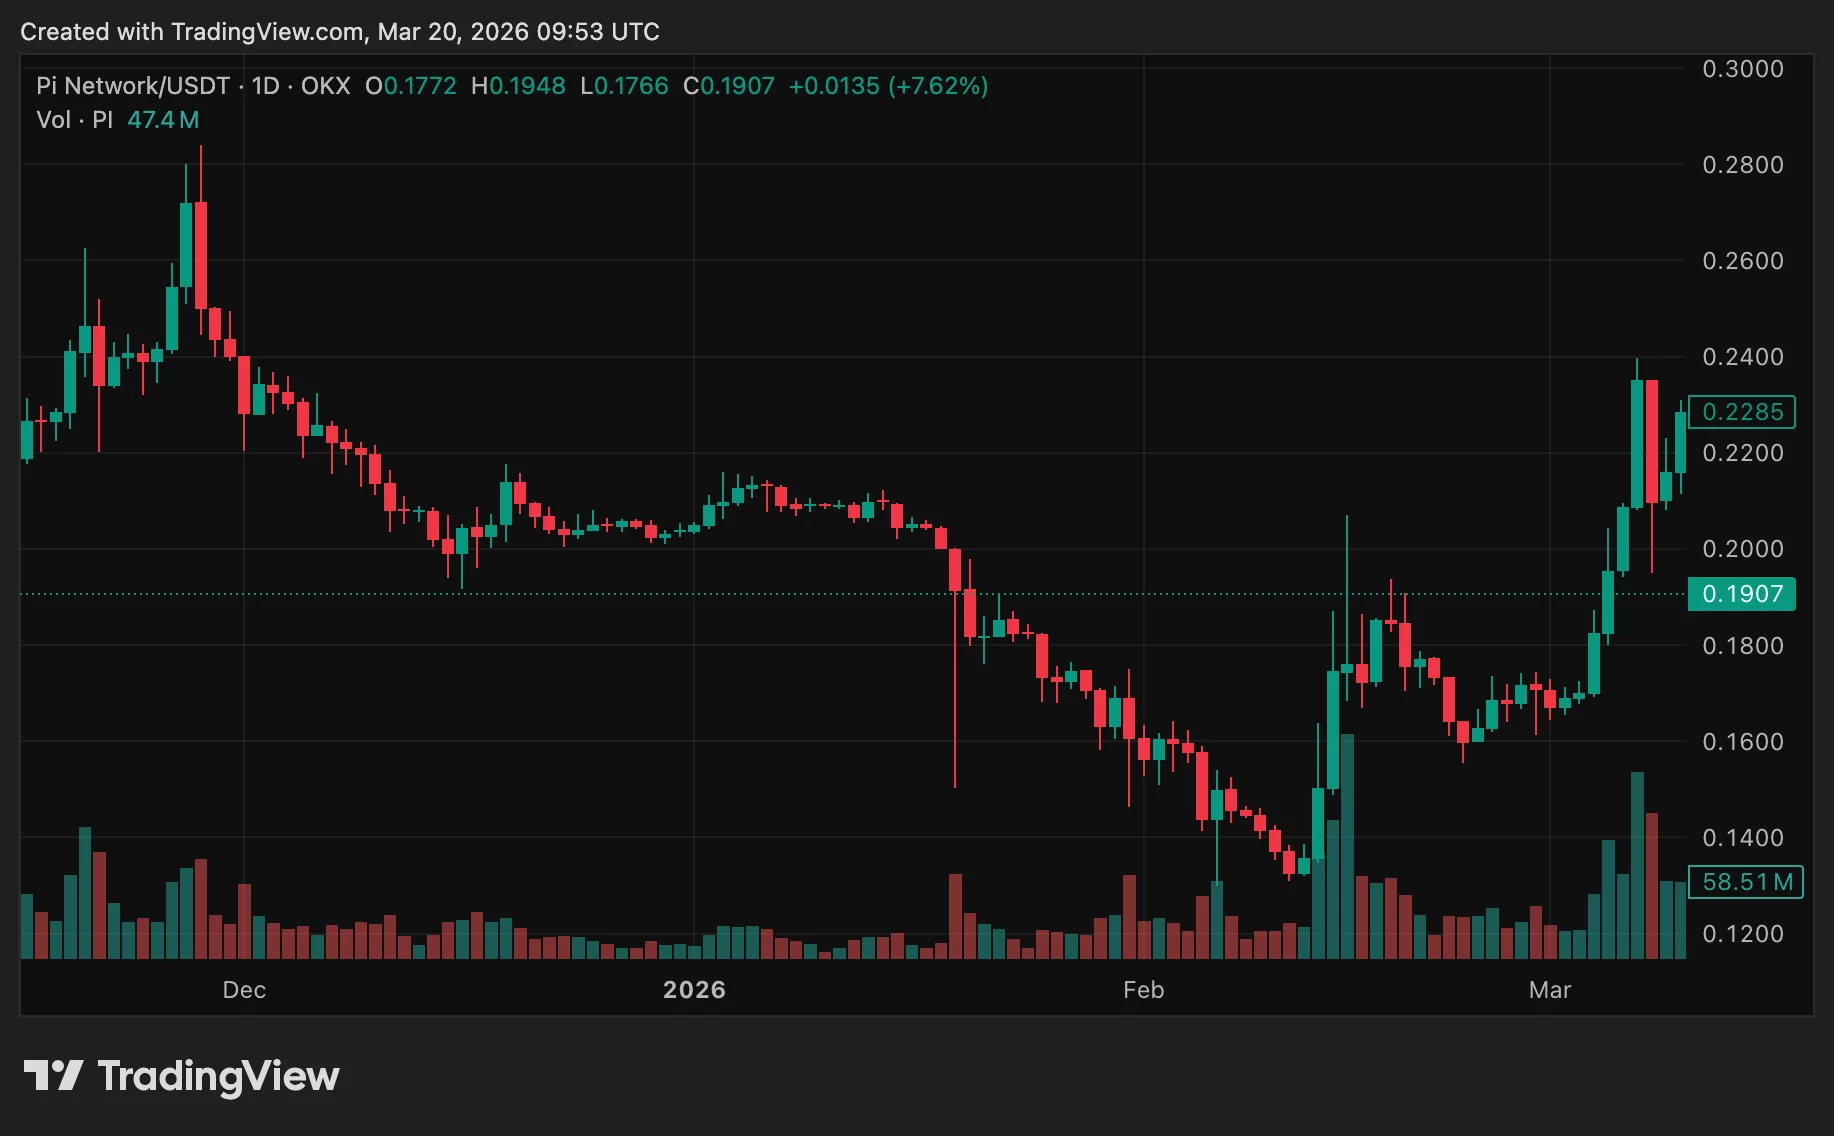
Pi Network’s PI token climbed on March 20 after a sharp three-day drop, as traders tracked the project’s next protocol update and the latest token unlock data. The token traded above $0.19 after gaining more than 7% on the day, placing it among the stronger-performing altcoins during the session.
Summary
- PI token rebounded above $0.19 after a steep three-day correction erased nearly half its value earlier.
- Pi Network’s upcoming v21 upgrade kept traders focused after recent updates added foundations for smart contract support.
- Token unlock data showed lighter daily releases ahead, except for March 20’s scheduled 16 million coins.
PI token (PI) entered March with wide price swings. The token moved from below $0.175 to above $0.23 by March 9. Market activity increased around protocol updates and exchange-related developments, which brought more attention to the asset.
The rally extended after Kraken announced plans to list PI on March 13. The token then rose to nearly $0.30, which marked a five-month high. After trading began on the exchange, the trend reversed. PI dropped sharply and fell back to about $0.175 earlier this week.
The decline erased close to half of the token’s value in about 72 hours. The move matched a “buy-the-rumor, sell-the-news” pattern often seen in digital asset markets. Buyers later returned, helping the token recover above $0.18 on March 19 and above $0.19 on March 20.
The rebound came during another active period for the Pi Network community. Price action remained sensitive to both technical updates and exchange-driven sentiment. Traders also watched supply data closely as new tokens moved toward release.
Unlock schedule remains in focus
PiScan data showed that the average number of tokens set to unlock over the next month stayed below 5.5 million per day. March 20 stood out from the rest of the schedule, with about 16 million coins expected to be released. After that, the remaining days of the month appeared less heavy in terms of supply.
Token unlocks often draw attention because they can affect short-term trading behavior. A larger release can increase the number of coins available on the market. A lighter schedule across most of the month may reduce some of that pressure, although price direction still depends on demand and broader market activity.
The latest unlock figures arrived as PI tried to recover from the recent sell-off. Market participants appeared to balance two factors at once. One was the recent decline after the Kraken listing. The other was the expectation that lower daily unlocks later in the month could limit added supply.
Protocol upgrades drive market attention
Pi Network has rolled out several updates in recent weeks. Version 19.6 arrived on February 20, followed by version 19.9 on March 4. The team also completed version 20.2 before March 14, which the community marks as Pi Day.
Version 20.2 drew attention because it set the base for smart contract capabilities. The team said the rollout would happen gradually and would focus on categories tied to utility-based product innovation and operations. That plan placed more attention on how the network may expand beyond its current structure.
The next step on the roadmap is version 21. The team has shared only limited details so far. Even so, it asked node operators to keep their systems updated as preparation continues. That message kept the coming release in focus as PI attempted to stabilize after recent volatility.
Disclosure: This article does not represent investment advice. The content and materials featured on this page are for educational purposes only.

U.S. lawmakers and the White House appear to be edging toward a political agreement on how stablecoin yields fit into the forthcoming crypto market-structure framework, potentially reviving momentum for the Digital Asset Market Clarity Act of 2025, commonly known as the CLARITY Act. Politico reported that an “agreement in principle” has been reached between Republican Senator Thom Tillis and Democratic Senator Angela Alsobrooks, both members of the Senate Banking Committee, signaling a potential path forward for the stalled bill.
While specifics remain sparse, Alsobrooks said the arrangement would aim to protect financial innovation while curbing the risk of widespread deposit flight. In particular, she noted that the deal contemplates prohibiting stablecoin yield on “passive balances,” a key constraint designed to limit how much yield can be earned on funds that aren’t actively deployed in productive channels. This balance—fostering innovation while addressing stability concerns—is central to the ongoing negotiations, according to the report.
Details of the prospective agreement have not yet been disclosed publicly, and Tillis indicated that the crypto industry should vet the language before it is finalized. Cointelegraph reached out to the White House for comment on the prospective deal, but no response was provided by publication time.
As this week unfolded, broader momentum around crypto regulation also resurfaced in remarks from lawmakers sympathetic to a comprehensive framework. Wyoming Senator Cynthia Lummis, a veteran advocate for digital-asset policy, told attendees at the DC Blockchain Summit that lawmakers are “so close” to passing a comprehensive regulatory framework. A Lummis spokesperson later indicated that a deal could materialize in the near term and that ethics language within the bill remains a focus for refinement.
The CLARITY Act, which envisions a clearer set of rules for digital assets and market structure, has long been viewed as a critical piece of policy parity following the GENIUS stablecoin framework’s enactment. Initially expected to glide through Congress, the bill slowed in January after major industry players, including Coinbase, voiced concerns about whether stablecoin issuers could share yields with token holders. Those objections underscored ongoing tensions between innovation incentives and consumer protection in a rapidly evolving sector.
For context, the broader regulatory conversation around crypto in the United States is inseparable from evolving views on stablecoins and their economics. The GENIUS framework, signed into law earlier, signaled a shift toward formalizing oversight, yet it also raised questions about how yield-bearing instruments would operate within a regulated ecosystem. The CLARITY Act’s fate hinges on resolving those questions—especially around yield, custody, and who ultimately benefits from crypto’s growth.
Key takeaways
- Agreement in principle reportedly reached between White House-adjacent lawmakers on the CLARITY Act, suggesting renewed momentum for market-structure reform.
- Core sticking point under discussion: whether stablecoin yield may be allowed on passive balances, with a proposed prohibition designed to prevent deposit flight and systemic risk.
- Industry insiders stress the need for vetting the language, as details are not yet public and could shift before formal introduction.
- Senator Cynthia Lummis’s comments reinforce optimism for a comprehensive regulatory framework, with ethics language under active negotiation.
- Banks argue that yield-bearing stablecoins threaten their market share and deposit stability, while White House aides have argued that the concerns may be overstated and could unleash capital into a regulated environment.
The path forward: what changes could mean for markets and users
The potential revival of CLARITY Act discussions carries significant implications for investors, issuers, and users across the crypto ecosystem. If lawmakers settle on a framework that permits regulated stablecoins but confines yield on passive balances, the industry could gain clearer guardrails for product design and risk management. For issuers, a well-defined regime would reduce uncertainty around how they structure yields, custody, and on-chain mechanics, potentially accelerating product development and partnerships with compliant financial institutions.
From an investor perspective, clearer rules could translate into a more predictable regulatory backdrop, which historically has been a driver of institutional participation. Yet the tension between innovation and stability remains palpable. Bankers have argued that even well-regulated stablecoins could siphon deposits away from traditional banks, a concern echoed by industry observers who emphasize the necessity of preserving financial stability while enabling responsible crypto innovation.
Patrick Witt, executive director of the White House Council for Digital Asset Policy, has framed these concerns as manageable within a robust framework. He told reporters that stabilization of the regulatory environment could attract fresh capital into the banking system if dollar-denominated stablecoins are legalized and properly overseen. The argument underscores a broader point: crypto’s growth could be compatible with, rather than a substitute for, traditional finance—so long as the rules incentivize prudent risk management and guardrails against misalignment between yields and liquidity.
The evolving dialogue also reflects a larger strategic dynamic: policymakers are trying to strike a balance between attracting innovation to the United States and preventing misalignment that could destabilize financial markets. As the process unfolds, the next milestones will likely hinge on the release of formal draft language, the incorporation of ethics provisions, and a final industry vetting period. The absence of a public response from the White House in this round reinforces how fluid the situation remains, with lawmakers and regulators aiming to map a path that satisfies both innovation advocates and traditional financial incumbents.
For readers tracking the regulatory arc, the CLARITY Act sits at the intersection of policy clarity and practical product design. It is not just about whether stablecoins can yield returns, but about who controls those returns, how they are distributed, and how risk is managed across on-chain and off-chain rails. The current negotiations suggest a greater willingness to align on principles—openness to innovation paired with guardrails to guard investors and the broader financial system.
As always, the market will respond to fresh details. Investors and builders should watch for the publication of the draft language, the contours of any ethics and governance provisions, and how banks and non-bank financial intermediaries are integrated into the new regime. The next days could reveal a more concrete timetable for CLARITY Act passage, or reveal additional frictions that delay a final vote. In either case, the discussion signals a pivotal moment for crypto governance in the United States.
In its early-phase outreach, Cointelegraph attempted to obtain comment from the White House about the prospective deal but did not receive a response by publication time. As the lobbying and policymaking process continues, observers will be attentive to how this agreement in principle translates into formal language and a concrete legislative path. The stakes are high: a clear, workable framework could unlock a wave of institutional involvement and user-facing crypto products, while also defining the boundaries of what constitutes permissible yield generation in a regulated market.
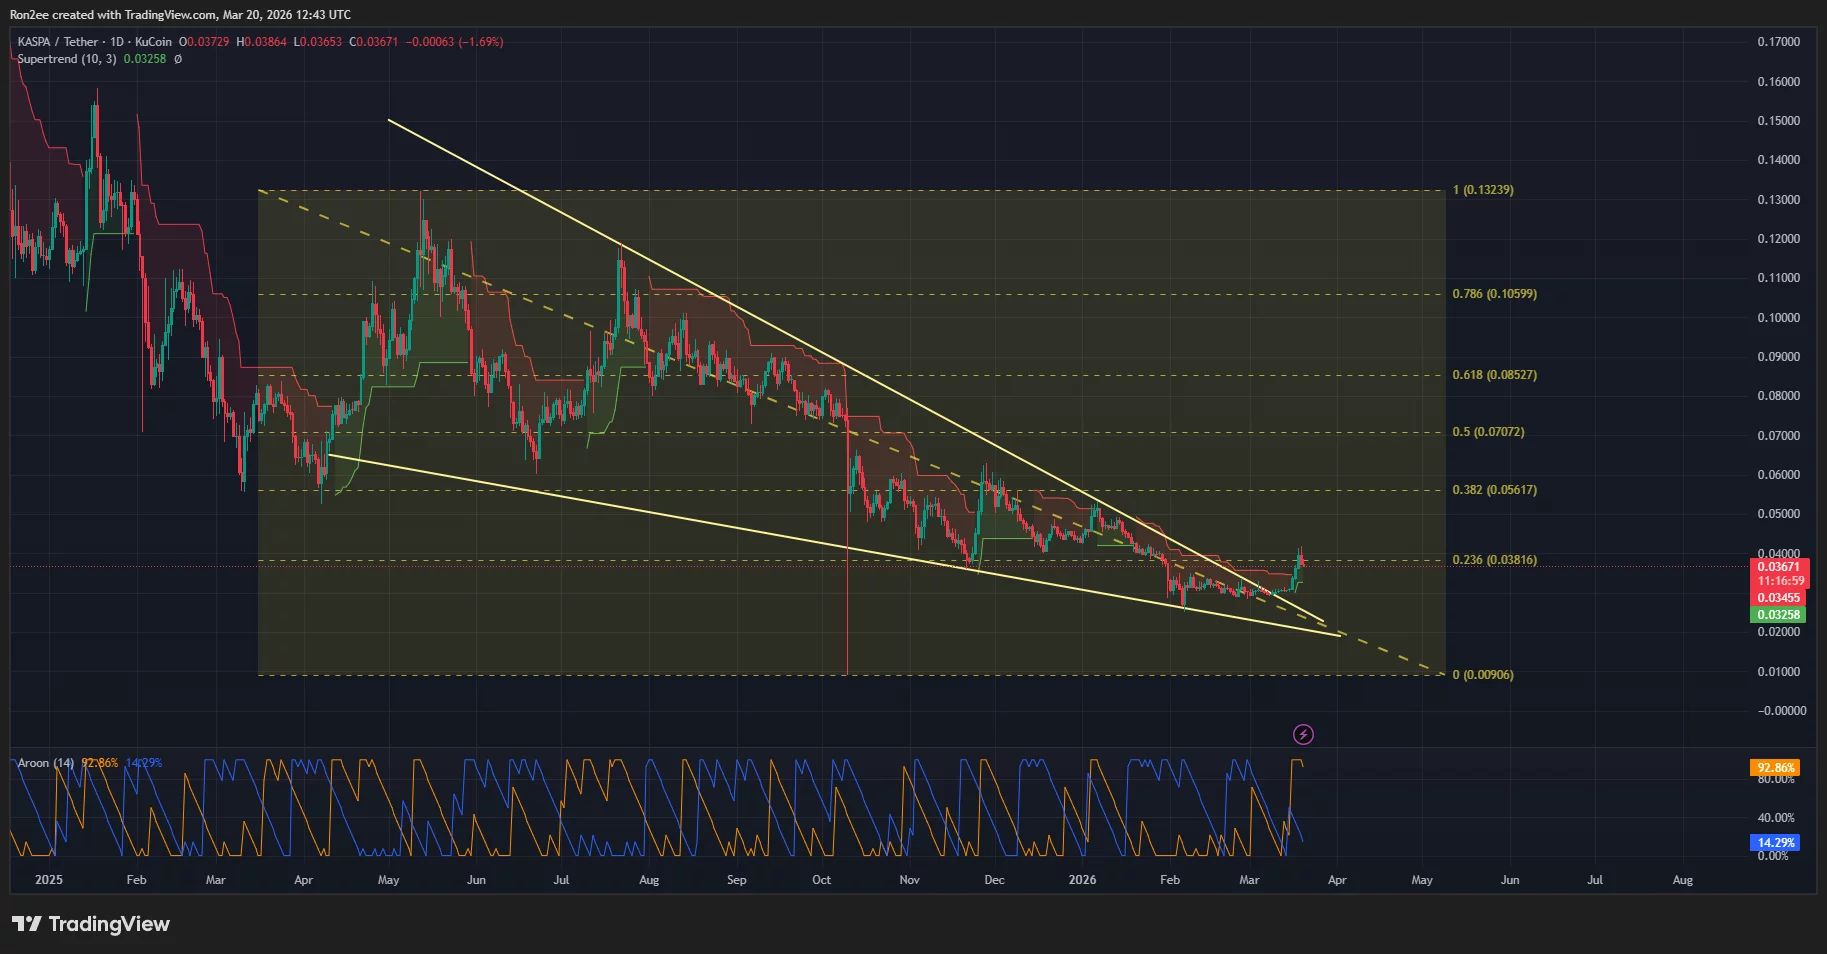
Kaspa price shot up to a seven-week high of $0.041 on Thursday before settling at $0.037 at press time. It has now confirmed a breakout from a multi-year falling wedge pattern, which could spur more gains ahead.
Summary
- Kaspa surged to a seven-week high near $0.041 and confirmed a breakout from a multi-year falling wedge, signaling potential for further upside.
- Technical indicators, including Supertrend and Aroon, point to a strengthening bullish trend, with resistance at $0.038 and a potential move toward $0.056.
- Exchange outflows of $1.8 million suggest rising investor accumulation and reduced sell-side liquidity, supporting the bullish outlook.
According to data from crypto.news, Kaspa (KAS) rallied to a seven-week high of $0.037 on March 19. Trading at $0.037 at press time, the token is up nearly 42% from its year-to-date low.
Technicals suggest that the token could still jump at least another 50% before hitting exhaustion.
On the daily chart, Kaspa price has broken out of a multi-year falling wedge pattern formed of two descending and converging trendlines. Typically, when an asset breaks out from the upper side of the pattern, it sees strong upside over the following days.

In Kaspa’s case, the upside scenario is further reinforced by bullish signals from technical indicators. The Supertrend, a tool used to measure market trend direction and volatility, flashed a green signal as the price moved above the key overhead trendline.
Additionally, the Aroon indicator shows the Aroon Up at 92.86% while the Aroon Down was at 14.29%, suggesting that a powerful new uptrend is currently in control.
For now, the immediate resistance for Kaspa lies at $0.038, the 23.6% Fibonacci retracement level drawn from the May 12 high of $0.13 last year to the Oct. 10 low of $0.0090.
A decisive breakout from here with strong volume can push its price to $0.056, which aligns with the next Fibonacci retracement level and lies nearly 51% above the current price.
The bullish outlook for Kaspa could gain further support from rising exchange outflows, as investors have begun moving their holdings off exchanges. Per data from CoinGlass, nearly $1.8 million worth of Kaspa has left exchanges recently.
Such a sudden spike in outflows means that investors are likely withdrawing Kaspa to self-custody wallets, potentially due to expectations of significant future price appreciation. This often leads other market participants to follow suit and further reduces the available sell-side liquidity.
Disclosure: This article does not represent investment advice. The content and materials featured on this page are for educational purposes only.


The Trump-backed DeFi project’s new AgentPay SDK gives AI agents self-custodial wallets and policy-enforced spending on EVM chains.
World Liberty Financial (WLFI) on Thursday released the AgentPay SDK, an open-source toolkit that enables AI agents to autonomously hold, send, and receive funds across Ethereum-compatible blockchains.
Transactions are settled in USD1, WLFI’s dollar-pegged stablecoin, which currently has roughly $4.4 billion in circulation, according to DefiLlama.
How It Works
AgentPay’s architecture spans four layers: a command-line interface, a local signing daemon, a policy engine, and a skill pack for integration with agent hosts. According to WLFI’s documentation, private keys are generated and stored on the operator’s machine, and all transaction signing occurs locally — the SDK sends no data to WLFI or any third party.
When a transaction exceeds preset thresholds, the SDK pauses it and requires human approval before proceeding. If a wallet lacks sufficient funds, the system halts the operation and returns an error including the wallet address, chain ID, and a QR code for replenishment.
The kit plugs directly into coding-agent hosts, such as Claude Code, Codex, and OpenClaw, according to the project’s documentation. It also includes a built-in Bitrefill integration that allows agents to purchase gift cards and mobile top-ups with USD1.
This article was written with the assistance of AI workflows. All our stories are curated, edited and fact-checked by a human.


Investors sue Gemini, alleging its IPO hid plans to abandon core crypto trading for a prediction market pivot, after shares crashed and layoffs followed.
Summary
- Investors allege Gemini concealed a preplanned pivot to a Gemini 2.0 prediction-market model in its IPO filings.
- The suit follows a 77% stock plunge, mass layoffs, and withdrawals from key international markets after the IPO.
- Plaintiffs say these post-IPO shocks were foreseeable outcomes of a strategy Gemini chose not to disclose.
Cryptocurrency exchange Gemini and its co-founders Tyler and Cameron Winklevoss are facing a securities class action lawsuit filed in the U.S. District Court for the Southern District of New York, alleging the company misled investors during its initial public offering and concealed a major strategic overhaul from the public.
The lawsuit, which targets Gemini Space Station, Inc. along with several senior executives, claims the exchange made materially misleading statements in its IPO documents when it went public on September 12, 2025. According to plaintiffs, Gemini failed to disclose that it was planning to fundamentally transform its business — abandoning its core cryptocurrency trading platform in favor of a prediction market-centered model it has since dubbed “Gemini 2.0.”
The fallout since the IPO has been severe. Gemini’s stock, which priced at $28 per share at launch, has since collapsed to $6.30 — a loss of roughly 77.5% — inflicting significant damage on retail and institutional investors who bought in at the offering. The decline has been compounded by a series of damaging developments that critics argue should have been disclosed to investors ahead of the listing.
In February 2026, just months after going public, Gemini announced a sweeping 25% reduction in its workforce. Around the same time, the exchange confirmed it was pulling out of several key international markets, exiting operations in the United Kingdom, the European Union, and Australia. The company has also seen significant leadership turnover, with its Chief Financial Officer Dan Chen, Chief Operating Officer Marshall Beard, and Chief Legal Officer Tyler Meade all departing in recent months.
The lawsuit argues that these events were not isolated incidents but rather the predictable consequence of a strategic direction the company had already decided upon before its IPO — one it chose not to share with investors.
The Winklevoss brothers, who founded Gemini in 2014 and have long positioned the exchange as a compliance-first, institutionally focused platform, have not yet issued a public response to the litigation. The suit names other unnamed executives alongside the founders.
The case arrives at a delicate moment for crypto exchanges more broadly. With regulatory scrutiny intensifying across the U.S. and global markets, the pressure on publicly listed crypto firms to meet the same disclosure standards as traditional financial institutions has never been higher. For Gemini, which built much of its brand identity around regulatory cooperation and trustworthiness, the allegations of investor deception carry particular reputational weight.
The outcome of the lawsuit could have broader implications for how crypto companies structure and disclose their business strategies ahead of public offerings — and may prompt closer regulatory examination of IPO documents across the industry.
Promoter Kalle Sauerland ’embarrassed for the sport’ after Mick Conlan upset defeat

Irish-founded Horizon Quantum to begin trading on Nasdaq today

Is It Safe To Buy Crypto Now? Bitcoin Update


-

 Tech5 days ago
Your Legally Registered ‘Motorcycle’ Might Not Count Under Proposed US Law
-
 Tech3 days ago
Are Split Spacebars the Next Big Gaming Keyboard Trend?
-

 Politics10 hours ago
Jenni Murray, Long-Serving Woman’s Hour Presenter, Dies Aged 75
-
Sports7 days ago
Why Duke and Michigan Are Dead Even Entering Selection Sunday
-

 Business5 days ago
Search for Savannah Guthrie’s Mother Enters Seventh Week with No Arrests
-

 Business7 days ago
US Airports Launch Donation Drives for Unpaid TSA Workers as Partial Government Shutdown Enters Fifth Week
-
Crypto World6 days ago
Coinbase and Bybit in Investment Talks: Could Bybit Finally Enter the US Crypto Market?
-

 Fashion10 hours ago
Weekend Open Thread: Adidas – Corporette.com
-

 Business5 days ago
Australian shares drop as Iran war enters third week
-

 Business7 days ago
Country star Brantley Gilbert enters growing non-alcoholic beer market
-

 Politics3 days ago
The House | The new register to protect children from their abusers shows Parliament at its best
-

 Crypto World5 days ago
Crypto Lender BlockFills Enters Chapter 11 with Up to $500M in Liabilities
-

 News Videos2 days ago
RBA board divided on rate cut, unusually buoyant share market | Finance Report | ABC NEWS
-

 Fashion5 days ago
25 Celebrities with Curly Hair That Are Naturally Beautiful
-

 Tech23 hours ago
inKONBINI Lets You Spend Summer Days Behind the Register
-

 Crypto World2 days ago
Canada’s FINTRAC revokes registrations of 23 crypto MSBs in AML crackdown
-
 Politics4 days ago
Real-time pollution monitoring calls after boy nearly dies
-

 Crypto World6 days ago
Crypto Losses Drop 87% in February, But Hackers Are Now Targeting People, Not Code
-
 NewsBeat2 days ago
Residents in North Lanarkshire reminded to register to vote in Scottish Parliament Election
-

 Business5 days ago
Meta planning major layoffs as AI spending and automation reshape workforce


You must be logged in to post a comment Login