
Crypto World
OKB token still under pressure even as OKX introduces AI toolkit for developers


- OKX’s AI toolkit launch has not lifted market sentiment.
- OKB token price remains range-bound with neutral momentum.
- The key OKB price levels are the support at $72 and the resistance at $82.
OKB token remains under pressure despite OKX crypto exchange unveiling an upgrade to its OnchainOS infrastructure that introduces an AI toolkit built for developers.
The new system is designed to help autonomous agents interact directly with blockchain networks.
This will allow developers to plug AI models into wallet functions, trading routes, and market data feeds without building everything from scratch.
While the move aims at making OKX the backend layer for AI-driven crypto execution, the excitement around the product has not translated into a clear recovery for its native token, OKB.
At press time, the OKB token was trading at around $75.88, after a modest 24-hour decline of 0.3%.
Even though the altcoin remains far above its early-cycle lows, it has fallen more than 60% over the past year and its all-time high of $255.50, reached in August 2025, still looms large above the current price.
Technical analysis shows OKB in consolidation
From a technical standpoint, OKB is trading in a narrow range, although it appears to closely mirror Bitcoin’s price movements, which means broader market sentiment remains a critical factor.
Recent OKB price movements show that the cryptocurrency is consolidating rather than trending.
The Relative Strength Index (RSI), though having bounced from an oversold condition, is still sitting close to the oversold region at 39.74 at press time.

In case of a bullish breakout, the immediate resistance sits near the 7-day simple moving average at $76.657.
On the downside, the 61.8% Fibonacci retracement level at $73.31 has served as key support, with a second support zone near $72.62 based on recent price action.
These two levels create a support band that traders should closely watch if the market breaks down from the current consolidation.
If that support band fails, historical data points to $68.05 as the next area where buyers previously stepped in.
OKB token price prediction
While the AI toolkit gives OKX a compelling long-term story, OKB’s price action suggests traders want proof of impact before bidding the token higher.
The near-term price outlook for OKB remains neutral unless a decisive breakout occurs.
A strong move above $76.77, supported by higher trading volume, would be the first signal of short-term strength.
If buyers push the price above the $82.47 resistance, momentum could expand.
Historically, sustained trading above $82.47 has paved the way for $93.50, according to CoinLore.
Beyond that level, the next resistance to monitor would be $104.84.
But if bears outweigh bulls, a drop below $73.31 and $72.62 would weaken the current structure.
Such a move would likely expose the token to a retest of $68.05.


Securitize will become the first digital transfer agent eligible to mint blockchain-based securities on NYSE’s upcoming Digital Trading Platform
The New York Stock Exchange and real world asset (RWA) tokenization platform Securitize have signed a Memorandum of Understanding to collaborate on tokenized securities infrastructure, the two companies announced on Tuesday.
Under the deal, Securitize will become the first digital transfer agent — a transfer agent that uses a blockchain-based ledger and smart contracts to process transactions — eligible to mint tokenized securities for issuers on NYSE’s upcoming Digital Trading Platform.
Per the release, NYSE plans to work with Securitize as a premier design partner to develop a digital transfer agent program supporting on-chain settlement of tokenized securities transactions. The two firms will also collaborate on setting regulatory, operational, and technology standards for the emerging digital transfer agent category — effectively writing the rulebook for institutional-grade tokenized securities infrastructure.
“As we explore how tokenization can enhance capital markets, it is critical that new infrastructure is developed in a way that preserves the trust, transparency, and protections investors expect,” said NYSE Group president Lynn Martin in the announcement.
Securitize CEO Carlos Domingo framed the tie-up as proof that tokenization is maturing beyond experimentation. “This is about building tokenization in a way that works within real market structure,” he said.
As part of the broader collaboration, Securitize Markets is expected to join the NYSE’s Digital Trading Platform as a broker-dealer participant, supporting liquidity for issuer-sponsored tokenized securities.
The deal comes amid a period of rapid growth for the wider tokenized RWA sector. RWAs became Wall Street’s gateway to crypto in 2025, with on-chain tokenized assets tripling to nearly $19 billion over the course of the year — a figure analysts project could reach $2 trillion by 2030.
Securitize is the tokenization platform behind BUIDL, the U.S. Treasuries fund from BlackRock, with a market cap of over $2 billion. Securitize is the tokenization platform for RWAs totaling over $3 billion in distributed asset value across ten blockchain networks, with over $1 billion on Ethereum per RWAxyz. Last year, the firm partnered with risk manager Gauntlet to bridge private credit funds into DeFi protocols.
NYSE first announced it was planning to launch a platform for 24/7 tokenized securities trading in January, as The Defiant reported.
This article was written with the assistance of AI workflows. All our stories are curated, edited and fact-checked by a human.

TLDR
- The CFTC has launched an Innovation Task Force to oversee crypto, artificial intelligence, and prediction markets.
- CFTC Chair Michael Selig announced the new initiative at the Digital Asset Summit in New York City.
- Michael J. Passalacqua will lead the task force as part of the agency’s regulatory efforts.
- The task force will coordinate with the Securities and Exchange Commission and its crypto unit.
- The SEC and CFTC recently issued joint guidance to clarify jurisdiction over digital assets.
The Commodity Futures Trading Commission (CFTC) has created an Innovation Task Force to oversee crypto, artificial intelligence, and prediction markets. Chair Michael Selig announced the initiative on Tuesday at the Digital Asset Summit in New York City. He said the group will draft clear rules and coordinate with federal agencies to guide emerging financial products.
CFTC Sets Framework for Crypto and Artificial Intelligence Oversight
CFTC Chair Michael Selig introduced the Innovation Task Force to advance regulatory clarity for digital assets and artificial intelligence tools. He said the agency will use the group to support responsible product development and structured market growth.
Selig stated, “By establishing a clear regulatory framework for innovators building on the new frontier of finance, we can foster responsible innovation at home and ensure American market participants are not left on the sidelines.”
He said the task force will give innovators direct access to agency staff for structured discussions and policy feedback.
Selig told attendees, “The idea behind our innovation task force is to really create a space where innovators and builders can come in and talk with the staff.”
The agency confirmed that Michael J. Passalacqua, a senior advisor to Selig, will lead the new group and oversee its operations.
The task force will coordinate with the Securities and Exchange Commission and its existing crypto task force. The SEC formed its crypto task force last year and held roundtables on DeFi and tokenization topics. Both agencies issued joint interpretive guidance last week to clarify jurisdictional boundaries and confirm that most cryptocurrencies are not securities.
Interagency Coordination and Focus on Prediction Markets
Selig said the Innovation Task Force will also work with the CFTC’s innovation advisory committee, created in February. The advisory committee includes more than 30 executives from financial and technology firms. Members include Kalshi CEO Tarek Mansour and Nasdaq CEO Adena Friedman, according to agency records.
The CFTC has increased oversight of prediction markets over the past year and asserted its jurisdiction in this sector. Selig has stated that the agency regulates derivatives linked to future events, including sports outcomes. Several states have opposed certain platforms, arguing that sports-related contracts may conflict with local gaming laws.
The agencies have aligned their regulatory stance through joint statements and coordinated guidance over the past year. Last week’s interpretive release outlined how each agency determines whether a digital asset falls under securities or commodities law. The CFTC said the Innovation Task Force will continue collaborating with federal partners as it refines oversight for crypto products, artificial intelligence applications, and prediction markets.


The New York Stock Exchange (ICE) is teaming up with tokenization specialist Securitize to help design the infrastructure behind tokenized securities trading, according to a Tuesday press release shared with CoinDesk.
Securitize is aiming to go public this year via a SPAC deal with Cantor Equitize Partners (CEPT). CEPT shares are higher by 6% premarket. ICE shares are flat.
The two firms signed a memorandum of understanding to build NYSE’s planned Digital Trading Platform. Securitize will serve as a design partner, focusing on how transfer agents — the entities that track ownership and handle corporate actions — operate when securities are issued and settled on blockchain rails.
Securitize, backed by large asset managers like BlackRock and Ark Invest and registered with the SEC as a transfer agent, is expected to be among the first firms eligible to mint tokenized versions of stocks and ETFs on the platform, subject to regulatory approvals.
The firm’s broker-dealer arm could also take part in trading, giving it a foothold across both issuance and market activity.
The move comes as traditional exchange behemoths like NYSE and Nasdaq are doubling down on tokenization efforts to bring blockchain rails into stock trading. That tech would enable around-the-clock trading and near-instant settlements, similar to crypto markets.
Recently, NYSE-parent Intercontinental Exchange invested in crypto exchange OKX to develop tokenized stocks and derivatives products. Rival exchange Nasdaq obtained regulatory approval for its tokenized stock trading framework and has tapped Kraken to distribute stock tokens globally.
“As we explore how tokenization can enhance capital markets, it is critical that new infrastructure is developed in a way that preserves the trust, transparency, and protections investors expect,” NYSE Group President Lynn Martin said.
Read more: Here is why Nasdaq and owner of NYSE are putting the $126 trillion equity market on blockchain


Viral “predictive historian” Jiang recasts Bitcoin as a CIA war‑surveillance tool and hinge of U.S. imperial decline, mixing sharp geopolitical reads with conspiratorial leaps.
Summary
- Viral “predictive historian” ties Bitcoin to U.S. imperial decline and a coming monetary reset
- Jiang claims BTC is a Pentagon/CIA surveillance weapon even as markets treat it as digital gold
- Critics say his “predictive history” blends accurate war calls with speculative crypto conspiracies
Beijing-based teacher Jiang Xueqin, the self-styled “predictive historian” who shot to fame for forecasting Donald Trump’s return to the White House and a disastrous U.S.–Iran conflict, is now recasting Bitcoin (BTC) as a tool of American empire and a hinge of a looming new world order. In recent lectures and clips circulating across YouTube, TikTok and X, Jiang argues that the world is witnessing “the end of U.S. imperial overextension” and that the monetary fallout will drive Bitcoin into “a structurally different regime” rather than another cyclical boom. He frames his analysis as “predictive history,” a fusion of structural geopolitics and game theory designed, in his words, to “test models against reality, just like artificial intelligence systems.”
In a widely shared breakdown of his Bitcoin thesis, Jiang claims that the cryptocurrency was not the work of a lone cypherpunk, but a Pentagon project engineered as “the ultimate surveillance technology,” echoing variations of the line that “Bitcoin was created by the CIA and the Deep State.” He tells audiences that Satoshi Nakamoto’s anonymity is “institutionally suspicious,” arguing that only an agency-backed team would have “the time, money, servers, and technical expertise” to deploy a global monetary network. At the same time, he leans on a factual point that mainstream analysts and chain‑forensics firms agree on: Bitcoin’s public ledger enables authorities to trace flows of illicit funds with far more granularity than cash.
Jiang’s crypto worldview is tightly bound to his geopolitical script. In multiple interviews and classroom talks repackaged online, he links U.S. “imperial overreach” in the Persian Gulf to a sequence of events in which military failure accelerates dollar erosion, pushes capital out of Treasuries and into hard assets and ultimately sends Bitcoin “nuclear.” One popular YouTube macro-finance explainer built around his framework describes Bitcoin as “the most liquidity-sensitive asset on the planet,” noting that “every dollar of monetized conflict cost is a dollar that enters the global financial system searching for hard assets with fixed supply,” with Bitcoin’s 21 million cap presented as the end of that chain. In that scenario, the video argues, the Bitcoin cycle is “not driven by the halving” but “by the fiscal response to imperial overextension,” applying Jiang’s method directly to BTC’s trajectory.
That framing has resonated with traders already treating Bitcoin as a barometer of war risk. Bloomberg recently reported that “crypto markets are once again serving as the only open window into how traders are pricing the continuing conflict” in Iran, as spot and derivatives flows react in real time to escalation headlines. Bitcoin has traded around the mid‑$60,000 to low‑$70,000 range in March, with some market forecasts projecting a possible move toward roughly $73,000–$79,000 this month while volatility remains high. Even mainstream price coverage now routinely situates BTC within a matrix of war risk, dollar policy and ETF‑driven institutional demand.
Jiang’s rise has been turbocharged by the perception that he “called” both Trump’s 2024 victory and the subsequent U.S.–Iran war, predictions that have been amplified by crypto traders, TikTok creators and even long‑form podcasts. An in‑depth profile notes that his YouTube channel, Predictive History, consists largely of unedited classroom lectures in which he maps great‑power cycles and “world order changes” for Beijing high‑school students. But academic critics and archaeologists have pushed back hard, warning that his method replaces evidence with grand narrative. In a recent debunking video, archaeologist Flint Dibble described Jiang as “a wacko who spreads insanely harmful conspiracy theories,” stressing that “his predictions about the future are mostly not accurate… a broken clock is right twice a day.”
The same tension defines his Bitcoin work. A detailed breakdown of “Professor Jiang’s Theory on Bitcoin’s Origins” acknowledges that he “mixes verifiable facts with baseless leaps of logic,” conceding that while DARPA did seed the early internet and Bitcoin’s transparency does aid law enforcement, there is “no public evidence linking Bitcoin’s creation to DARPA, the Pentagon, or the CIA.” Instead, Jiang’s narrative slots crypto into a larger story about the end of U.S. hegemony, the rise of a multipolar order and the search for new monetary anchors—a story that is shaping how a growing slice of retail traders interpret every tick in Bitcoin’s price chart, whether or not his “predictive history” ultimately passes its own reality test.


Stablecoin issuer Circle’s (CRCL) shares tumbled on Tuesday, after a draft version of U.S. stablecoin legislation raised concerns about limits on yield.
The stock of the USDC issuer fell as much as 18% in the early U.S. session, snapping a weeks-long rally that saw more than 100% gain. Meanwhile, crypto platform Coinbase (COIN), which shares revenue coming from the stablecoin, dropped about 8%.
The key catalyst behind the move was the latest version of the Clarity Act, as reported by CoinDesk, which would restrict offering rewards on stablecoin balances, analysts pointed out.
“Clarity Act could potentially ban yield payments for simply holding a stablecoin (e.g. passive balances) and restrict any approach that makes the program in any way equivalent to a bank deposit,” said Mizuho analyst Dan Dolev.
According to Dolev’s analysis, a potential ban could reduce the use case for Circle in the near-term, while not paying rewards would reduce the long-term attractiveness of holding USDC on Coinbase’s platform.
Stablecoin yield — whether through onchain lending or platform incentives — has been a big part of the pitch to investors. Taking that away makes it harder for tokens like USDC to evolve beyond simple payments.
“That weakens a key part of the bull case,” said Shay Boloor, chief market strategist at Futurum Equities, arguing it limits USDC’s path toward becoming a true store-of-value product.
The stablecoin-focused GENIUS Act banned issuers from paying yield directly to users, but they’ve built ways to pass through income earned on reserves. Circle collects interest on USDC’s backing assets and shares it with Coinbase, which in turn funds rewards for users.
The latest draft of the Clarity Act targets that structure by banning anything “economically equivalent to interest,” effectively cutting off a key incentive for holding stablecoins, according to Amir Hajian, a digital asset researcher at Keyrock
“It pulls the rug on the pass-through model that has been driving stablecoin adoption,” Hajian said.
There was another development in the background. Tether, issuer of the USDT stablecoin and main rival of Circle, said it has hired one of the ‘Big Four’ accounting firms to conduct a long-promised full audit of its reserves. If successful, the audit could improve USDT’s image among institutional users by demonstrating stronger risk management, potentially eating into USDC’s market share.
Not ‘as bad’
The selloff comes after a strong run, during which Circle shares gained 170% since early February, far outpacing other crypto stocks and the struggling broader stock market. That setup left the stock vulnerable to a sharp pullback on any negative headlines.
Still, analysts aren’t seeing this as an existential crisis.
According to Mizuho’s Dolev, recent outperformance of USDC’s volume means “use cases [for stablecoins] are starting to proliferate, which is a positive for the long-term” for Circle. Meanwhile, Coinbase could see a boost in profitability in the near-term as USDC accounts for about 20% of Coinbase’s revenue, and a large part of it is paid out as rewards.
In fact, Owen Lau, an analyst at Clear Street, said that “the actual situation doesn’t appear to be as bad as the headline indicates. “It looks like an overreaction, but the market tends to shoot first and ask questions later.”
Ryan Rasmussen, head of research at digital asset manager Bitwise, agreed that investors should see past today’s short-term headwinds. Circle is still up more than 30% this year after Tuesday’s drop, and remains a major player in a fast-growing market, he noted. “There will be workarounds,” such as loyalty programs that could replicate similar incentives as yield, Rasmussen said.
“With that in mind, Circle’s long-term outlook has never been better; they hold a 30% share of a market projected to grow 10x over the next four years,” he added.
UPDATE (March 24, 15:46 UTC): Adds analyst comments.
TLDR
- Missouri lawmakers advanced HB 2080 to create a state-managed Crypto Strategic Reserve Fund.
- The bill includes XRP alongside Bitcoin, Ethereum, Solana, and USDC as approved reserve assets.
- The State Treasurer would have authority to buy, hold, and manage digital assets using state funds.
- The legislation requires the Treasurer to hold acquired cryptocurrencies for at least five years.
- Missouri agencies could accept USDC for taxes, fees, and fines with approval from the Department of Revenue.
Missouri lawmakers have moved to create a state-managed crypto reserve that would include XRP. The House Committee Substitute for HB 2080 cleared the Commerce Committee in a 6–2 vote. The proposal now advances with a “Do Pass” recommendation and outlines direct authority for the State Treasurer.
Missouri Advances Bill to Establish Crypto Strategic Reserve Fund
Representative Ben Keathley sponsored HB 2080 to establish a Crypto Strategic Reserve Fund. The House Committee Substitute outlines how the State Treasurer would manage approved digital assets. Lawmakers advanced the measure after a 6–2 committee vote, and no member voiced opposition during hearings.
Under the bill, the Treasurer can buy, hold, and manage selected cryptocurrencies using state funds. The proposal requires the Treasurer to store acquired digital assets for at least five years. After that period, the Treasurer may sell, convert, or allocate holdings based on state strategy.
The fund can also receive digital assets through donations, grants, or transfers from residents and public entities. The legislation authorizes partnerships with third-party custodians to secure state-held assets. It also requires the Treasurer to publish transparency reports every two years.
Lawmakers included compliance measures to restrict transactions tied to foreign or illegal entities. The Department of Revenue would oversee approval for crypto payment systems within state agencies. These provisions aim to ensure oversight while enabling digital asset management.
XRP Included Alongside Bitcoin, Ethereum, Solana, and USDC
HB 2080 lists XRP among the digital assets eligible for state reserve holdings. The bill places XRP alongside Bitcoin, Ethereum, Solana, and USDC in the proposed fund. This classification allows the Treasurer to treat XRP as part of a long-term reserve strategy.
The Treasurer may purchase XRP directly with allocated state funds under the bill. The office may also accept XRP transfers from residents or other government bodies. The legislation frames these holdings as part of a structured reserve plan.
The proposal does not set a fixed dollar cap for XRP acquisitions. Instead, it grants the Treasurer discretion within existing state financial controls. The five-year minimum holding period applies to XRP and other approved assets.
Lawmakers structured the bill to mirror traditional reserve management models. The framework allows conversion or liquidation after the mandatory holding period. Officials must document these actions in the required biennial reports.
The committee vote advanced the bill without recorded public opposition. Representative Keathley stated that the measure supports “long-term financial strategy for the state.” The bill now proceeds through the legislative process for further consideration.
USDC Payments and Federal Digital Asset Reserve Efforts
The legislation also authorizes Missouri agencies to accept USDC for certain payments. Government entities may process USDC for taxes, fees, and fines with Department of Revenue approval. This step integrates stablecoin payments into state systems.
State agencies must follow strict compliance standards when accepting USDC. The bill prohibits transactions involving sanctioned or unlawful entities. Agencies may coordinate with approved custodians to manage payment processing securely.
The measure aligns with broader federal digital asset initiatives announced in 2025. President Donald Trump signed an executive order to establish a national Bitcoin reserve and an altcoin stockpile. Federal authorities continue to work to implement that directive.
Missouri lawmakers now await further legislative action on HB 2080. The bill outlines clear authority for reserve creation and digital asset management. Lawmakers will determine the next procedural steps in the current session.


The Solana Foundation has revealed it has secured Mastercard, Worldpay, and Western Union as early users of its newly launched developer platform, as part of ongoing efforts to attract enterprises to build on its blockchain.
The Solana Developer Platform (SDP) was announced on Tuesday to enable enterprise developers to build on the blockchain using a unified interface.
Much of the focus is on real-world asset tokenization, including stablecoins, which is currently a $328 billion market, according to rwa.xyz. More than half of the total value is held on Ethereum; however, with Solana holding 6.3% share of the tokenized real-world asset market.
“The early interest we’ve seen from enterprises and institutions signals strong demand,” said Catherine Gu, the head of product at the Solana Foundation.
The SDP will initially have three core modules: an issuance module to deploy tokenized real-world assets, a payments module to facilitate fiat and stablecoin flows, and a trading module due later this year that will support atomic swaps, vaults, and onchain forex.
Early users of the SDP include Mastercard for stablecoin settlement, Worldpay for merchant payments and settlement, and Western Union for cross-border payments, said the Solana Foundation.
Solana’s efforts to attract institutions
Solana invested in making the network enterprise-ready on a technical level with the Alpenglow upgrade in 2025, boosting transaction throughput. Meanwhile, in December, Visa launched USDC (USDC) settlement for US banks on the Solana blockchain.
“The next phase of digital asset innovation will be defined by practical use cases that integrate seamlessly with existing financial systems,” said Raj Dhamodharan, executive vice president, blockchain and digital assets, at Mastercard.
Related: Agentic AI commerce may spell the end of internet ads: a16z Crypto
Meanwhile, Malcolm Clarke, vice president of digital assets at Western Union, said the SDP is “not a replacement for our network,” but allows it to expand use cases and bring more cross-border activity.
Solana enters a crowded enterprise blockchain space
Enterprise-grade blockchain solutions are not new, and Solana’s latest platform enters a crowded market.
The Ethereum ecosystem has several strong offerings targeting the same enterprise audience, including Consensys’ Infura, a scalable API infrastructure powering thousands of decentralized applications.
Consensys also has the Linea layer-2, which is positioning itself as an institutional on-ramp to crypto.
Coinbase’s Ethereum layer-2 platform Base has modular components for checkout, APIs, and commerce payments that directly compete with SDP’s payments module.
Meanwhile, Ripple’s blockchain offerings, such as XRP Ledger, also primarily target enterprise and financial institutions, as it aims to become the standard for cross-border payments.
Magazine: Google flags crypto malware, retiree loses $840K in ‘expert’ scam: Hodler’s Digest
The New York Stock Exchange (NYSE) has signed a memorandum of understanding (MoU) with tokenization platform Securitize, as part of a broader effort to develop blockchain-based stock trading infrastructure for Wall Street.
Securitize will become the first digital transfer agent, enabling it to mint blockchain-based shares for stocks and exchange-traded funds (ETFs) on the upcoming tokenized securities platform, the Digital Trading Platform, according to a Tuesday announcement from Intercontinental Exchange (ICE), parent company of the NYSE.
Under the MoU, the companies plan to develop a digital transfer agent program and standards for digital transfer agents and tokenization agents, with a focus on regulatory, operational and technology requirements for tokenized securities infrastructure.
The announcement builds on ICE’s Jan. 19 plan for a tokenized securities venue designed for 24/7 trading, instant settlement, stablecoin-based funding and onchain settlement.
ICE said the planned venue is designed to support both tokenized shares that are fungible with traditionally issued securities and securities issued natively as digital tokens, while preserving traditional shareholder dividends and governance rights. Tokenized stocks are shares of traditional company stocks minted on the blockchain ledger, offering investors exposure to stock prices with advantages including 24/7 accessibility and fractional ownership.
The agreement is the latest sign that major exchange operators are building blockchain-based trading and settlement infrastructure, even as the regulatory and market structure for tokenized public securities is still taking shape.
The news follows the US Securities and Exchange Commission giving the regulatory greenlight to Nasdaq’s pilot proposal on Thursday to support the trading of tokenized versions of high-volume stocks and securities.

“As we explore how tokenization can enhance capital markets, it is critical that new infrastructure is developed in a way that preserves the trust, transparency, and protections investors expect,” said Lynn Martin, president at NYSE Group.
Related: US financial markets ‘poised to move on-chain’ amid DTCC tokenization greenlight
Tokenized stocks surpass $1 billion amid rising demand
Investor demand for blockchain-based tokenized stocks is increasing. The total value of tokenized stocks surpassed $1 billion on March 10, in a significant milestone for the real-world asset (RWA) sector.
Over the past 30 days, tokenized stockholders rose by 16% to 193,140, while the monthly transfer volume increased by 45% to $2.5 billion, according to data from RWA.xyz.
Still, tokenized stocks are only the sixth-largest segment of the $26 billion value locked into tokenized RWAs. Tokenized treasury debt was ranked first with $11.8 billion, and tokenized commodities second with over $5 billion.

Some of the leading crypto exchanges are also racing to launch tokenized stock offerings. Coinbase launched 24/7 stock perpetual futures for non-US traders on Friday, offering cash-settled exposure to major US stocks and indices, including Apple and Nvidia.
Crypto exchanges Binance and Kraken have also launched tokenized perpetual futures trading for non-US traders, along with numerous other offshore platforms.
Magazine: Can Robinhood or Kraken’s tokenized stocks ever be truly decentralized?
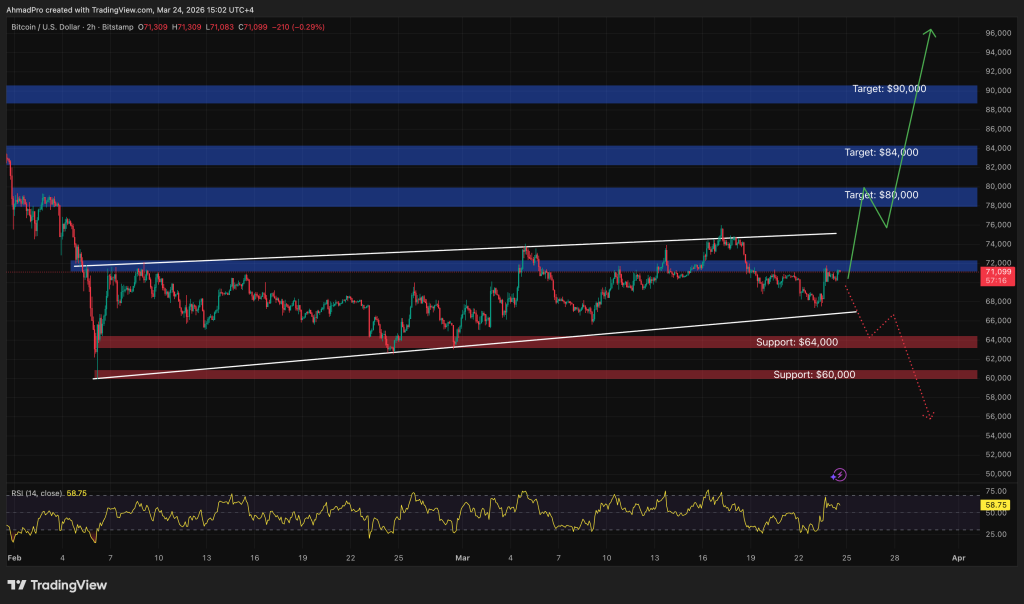
Bitcoin price is ripping. BTC USD reclaimed $71,000 Tuesday afternoon, erasing weekend losses immediately after President Trump ordered a five-day delay on strikes against Iranian energy infrastructure.
The sudden de-escalation signal triggered a violent capital rotation: oil futures collapsed nearly 10%, gold prices retreated 3.7%, and crypto assets surged in a classic risk-on relief rally.
Traders were positioned for immediate escalation following the expiration of a 48-hour ultimatum, but the pause caught bears offside.
While West Texas Intermediate (WTI) crude plummeted to $85.45 on the news, Bitcoin decoupled from the broad commodity sell-off, validating its role as a liquidity gauge rather than a pure safe haven in this cycle.
- Price Action: Bitcoin rallied from a low of $67,436 to a high of $71,782 within hours of the announcement.
- Macro Shift: Oil and gold plunged as war risk premiums evaporated, boosting risk asset liquidity.
- Market Signal: Short sellers were liquidated as sentiment flipped from fear to greed in under 60 minutes.
Can Bitcoin Price Reclaim $72,000 Price Resistance?
Bitcoin held $68,000 through peak uncertainty and is now pushing into the supply zone above $71,500.
Bulls need one thing: a confirmed 4-hour close above $72,000. That invalidates the lower-high structure built earlier this month and opens the next leg up.
Daily RSI has reset from overbought and is trending up near 58. Room for continuation exists. The 50-day EMA is the critical floor. Lose it and this rally gets exposed as a headline-driven bull trap.

Bull case: reclaim $72,000, consolidate, retest the March high at $75,620. Bear case: rejection at $71,800 sends price back to $68,500. Lose that and $65,000 opens up.
The short squeeze did the heavy lifting on the way up. CoinGlass data shows over $271 million in short positions liquidated in the hours after the White House announcement. Traders positioned for a breakdown below $67,000 got wiped and their forced covering poured fuel on the move.
Funding rates have ticked up but open interest has not reclaimed year-to-date highs. Spot buying and short covering are driving this, not leveraged froth. That is a healthier signal for trend sustainability than a derivatives-led pump.
The Macro Pivot: Why $85 Oil Matters
The correlation between Bitcoin and energy markets has inverted. While oil prices tumbled 9.8%—with Brent crude falling to $98.66—Bitcoin surged. This highlights the market’s current logic chain: lower oil prices reduce the risk of sticky inflation, which in turn lowers the probability of a hawkish Federal Reserve response.

Gold, traditionally the primary safe haven, dropped 3.7% as the immediate war premium exited the market. This divergence is critical.
While Bitcoin and gold decoupled during the Hormuz crisis, today’s action confirms that crypto is trading on liquidity dynamics rather than fear. When the threat of $150 oil vanished, the liquidity outlook improved, and Bitcoin pumped.
Investors should monitor the five-day deadline closely. If tensions flare again and oil reclaims $100, the headwinds for risk assets will return.
Traders are watching $70,000 holding as support into the daily close. Maintain this level, and the path to new highs is open. Fail here, and the market returns to choppy consolidation. The trend is up, but the geopolitical fuse is still lit.
BTC USD Price Is Bullish, And Investors Are Ready to Rotate to Infrastructure as Hyper Targets SVM Scalability
As the gold price crash and Bitcoin rally reshape portfolio allocations, smart money is beginning to rotate profits into high-growth infrastructure plays.
While Bitcoin secures its position as digital collateral, attention is turning to Bitcoin Hyper (HYPER), a protocol focused on bringing scalability to the Bitcoin network through high-performance Layer 2 solutions.
Bitcoin Hyper has now raised over $32 million in its ongoing presale, signaling strong institutional appetite for Bitcoin-native DeFi.
The project targets the scalability dilemma by integrating Solana Virtual Machine (SVM) architecture directly with Bitcoin’s security layer. With the token currently priced at $0.0136 and staking APY exceeding 89%, early entrants are positioning for the next phase of the Bitcoin ecosystem evolution.
Investors looking to hedge against spot volatility are diversifying into infrastructure layers that capture transaction volume regardless of short-term price action.
Visit the Official Bitcoin Hyper Website Here
The post Bitcoin Price Reacts as Trump Delays Iran Strike, Oil and Gold Volatile appeared first on Cryptonews.


NEW YORK — Amy Oldenburg, the head of digital asset strategy at Morgan Stanley (MS), rejected the idea that Wall Street is only now embracing crypto due to fear of missing out, arguing that large banks are acting after years of preparation.
“TradFi is getting FOMO and is now getting involved … it really isn’t accurate,” Oldenburg said during a panel at the Digital Asset Summit in New York on Tuesday. “We’ve been on a journey around the entire modernization of financial infrastructure for years.”
Her comments come as major U.S. banks, long seen as cautious on crypto or latecomers to the industry, begin to expand their offerings. For years, firms like Morgan Stanley restricted activity to indirect exposure, such as offering wealthy clients access to bitcoin funds.
More recently, that’s included spot bitcoin exchange-traded funds (ETFs) on its E*Trade platform and the bank this month even filed to launch its own spot bitcoin ETF.
Broader participation was slowed by regulatory uncertainty and concerns around custody, compliance and market structure. That stance has started to shift, and Morgan Stanley has now outlined a more defined digital asset strategy, with efforts spanning trading, asset management and infrastructure.
Oldenburg said the bank is preparing to support tokenized equities trading on its alternative trading system.
“One of the things that we are planning for the second half of 2026 is turning on our trajectory cross … to support tokenized equities later this year,” she said. The platform already handles equities, ETFs and American depositary receipts (ADRs), which she described as a natural base for expansion.
Inside the firm, the transition requires reworking core systems. “We are having to re-teach ourselves what legacy infrastructure, pipes and plumbing look like,” Oldenburg said, pointing to the challenge of upgrading decades-old financial architecture to support faster settlement and continuous trading.
She also highlighted a gap between crypto startups and large institutions.
“There’s so many other connectivity points that we need to plug in around it,” she said, noting that founders often underestimate how complex bank systems are.
Even so, areas like stablecoins are gaining traction as a way to move money faster and at lower cost than traditional systems.
Adoption, however, depends on coordination across the financial system. “We can’t just modernize on our own,” Oldenburg said. “This is an incredibly complex, integrated global network.”
Despite weak token prices, she said activity continues to build. “It really is very early innings,” Oldenburg said, signaling that Wall Street’s deeper integration with crypto may be gradual, but its underway.

NYSE Taps Securitize to Develop Tokenized Securities Trading Infra

Israeli military tortured Palestinian baby

Lavonte David retires: Buccaneers LB leaves prolific tackling legacy

Smart energy pays enters the US market, targeting scalable financial infrastructure

Why Israel is blocking foreign journalists from entering

Bitcoin: We’re Entering The Most Dangerous Phase

4 Documents Every Business Must Have? #finance #money #business #gkindia #basicgyaan

LIVE TRADING BTC GOLD | 24/03/2026 |#crypto #livetrading #btc #forex #forextrading

Money#alway#ultimate#lifestyle#travel#money#management#life#viral#trend#reservebankofindia#money
-
 Crypto World4 days ago
NIO (NIO) Stock Plunges 6.5% as Shelf Registration Sparks Dilution Worries
-

 Fashion4 days ago
Weekend Open Thread: Adidas – Corporette.com
-

 Politics4 days ago
Jenni Murray, Long-Serving Woman’s Hour Presenter, Dies Aged 75
-

 Crypto World3 days ago
Best Crypto to Buy Now: Strategy Just Spent $1.57 Billion on Bitcoin During Fear While Early Investors Quietly Enter Pepeto for 150x Potential
-

 News Videos6 days ago
RBA board divided on rate cut, unusually buoyant share market | Finance Report | ABC NEWS
-

 Crypto World3 days ago
Bitcoin Price News: Bhutan Sells $72 Million in BTC Under Fiscal Pressure, but the Smart Money Entering Pepeto Sees What the Market Does Not
-

 Politics6 days ago
The House | The new register to protect children from their abusers shows Parliament at its best
-

 Tech5 days ago
inKONBINI Lets You Spend Summer Days Behind the Register
-

 Crypto World6 days ago
Canada’s FINTRAC revokes registrations of 23 crypto MSBs in AML crackdown
-

 Sports1 day ago
Remo Stars and Kano Pillars Strengthen Survival Hopes in NPFL
-
 NewsBeat6 days ago
Residents in North Lanarkshire reminded to register to vote in Scottish Parliament Election
-

 News Videos6 days ago
PARLIAMENT OF MALAWI – PAC MEETING WITH REGISTRAR OF FINANCIAL ON AMARYLLIS HOTEL – INQUIRY LIVE
-

 Politics5 days ago
Gender equality discussions at UN face pushbacks and US resistance
-

 Business2 days ago
No Winner in March 21 Drawing as Prize Rolls to $133 Million for Next
-

 Business6 days ago
Who Was Alex Pretti? 5 Key Facts About the ICU Nurse Killed by Federal Agents in Minneapolis
-

 Sports1 day ago
Gary Kirsten Accuses Pakistan Cricket Board Of ‘Interference’, Mohsin Naqvi Responds
-

 Tech2 days ago
Give Your Phone a Huge (and Free) Upgrade by Switching to Another Keyboard
-

 Sports4 days ago
2026 Kentucky Derby horses, odds, futures, preview, date: Expert who nailed 12 Derby-Oaks Doubles enters picks
-
Sports5 days ago
Vikings Free Agency Enters Phase 2 with Key Questions
-

 Tech7 days ago
Subnautica 2 might finally be entering early access in May
You must be logged in to post a comment Login