
Crypto World
Oracle (ORCL) Shares Fall Below $150
The start of February has been negative for technology stocks, weighed down by a wave of pessimism driven by several factors, including:
→ “AI spending fatigue.” Results from Microsoft and Alphabet highlighted massive capital expenditure (CapEx). Tens of billions of dollars are being poured into servers and chips, and the market appears increasingly concerned that these costs may not be justified by actual AI-related revenues.
→ The launch of new “agent-based” AI tools (such as those released by Anthropic in early February), which has fuelled fears that AI could begin to replace software itself rather than enhance it. This has put pressure across the software sector, including Salesforce, Adobe and Oracle.
For Oracle, the situation is further complicated by plans to finance a large-scale programme in 2026 worth $45–50bn, which the company intends to fund by: 1) taking on debt; 2) issuing additional shares.
As a result:
→ analysts have downgraded their target prices for ORCL;
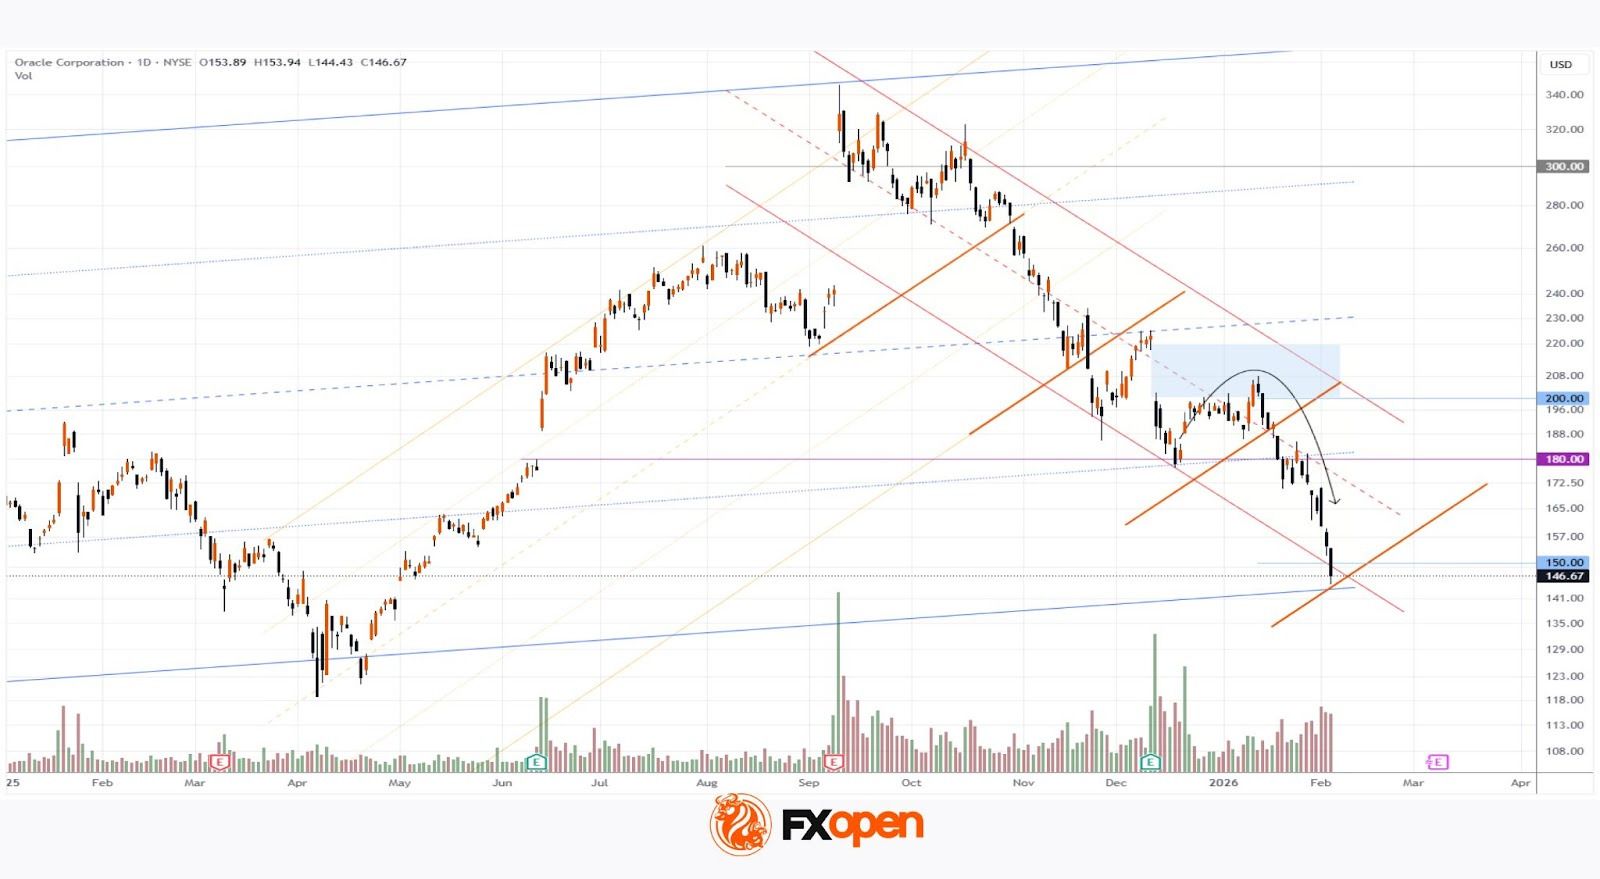
→ the share price has fallen below $150 for the first time since May 2025.

On 18 December, we noted that technical analysis of the ORCL share chart pointed to four reasons why a rebound towards the resistance area marked in blue was possible.
As the blue arrow shows, since then ORCL shares have:
→ shown signs of recovery;
→ however, a false bullish break above the psychological $200 level led to a resumption of the downtrend within the previously identified descending red channel.
The accelerating bearish momentum over the past three days may:
→ prompt weaker holders, gripped by panic, to sell ORCL shares;
→ attract “smart money”, which may view prices below $150 as appealing.
In addition, attention should be paid to the intersections of trend-channel lines from different timeframes. These may act as a cluster of support and slow the decline, giving the market a pause ahead of the quarterly earnings release scheduled for early March.
Buy and sell stocks of the world’s biggest publicly-listed companies with CFDs on FXOpen’s trading platform. Open your FXOpen account now or learn more about trading share CFDs with FXOpen.
This article represents the opinion of the Companies operating under the FXOpen brand only. It is not to be construed as an offer, solicitation, or recommendation with respect to products and services provided by the Companies operating under the FXOpen brand, nor is it to be considered financial advice.

Bitcoin foreshadows fresh market mayhem as it appears that the US-Iran war has returned, including the closure of the Strait of Hormuz oil route.
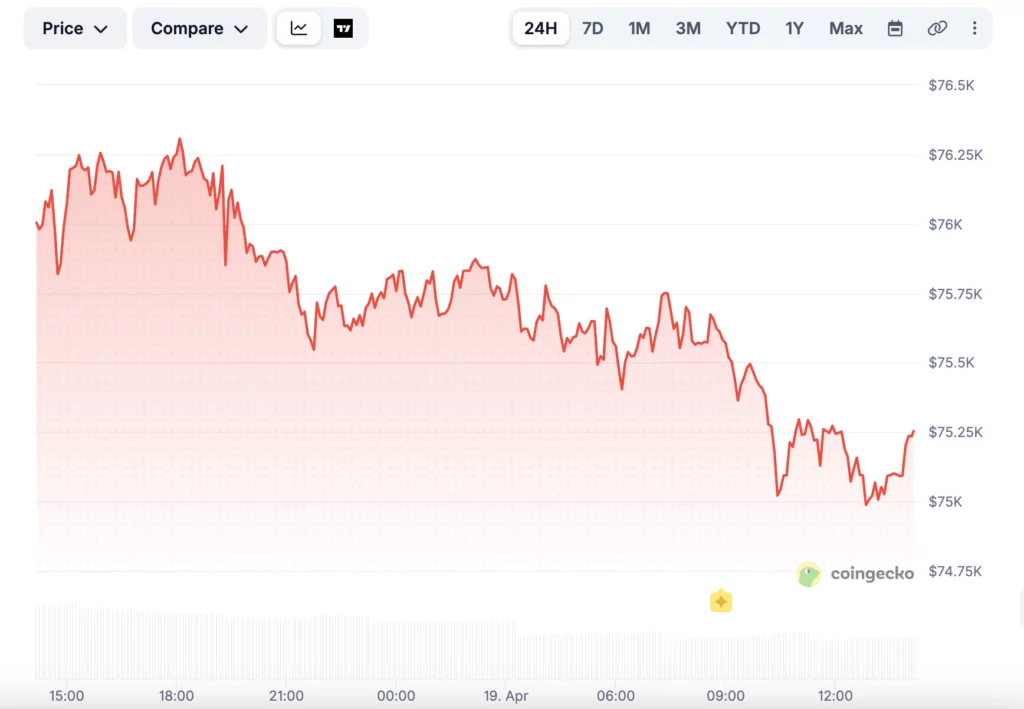
Bitcoin (BTC) sought to protect $75,000 into Sunday’s weekly close as crypto surfed fresh uncertainty over the US-Iran war.
Key points:
-
Bitcoin price action sinks from ten-week highs amid fears that the US-Iran war has returned in full force.
-
Iran closes the Strait of Hormuz, bringing back the risk of an oil-price surge.
-
BTC price action faces ongoing resistance at a 21-week trend line into the weekly close.
Bitcoin abandons highs as US-Iran war fears return
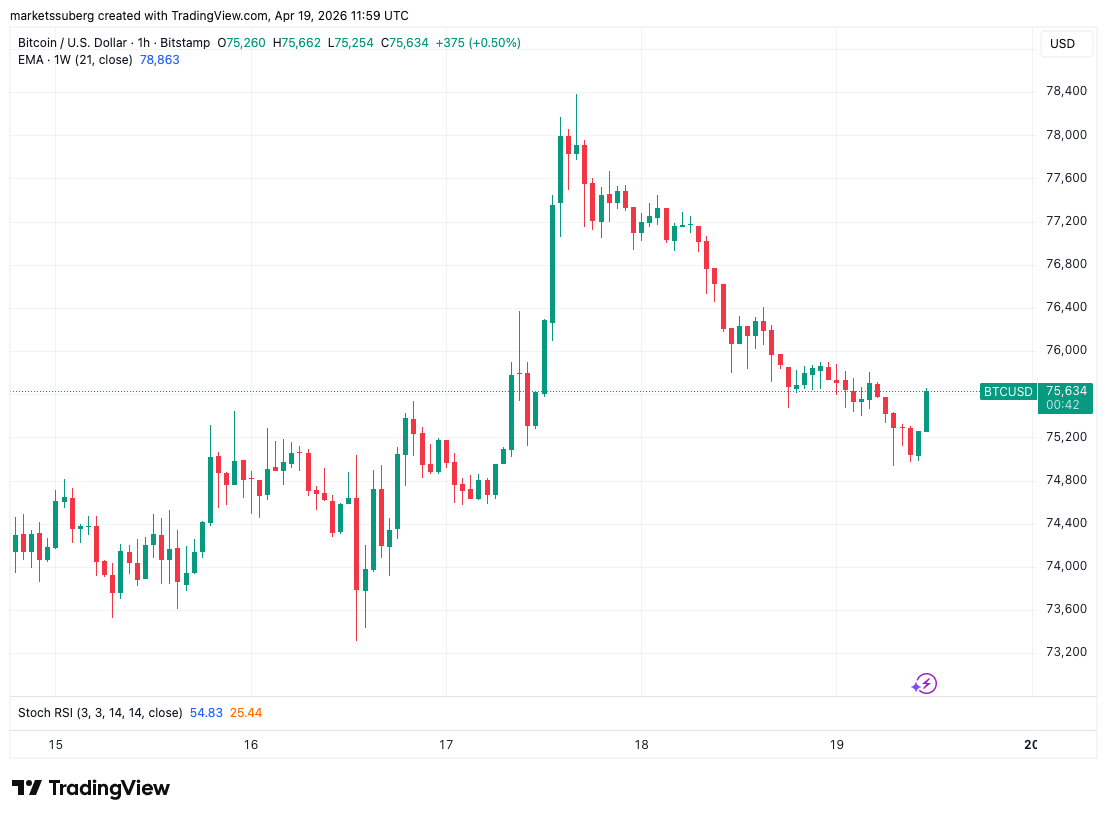
Data from TradingView showed BTC price pressure reentering after a trip to ten-week highs of $78,400 on Friday.

Mixed signals from US and Iranian sources characterized the weekend, with an assumed ceasefire and mutual agreements between the two sides now seemingly undone.
Among the latest developments was the repeat closure of the Strait of Hormuz, putting the focus on oil futures on the day. News of a ceasefire had sent WTI crude below $80 per barrel for the first time since March 10.
“We expect an eventful Sunday ahead,” trading resource The Kobeissi Letter summarized in ongoing analysis on X.

As BTC/USD circled local highs, and sentiment with it, market participants stayed cautious. Trading resource Material Indicators noted that the entire market mood could flip on relatively little input, such as a social media post.
“Sentiment is overwhelmingly bullish at the moment, but that could change with one Tweet in the coming days. Know your invalidations,” it told X followers.
Data from CoinGlass showed long positions coming under fire during the BTC price retracement, with total crypto liquidations at $260 million over the past 24 hours.

BTC price capped by resistance trend line
Continuing, trader Daan Crypto Trades eyed a potential gap in CME Group’s Bitcoin futures market opening as a result of the weekend comedown.
Related: Bitcoin can grow ‘probably a lot bigger’ than $30T+ gold market — Analysis
As Cointelegraph reported, such gaps often act as short-term price magnets when the new week begins.
“It’s going to be interesting to see the futures open today and how $OIL will react to the recent headlines regarding the strait,” he added.

Looking at the weekly close, trader and analyst Rekt Capital placed importance on Bitcoin’s 21-week exponential moving average (EMA) near $78,900.
“Bitcoin is rejecting from the 21-week EMA (green),” he observed alongside the weekly chart.
“It is this rejection that could force a post-breakout retest of the top of the Double Bottom (~$73k) next week, provided Bitcoin Weekly Closes just like this.”

This article is produced in accordance with Cointelegraph’s Editorial Policy and is intended for informational purposes only. It does not constitute investment advice or recommendations. All investments and trades carry risk; readers are encouraged to conduct independent research before making any decisions. Cointelegraph makes no guarantees regarding the accuracy or completeness of the information presented, including forward-looking statements, and will not be liable for any loss or damage arising from reliance on this content.


World has rolled out upgrades to its World ID protocol, positioning it as a wider digital identity layer for online verification.
Summary
- World ID now serves 18 million users across 160 countries with identity verification tools.
- System uses biometric scanning and cryptography to confirm humans without storing personal data.
- New features aim to block bots, deepfakes, and AI agents in digital platforms.
The system is designed to confirm whether an online user is a real person while keeping personal data private.
The network is currently used by close to 18 million people across around 160 countries. It aims to address growing issues linked to bots, automated accounts, and AI-generated identities in online environments.
World ID uses cryptographic methods to confirm uniqueness without sharing personal data. The system relies on an Orb device that scans biometric features and generates a secure anonymized identifier for each user.
The upgraded system introduces one-time-use nullifiers to prevent tracking across different services. These tools allow users to prove identity without exposing personal information or linking activity between platforms.
World ID also includes multi-key support, session control, and account recovery features. These functions are designed to improve system stability and support enterprise-level use while maintaining user control over identity data.
The company stated ”only cryptographic proofs are utilized, no personal information is stored” when describing how the system handles user data, according to project documentation.
Furthemore, World ID is being integrated into various digital services that require user verification. The system is used in areas such as ticketing platforms, gaming services, and online dating applications.
Examples include identity checks on platforms like Tinder and ticket systems designed to reduce automated resale. Tools such as Concert Kit aim to limit scalping by ensuring ticket buyers are verified individuals.
In enterprise use cases, the system has been linked to digital agreement tools and video verification services. Platforms such as DocuSign and Zoom are cited as potential integration points for human verification features.
Expansion toward AI and automated systems
The protocol also extends to AI agent environments. Developers can require human approval before automated systems complete sensitive actions or transactions.
World ID allows AI agents to be linked to verified human users. This setup is designed to support controlled automation in areas such as digital commerce and workflow systems.
The project stated ”the system enables accountability in automated environments” when describing its approach to AI integration. The focus remains on distinguishing human users from automated agents while maintaining privacy protection across digital platforms.

Former UK Prime Minister Rishi Sunak warned that the United States will recover from the 2026 Iran war far faster than the United Kingdom and Europe, calling America “the indispensable nation.”
Sunak argued that structural advantages give the US a larger buffer against geopolitical shocks. As a net energy exporter, America is shielded from the oil price spikes that have hammered import-dependent economies since the conflict began on February 28.
Why Europe Faces Greater Risk
In his column, the former prime minister pointed to a sharp asymmetry between the US and European economies.
Trade accounts for roughly 25% of US GDP, compared to 60-70% for the UK. That gap means disrupted supply chains and higher energy costs hit European economies harder.
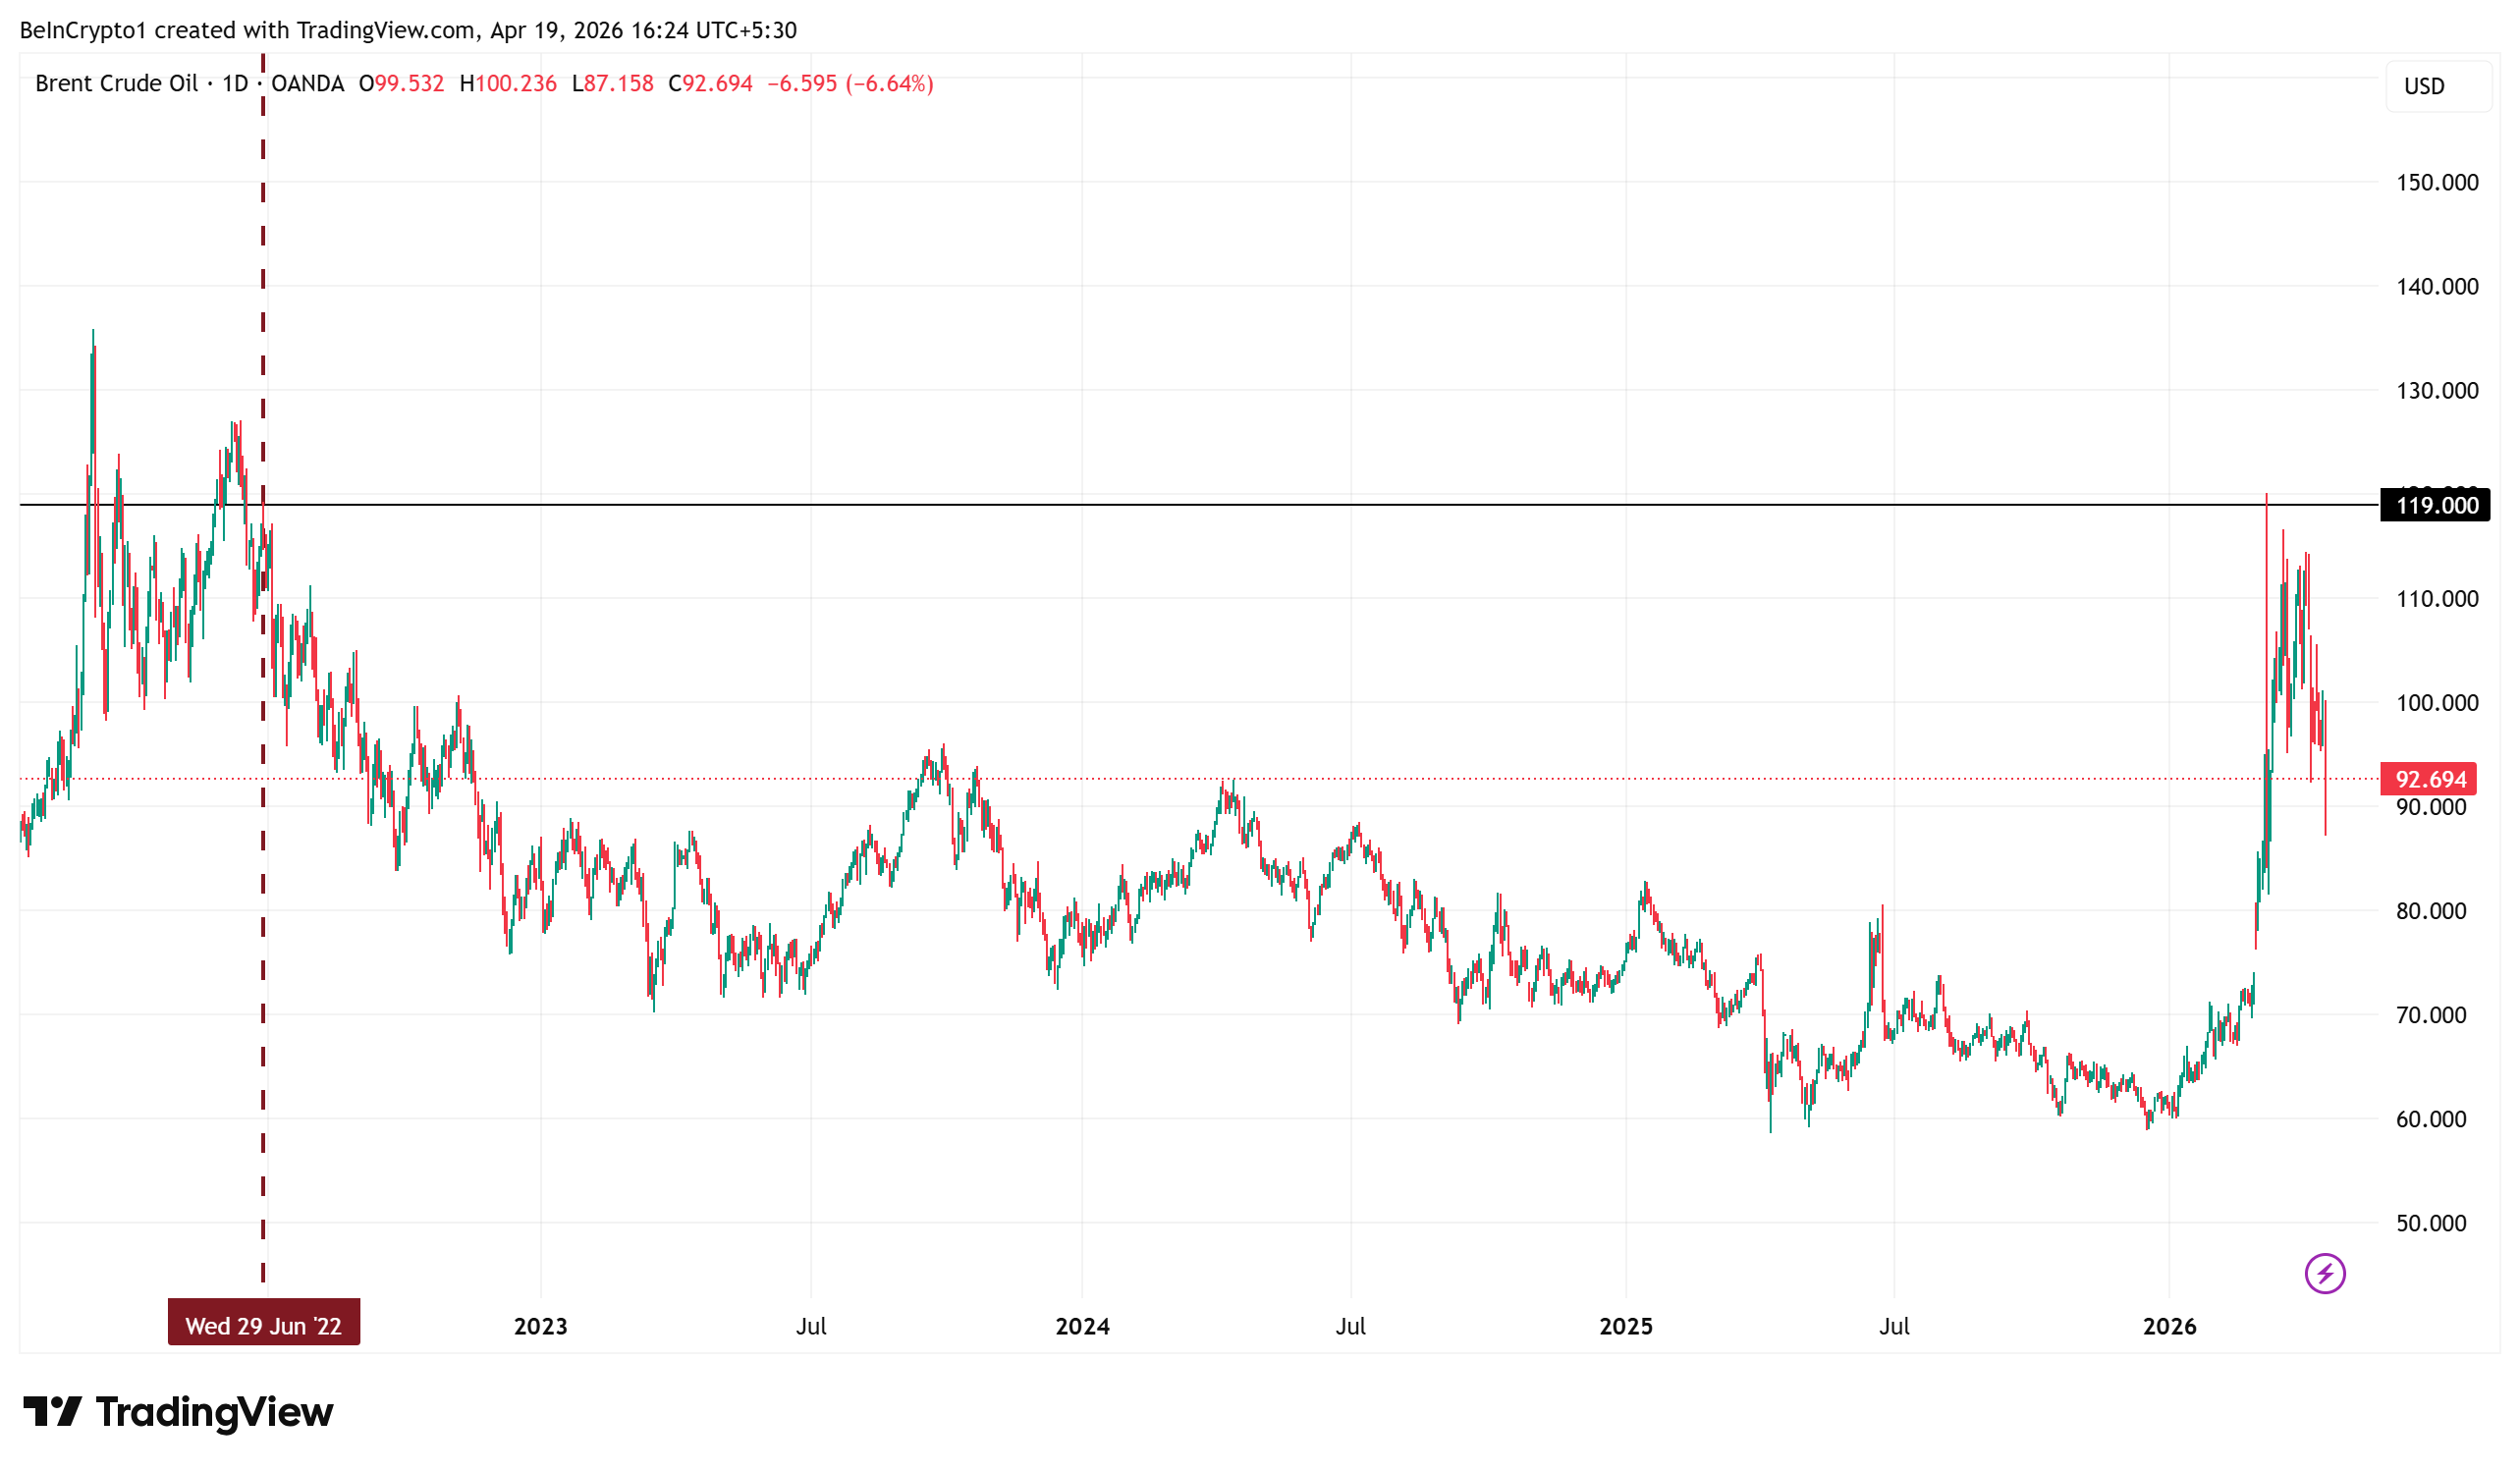
Since the Strait of Hormuz was disrupted in early March, Brent crude surged past $119 per barrel, levels last seen in June 2022. A fragile two-week ceasefire brokered in early April brought temporary relief, but oil still trades above $90.
Sunak also warned that post-WWII security arrangements are fraying. NATO allies have long underinvested in defense while relying on US commitments.
A more transactional American foreign policy, regardless of which administration holds power, accelerates that reckoning.
Sunak, who championed the UK’s ambition to become a global crypto hub during his time in office, framed his warning as a call for Europe to invest in energy independence, defense autonomy, and economic resilience rather than hoping the old transatlantic order returns intact.
The coming weeks will test whether the fragile ceasefire holds or whether a fresh escalation deepens Europe’s economic exposure.
The post Rishi Sunak Warns Europe Faces Deeper Iran War Fallout Than the US appeared first on BeInCrypto.
The BNB price prediction got a boost after BNB Chain destroyed 1.57 million tokens worth $1.02 billion in its 35th quarterly burn, dropping total supply to 134.79 million as the network pushes toward its 100 million target. That is real deflationary pressure hitting a token that already leads all Layer 1 networks with 4.5 million daily active users in Q1 2026.
But BNB gives you one way to earn: hope the price goes up. If it trades sideways for three months, your capital sat still. This breaks down where BNB heads next, why the burn matters, and how one presale pays two ways instead of one.
BNB Chain completed its 35th quarterly auto burn on April 15, removing 1,569,307 BNB from supply according to the BNB Chain Blog. The transaction is publicly verified on BSC. Blockchain.news confirmed remaining supply at 134.79 million, meaning 34.79 million more tokens still need to burn before hitting the 100 million target.
The burn follows the Fermi hard fork that cut block time to 0.45 seconds, and the network targets 20,000 TPS with sub second finality by end of 2026. Real usage drives the burns, not just price. And the presale that earns from two directions while BNB earns from one sits where utility meets the kind of entry that listings reprice overnight.
Why Holding BNB Alone Is Not Enough in 2026
BNB Gives You One Shot and Pepeto Gives You Two
You hold BNB after it dropped from $1,370 to $621, and the only way you make money is if the price climbs back, so if it trades sideways for three months your wallet shows zero gains because a single bet on direction delivers no yield and earns nothing during the wait.
Pepeto works differently by staking at 181% APY that adds tokens to your wallet daily regardless of market direction, so your holdings expand even during flat weeks as the first layer of returns, while the Binance listing eventually opens the gates and reprices the token to reflect what a working exchange handling real volume across three chains is actually worth, giving you two separate engines paying you instead of one hope and a prayer.
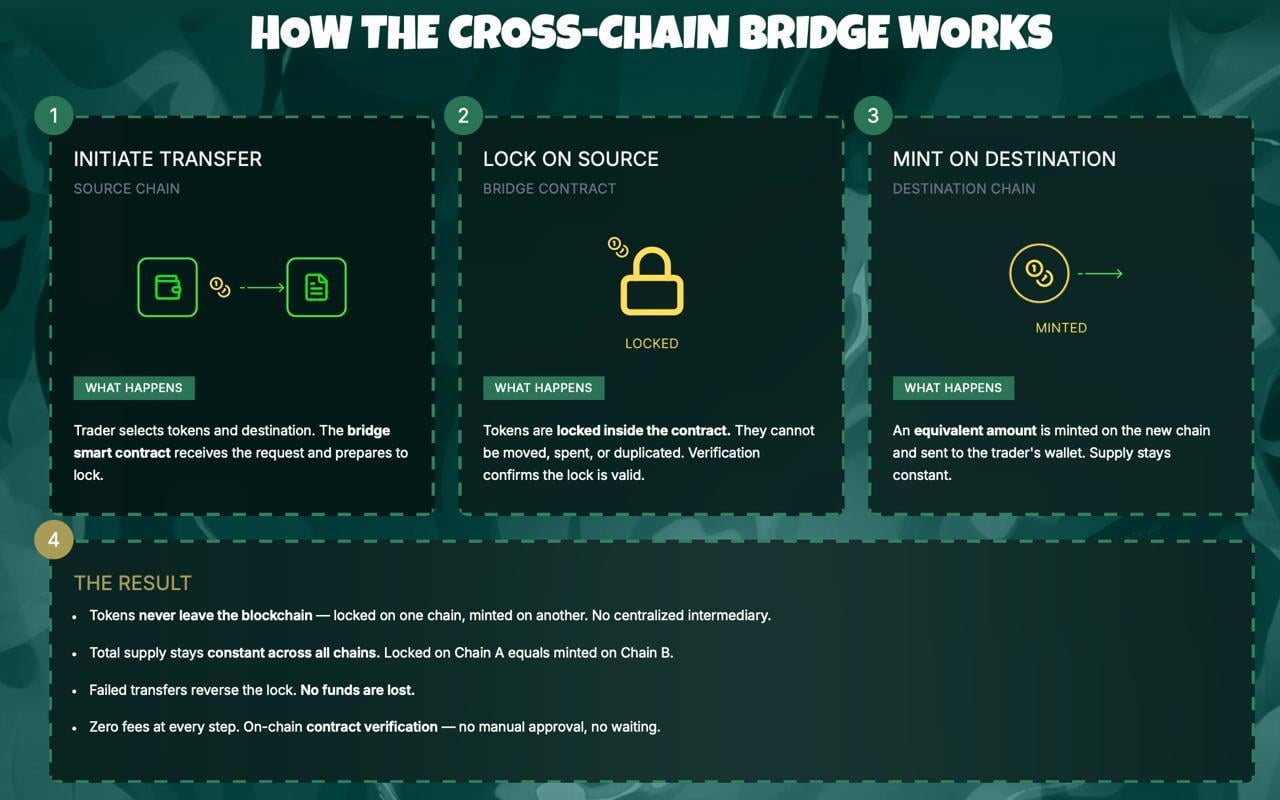
The cofounder who built Pepe to $7 billion designed it this way because one way to earn is not enough when half the market sits below all time highs, and PepetoSwap connects every blockchain with zero fee trading while the cross chain bridge handles Ethereum, BNB Chain, and Solana without gas and an AI scanner filters risky tokens before they appear, with SolidProof auditing every contract before the presale opened and $9.21 million entering during the same drawdown that took BNB from $1,370 to $621.
BNB (Binance Coin) Price at $621 as Quarterly Burn Shrinks Supply
BNB trades at $621 according to CoinMarketCap after rising 2% on the burn news. The token sits inside a $580 to $680 range, with the middle band acting as resistance. BNB Chain leads all Layer 1s with 4.5 million daily active users in Q1 and 322 million total holders, more than Ethereum’s 305 million.
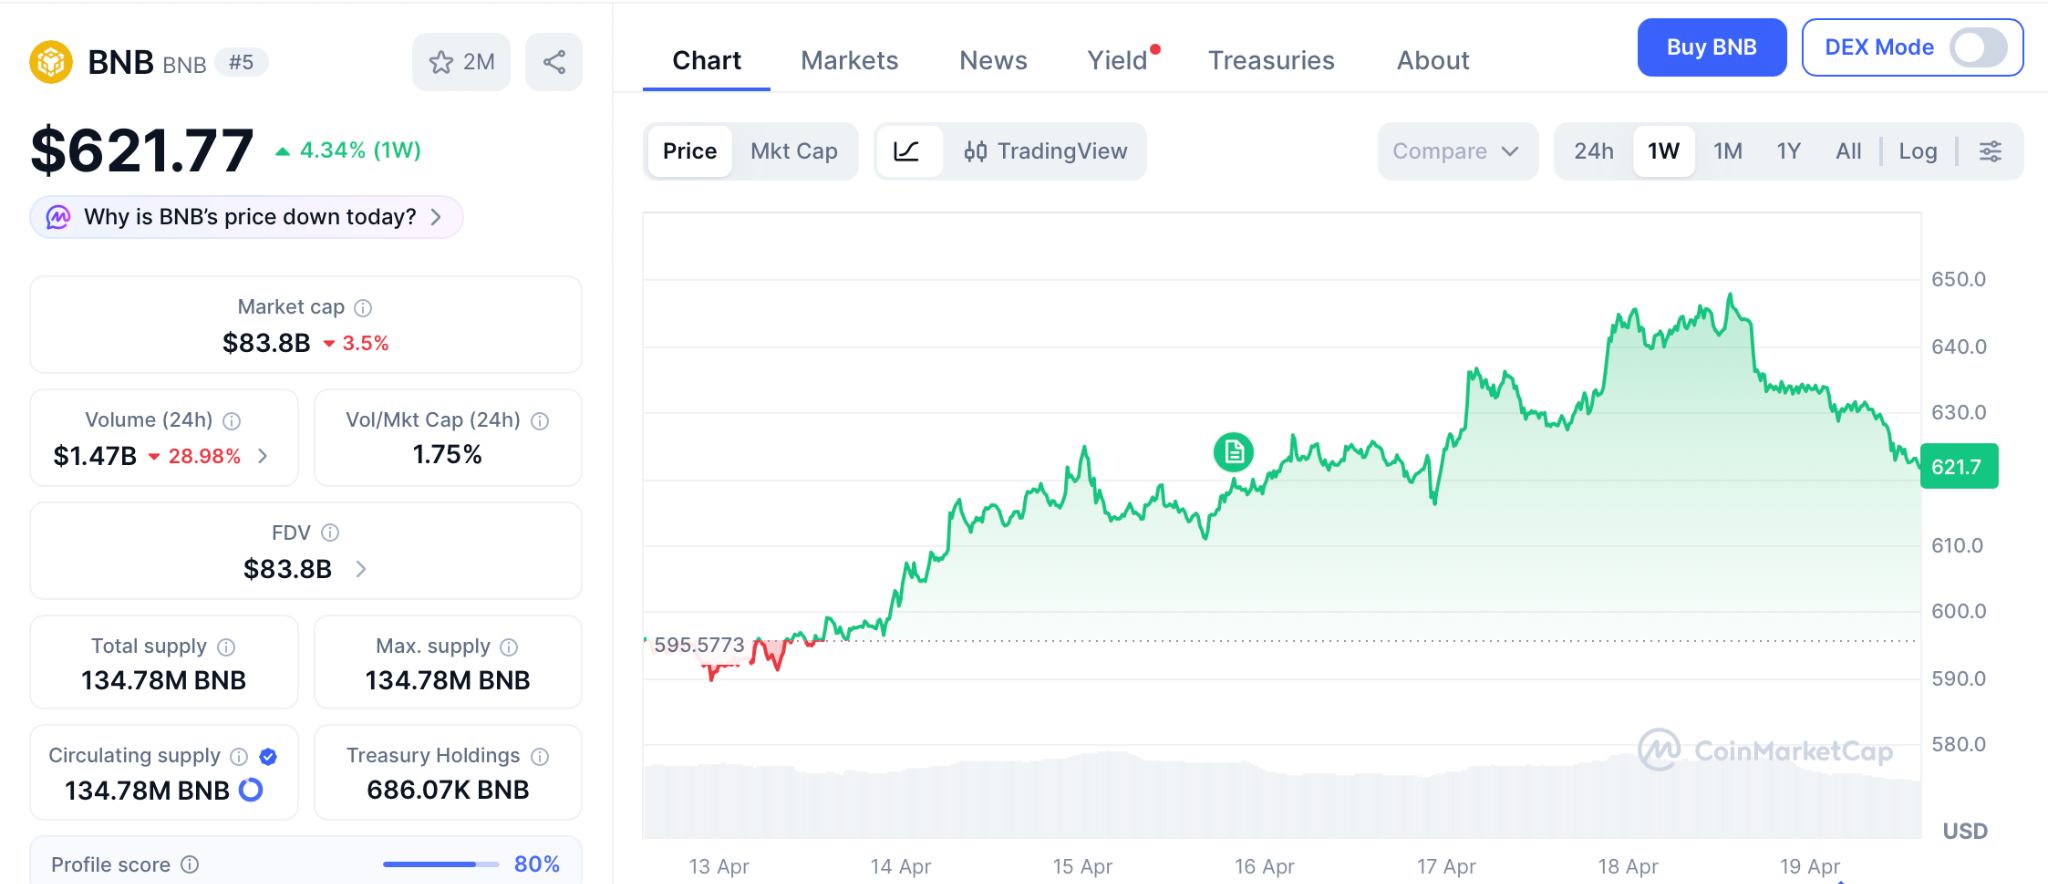
Coinpedia targets $1,000 by Q3 if $600 holds, and Changelly projects a max of $1,121 for 2026. Even the bullish case from an $85 billion market cap cannot deliver the multiples a presale at six decimal zeros creates.
Final Takeaway
Every cycle teaches the same lesson, which is that the people who earned while they waited came out ahead no matter which way the price eventually moved, and the early BNB holders who bought at $0.15 and rode it to $700 did not just sit on price action, they earned exchange rewards along the way, and that same model is exactly what Pepeto offers right now at presale while BNB just burned a billion dollars in tokens and the chart barely flinched because burns alone do not create returns.
Pepeto pays from two directions starting today, with 181% APY compounding in every wallet that already moved and the Binance listing resetting the token permanently the moment the market gets access, and $9.21 million collected during extreme fear proves the conviction is backed by real capital from wallets that ran the math, so once this window closes the entry you see right now will only exist in the portfolios of the people who acted while the rest of the market was still deciding whether to believe it.
Click To Visit Pepeto Website To Enter The Presale

FAQs
What is the BNB price prediction after the $1 billion token burn?
BNB targets $680 to $1,000 in 2026 as quarterly burns shrink supply toward 100 million. Pepeto at presale pricing with 181% APY and a confirmed Binance listing offers higher return potential from a lower base.
What is Pepeto and why is it the best meme coin presale of 2026?
Pepeto is a meme coin presale combining viral energy with real utility through PepetoSwap zero fee exchange, a cross chain bridge, and an AI contract scanner. It has raised $9.21 million with 181% APY and a confirmed Binance listing led by the Pepe cofounder.
Disclaimer: This is a Press Release provided by a third party who is responsible for the content. Please conduct your own research before taking any action based on the content.

Crypto World
Poland’s Crypto Regulation Bill Blocked Again as Presidential Veto Stands for the Second Time

TLDR:
- Poland remains the only EU member state yet to comply with the bloc’s 2024 crypto-asset directive.
- Parliament secured 243 votes to override the veto but fell 20 votes short of the required 263 threshold.
- Finance Minister Domański warned the regulatory gap turns Poland’s crypto market into a fraud haven.
- PM Tusk alleged Zondacrypto was founded with Russian mafia funds, citing Polish intelligence agencies.
Poland’s crypto regulation bill has suffered another setback after a second failed parliamentary vote. On Friday, 243 MPs voted to override President Karol Nawrocki’s veto, short of the 263 required.
This marked the second unsuccessful attempt by Prime Minister Tusk’s government to advance the bill. The legislation seeks to align Poland with EU crypto-asset rules active since 2024. Poland remains the only EU member state yet to comply with the directive.
Parliament Falls Short of Override Threshold Again
Friday’s vote was the second parliamentary attempt to override Nawrocki’s veto on the crypto regulation bill. The first veto was issued in December last year.
In the latest count, 191 MPs supported the veto while 243 voted against it. Neither figure reached the 263-vote threshold needed to reverse the president’s decision.
Tusk’s coalition argues the bill is vital for protecting consumers and investors in Poland. The government says it would shield the crypto market from foreign exploitation and sabotage.
It would also strengthen Poland’s standing in the EU’s broader regulatory framework. The coalition views compliance with EU crypto standards as an urgent national priority.
President Nawrocki, backed by the opposition Law and Justice party, has vetoed the bill twice. His office cited overregulation, lack of transparency, and burdens on small businesses.
In December, the president’s office stated the bill “threatens the freedom of Poles, their property and the stability of the state.” Nawrocki has since returned it to parliament for amendments on both occasions.
Finance Minister Andrzej Domański was direct in his response after Friday’s vote. He warned that without regulation, Poland’s crypto market becomes an “El Dorado for fraudsters.”
Domański added that investors risk losing savings without proper legal safeguards. He also noted the veto leaves consumers and entrepreneurs exposed to unfair market practices.
Zondacrypto Allegations Deepen the Political Dispute
The debate has also centered on Zondacrypto, Poland’s largest cryptocurrency exchange. The platform lobbied against Tusk’s regulatory bill.
Citing the ABW domestic security agency, Tusk accused CEO Przemysław Kral of funding foundations linked to opposition figures. Among them is former Justice Minister Zbigniew Ziobro, who faces multiple charges in Poland.
On Friday, Tusk escalated his claims, alleging Zondacrypto was founded with Russian mafia money. He also alleged ties between the platform and Russian intelligence services.
“The problem is that this company, with such sources, has become a company that sponsors political and social events in Poland and promotes very specific political forces,” Tusk said. Polish intelligence agencies were cited as the basis for those claims.
Kral denied the allegations and rejected reports of operational issues at Zondacrypto. Those reports cited withdrawal difficulties and unpaid sponsorship partners.
He added that he does not hold the key to a $330 million crypto wallet. Former CEO Sylwester Suszek, who vanished in 2022, reportedly never transferred it to him before disappearing.
Interior Minister Marcin Kierwiński confirmed the government will press on with crypto regulation. He stated the effort will continue “until we succeed, until the awareness of the threats and these strange interests connecting certain right-wing politicians with this exchange finally reaches the president.”
Poland’s path to EU crypto compliance remains politically contested. The government remains committed to achieving full regulatory alignment with the EU.


Bitcoin developer and Hashcash creator Adam Back has responded to concerns raised by Nic Carter regarding a possible quantum computing milestone in 2029.
Summary
- Adam Back rejects claims that 2029 quantum computing threatens Bitcoin’s cryptographic security.
- Google quantum timeline seen as research milestone, not practical tool for breaking Bitcoin encryption.
- Bitcoin developers work on post-quantum upgrades including new secure address and signature systems.
Carter had suggested that advances in quantum systems could challenge Bitcoin’s cryptographic security.
Back dismissed the concerns during recent comments, stating that software protection continues to improve alongside hardware developments. He also responded to claims that Bitcoin could become exposed to quantum attacks, noting that current fears are based on future assumptions rather than present capability.
Back said ”2029 is a milestone in cloud quantum systems, not a tool for breaking cryptography” when referring to Google’s research direction, according to the discussion referenced in reports.
The discussion centers on whether quantum computing could generate enough processing power to break Bitcoin private keys. Experts cited in the debate note that this would require millions of stable logical qubits with full error correction.
Current quantum systems remain in early development stages and operate under controlled laboratory conditions. These systems are not yet capable of performing cryptographic attacks at scale.
Back stated that most projections place such capability beyond the current decade, based on limitations in hardware stability and error correction progress.
Moreover, work on post-quantum cryptography within the Bitcoin ecosystem is already ongoing. Developers are testing upgrade paths that could introduce quantum-resistant address types.
These proposals include research linked to upgrade paths such as BIP-361 and similar signature schemes. The aim is to allow users to move funds to new address formats if needed through network upgrades.
Back noted that “”software protection evolves faster than hardware threats”” when describing the pace of development in Bitcoin security measures compared to quantum computing progress.
Network upgrade path and long-term planning
Bitcoin’s structure allows for protocol changes through coordinated upgrades known as soft forks. Developers have indicated that quantum-resistant features could be introduced if required without immediate disruption to the network.
Quantum computers remain in experimental stages and are not widely deployed for commercial use. Current systems do not yet present direct risk to blockchain cryptography based on existing technical standards.
The debate continues within the crypto and academic community as research into quantum computing advances and Bitcoin developers maintain focus on long-term security planning.

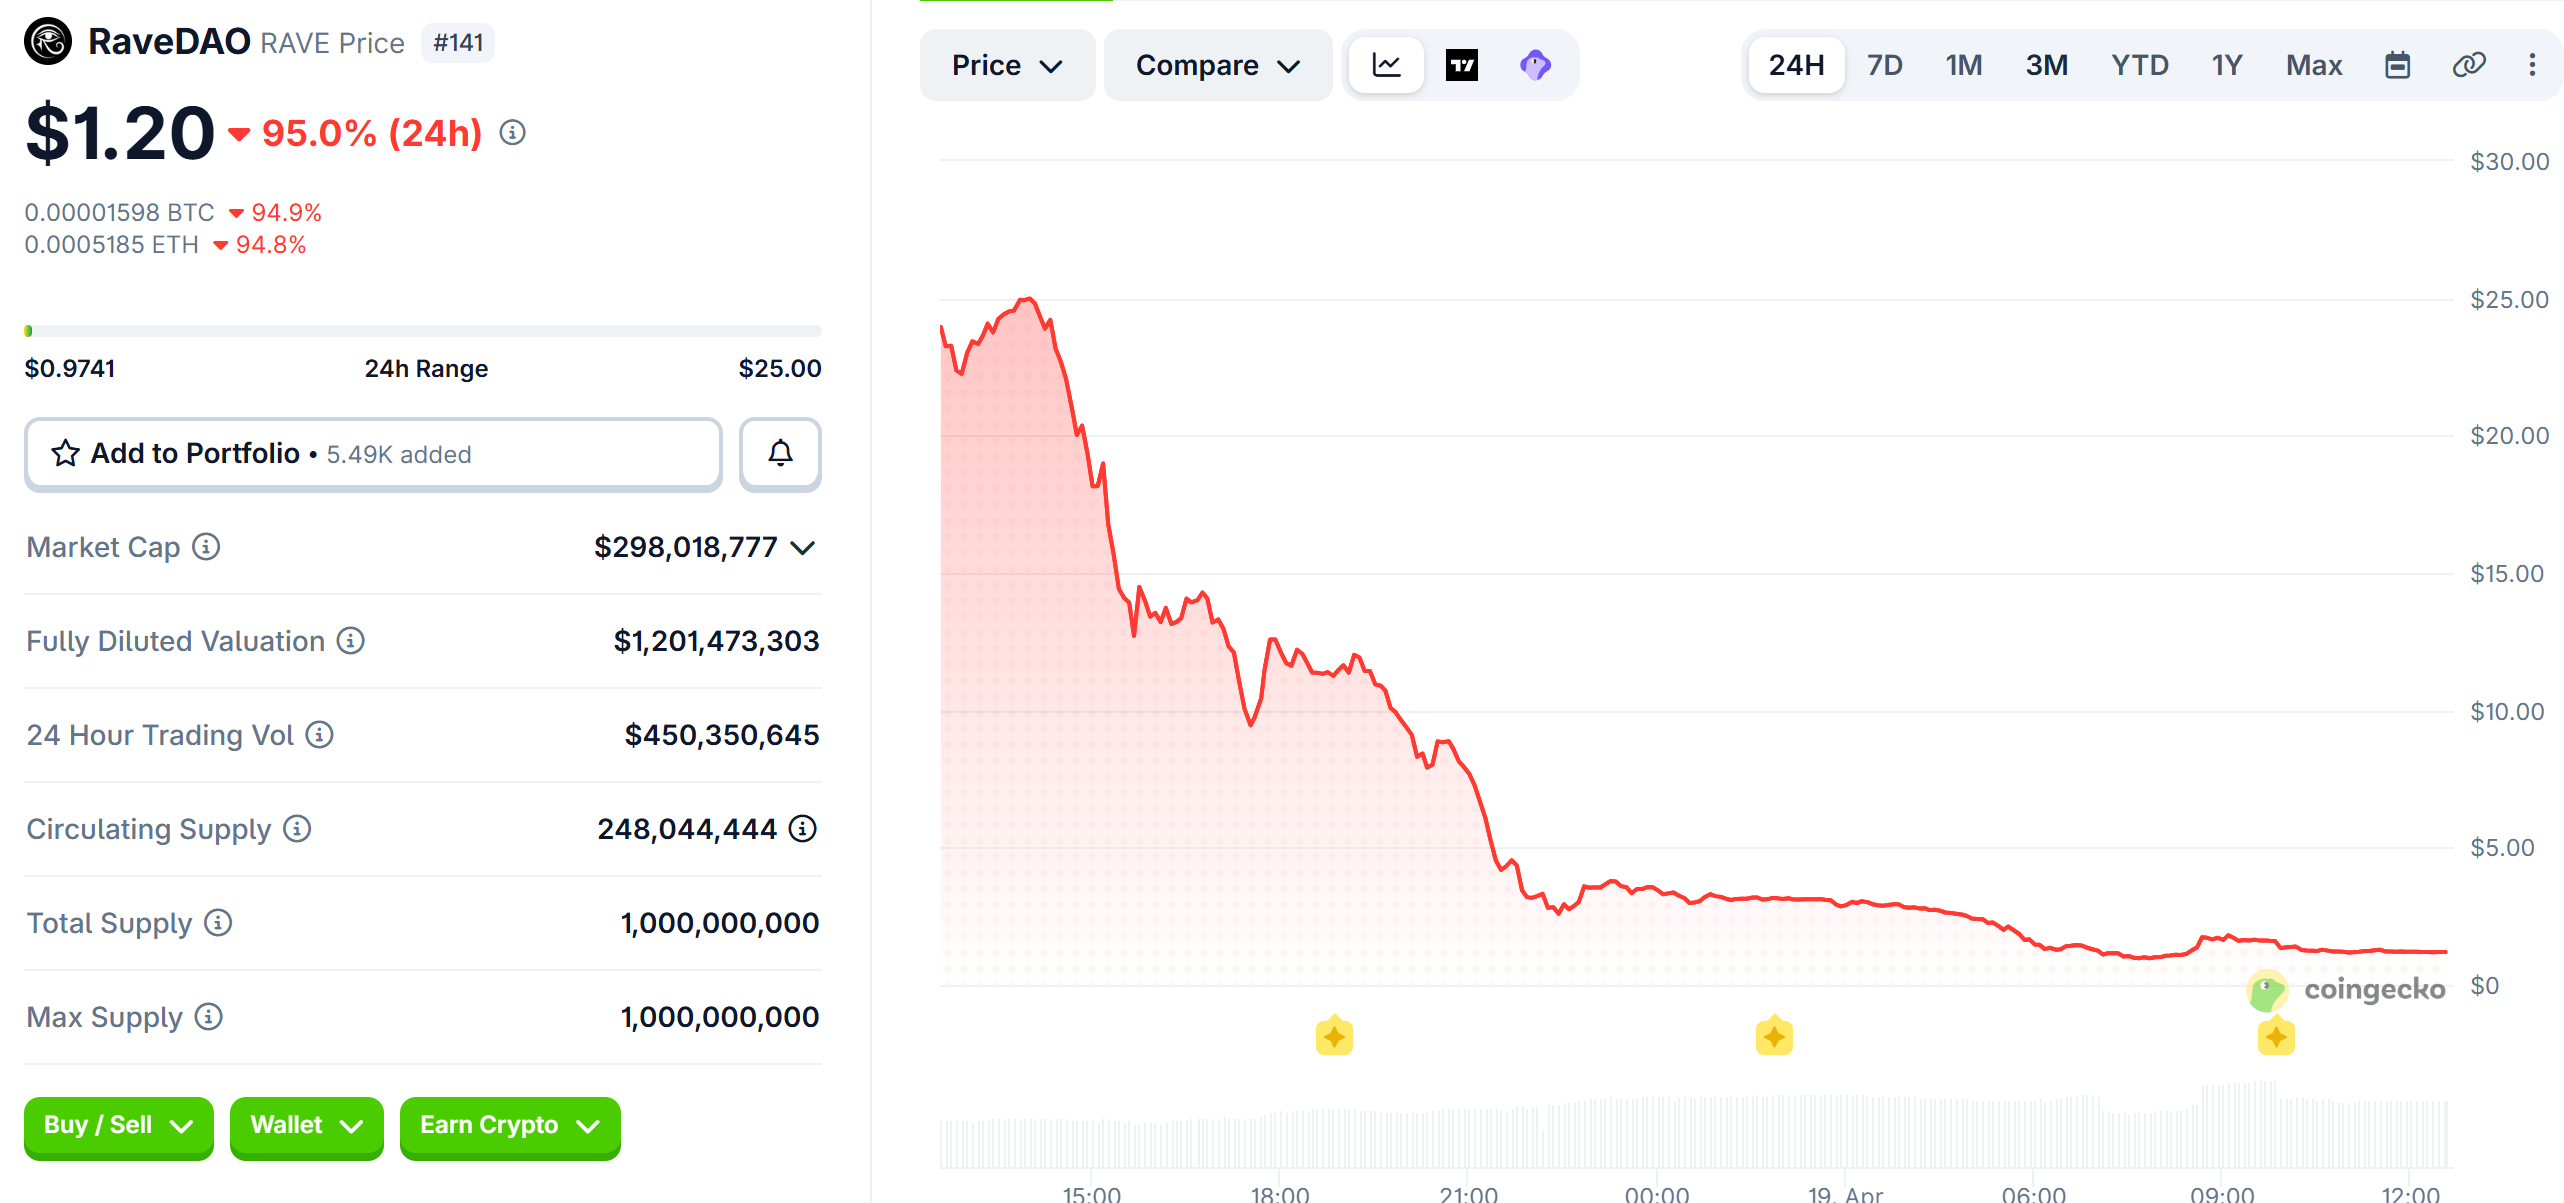
RaveDAO (RAVE) lost over 95% of its value in a single day, erasing $6.3 billion from its market cap after allegations of insider manipulation sent the token into freefall.
The collapse followed a parabolic rally that saw RAVE gain over 10,000% in two weeks, briefly pushing it into the top 20 cryptocurrencies by market capitalization.
Bitget CEO Gracy Chen Compares RAVE Crash to 2021 GameStop Frenzy
As of this writing, RaveDAO’s powering token, RAVE, is down 95% over the last 24 hours, almost reaching its floor price after topping out at $28.89 on Saturday.
Bitget CEO Gracy Chen compared the RAVE collapse to the 2021 GameStop (GME) short squeeze. She noted that GME, a struggling retailer with a fair value of $10 to $20, reached $483 on collective action alone.
Chen identified FOMO, tribal identity, and self-fulfilling prophecy as the psychological forces behind both events. She argued RAVE followed the same playbook, with X (Twitter) replacing Reddit and a meme coin replacing a physical stock.
On-chain analyst ZachXBT had previously flagged suspicious wallet movements, alleging that insiders held roughly 90% of RAVE’s circulating supply across three wallets.
Two wallets reportedly moved millions of tokens into Bitget during the token’s peak.
RaveDAO Responds to Allegations
RaveDAO denied responsibility for the price action. The team said it was exploring performance-triggered token locks and pledged to donate 20% of event profits to philanthropic causes.
Meanwhile, analyst Kyle Doops noted RAVE moved from euphoria to wipeout in days. Some traders also reported being unable to close positions on exchanges, raising further concerns about how platforms handled the volatility.
Still, some users have called out Bitget for its handling of the RAVE incident, describing the exchange’s response as immature and unprofessional.
Critics argued that liquidating user positions on both sides of the trade set a dangerous precedent. Several compared Bitget to FTX, warning that trust, not capital, is the foundation of any exchange, and once lost, it may be impossible to recover.
Both Bitget and Binance have confirmed internal reviews of trading activity surrounding RAVE.
The post Bitget CEO Draws GameStop Parallel As RaveDAO (RAVE) Falls Nearly 100% appeared first on BeInCrypto.


The North Carolina Bankers Association urged member banks to call Sen. Thom Tillis’s office this week. The trade group wants a total ban on stablecoin yield payments in the CLARITY Act.
Leadership circulated an internal email with a pre-written script for bank employees. It described the current compromise language as insufficient to prevent deposit flight into stablecoins.
Banking Lobby Escalates Pressure on Stablecoin Yield
An employee at a small Wilmington-based bank reportedly shared the email, with leadership distributing it on behalf of NCBankers.
The script demands what it calls “an airtight prohibition” on yield tied to holding payment stablecoins. It also targets carve-outs for loyalty programs and nominal activity.
Employees were told they did not need to answer questions or defend their positions. The email stated they should simply deliver the message and end the call.
CLARITY Act Markup Approaches With Unresolved Yield Dispute
The lobbying effort comes as the Senate Banking Committee prepares a markup of the CLARITY Act.
Senators Tillis and Angela Alsobrooks brokered a compromise in March that bans passive yield but permits activity-based rewards tied to transactions.
Banks argue that those carve-outs still enable a de facto yield on stablecoin holdings. However, a White House Council of Economic Advisers report challenged that argument.
Full yield allowance would displace only $2.1 billion in lending, just 0.02% of total loans.
The CLARITY Act passed the House 294-134 in July 2025. A Senate Banking Committee markup was targeted for late April, though the schedule remains fluid.
The post NC Bankers Push For Stablecoin Yield Ban on the CLARITY Act appeared first on BeInCrypto.


Alcoa is in advanced discussions to sell its Massena East smelter site in upstate New York to New York Digital Investment Group (NYDIG).
Summary
- Alcoa is in advanced talks to sell Massena East smelter site to NYDIG.
- NYDIG aims to expand Bitcoin mining operations using hydropower-linked industrial infrastructure in New York.
- Massena East site has been idle since 2014 and spans about 1,300 acres.
The update was shared by Alcoa chief executive Bill Oplinger in comments reported on Friday. Oplinger stated that the transaction “should be done in the middle part of this year” if the process continues as planned. The site is part of a wider effort by Alcoa to offload around 10 idle US smelter properties.
The Massena East facility sits along the St. Lawrence River and covers about 1,300 acres. It has been inactive since 2014 after high energy costs and global competition reduced domestic production viability.
NYDIG, a Bitcoin financial services company, would become the owner of the site if the deal is completed. The firm has already been active at the location through its partnership with Coinmint.
NYDIG took a strategic stake in Coinmint in October 2024. Coinmint operates Bitcoin mining hardware at the Massena campus under a long-term lease agreement signed with Alcoa in 2018.
The facility has access to hydropower from the New York Power Authority, which supports large-scale mining operations. The site has also been used as a hosting location for mining infrastructure over recent years.
Additionally, Coinmint has hosted mining equipment for several firms, including CleanSpark, Gryphon, and Bit Digital. Some of these clients exited as NYDIG increased its operational role at the site.
Mintvest Capital, a minority shareholder in Coinmint, filed a lawsuit earlier in the year. The claim stated that NYDIG had “effectively acquired Coinmint for roughly $200 million,” according to court filings referenced in reports.
The dispute remains part of ongoing legal proceedings related to ownership structure and valuation of the mining operation.
Shift in Industrial Sites Toward Digital Infrastructure
The sale of Massena East follows a broader trend of industrial sites being repurposed for digital infrastructure. Former smelters and heavy industrial facilities are increasingly being evaluated for data center or mining use.
Other companies have followed similar paths. Century Aluminum sold its Hawesville, Kentucky smelter to TeraWulf for $200 million, with plans for high-performance computing and artificial intelligence workloads rather than mining alone.
NYDIG has also expanded its mining capacity through acquisitions. The firm purchased assets from Consensus Technology Group and later agreed to acquire Crusoe Energy’s Bitcoin mining business. These moves added more than 390 MW of combined capacity across multiple US locations.
The Massena East deal would further extend NYDIG’s position in large-scale mining infrastructure tied to industrial power access and long-term energy contracts.

Bitcoin (BTC) has moved lower after failing to hold above its recent peak of $78,400. The asset slipped toward $75,000 following increased market pressure linked to geopolitical tensions in the Middle East.
Summary
- Bitcoin rejected near $78,400 and fell toward $75,000 after geopolitical tension reports.
- Altcoins including Ethereum, XRP, and BNB followed Bitcoin with broad market declines.
- PI token, AAVE, and WLD recorded notable losses during overall crypto market correction.
Price action shows Bitcoin had earlier climbed from below $70,500 to a 10-week high. The move followed brief optimism around reported diplomatic progress between the United States and Iran. Market sentiment shifted after conflicting reports on the Strait of Hormuz situation, leading to a rejection near the top range.
Bitcoin now trades more than $3,000 below its recent peak. Its market capitalization has eased toward $1.5 trillion, while dominance over altcoins has risen to 57.5%.
Crypto markets reacted to developments involving Iran and the United States, where statements on negotiations created mixed signals. Reports of reopening and later disruption of the Strait of Hormuz contributed to volatility in price movement.
The correction followed a strong rally earlier in the week. Bitcoin moved within a tight range between $73,200 and $75,500 before breaking higher, then reversing direction. Analysts expect continued price movement as traditional financial markets open and react to global events.
Altcoins Follow Downward Trend
Most altcoins recorded losses as Bitcoin declined. Ethereum dropped toward $2,300 after a daily decline of 3.5%. XRP moved below the $1.43 level, while BNB fell back toward $620.
Other tokens including SOL, ADA, DOGE, LINK, AVAX, and ZEC also showed declines. Market-wide selling reduced total crypto capitalization by around $100 billion since Friday, bringing the total to approximately $2.62 trillion.
Several mid-cap tokens posted larger losses. AAVE dropped more than 20% to around $92 following reports linked to a KelpDAO hack. The token M declined by about 18% to $3.50.
Pi Network’s PI token also recorded losses after rejection near $0.185. It moved lower to around $0.175, reflecting a decline of more than 8% in the latest session. PUMP and WLD also remained under pressure during the same period.
Disclosure: This article does not represent investment advice. The content and materials featured on this page are for educational purposes only.
5 Forgotten ’80s Westerns That Are Still Perfect Today

Ben McKenzie discusses his distrust of Bitcoin and cryptocurrency
The ‘significant’ lost Roman town hidden near pretty Cambridgeshire village


-
 NewsBeat7 days ago
Pep Guardiola and Gary Neville agree over Arsenal title problem that benefits Man City
-

 Crypto World6 days ago
The SEC Conditionalises DeFi Platforms to Be Avoided for Broker Registration
-

 Fashion2 days ago
Weekend Open Thread: Theodora Dress
-

 Politics7 days ago
World Cup exit makes Italy enter crisis mode
-

 Crypto World6 days ago
SEC Signals Exemption for Crypto Interfaces From Broker Registration
-

 News Videos4 days ago
Secure crypto trading starts with an FIU-registered
-

 Sports2 days ago
NWFL Suspends Two Players Over Post-Match Clash in Ado-Ekiti
-

 Crypto World5 days ago
SEC Proposes Certain Crypto Interfaces Don’t Need to Register as Brokers
-

 NewsBeat5 days ago
Trump and Pope Leo: Behind their disagreement over Iran war
-

 Politics2 days ago
Palestine barred from entering Canada for FIFA Congress
-

 Crypto World2 days ago
Russia Pushes Bill to Criminalize Unregistered Crypto Services
-

 Sports6 days ago
NWFL opens Pathway for new Clubs ahead of 2026 Season
-

 Crypto World6 days ago
Trump whales load up ahead of Mar-a-Lago luncheon.
-
 Business3 days ago
Creo Medical agree sale of its manufacturing operation
-
Business6 days ago
Kering slides after Morgan Stanley downgrade, Gucci woes loom
-
 Entertainment5 days ago
Brand New Day’ Footage Reveals the Devastating Impact of ‘Now Way Home’
-

 Politics3 hours ago
Zack Polanski demands ‘council homes not luxury flats for foreign investors’
-
Crypto World7 days ago
Sei Network Enters Quiet Reset Phase as On-Chain Metrics Signal a Slowdown in 2026
-

 Tech6 days ago
Google adds E2E encryption to Gmail for iOS and Android enterprise users
-

 Tech6 days ago
Apple glasses won’t go brand shopping like Meta did with Ray-Ban and Oakley
You must be logged in to post a comment Login