Crypto World
Order Flow Trading: Concepts, Tools and Strategies

Order flow trading is the analysis of real-time buying and selling activity to understand how market participants interact and where prices may move next. It focuses on executed orders, resting orders, liquidity, volume, and market participation. This shows the activity behind price moves, not just the moves themselves. Its purpose is to help traders identify potential trades, assess market sentiment, and make trading decisions.
Traders apply order flow analysis across forex and CFD markets. This article explains how order flow works, its components, and three order flow trading strategies.
What Is Order Flow Trading?
Order flow trading is a method that uses the analysis of executed trades, pending orders, liquidity, and volume to understand market participation and anticipate potential price movements. Applying order flow in trading involves examining where buy and sell orders might rest in the market.
To implement order flow analysis, traders focus on three components: liquidity, supply and demand zones, and trade execution.
Liquidity is the pool of resting orders waiting to trade at each level. These orders form supply and demand zones, where buying or selling has concentrated. Trade execution occurs when incoming orders meet that liquidity, and the balance between the two drives price discovery.
Much of the trading volume comes from banks and funds, so reading institutional trading activity adds context that price alone cannot give.
Order Flow vs Volume Analysis vs Price Action
Order flow, volume and price action describe market activity at different depths.
Price action reflects the shape of past price on a chart. Volume shows how much traded. Order flow shows the orders behind that trade. Order flow gives the most detail of the three.
Price action shows what happened. Volume tells you the size of activity but not its direction or intent. Order flow adds that missing layer. It shows whether buyers or sellers were the aggressors and where liquidity zones build up.
|
Price action |
Volume analysis |
Order flow |
|
|
Measures |
Price movement over time |
Quantity traded |
Orders behind each trade |
|
Shows |
What price did |
How active the move was |
Who was aggressive, where liquidity sits |
|
Common tools |
Candlesticks and chart patterns |
Volume bars, volume profile |
Footprint charts, DOM, cumulative delta |
|
Limitation |
No trade size |
No direction or intent |
Complex |
Tools such as volume profile, Volume-Weighted Average Price, Volume-Weighted Moving Average sit between volume and order flow analysis, mapping volume across price to hint at order concentration. The practical trade-off is depth of insight against complexity. Order book analysis is the most detailed but also the hardest to read.
Core Components of Order Flow Analysis
In the realm of trading, dissecting the order flow is akin to peering into the heart of the market, revealing the intentions of traders through the movement of buy and sell orders.
The sections below cover the main chart components in order: order blocks, market structure and trends, imbalances, and volume. The commonly used order flow tools then follow, namely footprint charts, depth of market (DOM), also called market depth, and cumulative delta, alongside the volume profile.
Understanding these components allows traders to interpret order flow directly from the chart, providing insights into where the market might head next based on past and present trader actions.
Order Blocks (Supply and Demand Zones)
In analysing order flow on a chart, order blocks, or supply and demand zones, appear as areas where price action has shown significant movement away from a particular level, indicating a concentration of buy (demand) or sell (supply) orders.
These zones are typically highlighted by a sudden surge or drop in price, leaving behind a footprint where future price often reacts. For example, a demand zone might be identified by a rapid price increase from a specific area, suggesting buyers overpowered sellers significantly.
An order block marks where unfilled orders cluster, forming dense liquidity zones before a sharp move. When price revisits these supply and demand zones, those resting orders can absorb or repel it, which is why the area often produces a reaction. Blocks left by institutional trading activity tend to be the clearest.
Market Structure/Trends
The market structure, or trend, is visible through the series of highs and lows on a chart. An uptrend is recognised by ascending peaks and troughs, while a downtrend is marked by descending peaks and troughs. These structures show order flow traders the prevailing direction of market sentiment.
Trend continuation is central to market structure trading. In an uptrend, buyers repeatedly absorb supply at higher levels, and each higher low marks a fresh trading imbalance in their favour. In a downtrend, sellers repeatedly absorb demand and push prices lower, while each lower low signals a fresh supply–demand imbalance in their favour.
That imbalance has to persist for the trend to hold. When opposing flow takes over, the run of higher highs or lower lows breaks, which often signals a shift in market structure rather than a pause.
Imbalances
Imbalances manifest as large, directional candles that break away from a consolidation area, signifying a sudden imbalance between buyers and sellers. These are often accompanied by increased volume, which may suggest a strong commitment from traders to move the price in a specific direction.
In ICT and order flow terminology, this kind of gap usually appears in the form of a fair value gap. It forms when price moves so fast that one side barely trades, leaving a three-candle gap where little business was done. Traders mark these gaps because price often returns to fill them, rebalancing the orders that were skipped. A trading imbalance that stays unfilled can act as a magnet for future price, while one that fills cleanly tends to confirm the move that created it.
Volume
Volume is directly observable on a chart, usually depicted as bars beneath the price action. High volume bars accompanying significant price moves validate the strength of that move, implying a robust interest from the market in that price level. Conversely, low volume may indicate a lack of conviction, suggesting that the price move may not be sustainable.
Volume confirmation and order flow confirmation differ. Volume shows how much traded, confirming a move had participation behind it, but not who was in control. Order flow confirmation goes further, showing whether buyers or sellers were the aggressors at each level. A volume profile bridges the two by mapping where volume built up across price, though only footprint and delta data confirm the direction of that activity.
Footprint Charts and Cumulative Delta
A footprint chart shows the volume traded at the bid and at the ask inside each price bar. It reveals who was aggressive at every level, not just where price closed. Cumulative delta then tracks the running net of that buying against selling, turning the detail into a single trend line.
Bid and ask volume sit at the centre of this. Volume traded at the ask comes from aggressive buyers lifting offers. Volume traded at the bid comes from aggressive sellers hitting bids. Delta is the difference between the two within a bar, a positive figure when buyers dominate and a negative figure when sellers do.
Cumulative delta adds each bar’s delta to a running total. A rising line shows net buying building over time, while a falling line shows net selling. The most watched signal is divergence. If price makes a new high but cumulative delta does not, the buying behind the move may be weakening. Footprint and delta data are standard in centralised futures markets, where every trade is recorded at the exchange, which is why they appear so often in order flow study.
Depth of Market (DOM)
The depth of market, or DOM, is a live ladder of buy and sell orders waiting at each price. It is also called the order book, or market depth. The bid side lists resting orders to buy below the current price. The ask side lists resting orders to sell above it. The size at each level shows where liquidity is stacked.
Reading this ladder, sometimes called DOM trading, is a form of order book analysis that aids short-term price discovery. A centralised exchange shows the full depth of the market. OTC forex does not, because there is no central book and each broker sees only its own flow. This is the main limit on order flow trading in forex, which pushes traders toward liquidity and supply-demand methods, or toward futures data as a proxy. Even on exchanges, book depth alone can read liquidity incompletely.
Interested readers can learn more about these components and how they interact with each other in our comprehensive article on order flow analysis.
Order Flow Trading Strategy Examples
Let’s now take a look at how these components can be used in three order flow trading strategies.
The three examples below are educational illustrations of how order flow concepts fit together. They are not trading recommendations, and no setup works every time. Each one shows how tools such as order blocks, liquidity and moving averages might combine in an order flow trading strategy. Any approach can be tested on a demo account.
If you are ready to try these approaches on live markets, you can consider trading with them on FXOpen’s TickTrader platform.
Liquidity Sweep at Order Block/Supply or Demand Zone

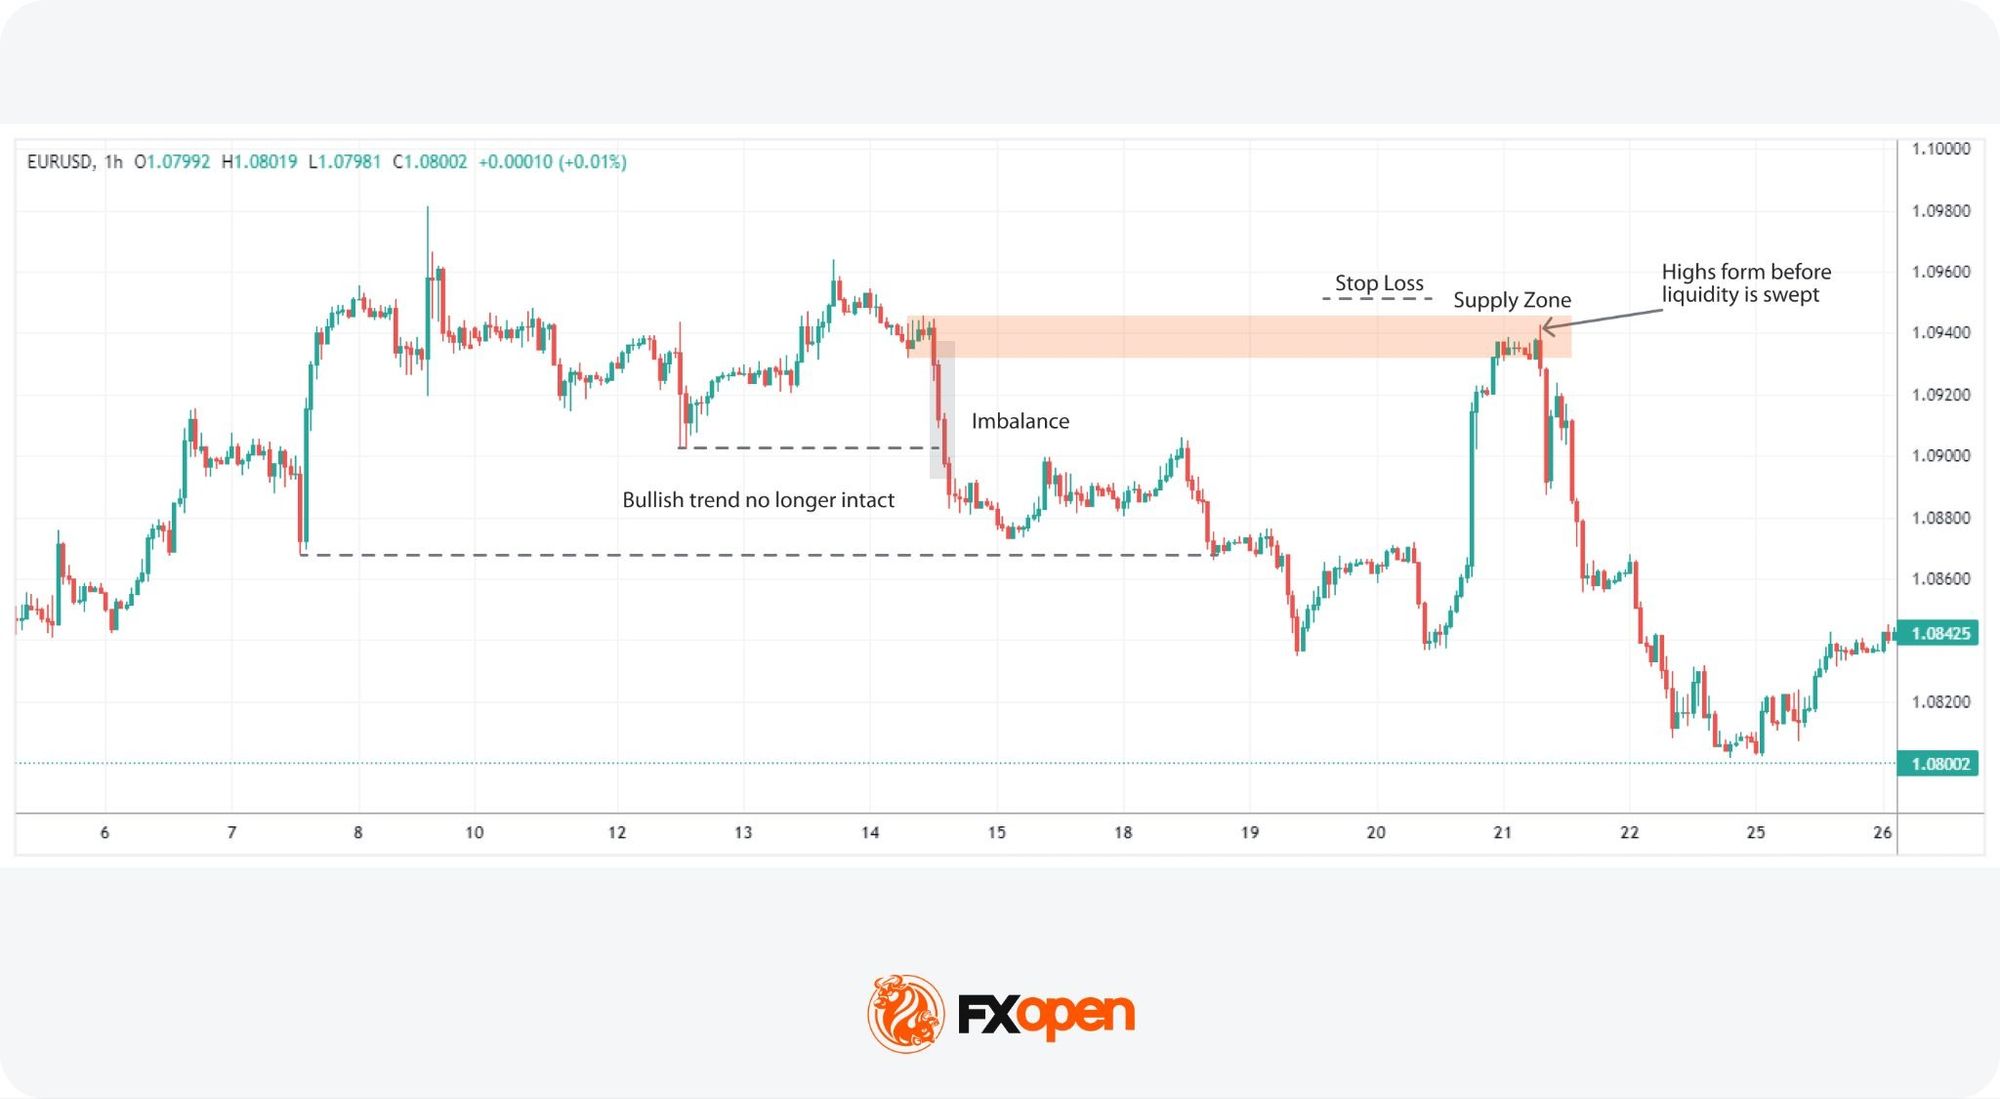
A liquidity sweep is a quick push past an obvious high or low, where stop orders and breakout orders rest, followed by a sharp reversal. The move taps that pooled liquidity, fills large orders against the crowd, then turns. Spotting the sweep and the snap-back is what separates this setup from a plain breakout.
The concept of a liquidity sweep within an order block stands out for its nuanced approach to capitalising on market reversals. This strategy hinges on the premise that price movements in these critical zones often preclude a significant direction change, making them ripe for reversal entries.
However, while leaving a simple limit order at these areas may be tempting, unforeseen news or a strong trend can cause the price to trade beyond it. Therefore, the theory states that looking for confirmation is important. Using the idea of a liquidity sweep or a bull/bear trap, traders can identify higher probability setups in these areas.
Entry
- Traders typically identify an order block, marking zones that prompted a significant imbalance and strong directional price move.
- Watching for the price to approach these zones is important, with a keen eye on the price action within the zone for signals of a potential reversal.
- The formation of new highs in a supply zone or lows in a demand zone accompanied by a liquidity sweep (a brief breach of these highs/lows followed by a quick return) might serve as a trigger for entry.
- The appearance of reversal patterns, like a shooting star, hammer, or engulfing candlestick, may indicate the market’s rejection of prices beyond the zone.
Stop Loss
- Traders could place a stop loss just beyond the boundary of the supply or demand zone.
Take Profit
- Profit targets might be set at the nearest opposing supply or demand zone, usually where another significant imbalance lies.
Moving Average Crossover at Order Block/Supply or Demand Zone
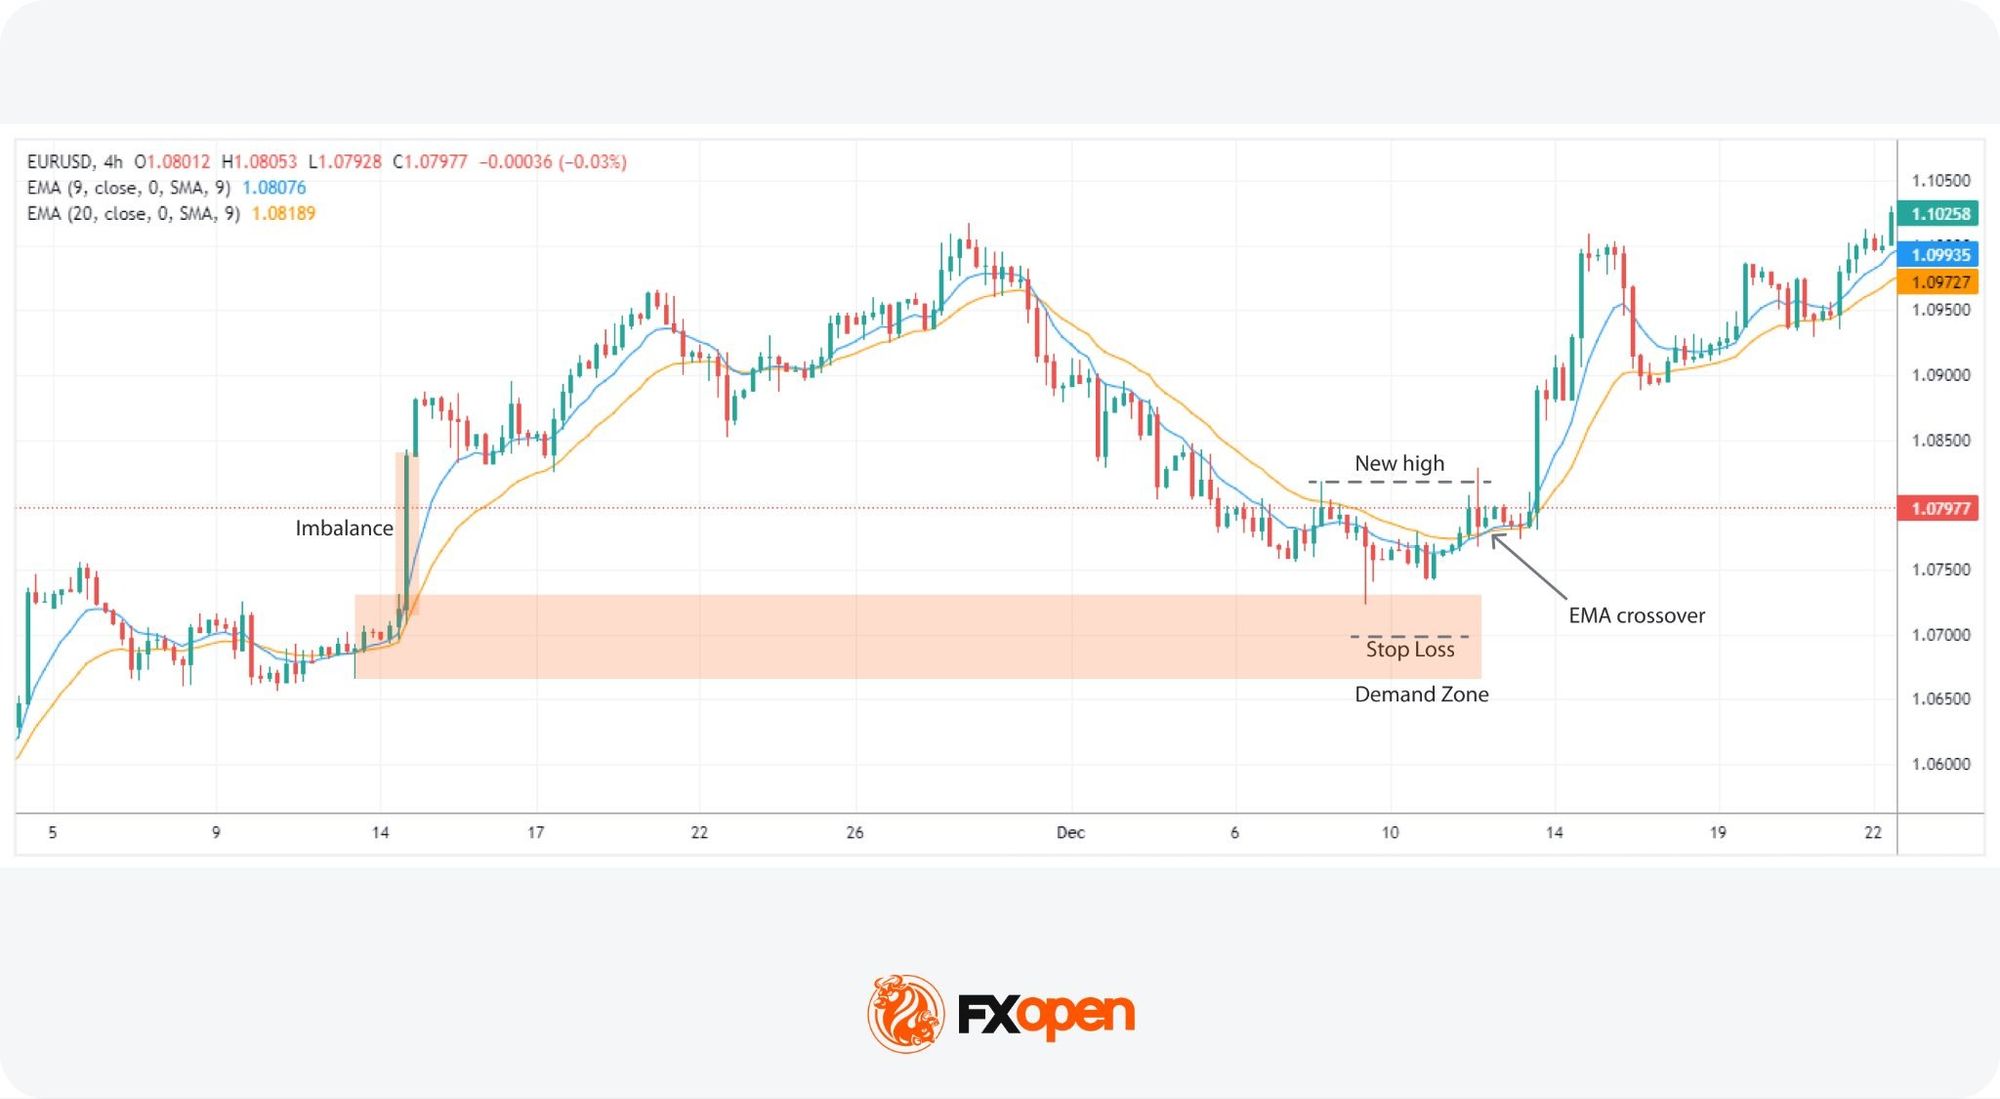
Integrating moving averages into the analysis of order blocks or supply/demand zones offers traders a quantitative lens through which market sentiment can be gauged more precisely. This strategy particularly revolves around the utilisation of two moving averages.
We’ve used Exponential Moving Averages (EMAs) with periods of 9 and 20, leveraging their sensitivity to price movements to identify potential reversal points within these critical market zones. However, traders can use whichever type or length they prefer, though a balance should be struck between responsiveness and mitigating false signals.
Note that moving averages are confirmation tools here, not order flow indicators. They read prices, not orders, so they confirm an order flow signal at the zone rather than generate one.
Entry
- The trader identifies an order block where a substantial move has previously occurred, leaving behind a noticeable imbalance in the price chart.
- As the price revisits this zone, attention is directed towards the EMAs’ behaviour. For instance, a crossover of the 9-period EMA above the 20-period EMA signals bullish momentum, whereas its crossover below the 20-period EMA reflects bearish momentum.
- Entry might be considered once the moving average crossover aligns with the anticipated direction of the reversal, indicating a strengthening trend.
- This signal might be further validated if accompanied by a liquidity sweep or specific candlestick patterns within the zone.
Stop Loss
- A stop loss could be placed beyond the zone’s extremes.
- Given the added confidence from the moving average crossover, the stop loss could also be positioned just beyond the most extreme high or low when the price entered the zone.
Take Profit
- The take-profit target might be set at an opposing supply or demand zone. Such zones are anticipated to act as natural barriers where the next significant price reaction could occur.
Impulse and Correction Stop Order
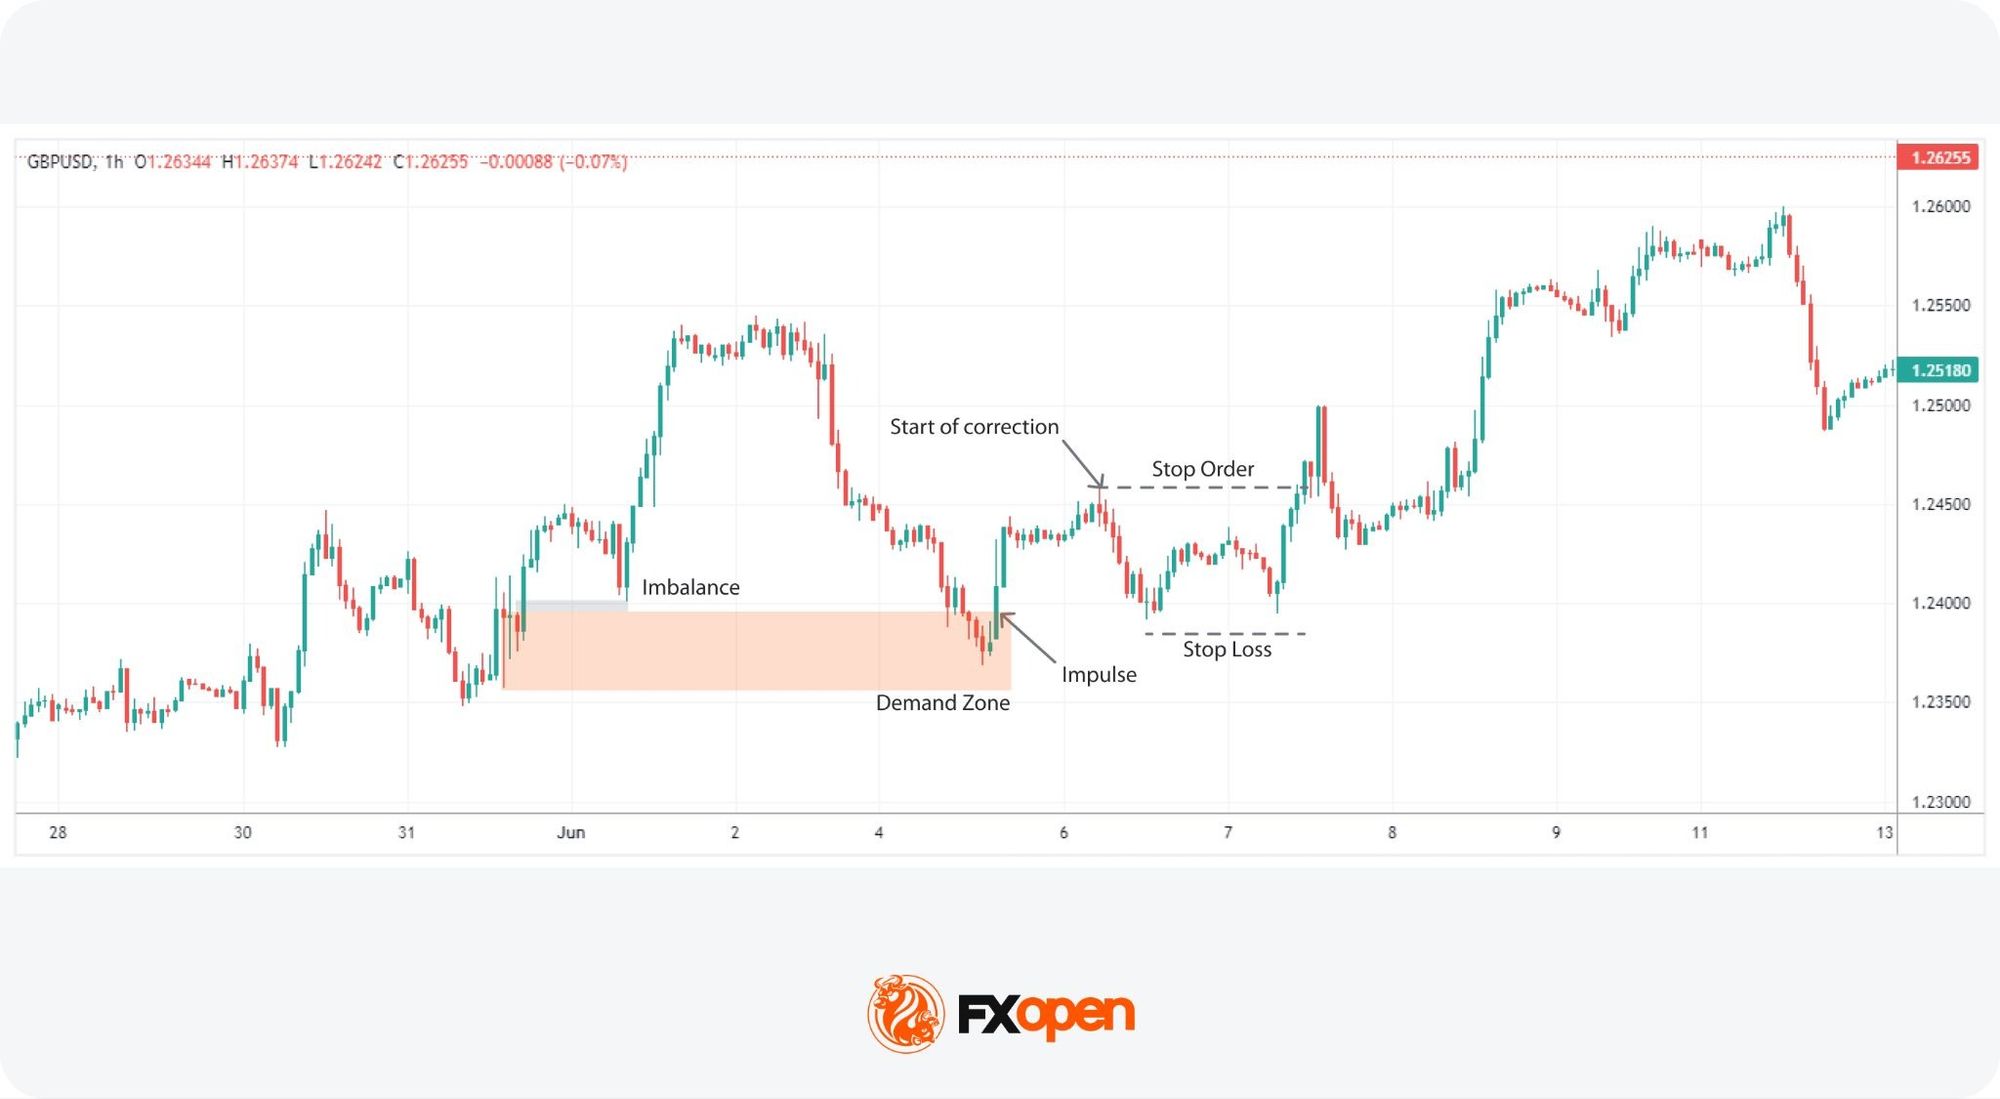
The Impulse and Correction Stop Order strategy leverages the dynamic reaction of prices at supply or demand zones, focusing on the price action that follows these pivotal areas.
Recognising that initial reactions from these zones can be sharp, signalling strong market rejection, this approach waits for a pullback or correction as a secondary entry point. This method is popular among traders looking to capitalise on the momentum shift or those who may have missed the primary reversal within the zone.
An impulse is the first sharp move out of a zone, where one side overwhelms the other. The correction is the slower pullback that follows, as price drifts back toward the zone. Often it refills the trading imbalance left by the impulse, trading through the gap the fast move skipped. That refill is what offers the second entry.
Entry
- Traders monitor for a pronounced impulse move away from a supply or demand zone, indicating strong market rejection of these levels.
- A subsequent pullback or correction phase is observed, ideally filling the imbalance left by the initial impulse. This correction signals the market’s natural attempt to retest the zone before a potential markup or markdown begins.
- A stop order might be set at the low (for bearish setups) or high (for bullish setups) that initiated the correction. This positioning aims to capture the breakout moment that confirms the market’s commitment to the new direction.
Stop Loss
- The stop loss might be placed beyond the correction. This placement is strategic, potentially minimising loss if the anticipated breakout does not materialise and the correction reverses direction.
Take Profit
- The take-profit point might be chosen within a suitable opposing zone, considering the optimal risk/reward ratio or strong support/resistance levels.
Key Takeaways
Order flow trading in forex and CFDs provides a deeper understanding of market behaviour by revealing how buyers and sellers interact through executed trades, resting orders, liquidity, and volume. By combining key concepts with tools such as the order book, footprint charts, and volume profile, traders can gain valuable insight into market sentiment and potential price direction.
While no method guarantees favourable outcomes, understanding order flow may support traders’ decisions across financial markets.
To study any order flow trading strategy on live charts, you can consider opening a trading account with FXOpen and use the TickTrader platform.
FAQs
What Is Order Flow in Trading?
Order flow represents the myriad of buy and sell orders executed in the market. It acts as a snapshot of market sentiment, showing where and how traders are placing their orders, which in turn influences price movements.
How Do Traders Read an Order Flow?
Reading order flow involves analysing the data on the volume of trades, the price levels at which they are executed, and the type of orders (buy or sell). Traders often use specialised software that visualises these data points, though they can be identified on charts through the use of order blocks and imbalances.
How Do Traders Trade an Order Flow?
Trading order flow typically involves looking for signs of imbalance between buy and sell orders and trading from order blocks. Traders often enter positions based on the anticipation that price will fill these imbalances and reverse from order blocks.
Why Is Order Flow Important in Trading?
Order flow is important because it provides insights into the immediate direction of the market, revealing the underlying demand and supply dynamics, which can be important for decision-making.
What Is the Difference Between Order Flow and Volume?
While closely related, order flow technically refers to the detailed list of transactions (buy and sell), whereas volume measures the quantity of an asset traded over a period. Order flow gives insight into the specifics of market transactions, while volume indicates the level of activity.
What Is the Difference Between Order Flow and Price Action Trading?
Order flow trading focuses on the underlying transactions that drive market movements, whereas price action trading relies on analysing the price movements themselves. Price action traders study charts for patterns and trends without necessarily considering the specific buy and sell orders that cause those movements.
What Tools Are Commonly Used for Order Flow Analysis?
The most common order flow analysis tools are footprint charts, depth of market, cumulative delta and the volume profile. Footprint charts show bid and ask volume per bar, DOM lists resting orders, cumulative delta tracks net buying against selling, and volume profile maps volume across price levels.
Can Order Flow Be Used in Forex Trading?
Yes, but with limits. Order flow trading in forex cannot draw on a full central order book, because forex trading is decentralised and each broker sees order flows of a particular broker. Traders instead read liquidity, supply and demand zones, and footprint or delta data from correlated futures as a proxy.
What Is a Cumulative Delta in Trading?
Cumulative delta is the running total of delta, where delta is ask volume minus bid volume in each bar. It shows whether net buying or selling is building over time. When price rises but cumulative delta falls, the move may lack support, a divergence traders watch for.
This article represents the opinion of the Companies operating under the FXOpen brand only. It is not to be construed as an offer, solicitation, or recommendation with respect to products and services provided by the Companies operating under the FXOpen brand, nor is it to be considered financial advice.
You must be logged in to post a comment Login