

Crypto World
Pennant Pattern in Trading: Identification and Breakout Strategy

The pennant pattern is a continuation chart formation frequently observed in forex and CFD markets during periods of strong directional momentum. It develops after a sharp price movement followed by a brief consolidation phase, reflecting temporary equilibrium before potential trend continuation.
Unlike reversal patterns, a pennant forms within an existing trend structure and is commonly used by traders to analyse breakout conditions, organise entry planning, and define risk parameters using measurable price projections. The pattern’s compact structure allows market participants to evaluate volatility contraction and subsequent expansion within a clearly defined technical framework.
This article examines how bullish and bearish pennant patterns are identified across different market environments, how breakout scenarios are evaluated step by step, how price targets are derived using the flagpole measurement method, and how false breakouts can be filtered through confirmation techniques and professional trading tools.
Key Takeaways for Professional Traders
- A pennant is a continuation chart pattern in forex, equity, commodity, and crypto* markets. It’s formed during volatility contraction.
- Breakout confirmation requires volume expansion.
- Targets are typically projected using flagpole measurement.
- The pattern is more popular in trending, high-momentum markets.
What Are Pennant Chart Patterns?
A pennant pattern is a short-term continuation chart formation that develops after a sharp directional price move and signals a potential breakout in the direction of the prevailing trend. The pennant pattern’s structure is:
- Flagpole — a strong impulsive move driven by momentum and liquidity imbalance.
- Consolidation phase — price compresses within converging trendlines.
- Breakout — volatility expansion as price exits the pattern in the direction of the prior trend. The breakout should be accompanied with high volumes.
Pennants reflect a pause in momentum rather than a structural reversal.
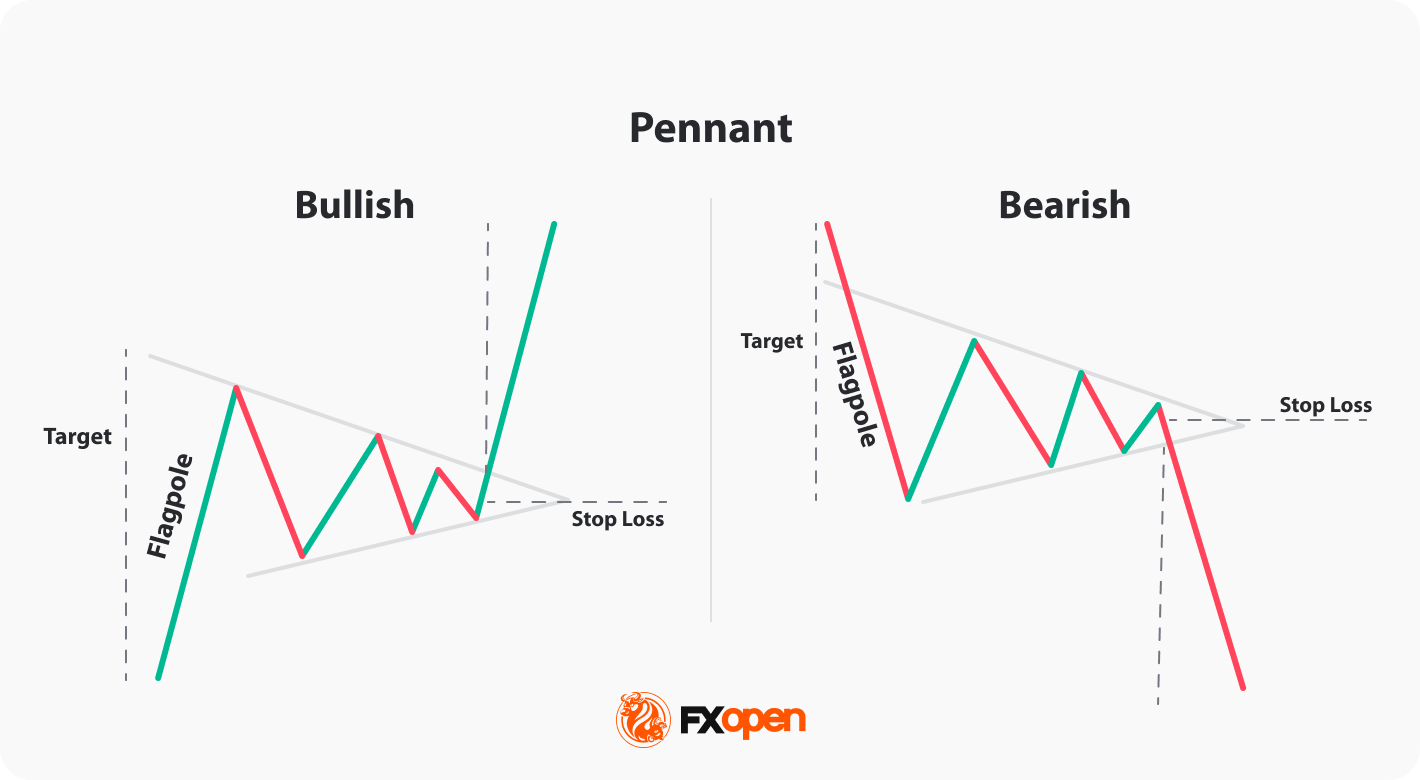
Bullish Pennant Pattern
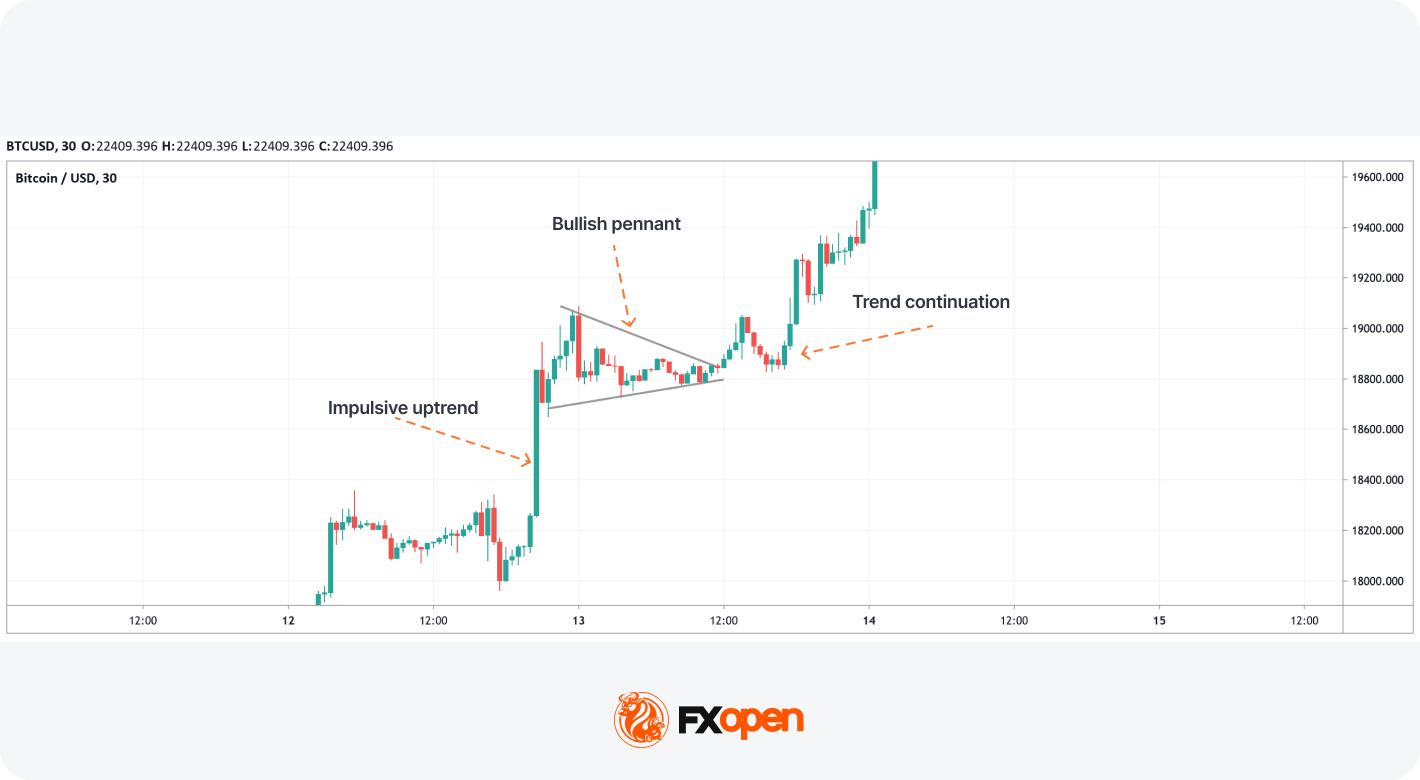
A bullish pennant pattern forms after a strong upward impulse. The consolidation appears as a small symmetrical triangle sloping slightly against the prior trend. A breakout above the upper boundary signals potential continuation higher.
This setup frequently appears in trending currency pairs such as EUR/USD during macro-driven momentum phases.
Bearish Pennant Pattern
A bearish pennant develops after a sharp decline. Price consolidates within converging trendlines before breaking below the lower boundary, indicating further downside continuation.
In high-volatility markets such as cryptocurrencies*, bearish pennant trading setups often form during strong sentiment-driven selloffs.
How Pennant Patterns Form in Live Forex & CFD Markets
In real market environments, pennants often develop during:
- Central bank policy decisions
- Important macroeconomic data releases
- Institutional repositioning
- Liquidity imbalances
The initial impulse creates directional imbalance. During consolidation, volatility contracts and volume typically declines. As price compresses, stop orders accumulate outside the structure. The breakout phase triggers these orders, accelerating momentum through volatility expansion.
This contraction-to-expansion transition is the core edge of pennant trading strategies.
Pennant Pattern Checklist for Traders
- Strong flagpole (impulsive move)
- Tight symmetrical consolidation
- Declining volume during compression
- Volume confirmation breakout
- Breakout aligned with higher timeframe trend
How Traders Identify and Trade a Pennant Pattern (Step-by-Step)
Identifying a valid pennant pattern requires precision. Not every consolidation qualifies.
If you would like to find the formations yourself, consider using the TickTrader trading platform with over 700 instruments and 1200 trading tools.
Step 1: Identify a Strong Flagpole
A valid pennant begins with a sharp, one-sided move supported by expanding momentum.
Without a strong flagpole, the pattern loses statistical edge.
Step 2: Confirm Tight Consolidation
Characteristics:
- Decreasing volatility
- Converging trendlines
- Shallow retracement (ideally <50–60% of flagpole)
Step 3: Wait for a Confirmed Breakout
Breakout should:
- Close decisively beyond upper/lower boundary
- Align with higher timeframe direction
- Show strong momentum expansion
Traders avoid entering inside the pattern. The setup becomes valid only after confirmed breakout structure not to be trapped by false breakouts.
Breakouts during major news events may cause slippage and spread widening.
Step 4: Apply Entry Techniques
Professional traders typically choose between:
- Momentum entry (enter immediately after breakout close)
- Retest entry (wait for pullback to broken boundary). Retest entries might improve risk-to-reward ratio.
Step 5: Use Pennant Pattern Target Calculation
Use the flagpole projection method:
- Measure the length of the flagpole
- Project it from breakout point
Alternative targets:
- Key support/resistance
- Fibonacci extensions
- Fixed risk-reward ratios (1:2 or 1:3)
Step 6: Implement Pennant Pattern Stop-Loss Placement and Risk Management
Common stop-loss placements:
- Beyond opposite pennant boundary
- Below/above recent swing point
Additional risk management considerations:
- Minimum risk-to-reward ratio (e.g., 1:2)
- Trailing stop adjustments after breakout confirmation
- Limit exposure across correlated instruments
When Traders Avoid Trading Pennant Patterns
Traders don’t trade if:
- Retracement exceeds 60%
- Breakout lacks momentum
- Higher timeframe contradicts setup
- Major resistance/support sits inside projected target
Case Study: Bullish Pennant Breakout Strategy
To understand how a pennant pattern works in live market conditions, let’s examine a structured bullish breakout example on EUR/USD.
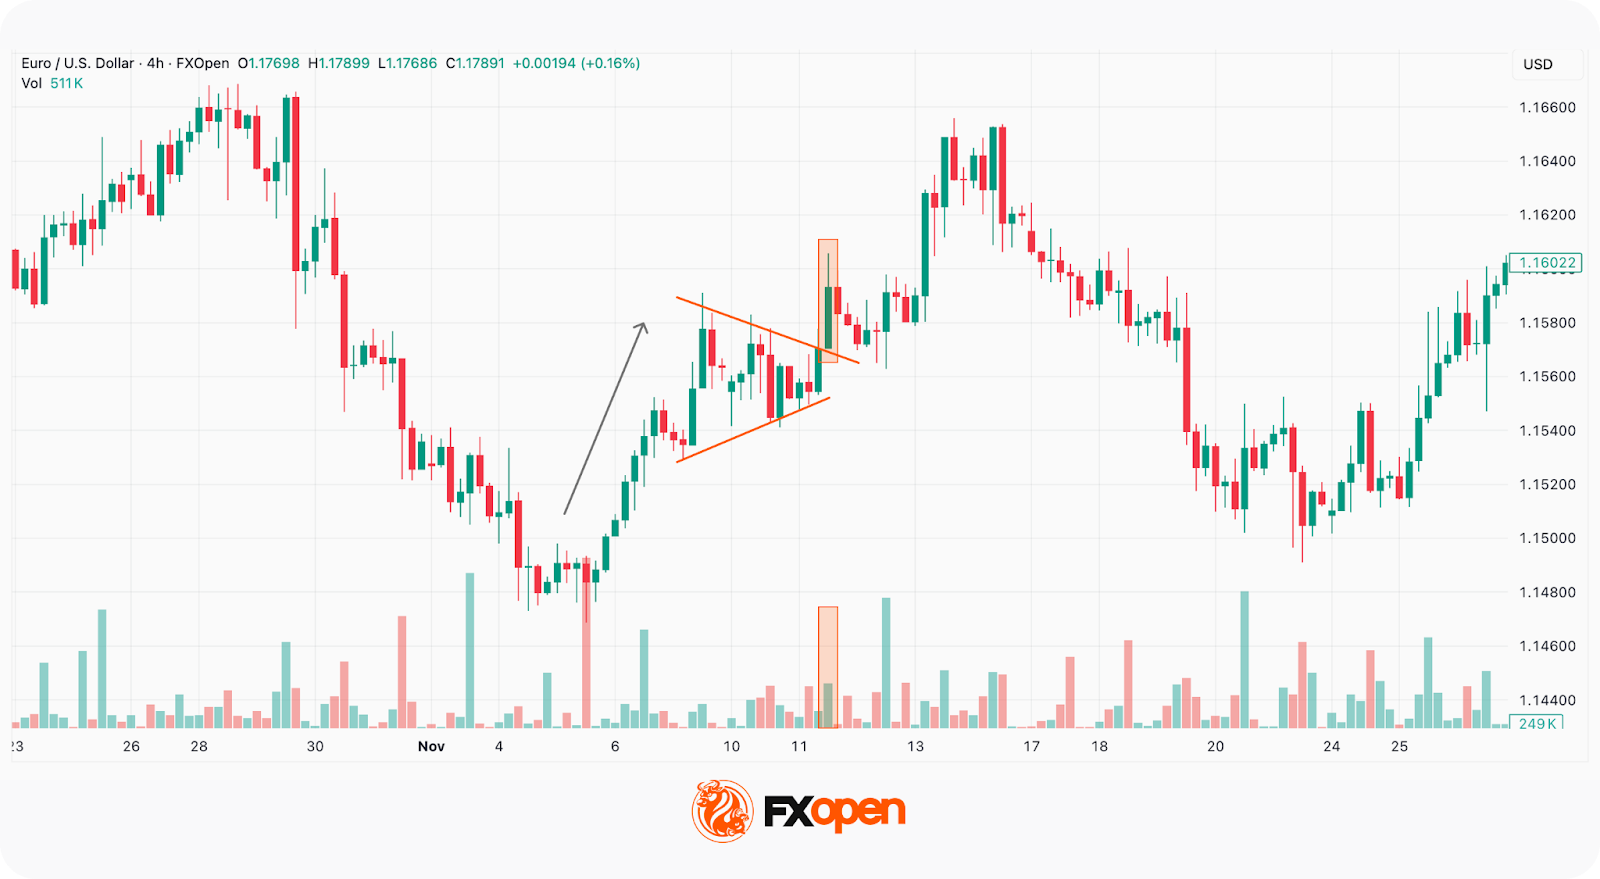
Market Context
The downtrend reversed with a solid upward momentum. Although there was no confirmation on a higher timeframe, traders could consider trading the pennant pattern.
A strong, impulsive bullish move developed over two days with large-bodied candles and no pullbacks. This created the flagpole, establishing directional bias.
Following the impulse, the price entered a tight consolidation, with converging trendlines forming and momentum temporarily pausing. This compression phase lasted for several days.
The breakout occurred in the direction of the prior trend with a strong bullish candle close.
Aggressive traders could enter on a breakout close. Conservative traders could wait for a retest of the broken resistance.
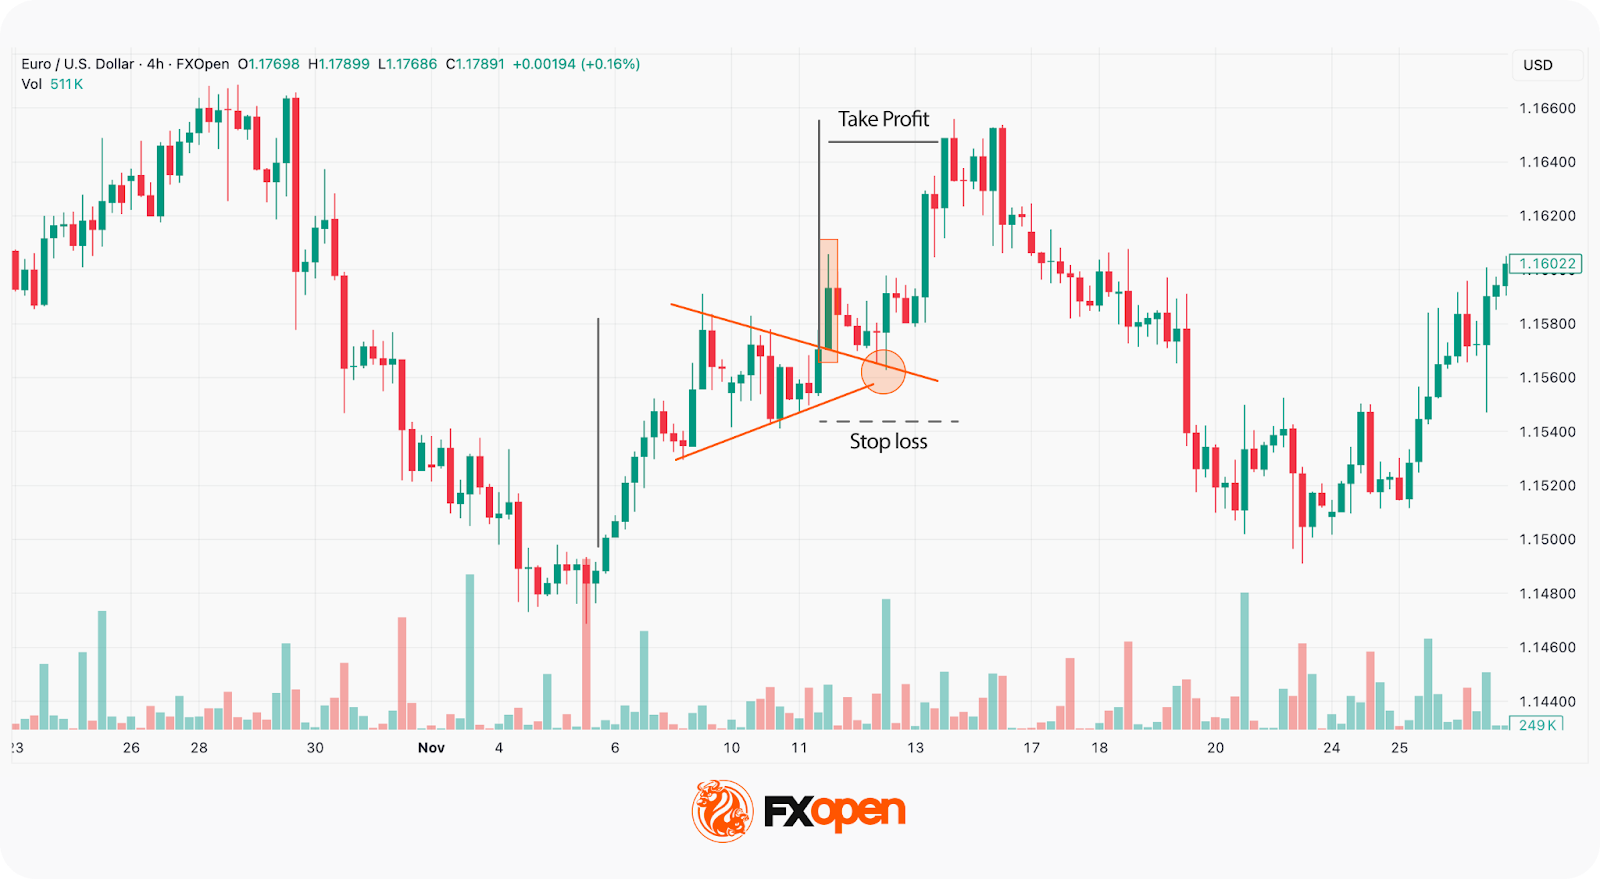
Trade Structure
Entry: Traders could enter at a retest of the broken trendline
Stop-Loss: Below the lower boundary
Target: Flagpole projection method, but with amendments. Although one of the rules states that the price is supposed to rise as far as the length of the flagpole, markets aren’t perfect. Therefore, many traders prefer to set a smaller target, taking into account recent price movements.
Why This Setup Worked
This example aligned with several high-probability conditions:
- Clean compression structure
- Breakout with momentum expansion
- No immediate resistance overhead
The setup demonstrates that pennants are not traded based on shape alone — they require context, confirmation, and disciplined execution.
You can test your own strategies across more than 700 instruments at FXOpen’s TickTrader trading platform.
Statistical Reliability of Pennant Patterns
Professional traders evaluate pennant formations within a broader market framework rather than as isolated chart patterns. Pattern performance is primarily influenced by objective market conditions, including:
- Higher-timeframe trend alignment
- Momentum persistence following the impulse leg
- Relative volume expansion during breakout
- Presence of directional liquidity and absence of equilibrium conditions
Trade outcomes, however, also depend on execution variables specific to the trader, such as:
- Entry model and confirmation criteria
- Risk management methodology
- Position sizing discipline
- Behavioural consistency during volatility expansion
According to research by Thomas Bulkowski in Encyclopedia of Chart Patterns, pennants are classified as moderately reliable continuation patterns.
In trending environments, measured-move targets are frequently achieved. In low-liquidity or sideways markets, failure rates increase.
Timeframes for Trading Pennants
Timeframe affects pattern’s reliability:
- Intraday (M15–H1): More signals, more noise
- H4–Daily: Cleaner structure
- Weekly: Institutional continuation setups
According to Thomas Bulkowski’s Encyclopedia of Chart Patterns, pennants form within up to 3 weeks. They are shorter than symmetrical triangles and wedges.
Brian Shannon explains how to trade in multiple timeframes in his Technical Analysis Using Multiple Timeframes.
Market-Specific Considerations
- Forex. Major pairs like EUR/USD respond strongly to policy divergence cycles.
- Cryptocurrencies*. Cryptocurrencies* display higher volatility, which may result in more false breakouts.
- Equity indices. Stock indices often form cleaner structures in sustained institutional trends. However, the pattern usually lasts no longer than three weeks, which means that it’s not very common on index charts.
Pennant vs Flag vs Symmetrical Triangle
Understanding structural distinctions between pennant pattern vs flag pattern vs symmetrical triangle pattern might improve trade selection and risk control.
Pennants differ from flags in that they show price compression rather than gradual retracement. Compared to symmetrical triangles, pennants are smaller and typically form over shorter durations during high-momentum conditions.
John Murphy widely explains the difference between pennant and flag patterns in his book Technical Analysis of the Financial Markets.
Common Pennant Trading Mistakes
Even experienced traders misinterpret compression structures. Frequent errors include:
- Entering before breakout confirmation. Acting inside the pennant, without confirmation, often means making a wrong decision. The pattern only matters once the price breaks cleanly.
- Trading consolidation without a clear flagpole. Not every consolidation is a pennant. If the lines don’t converge, or if the move before it wasn’t sharp and one-sided, it’s probably not a pennant. Forcing the pattern can lead to poor results.
- Ignoring higher timeframe trends. A pennant ahead of major resistance/support or against the broader trend weakens the setup. Context always matters more than the shape alone.
- Overlooking key macro catalysts. Important economic and political events can invalidate technical compression structures by abruptly shifting liquidity and volatility conditions.
- Neglecting volume analysis. A valid pennant typically shows declining volume during consolidation followed by expansion on breakout; without participation confirmation, price moves are statistically more prone to false breakouts.
Pattern shape alone is insufficient. Context and confirmation determine the edge.
Advantages and Limitations
Pennants are useful in strong trending markets, but they’re not perfect. Let’s take a look at the formation’s advantages and disadvantages.
Advantages
- Clear Structure: Pennants have three clear parts — the sharp flagpole, the tight consolidation, and the breakout offer a straightforward sequence.
- Works Across Timeframes: Pennants occur on many timeframes: from 5-minute charts to daily or weekly ones. That makes them useful for numerous kinds of strategies.
- Defined Breakout Levels: The converging trendlines naturally give a clear area to watch for breakout behaviour.
Limitations
- False Breakouts: Breakouts that stall quickly can trap traders, especially in choppy markets.
- Easily Confused: A messy pennant can look like a triangle or flag. If the structure isn’t clean, the signal can be harder to interpret.
- Relies on Existing Trend Strength: If the initial move is weak or inconsistent, the pennant can be less meaningful. It needs momentum to have the highest probability of working out.
Is It Possible to Improve Pennant Signals?
Like any pattern, the pennant isn’t foolproof. However, traders use certain methods when building a trading strategy around pennants.
Aligning With Trend Tools
Pennants are used in strong trends. You can use tools like moving averages to confirm them. For example, if the price is above the 50-period EMA and the pennant forms during a steady uptrend, that adds weight. A breakout above a short-term moving average can strengthen the case.
Momentum indicators can also help. If the Relative Strength Index (RSI) sits comfortably above 50 while the bullish pattern forms, or breaks out above 50 alongside the pennant, that can confirm a bullish trend and vice versa. However, if the RSI shows overbought/oversold conditions and the market does look very overstretched, that might be a sign to hold off or manage risk more carefully.
Using Volume as a Filter
Volume can give clues. During the pennant, volume may dry up and signal a pause. However, if the breakout coincides with strong volume, that can show genuine interest as buyers or sellers rush in to take advantage of a possible new trend leg. If it stays low, the move may fail or reverse due to a fake breakout.
Pairing It with Context
A pennant is just part of a broader story. For instance, if the market is bouncing off of a resistance level, creates an impulsive flagpole and then forms a bear pennant, that might add conviction to the pattern. However, if the breakout is straight into a major support level, traders might consider looking for a bullish reversal pattern instead.
Alignment between timeframes and correlated assets can be valuable too. If a pennant on the 1-hour chart occurs during a larger trend on the daily, that may add weight. Likewise, if there’s a bullish pennant forming on EUR/USD while dollar weakness is apparent across the board, there might be a higher probability that the bullish breakout is genuine.
Final Thoughts
The pennant pattern is a valuable tool, which provides useful insights into potential price trends. However, it may provide false signals; therefore, to trade with a pennant, you need to be familiar with technical analysis and be able to interpret charts.
You can explore live charts and apply these techniques using the FXOpen TickTrader platform, which provides 700+ instruments and advanced charting tools.
Consider opening an FXOpen account today and trade forex and CFDs on indices, commodities, and crypto* with:
- Spreads from 0.0 pips**
- Commission from $1.50**
- Fast execution
- Institutional-grade liquidity
FAQ
What Is a Pennant Pattern?
The pennant meaning refers to a short-term continuation pattern that forms after a sharp price move. It’s made up of a brief consolidation phase with converging trendlines, then followed by a breakout in the same direction as the original move. It can signal an impending continuation trend leg.
How Do Traders Trade a Pennant Pattern?
Traders usually wait for the price to break out of the pennant on rising volume in the same direction as the initial move. The height of the flagpole is typically used as a rough target, while stop losses are set beyond the last swing high/low or opposite pattern’s boundary.
What Happens After a Bullish Pennant?
A bullish pennant typically leads to further upside if the price breaks above the pattern’s upper trendline with strong momentum.
What Is the Difference Between a Bull Flag and a Bull Pennant?
Bull flags and bull pennants both follow strong upward moves and signal a trend continuation. The key difference between a pennant and a flag is structure. The price in a flag drifts lower or moves sideways within parallel lines that form a sloping or horizontal channel. The price in a pennant contracts into a small symmetrical triangle with converging trendlines.
*Important: At FXOpen UK, Cryptocurrency trading via CFDs is only available to our Professional clients. They are not available for trading by Retail clients. To find out more information about how this may affect you, please get in touch with our team.
**Additional fees may apply.
This article represents the opinion of the Companies operating under the FXOpen brand only. It is not to be construed as an offer, solicitation, or recommendation with respect to products and services provided by the Companies operating under the FXOpen brand, nor is it to be considered financial advice.

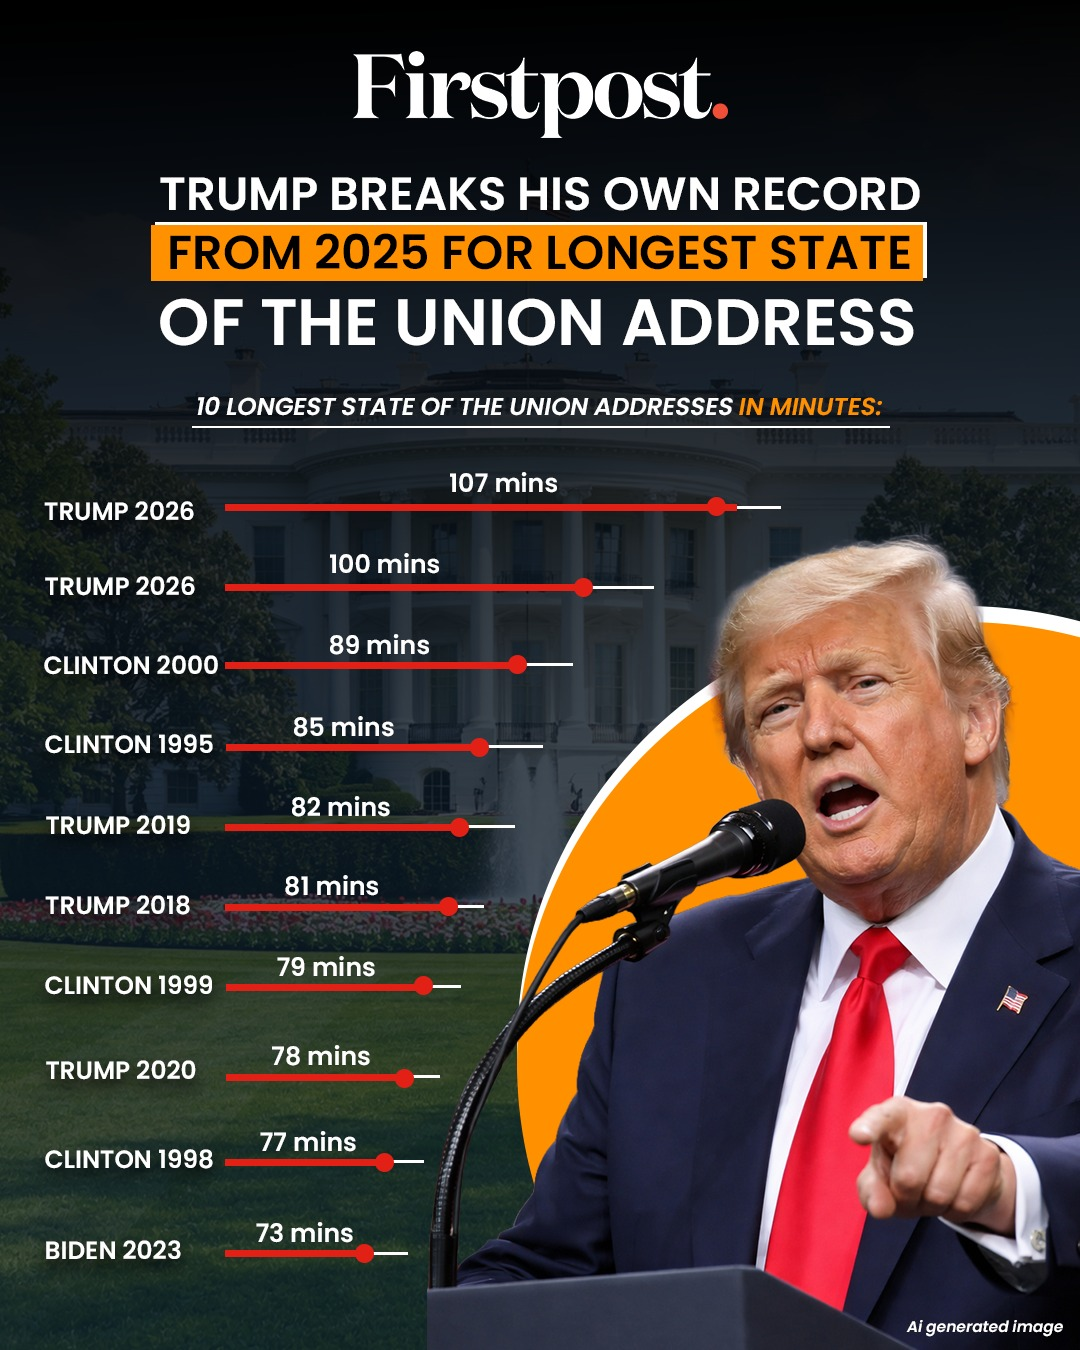
President Donald Trump used his latest address to Congress on Tuesday to mix policy claims, political attacks and campaign-style messaging. Tariffs, immigration, foreign policy around Iran and congressional ethics among the most notable themes.
He mixed policy claims with emotional guest stories. He also directly attacked Democrats and defended his tariff agenda after a recent Supreme Court setback.

Trump Tariffs Will Continue Despite Supereme Court’s Setback
The speech’s most important theme was Trump’s effort to recast a legal defeat on tariffs as a temporary obstacle. He called the court ruling “unfortunate.”
The president also mentioned that existing trade deals would remain in place and promised to use “alternative legal statutes” to keep tariffs central to US policy.
That matters because tariffs have become a core tool in his economic and foreign-policy strategy, including as leverage in negotiations.
American Economy is Great Again? Maximum Triumphalism and Zero Hedge
Trump leaned heavily on a total economic turnaround narrative, citing lower inflation, cheaper gasoline, rising jobs and stock market gains.
He presented these claims as proof that his policies reversed what he described as a crisis inherited from the Biden administration.
Specifically the POTUS started with: “our nation is back: Bigger, better, richer and stronger than ever before” and keeps that tone almost the entire way through.
This follows his long-running political approach of tying consumer prices, markets and employment directly to presidential leadership.
Zero Tolerance on the Immigration Issue
Iimmigration and crime dominated the speech’s sharpest moments. Trump highlighted border enforcement, deportations and new proposals.
Most notably, he urged to enact the “Dalilah law” to block states from issuing commercial driver’s licenses to undocumented immigrants.
He also renewed calls to end sanctuary city policies and tighten voting rules, blending immigration enforcement with election-security rhetoric.
Stand and Sit Down: Live Political Drama
Meanwhile, Trump used the chamber as a live political stage, repeatedly asking lawmakers to stand for certain positions and then criticizing those who did not.
That tactic turned applause and silence into part of the message. It also gave him ready-made moments for television and social media clips, especially on immigration and voting rules.
Softer Stance on Iran?
Trump delivered an expansive foreign-policy and national-security section. He claimed progress on multiple conflicts, described continued efforts on Russia-Ukraine.
Meanwhile, the president returned to a hardline message on Iran, saying he prefers diplomacy but would not allow Tehran to obtain a nuclear weapon.
Trump’s Personal Branding on Full Display
Finally, Trump blended governing with personalized branding in unusual ways, promoting “Trump Accounts” and “TrumpRX” while discussing tax relief and drug pricing. He also tied many policy arguments to invited guests in the gallery, from workers and parents to military personnel.
That format let him package complex or controversial policy claims into simple, emotionally resonant stories.
Taken together, the speech looked less like a traditional legislative address and more like a campaign-era governing performance: part policy agenda, part partisan contrast, and part prime-time political theater.
Hut 8 (HUT) reported a fourth-quarter net loss Wednesday of $279.7 million, from income of $152.2 million a year earlier.
Revenue for the quarter ended Dec. 31 was $88.5 million, compared with $31.7 million in the same period a year earlier.
In its earnings report released Wednesday, Hut 8 said compute revenue for the three-month period totaled $81.9 million, up from $19.2 million a year earlier. The company did not disclose quarterly Bitcoin (BTC) production or sales figures.
Operating results were affected by a $401.9 million loss on digital assets in the quarter, compared with a $308.2 million increase a year earlier.
Hut 8 said it ended the year with about $1.4 billion in cash and Bitcoin reserves and up to $400 million in revolving credit capacity.
During the quarter, the company signed a 15-year lease for 245 megawatts of AI data center capacity at its River Bend campus valued at $7 billion. The agreement includes payments financially backstopped by Google and builds on Hut 8’s broader expansion into AI and high-performance computing infrastructure.
The company also completed the sale of a 310 MW natural gas portfolio in February and said it launched American Bitcoin Corp. as a separately listed vehicle focused on Bitcoin accumulation.
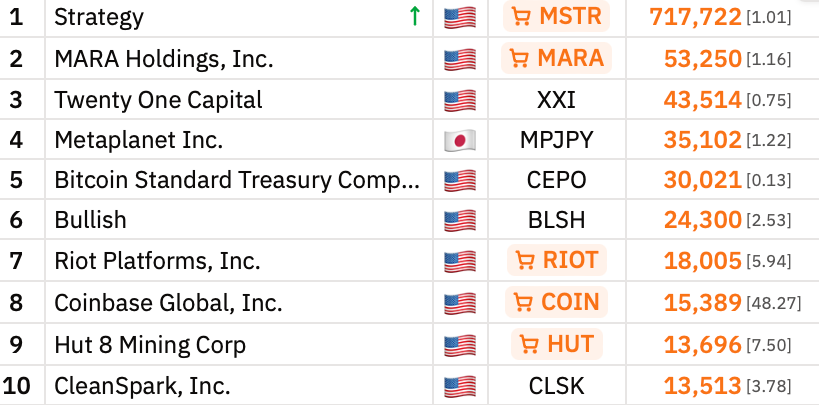
According to BitcoinTreasuries.NET data, Hut 8 holds 13,696 BTC, ranking it among the larger public Bitcoin holders. Shares were down about 4.5% at last look in Wednesday morning trading. Industry tracker CoinShares Bitcoin Mining ETF (WGMI) was up less than 1%.

Related: Solo Bitcoin miner bags over $200K block reward using rented hashrate
AI and infrastructure initiatives stoke mining stocks gains
Even as Bitcoin has fallen to about $68,150 from about $87,500 at the start of the year, per CoinGecko data, shares of most of the biggest publicly traded Bitcoin miners by market capitalization have posted year-to-date gains.
TeraWulf is up more than 50% this year, while Riot Platforms and Hut 8 have advanced about 30% and 29%, respectively, according to data from BitcoinMiningStock.io.

The divergence suggests investors may be valuing miners not solely on Bitcoin price exposure, but increasingly on their energy infrastructure and data center strategies.
In August, TeraWulf signed 10-year colocation leases with AI infrastructure provider Fluidstack valued at $3.7 billion. Google is backing about $1.8 billion of the lease obligations and providing debt financing, receiving warrants for about 41 million WULF shares, or about 8% of the company.
Last week, activist investor Starboard Value urged Riot Platforms to speed up its push into high-performance computing and AI data centers, saying Texas-based development could unlock $9 billion to $21 billion in equity value. Starboard holds about 12.7 million Riot shares.
Other miners are also repositioning toward AI-linked infrastructure. CleanSpark, Core Scientific, HIVE Digital and MARA Holdings have repurposed portions of their infrastructure or outlined similar AI and high-performance computing initiatives.
Cango said it sold $305 million worth of Bitcoin on Feb. 9, in part to finance its planned expansion into AI and HPC.
Magazine: Clarity Act risks repeat of Europe’s mistakes, crypto lawyer warns
From windmills to auto parts, small to medium-sized are leading the way with stablecoin adoption, per a new report from Stablecon and Artemis.
Business-to-business (B2B) stablecoin payments ballooned over 730% year-over-year in 2025, according to a new report by Artemis and Stablecon.

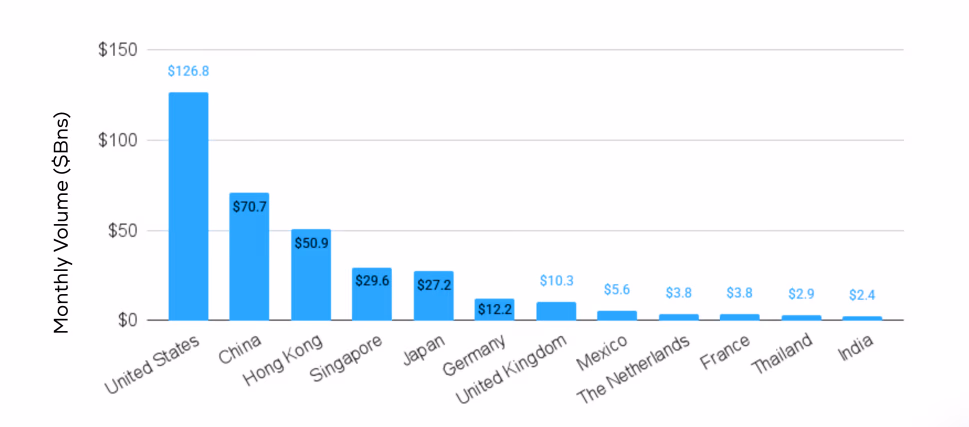
For cross-border payments, the United States received the largest stablecoin flows into the country, with nearly $127 billion monthly. China emerged as the second-largest country for receiving stablecoin payments from international senders, processing nearly $71 billion per month on average, followed by Hong Kong with almost $51 billion.

The report estimates that total annual stablecoin payments soared to $390 billion, more than double 2024 levels, with B2B transactions accounting for roughly 60% of the total.
Though they represent a relatively small slice of stablecoin payment types, card-linked stablecoin transactions saw massive growth last year as well, surging 840% year-over-year.
Speaking with The Defiant, Andrew Van Aken, data scientist at Artemis, clarified that, contrary to popular belief, the top countries for stablecoin usage tend to be those with the highest payment volumes, and developed economies are also increasingly adopting new payment methods.
“I think the most important angle is that the top stablecoin countries tend to be the countries with the highest payment volumes. While the narrative is often that stablecoins are used in emerging countries, developed countries are also looking for new and innovative payment methods,” Van Aken said.
Van Aken also specified that on the B2B side, adoption is concentrated among small and medium-sized businesses — from windmills to scarf makers to auto part companies — seeking to decrease payment times.
“We can’t explicitly shed light on specifics, but it tends to be a lot of small to medium-sized businesses, often tech forward businesses that are looking to decrease payment times,” he added.
As the report itself also notes, the rise in stablecoin use may be linked to their ability to speed up cross-border payments and reduce the extra steps of traditional banking.
- Uniswap price jumped to above $4 on Wednesday as Bitcoin retested $68,000.
- The UNI token could eye $5 amid an oversold bounce across crypto.
- If bulls fail to rally, key support lies around $3.48 and $3.00.
Uniswap (UNI) price has surged nearly 20% in recent trading, climbing to intraday highs above $4.00 as top altcoins retest critical resistance levels.
This rebound aligns with Bitcoin’s spike in the past 24 hours, which sees BTC trade above $68,000 and altcoins, including Ethereum, XRP, and BNB, target oversold bounces above $2,000, $1.50, and $620, respectively.
As with these top altcoins, on-chain data shows Uniswap price ticking up from oversold conditions. Morpho was among the coins to see sharp gains on the day.
Uniswap price pumps to above $4
The sharp decline on February 5, 2026, saw UNI price dump to $3.00, and a subsequent attempt to break higher failed as prices hovered in a range capped at around $3.60.
Overall, weakness in digital assets amid macro headwinds contributed to this outlook.
However, despite risk assets remaining largely bearish, UNI’s uptick to $4.00 amid a 62% spike in daily volume reflects fresh optimism.
Uniswap’s gains in the past 24 hours build on the positive movement that followed BlackRock’s recent strategic purchase of UNI.
The global asset management giant plans to use the tokens to facilitate trading of its BUIDL tokenized Treasury fund via Uniswap.
Data on the market platform Coinglass highlights the improvement in on-chain metrics for UNI.
Open interest is picking up, and funding rates are positive. This suggests recent weakness has provided entry opportunities for buyers.
Bitcoin’s push above $68,000 and Ethereum’s breach of $2,000 may catalyze further gains for small-cap tokens.
What next for UNI price?
Although Uniswap’s price is up by double digits on the day, it remains in the red over the past week, month, and year-to-date.

Technical indicators also suggest that UNI at $4.00 is below key moving averages, including the 50-day, 100-day, and 200-day SMAs.
Daily RSI at 56, however, signals an extended bounce from oversold territory, and significantly, has room for another leg up before bulls hit overbought extremes.
Meanwhile, the MACD histogram hints at fresh bullish momentum with $3.20 having formed a potential bottom.
Bollinger Bands position UNI above the upper band, which is currently at $3.81.
If prices break above the 50-day SMA, bulls will have eyes on the 100 SMA ($5.09).
This hurdle aligns with a horizontal resistance line that also acted as support in November and December 2025.
However, near-term bearish targets are alive. The lower Bollinger band at $3.48 offers the first major demand reload zone. Below this, bulls could rely on support at $3.00.


Since late August, Bitcoin has broken from equities in what appears to be its weakest stock correlation since the chaos of 2022.
Bitcoin’s recent performance differs from its long-standing pattern of moving with stocks. Over the past six months, it has lagged while equities stayed stable and gold rose.
The trend created an unusually weak correlation and recalled rare periods when crypto briefly moved independently from broader financial markets.
Rare Market Divergence
For many years, Bitcoin has frequently moved in the same direction as traditional equity markets, especially the S&P 500. During periods of low interest rates and strong economic growth, such as in 2021 and again in parts of 2024, BTC and many altcoins performed well alongside rising stocks.
On the other hand, during periods of increased fear and tightening monetary policy, including aggressive Federal Reserve rate hikes, crypto markets tended to decline in tandem with equities, as seen in 2018 and 2022.
A clear example occurred in November 2022, when rising interest rates combined with the collapse of FTX pushed Bitcoin down to approximately $15,700. This is one of the most extreme cases of crypto markets falling far more sharply than equities.
Over the past six months, however, Bitcoin has started to move very differently from stocks. Since late August, gold has risen by 51%, the S&P 500 has gained 7%, while Bitcoin has fallen 43%, creating the weakest correlation between BTC and stocks since the market chaos of late 2022.
Rather than moving in step with equities, Bitcoin has significantly underperformed as traditional markets have remained relatively stable and gold has seen strong gains. According to Santiment, such dramatic deviations from long-standing correlations do not typically continue indefinitely.
You may also like:
Previous instances clearly show that markets rotate as sentiment and macroeconomic conditions evolve, which results in changing capital flows over time. Within this context, Santiment added that if BTC eventually returns to its historical tendency of tracking equities during economic expansions, particularly in a scenario involving three interest rate cuts in the second half of 2025, there could be significant room for Bitcoin and altcoins to catch up.
Bearish Pressure
Bitcoin saw a modest rebound on Wednesday as it briefly climbed above the $66,000 level before giving back part of its gains and stabilizing above $65,000.
But data suggests bearish pressure in the BTC futures market, as funding rates remained largely negative across the $62,000-$68,000 range. Additionally, CryptoQuant stated that Bitcoin may not have formed a true bottom yet. Short-term holders have been consistently selling at a loss for nearly 30 days, and multiple large sell spikes have been absorbed without triggering a sustained rebound.
Despite brief price pumps, selling pressure has remained dominant. These rallies are acting as exit liquidity, and a meaningful trend reversal is unlikely until short-term holder profits turn positive and remain there, the report added.
Binance Free $600 (CryptoPotato Exclusive): Use this link to register a new account and receive $600 exclusive welcome offer on Binance (full details).
LIMITED OFFER for CryptoPotato readers at Bybit: Use this link to register and open a $500 FREE position on any coin!


David Schwartz says the XRP Ledger was deliberately designed to prevent Ripple or any single actor from controlling the chain.
Ripple CTO David Schwartz has said that the XRP Ledger (XRPL) was deliberately designed so that neither the company nor any single entity could control it.
His remarks came hours after Cyber Capital founder Justin Bons argued that XRPL is effectively permissioned and centralized, with the exchange cutting to a long-running debate in crypto over what decentralization actually means and whether validator lists amount to hidden control.
Clash Over Control and the Unique Node List
Bons wrote in a February 24 thread on X that networks such as Ripple, Stellar, Hedera, Canton, and Algorand rely on permissioned elements. He claimed XRPL’s Unique Node List, or UNL, gives Ripple and its foundation “absolute power and control over the chain,” arguing that divergence from the published list could cause a fork.
However, Schwartz rejected that characterization, calling it “objectively nonsensical.” He said XRPL nodes individually decide which validators to trust and will not agree to double-spends or censorship unless their operators explicitly choose to.
If a validator attempts to censor or double-spend, “an honest node would just count it as one validator that it did not agree with,” he wrote.
However, Schwartz acknowledged that validators could conspire to halt the chain from the perspective of honest nodes but said they could not force double-spends. In such a case, node operators could switch to a different UNL, which he compared to changing the mining algorithm in Bitcoin after a majority attack.
The XRPL co-architect also addressed regulatory pressure, noting that Ripple must comply with U.S. court orders and cannot refuse them. For that reason, he argued, XRPL was intentionally built so that Ripple itself could not censor transactions.
You may also like:
“The best way to be able to say ‘no’ is to have to say ‘no’ because you cannot do the thing asked,” Schwartz wrote.
Regulatory Pressures and Network Resilience
The exchange comes as XRPL activity metrics have shown significant declines, with analyst Arthur reporting on February 23 that active users fell to roughly 38,000 from more than 200,000, while payment volume dropped to about 80 million XRP from over 2.5 billion.
However, the on-chain observer attributed the drop to the February 18 activation of XLS-81, a permissioned decentralized exchange system that moves institutional transactions off public dashboards.
Questions about validator power also surfaced late last year, when Schwartz proposed a two-tier staking model intended to add rewards without concentrating influence in Ripple’s hands. The idea involved a separate governance token to manage validator lists, with the option to fork if governance failed.
For now, the February 25 exchange highlights a familiar divide. Critics argue that publishing validator lists creates soft control, even if anyone can technically run a node. However, Schwartz maintains that XRPL’s consensus model was built to limit the power of validators and companies alike, even if that means Ripple itself cannot intervene when pressured.
Binance Free $600 (CryptoPotato Exclusive): Use this link to register a new account and receive $600 exclusive welcome offer on Binance (full details).
LIMITED OFFER for CryptoPotato readers at Bybit: Use this link to register and open a $500 FREE position on any coin!


MIAMI BEACH — Bitcoin’s recent slide has frustrated investors who expected a smoother ride after a wave of institutional milestones, but Adam Back, one of the early cypherpunks cited in bitcoin’s 2008 white paper, said the volatility should not surprise long-time observers.
“Bitcoin is generally volatile,” Back said at the iConnections conference in Miami Beach on Tuesday. “There’s a lot of positive news […] and in the previous four year market cycles, this has been about a time in a cycle where price runs lower.”
He suggested that some market participants may be trading around that historical pattern rather than reacting to fundamentals. “There was some expectation or possibility that, because there are different types of investors, the market can be different. So I think some people are thinking the price may come back later in the year.”
Bitcoin entered the year with a tailwind. A more crypto-friendly administration in Washington and long-awaited regulatory clarity around spot exchange-traded funds (ETFs) were expected to unlock deeper institutional participation.
For many investors, this was also meant to be a proving ground. Bitcoin’s core pitch has long centered on scarcity and independence from government monetary policy and to be a digital store of value designed to hedge against currency debasement. At a time when U.S. fiscal deficits remain large and questions about the dollar’s long-term purchasing power persist, the backdrop appeared aligned with that thesis.
Yet the market has not followed the script. Bitcoin is down roughly 26% over the past year, even as the policy environment turned more supportive and institutional access improved. Instead of decoupling from macro uncertainty, the asset has at times traded in line with broader risk markets.
Meanwhile, traditional safe havens have rallied. Gold has climbed to fresh all-time highs, with silver also reaching multi-year peaks. Capital seeking shelter from inflation concerns and geopolitical risk appears to have flowed, at least in part, into metals rather than digital assets.
Back, who is now the CEO of Blockstream as well as the Bitcoin Standard Treasury Company (BSTR), also pointed to structural dynamics in who holds bitcoin.
“The ETF holders […] are more sticky investors than the retail bitcoin exchange traders,” he said. Retail participants often deploy most of their capital during rallies, leaving little dry powder during downturns. Institutions, by contrast, can rebalance across portfolios.
Still, Back cautioned that institutional adoption remains early. “I think there isn’t that much institutional capital yet.”
In his view, large pools of capital have not yet fully entered the market, even though major regulatory hurdles have been resolved and clearer rules could pave the way for more institutional inflows.
Over time, he expects broader adoption to reduce volatility. He compared bitcoin’s current phase to early high-growth equities. “You can look at analogies of, say, early Amazon (AMZN) stock, which had wild swings in price, basically because the market was uncertain.”
“The kind of rapid adoption curve inherently brings with it volatility,” he said. As adoption matures and more institutions, companies and sovereigns gain exposure, Back said bitcoin’s price swings should moderate. He does not expect volatility to disappear, but said he believes it could begin to resemble gold, which trades with less dramatic moves than a younger asset.
Back also said he measures bitcoin’s long-term potential against gold’s total market value. He argued that comparing the two market capitalizations offers a rough benchmark for adoption, and in his view bitcoin remains roughly 10 to 15 times smaller than gold today, suggesting room for further growth if it continues to capture share as a store of value.
Despite short-term price swings, Back argued bitcoin’s long-term investment case remains intact. “Bitcoin as an asset class has stood out from everything, every other asset class for the last decade generally, in having the highest annualized return,” he said.
For Back, volatility is not a contradiction of bitcoin’s thesis but a feature of its adoption phase. “Volatility […] is part of the picture,” he said.
Real-world asset tokens have continued to bleed through February 2026, with several major RWA tokens to watch sitting over 80% below their recent highs. The sell-off has been broad and unforgiving.
But heading into March, technical reversal signals are beginning to form across multiple charts, supported by declining exchange inflows and steady ETF demand. Here are 3 tokenized asset projects where the setup is starting to shift.
Stellar (XLM)
Stellar’s real-world asset footprint is growing even as its token struggles. Data from RWA.xyz shows the network’s distributed asset value has climbed to $1.27 billion, up 25% over the past 30 days. On the institutional side, CME Group launched Stellar futures on February 9, 2026. Both standard and micro-sized contracts are now live, giving institutions a regulated on-ramp to XLM for the first time.
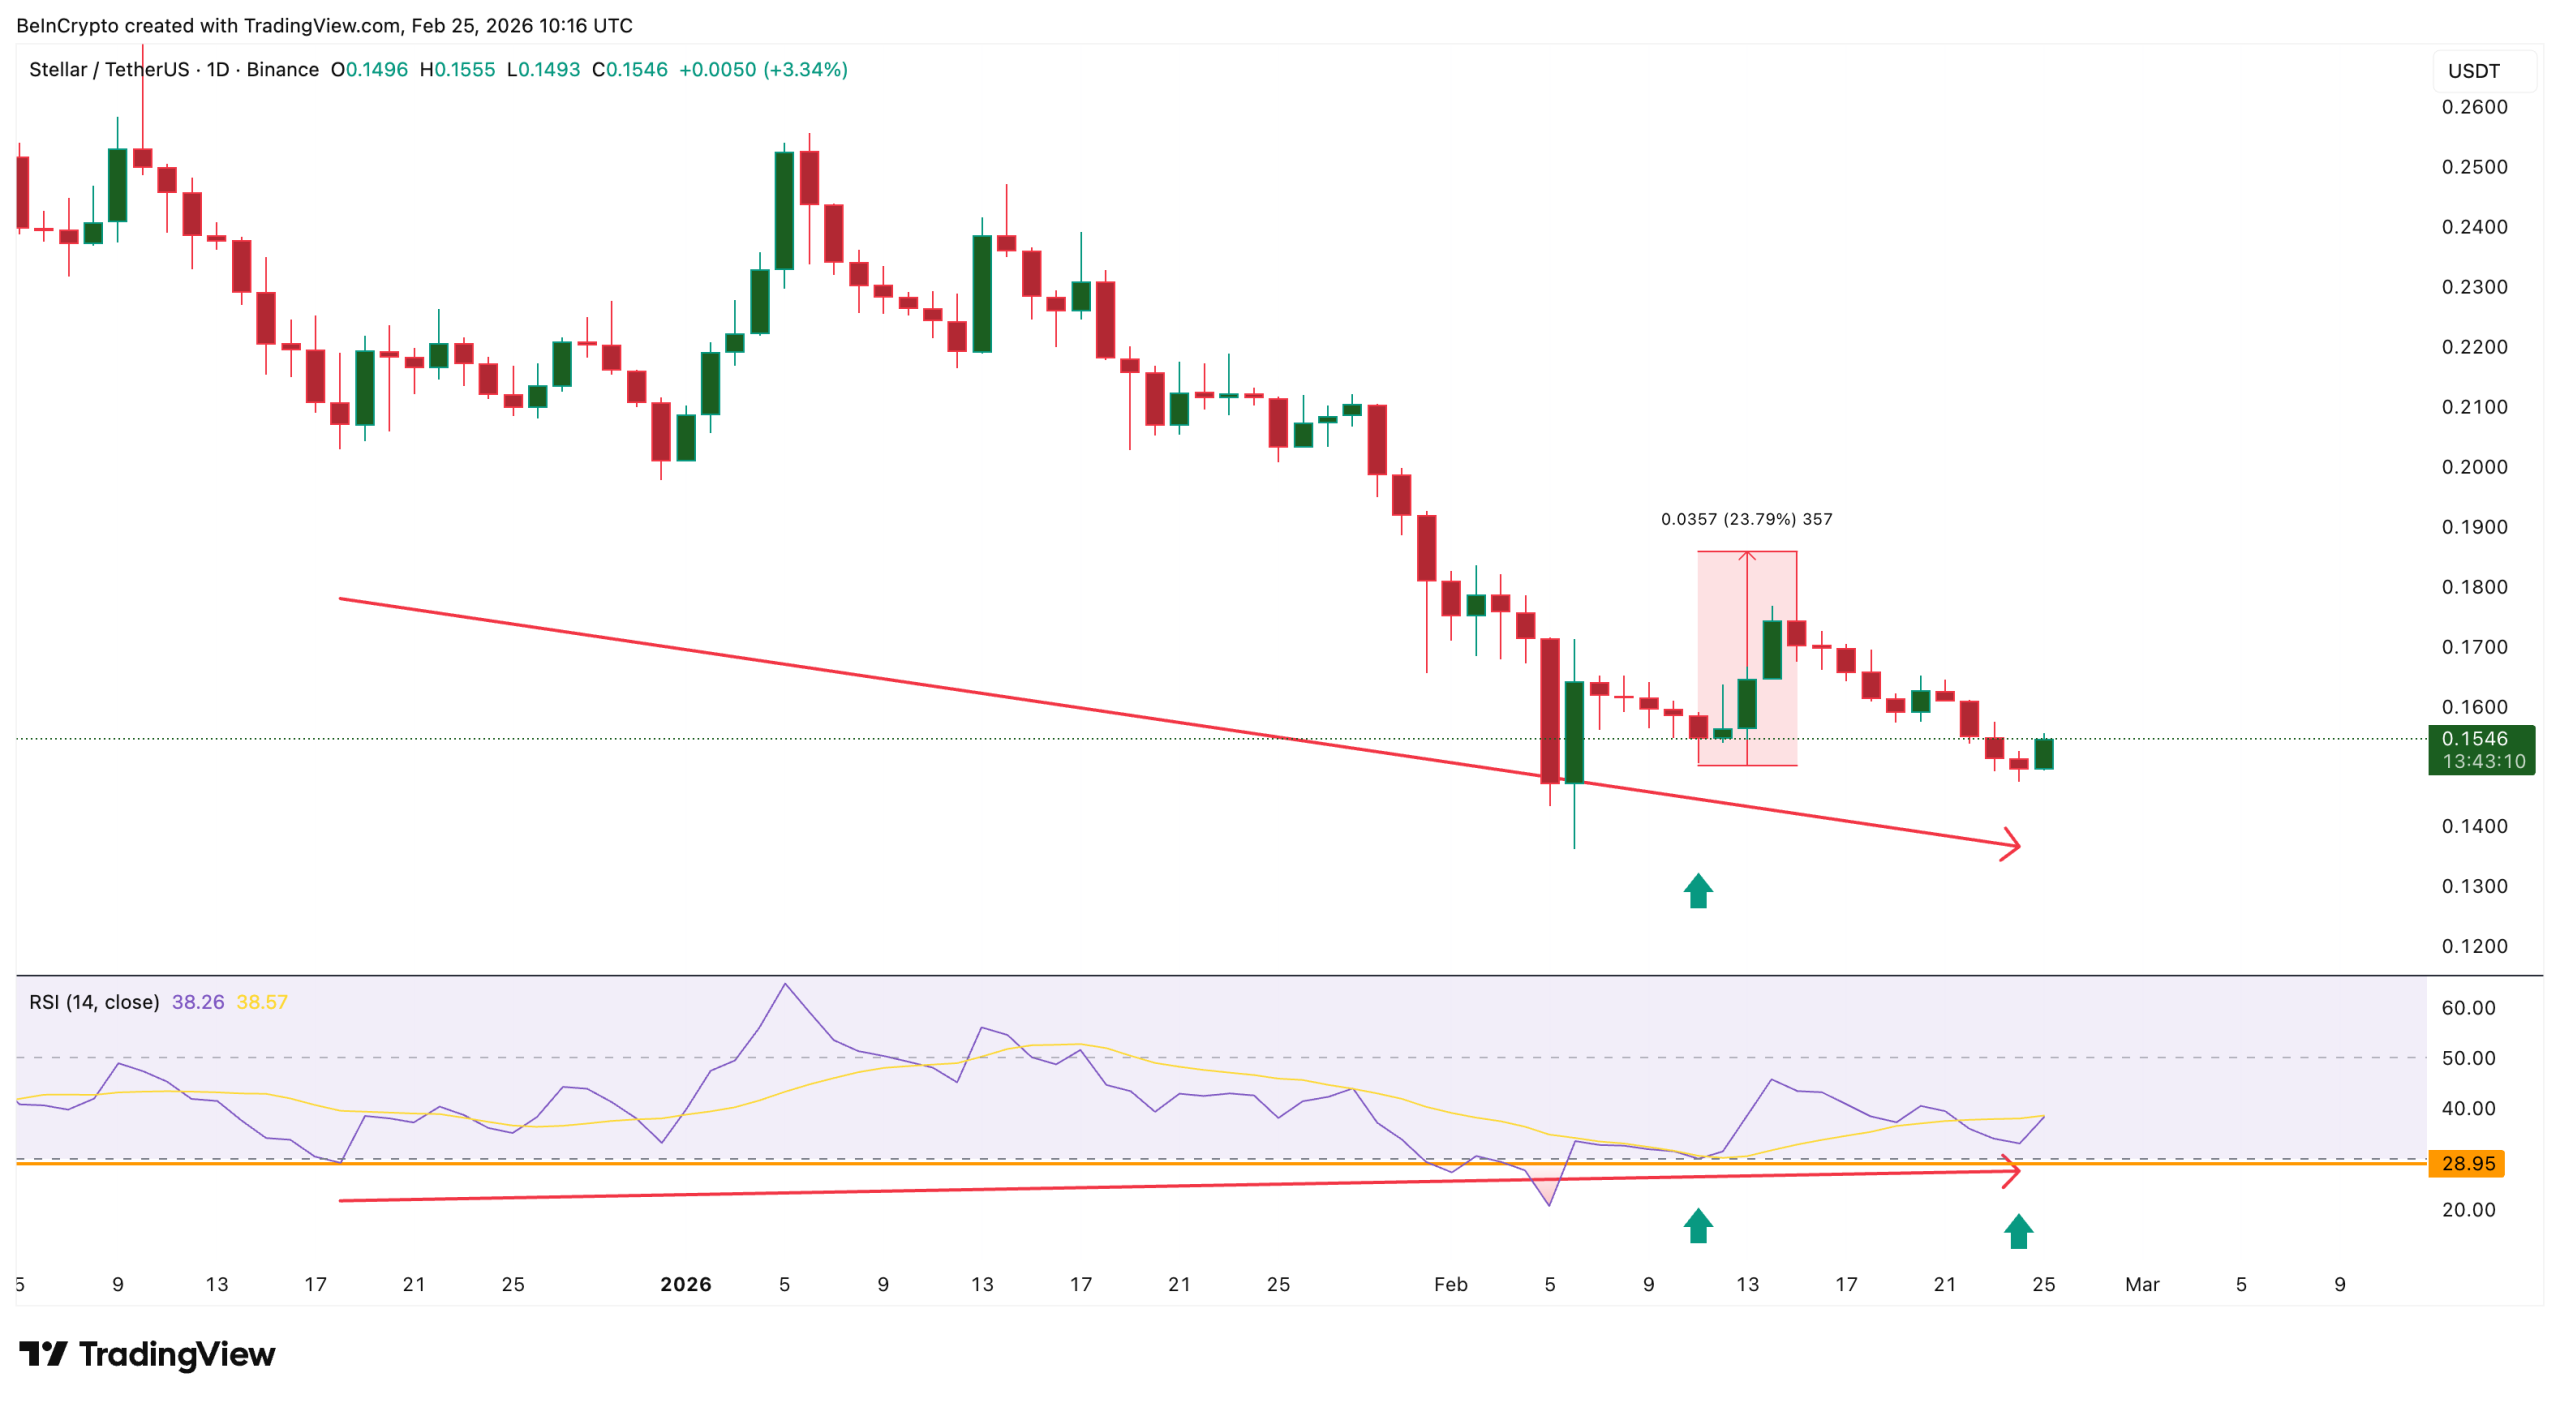
Despite that, the XLM price remains under pressure. Stellar is down roughly 40% over the past three months and trades near $0.154. But the charts are starting to tell a different story.
Between December 18 and February 24, XLM printed a lower low while the Relative Strength Index (RSI), a momentum indicator, formed a higher low, a standard bullish divergence. This is a textbook reversal signal, and it has a recent precedent. A similar setup appeared around February 11, after which Stellar rallied approximately 23% before correcting.

Want more token insights like this? Sign up for Editor Harsh Notariya’s Daily Crypto Newsletter here.
If the current divergence plays out heading into March, the first hurdle sits at $0.164, a level that has flipped between support and resistance multiple times. Clearing it opens the path toward $0.185 (where the last rally stopped) and then $0.210, which aligns with the 0.618 Fibonacci retracement and would mark the first real structural shift in months. A move beyond that puts $0.230 in play.
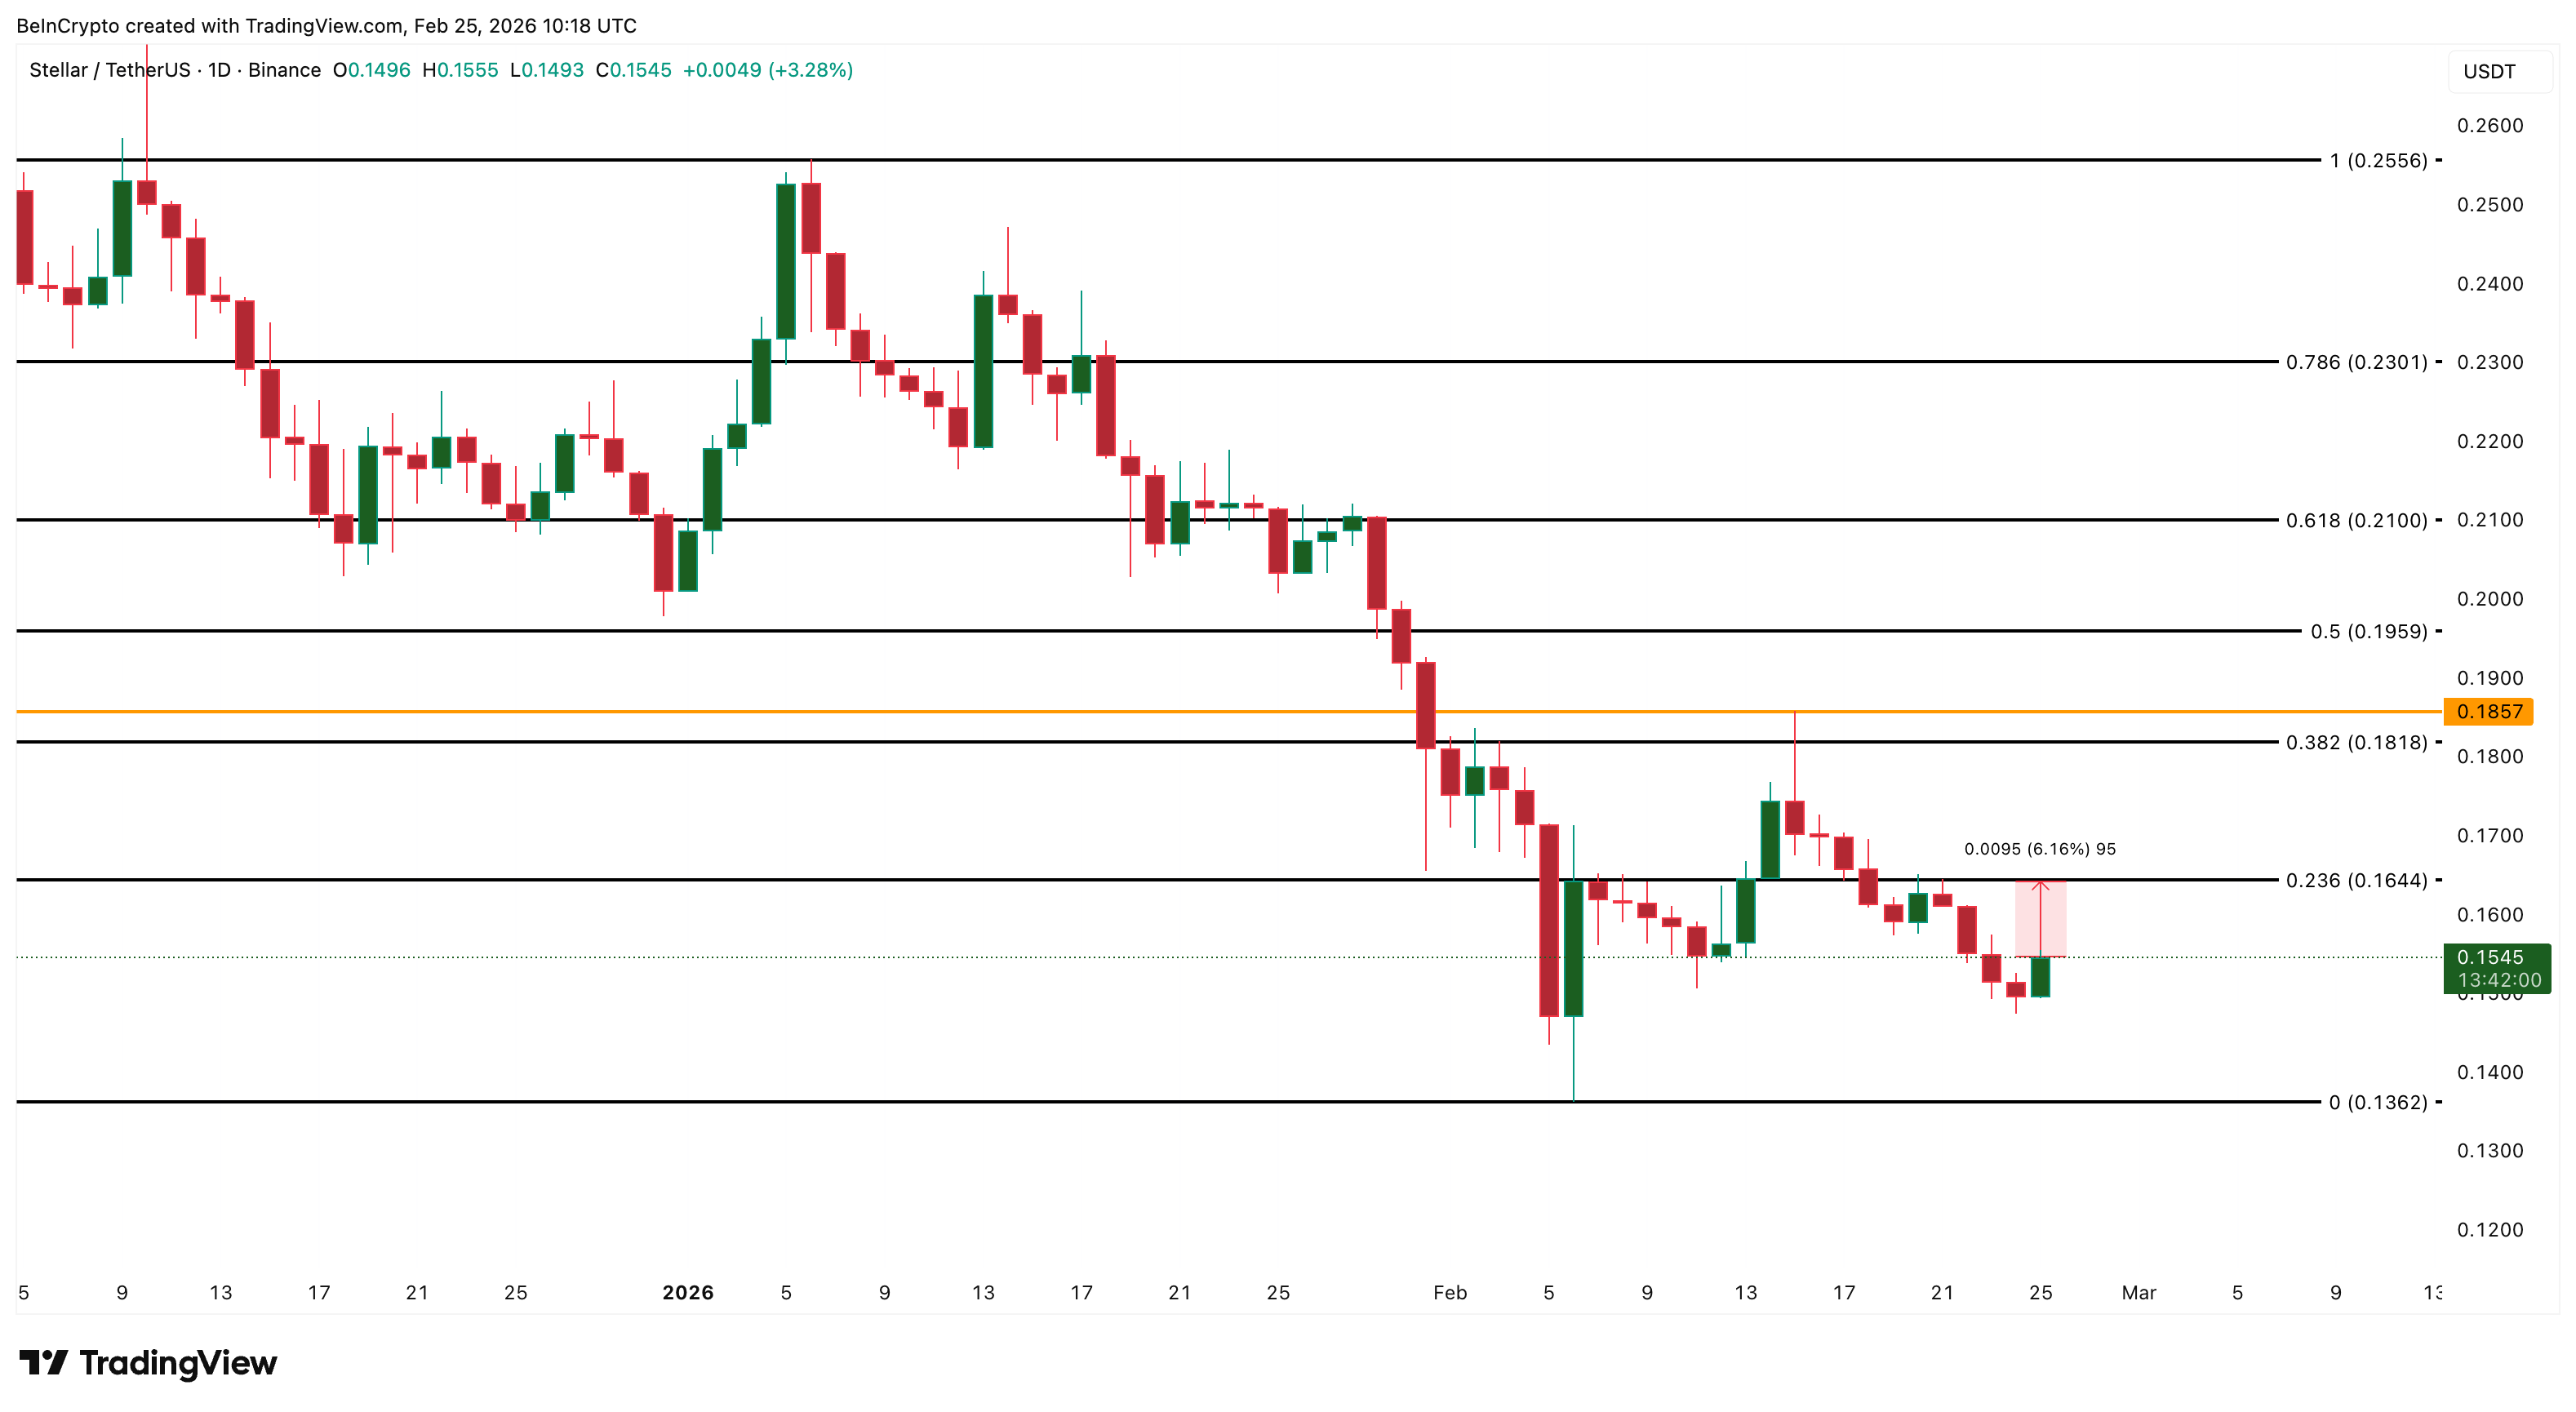
On the downside, failure to reclaim $0.164 keeps Stellar range-bound. A break below $0.136 invalidates the reversal thesis.
With RWA adoption accelerating and institutional infrastructure now live, Stellar (XLM) stands out as a real-world asset token to watch in March. The fundamentals are building. The divergence suggests the price may be getting ready to catch up.
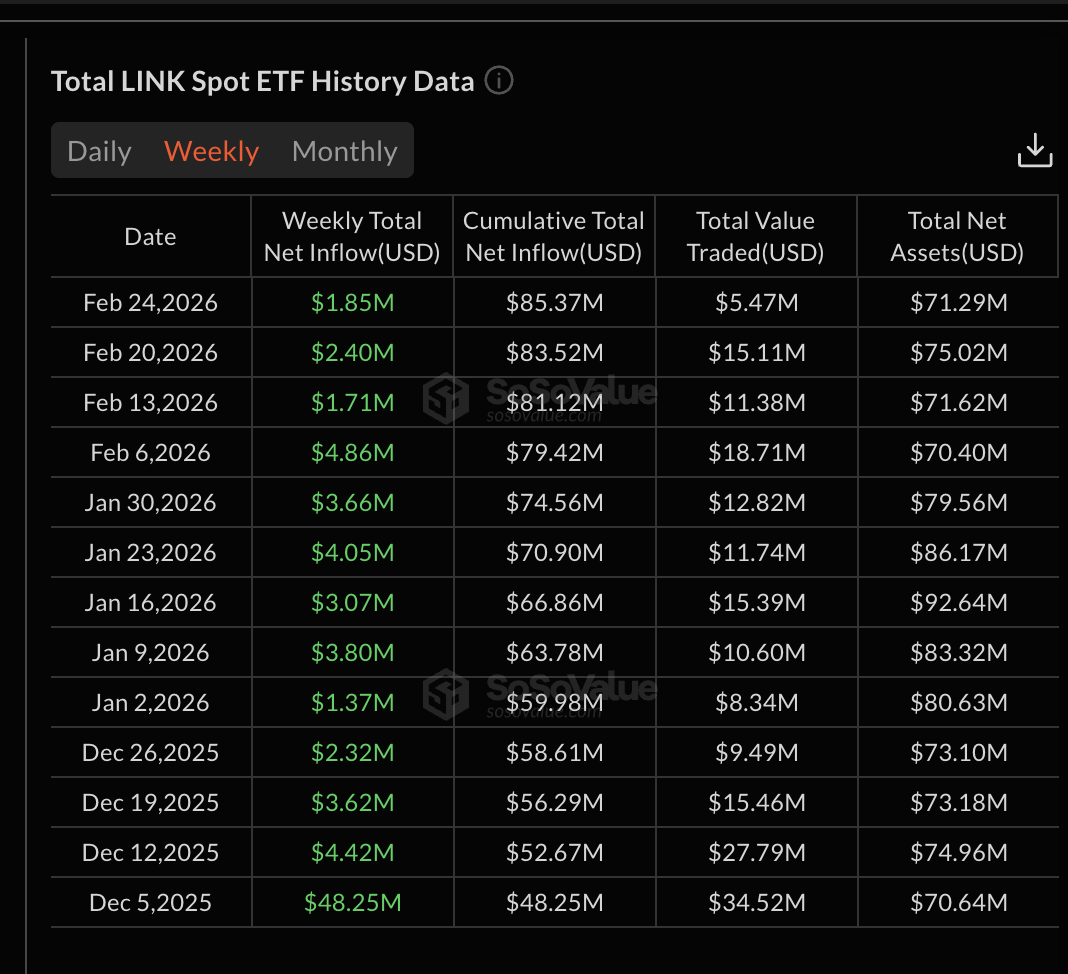
Chainlink (LINK)
Chainlink continues to lead as oracle infrastructure for the tokenized asset economy, and its spot ETF performance is reinforcing that positioning. While Bitcoin ETFs have suffered through nearly six consecutive weeks of net outflows, Chainlink has not recorded a single red week since its ETFs launched.
That kind of consistency in a risk-off environment is rare across the RWA sector and signals steady institutional-grade demand even as broader crypto sentiment deteriorates.
On the charts, LINK is forming an inverse head and shoulders pattern on the 12-hour timeframe, a structure that carries roughly 35% breakout potential if the neckline breaks.
However, the neckline slopes downward, which means a clean 12-hour break above $9.00 is needed to trigger the move. Chainlink already tested this level between February 19 and 21 while rebounding from the right shoulder, but it failed at $9.00 and pulled back. That rejection makes the neckline even more significant. A confirmed daily close above it would be a strong signal, both technically and in terms of sentiment.
If LINK reclaims $9.00, the breakout path opens toward $11.30, which aligns with the measured move from the pattern. A key resistance could still halt the probable rally at $10.00.
On the downside, losing $8.00 weakens the structure. A decisive break below $7.20 fully invalidates the inverse head and shoulders and shifts the bias bearish.
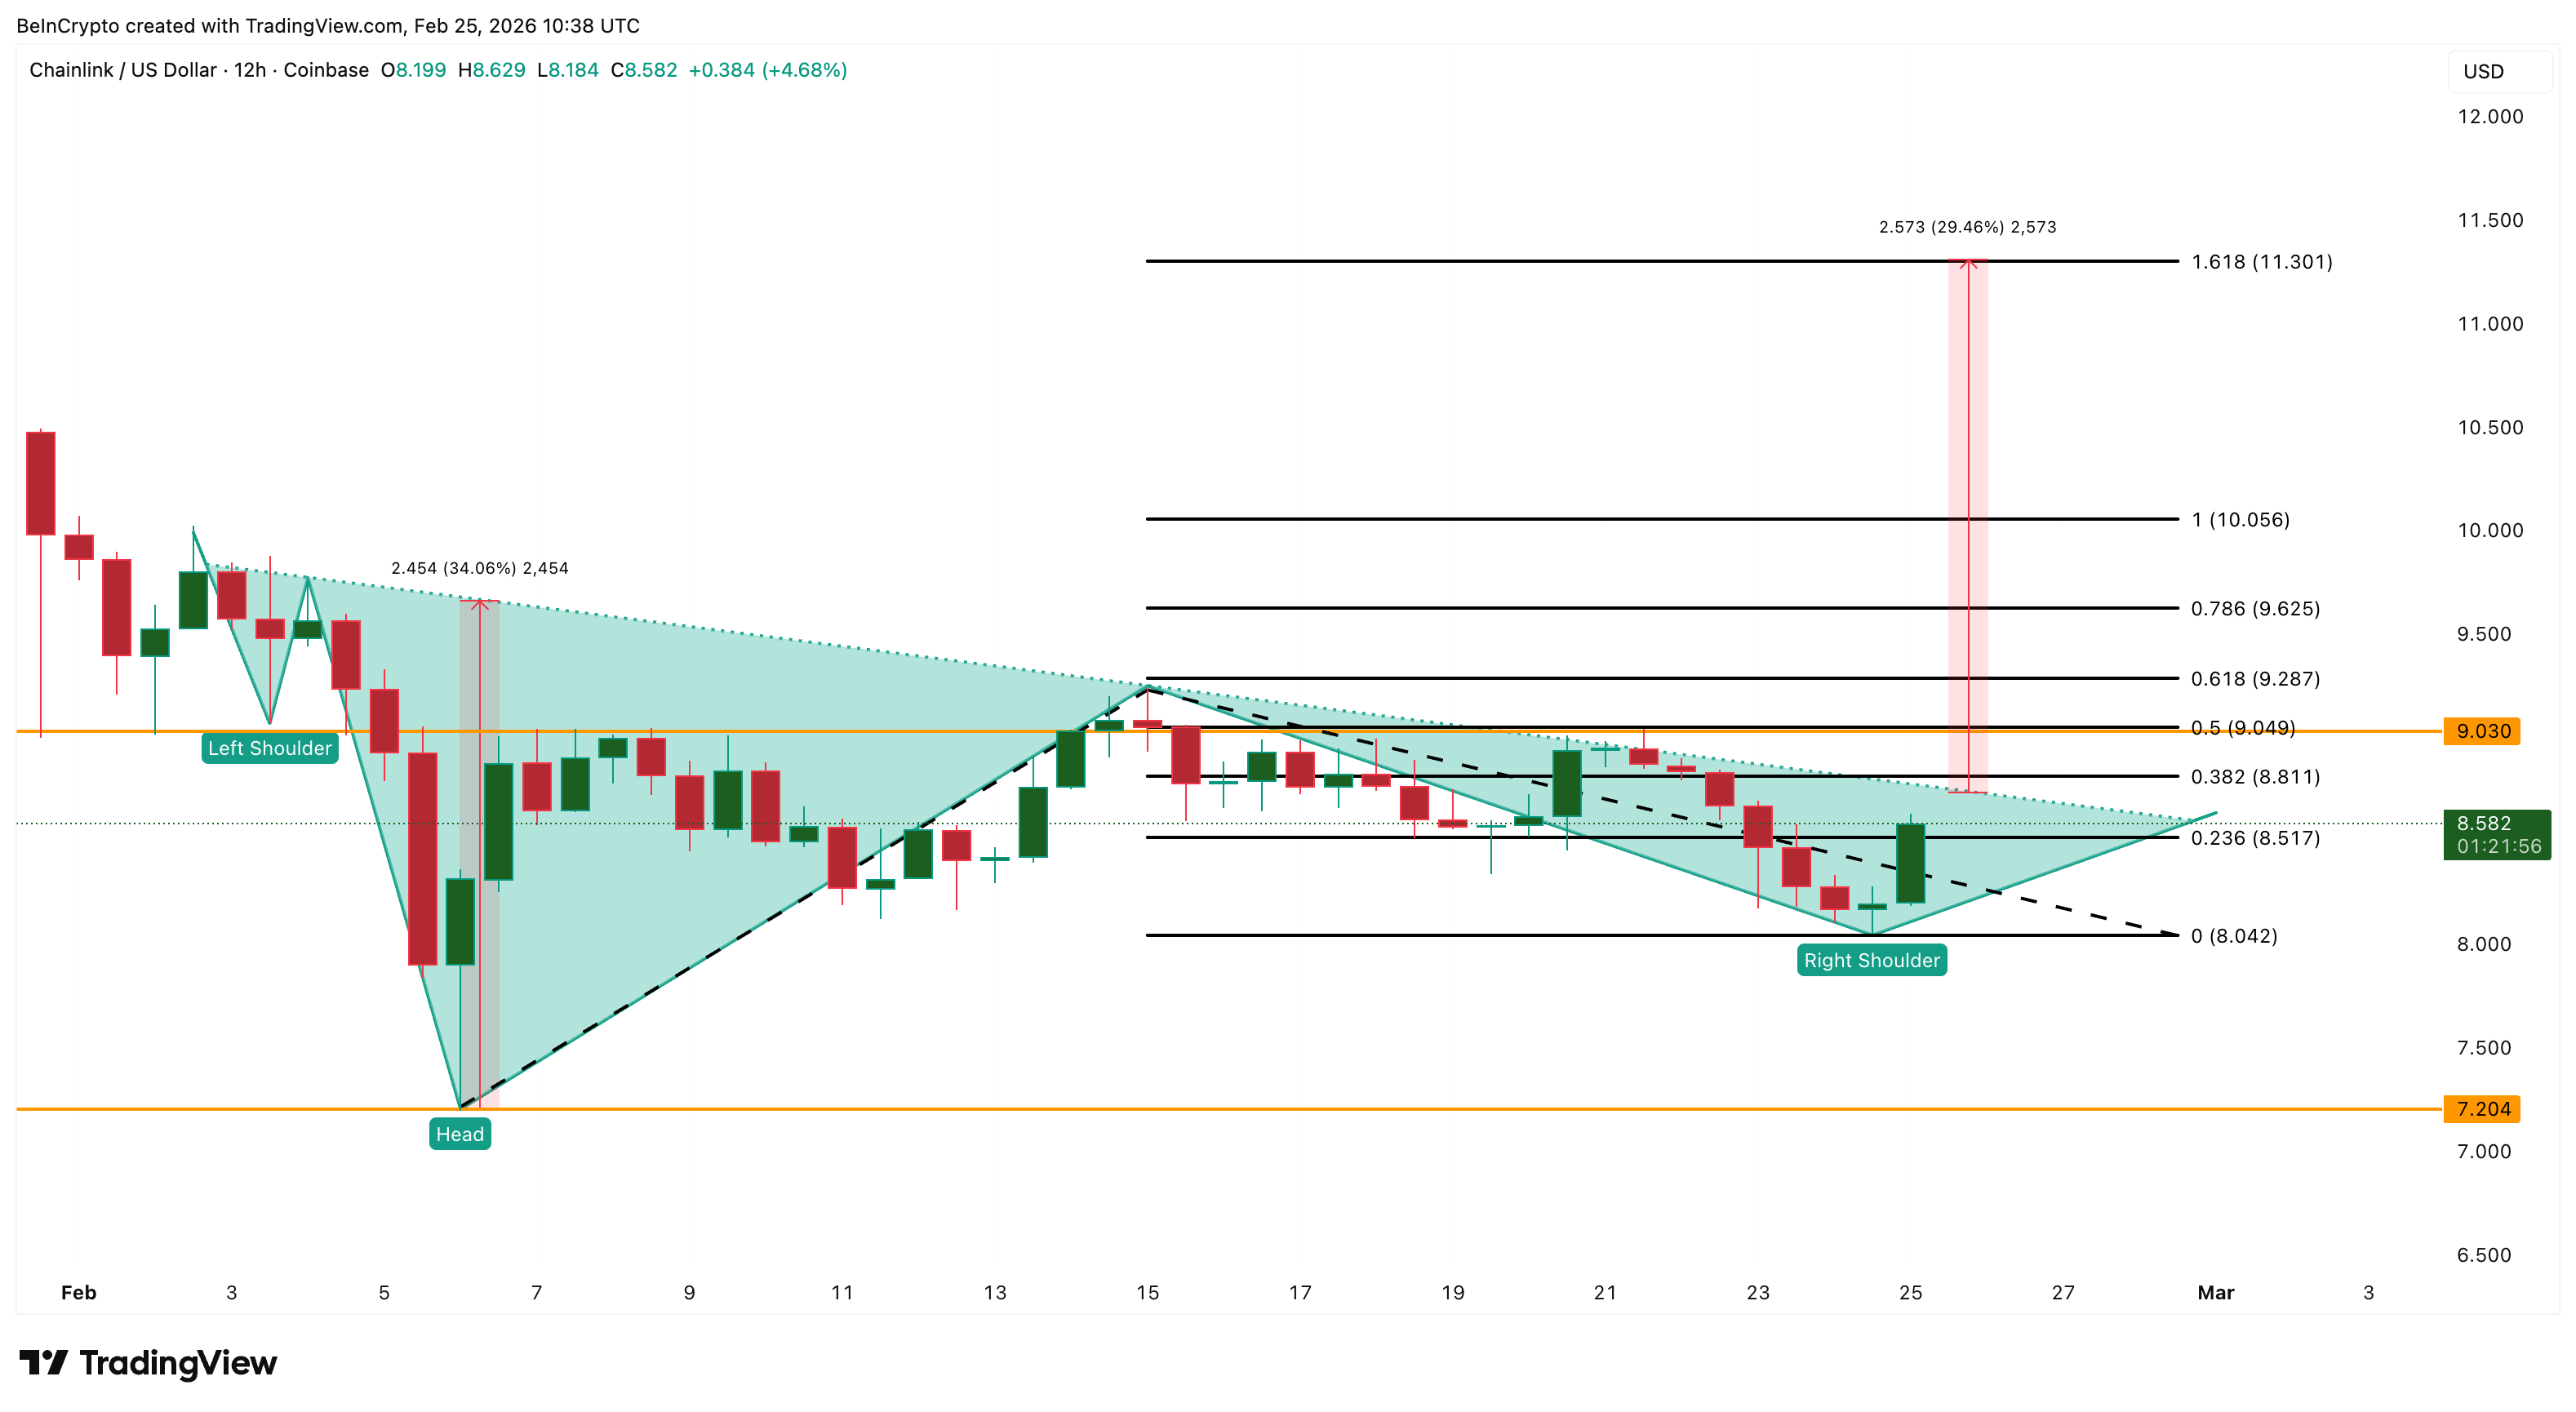
With on-chain adoption expanding across tokenized securities and cross-chain interoperability, and ETF flows showing no signs of fading, Chainlink remains one of the stronger RWA tokens to watch heading into March. The failed neckline test makes the next attempt critical. If $9.00 breaks, the setup could deliver one of the cleaner moves in the real-world asset space this quarter.
Ondo Finance (ONDO)
Ondo Finance remains one of the largest tokenized asset platforms in the real-world asset sector, with more than $2.5 billion in total value locked. Despite that growth, the ONDO token has not kept pace. Since reaching its all-time high of $2.14 in December 2024, ONDO has declined more than 80% and now trades at $0.25. That disconnect makes it one of the most heavily discounted real-world asset tokens relative to its underlying platform expansion.
A potential shift is now appearing on the technical side. Between January 25 and February 24, ONDO formed a lower low while the Relative Strength Index printed a higher low. This creates a standard bullish divergence, a classic early-reversal signal, the same as XLM discussed earlier.
On-chain data reinforces that signal. Exchange inflows dropped sharply after February 24, falling from 42.91 million ONDO to just 4.54 million. That represents an approximately 89% decline in tokens moving to exchanges, possibly for selling.
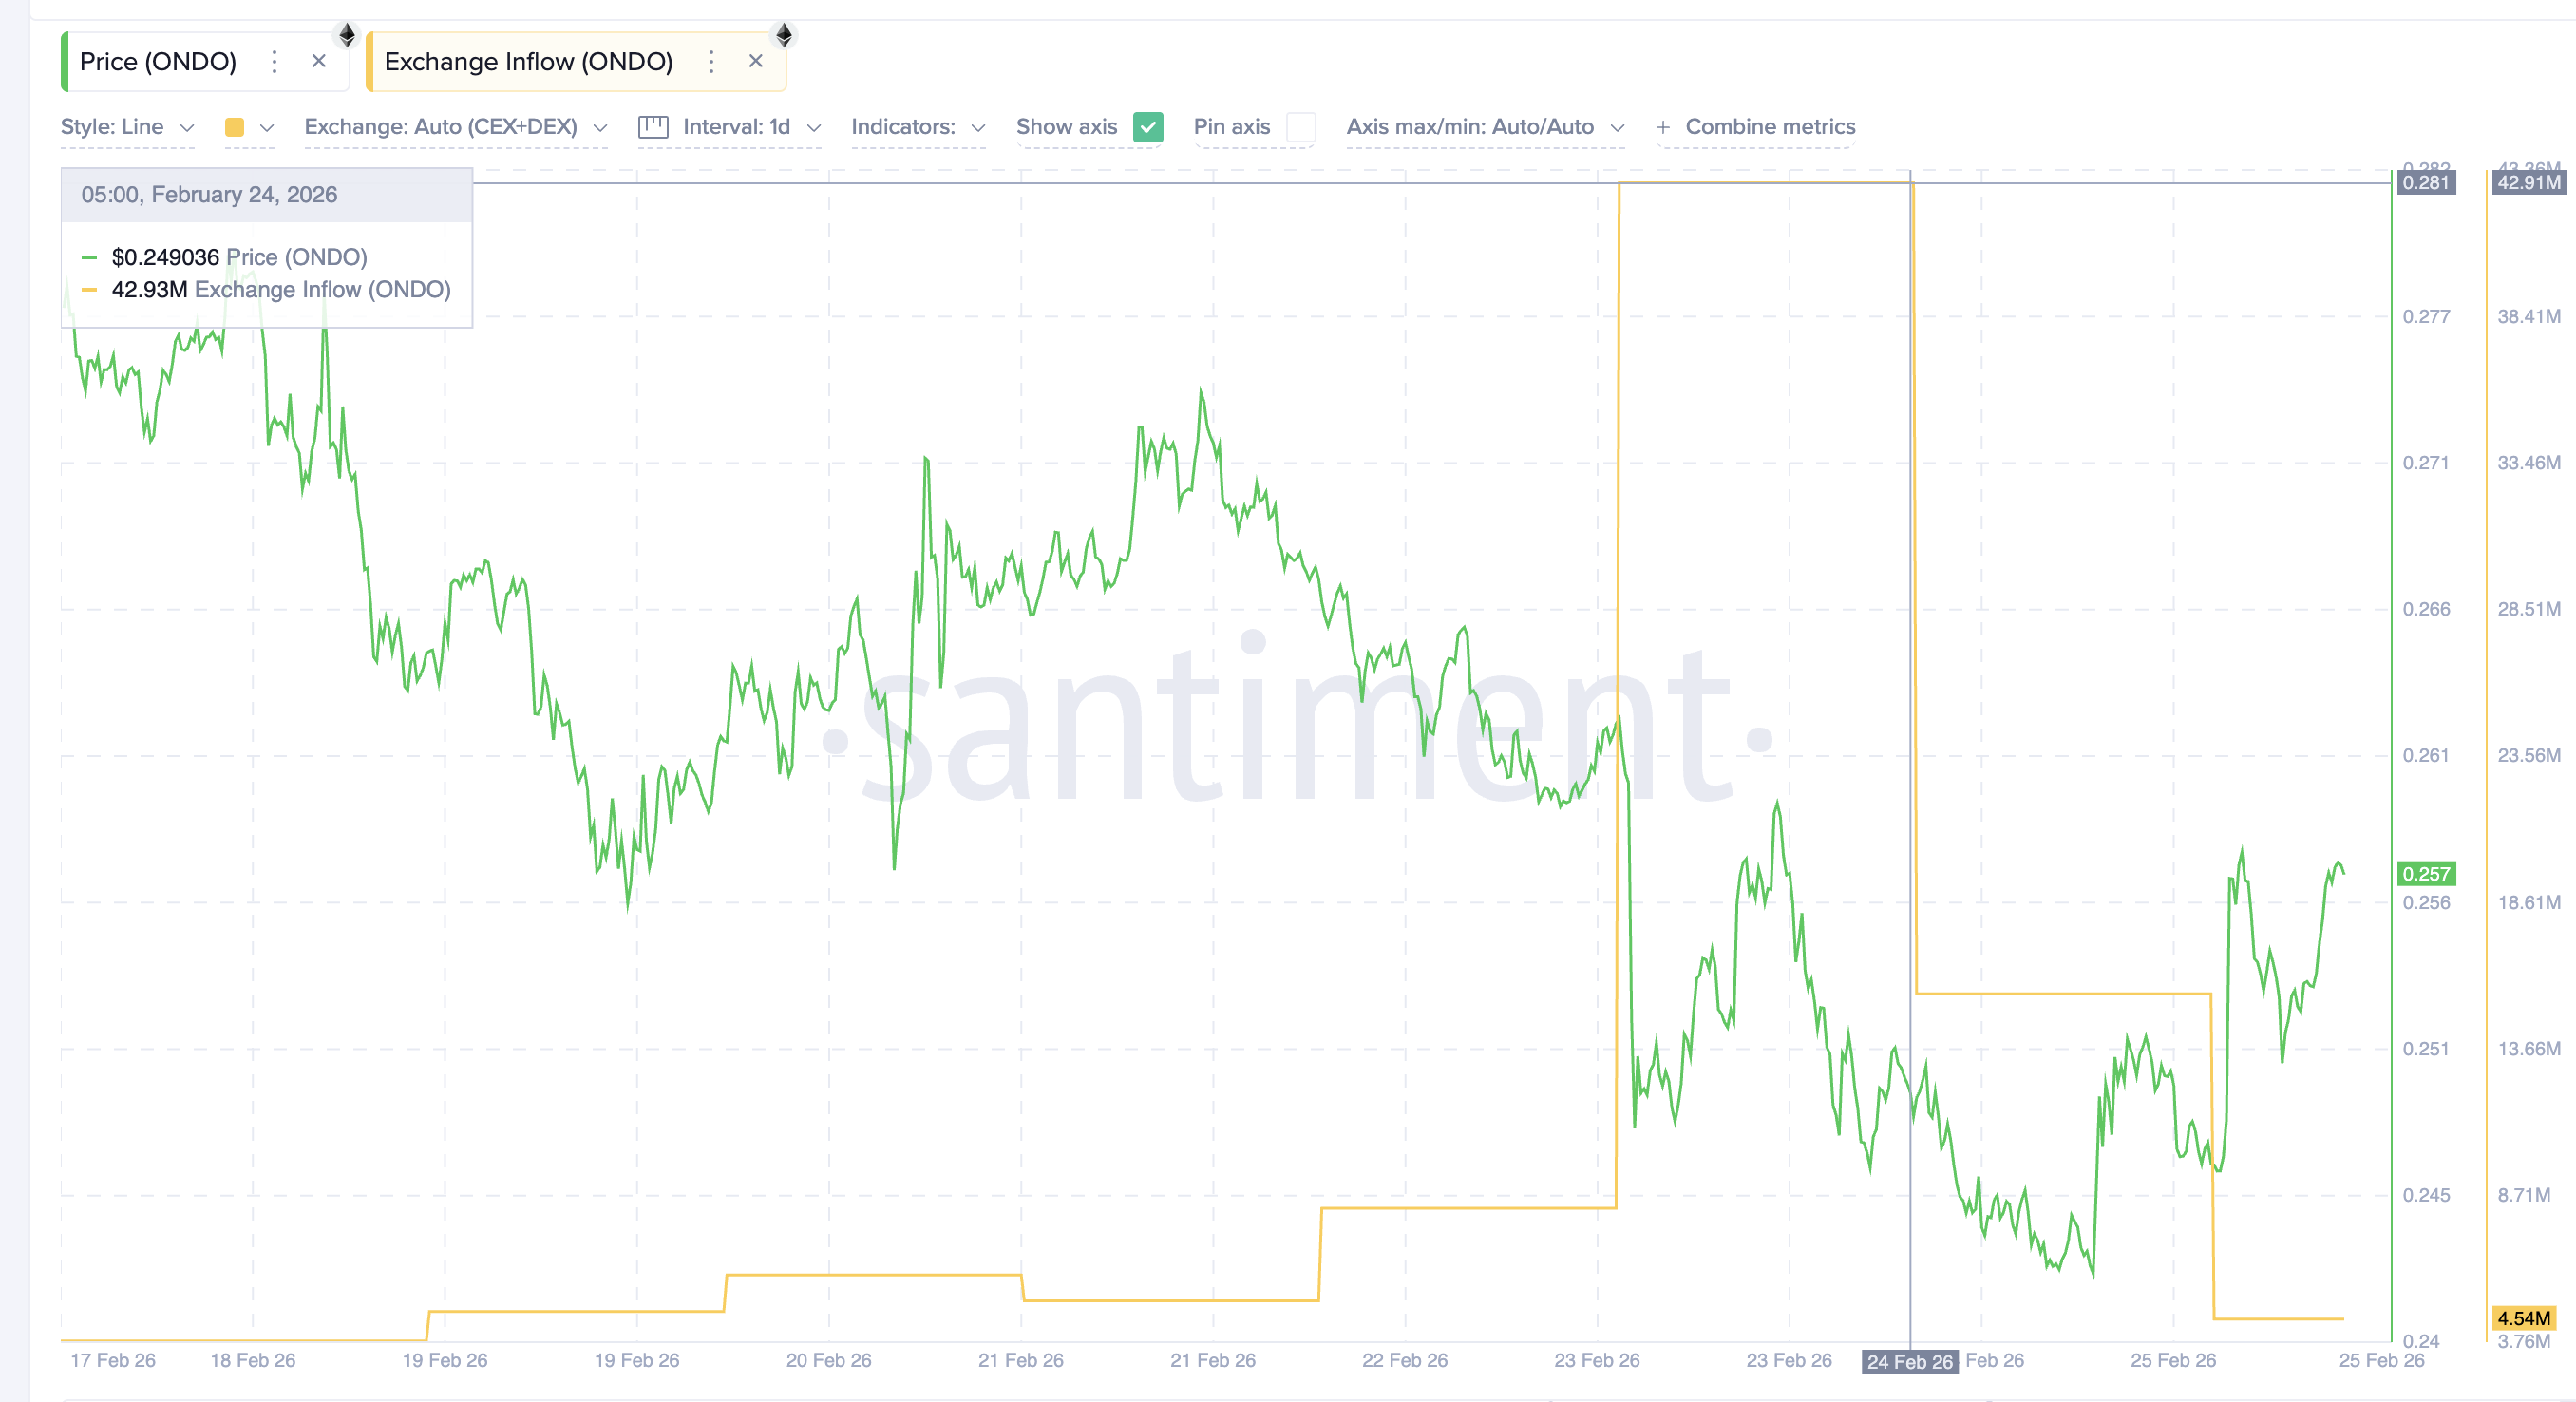
When exchange inflows collapse right as a divergence signal forms, it suggests that selling pressure behind the downtrend is fading.
Looking ahead, the first key level sits at $0.26. Holding and breaking above this level would confirm short-term strength and open the path toward $0.30, which has acted as repeated resistance in recent weeks.
A successful reclaim of $0.30 would strengthen the reversal structure and allow for a move toward $0.36. A move to $0.30 would represent roughly 19% upside from current prices.
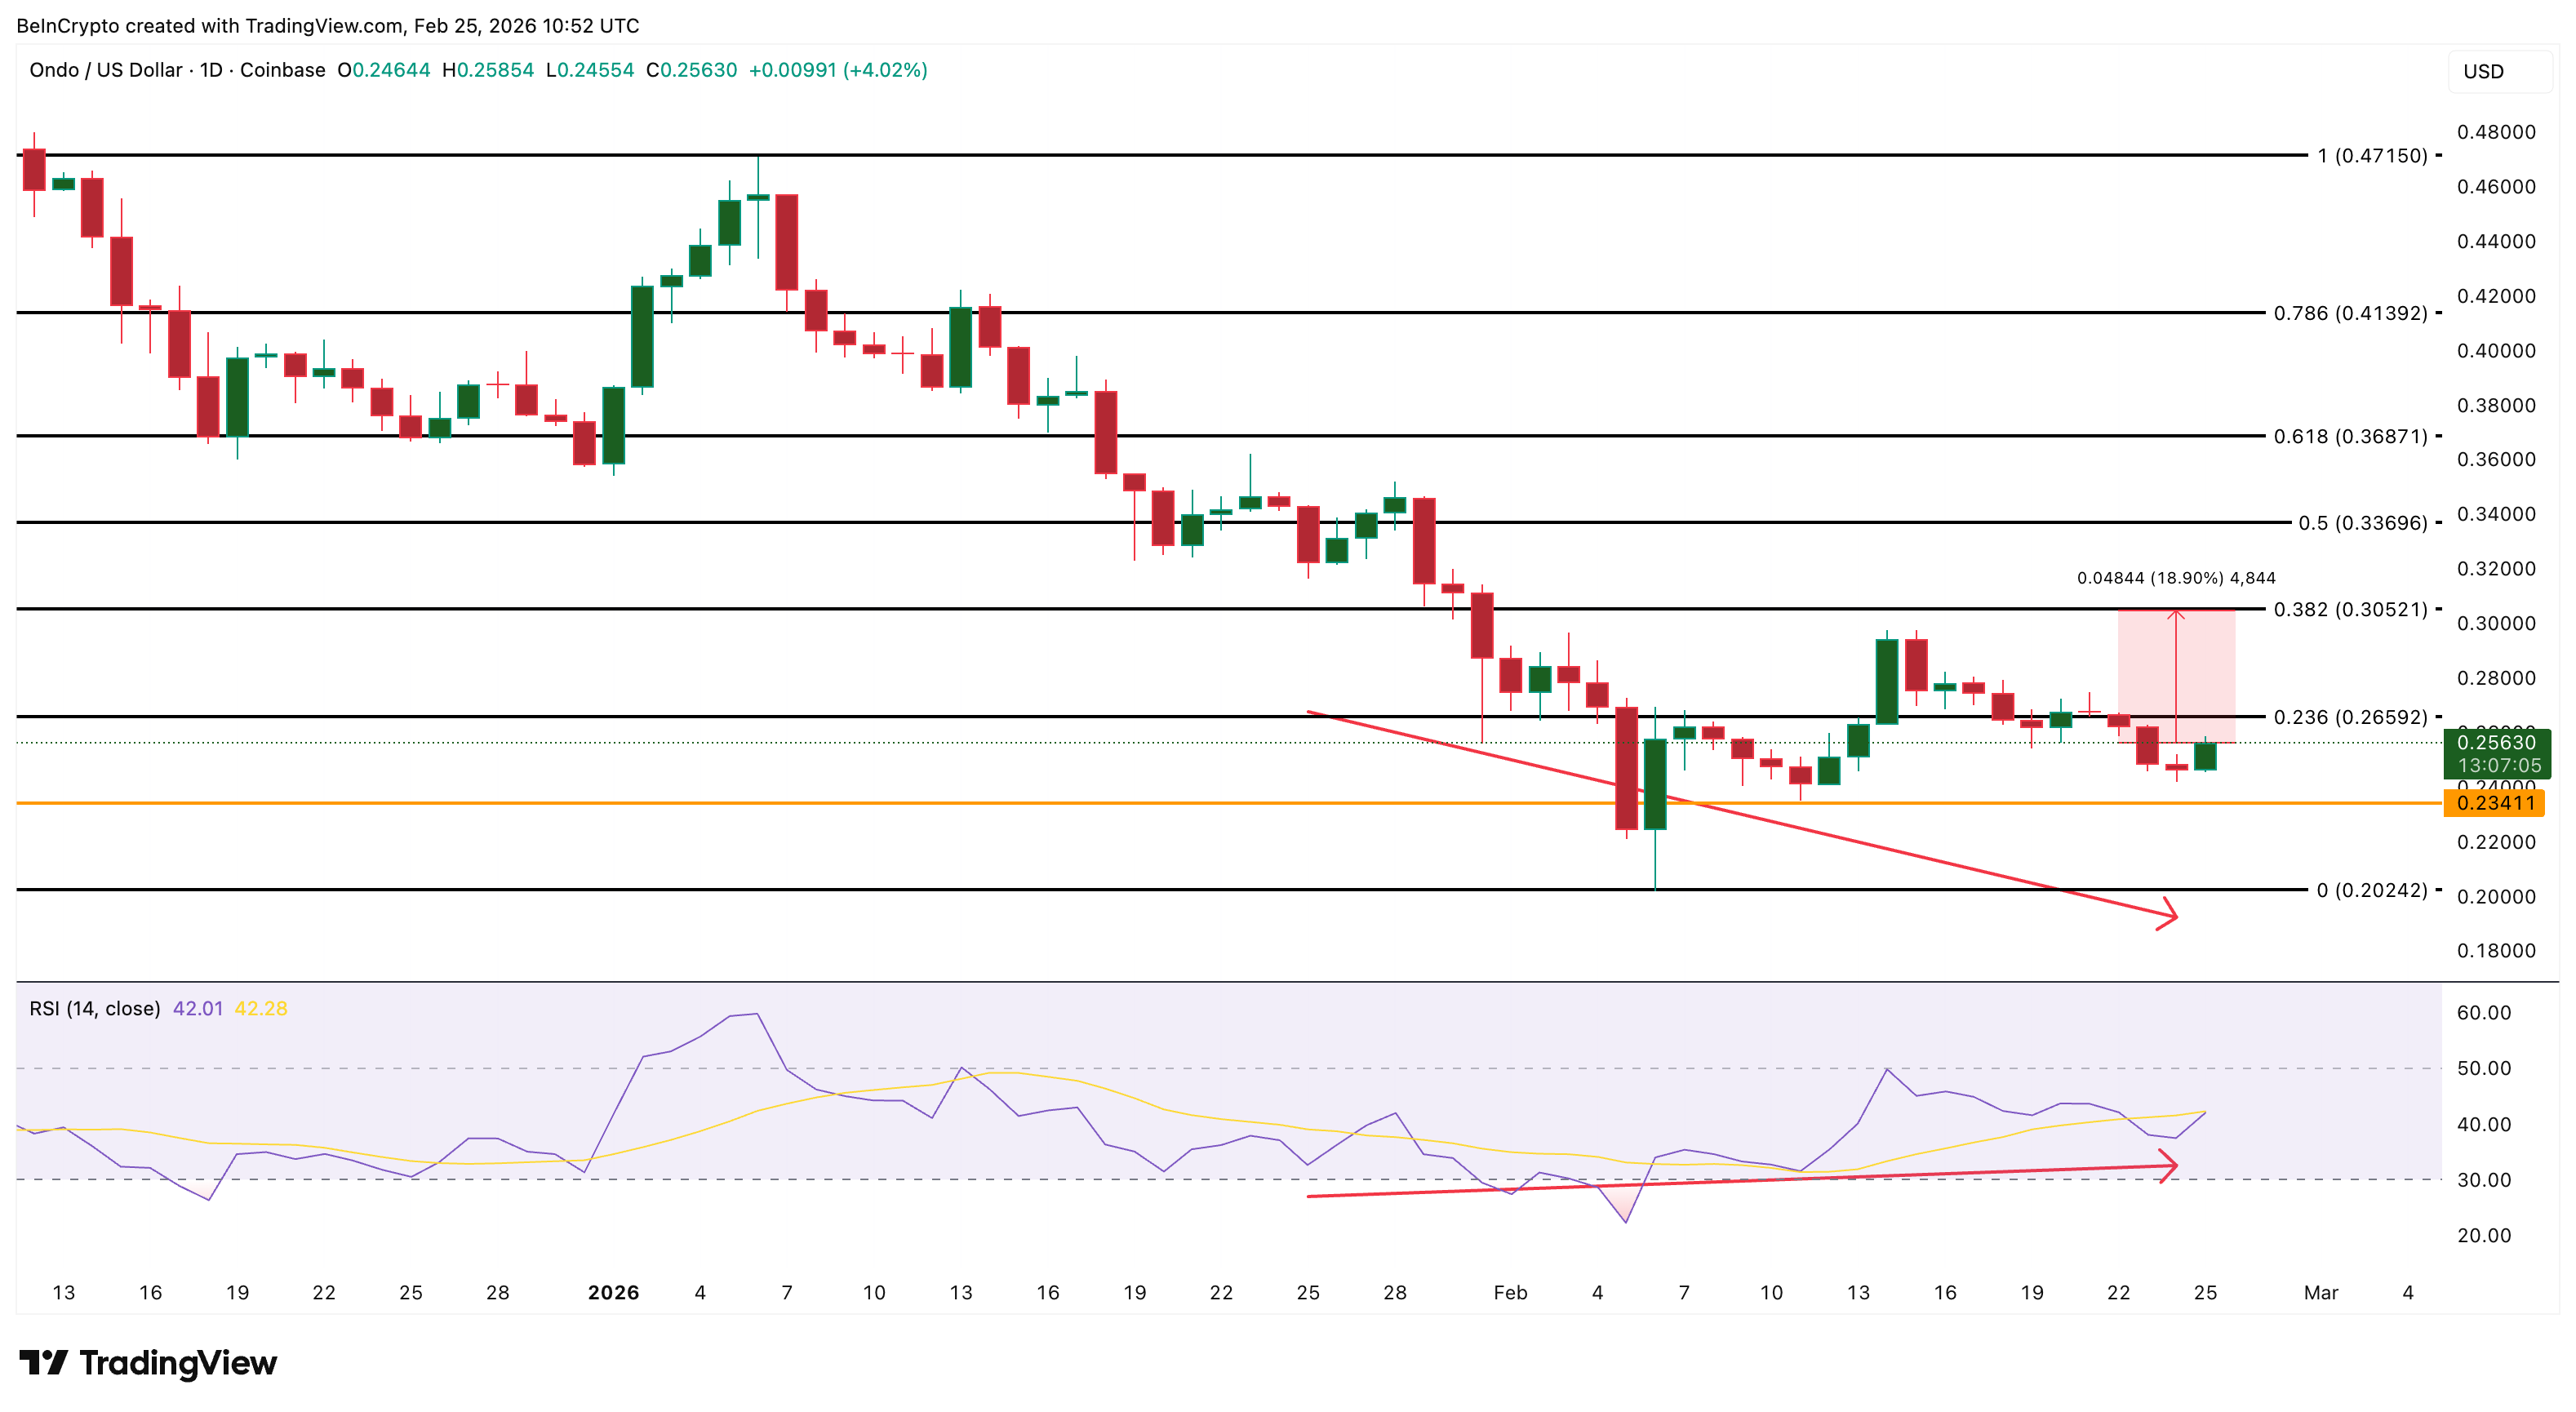
On the downside, support rests at $0.23. Losing that level would increase the risk of another leg lower toward $0.20. This level remains the most important structural floor. A break below $0.20 would weaken the early reversal thesis and confirm that the longer-term downtrend is still in control.

TLDR:
- US agents seized over $61M in Tether linked to a large-scale crypto pig butchering romance scam.
- Scammers built fake romantic relationships to direct victims toward fraudulent crypto trading platforms.
- HSI agents traced stolen USDT through multiple wallets before recovering funds still held in them.
- Tether cooperated with federal authorities, assisting in the transfer of the seized USDT assets.
US agents seize $61M USDT in a major federal operation targeting cryptocurrency romance fraud. The U.S. Attorney’s Office for the Eastern District of North Carolina confirmed the recovery of over $61 million in Tether.
Homeland Security Investigations traced the funds to wallets connected to a large-scale pig butchering scheme. The case began after a fraud victim filed a report through the HSI Tip Line in Raleigh, North Carolina.
Romance Tactics Used to Lure Crypto Victims
Scammers behind the operation first approached victims under the guise of romantic interest. They built trust over time before introducing the topic of cryptocurrency investment opportunities. Once victims felt secure in the relationship, the fraud began to take shape.
The criminals then claimed to have special techniques for generating high returns through crypto trading. They directed victims to fake platforms that closely resembled legitimate cryptocurrency exchanges. Those platforms were designed to look credible in both name and appearance.
Fabricated investment dashboards showed unusually high portfolio gains to keep victims engaged. The false returns were intended to convince victims to deposit more and more money. Nothing shown on those platforms reflected any real trading activity.
When victims attempted to withdraw funds, they were blocked at every turn. Scammers cited reasons such as unpaid “taxes” or “fees” as conditions for releasing money. Those demands were simply further attempts to drain victims of additional funds.
How HSI Tracked and Seized the USDT
After receiving the tip, HSI agents and analysts in Raleigh launched a blockchain tracing operation. They followed the stolen funds as they moved through a series of cryptocurrency wallets.
The movement of funds was a deliberate effort to obscure the origin and ownership of the money.
Despite the layering tactics used, investigators successfully traced the path of the funds. Several wallets at the end of that chain still held large amounts of victim money. Those wallets became the target of federal seizure and forfeiture action.
HSI Charlotte Acting Special Agent in Charge Kyle D. Burns addressed the nature of the threat:
“HSI special agents work diligently to trace the illicit proceeds of crime across the globe to disrupt and dismantle the transnational criminal organizations that seek to defraud hardworking Americans.”
Tether played a cooperative role in the final stage of the recovery process. The company assisted federal authorities in transferring the seized USDT assets. The Department of Justice formally acknowledged Tether’s support in completing the operation.
U.S. Attorney Ellis Boyle reinforced the message behind the seizure:
“Our asset forfeiture team worked along with HSI to take the profit out of crime.”
The case proves that crypto transactions, while complex, leave traceable trails. Federal coordination with stablecoin issuers is becoming a sharper tool against large-scale fraud.

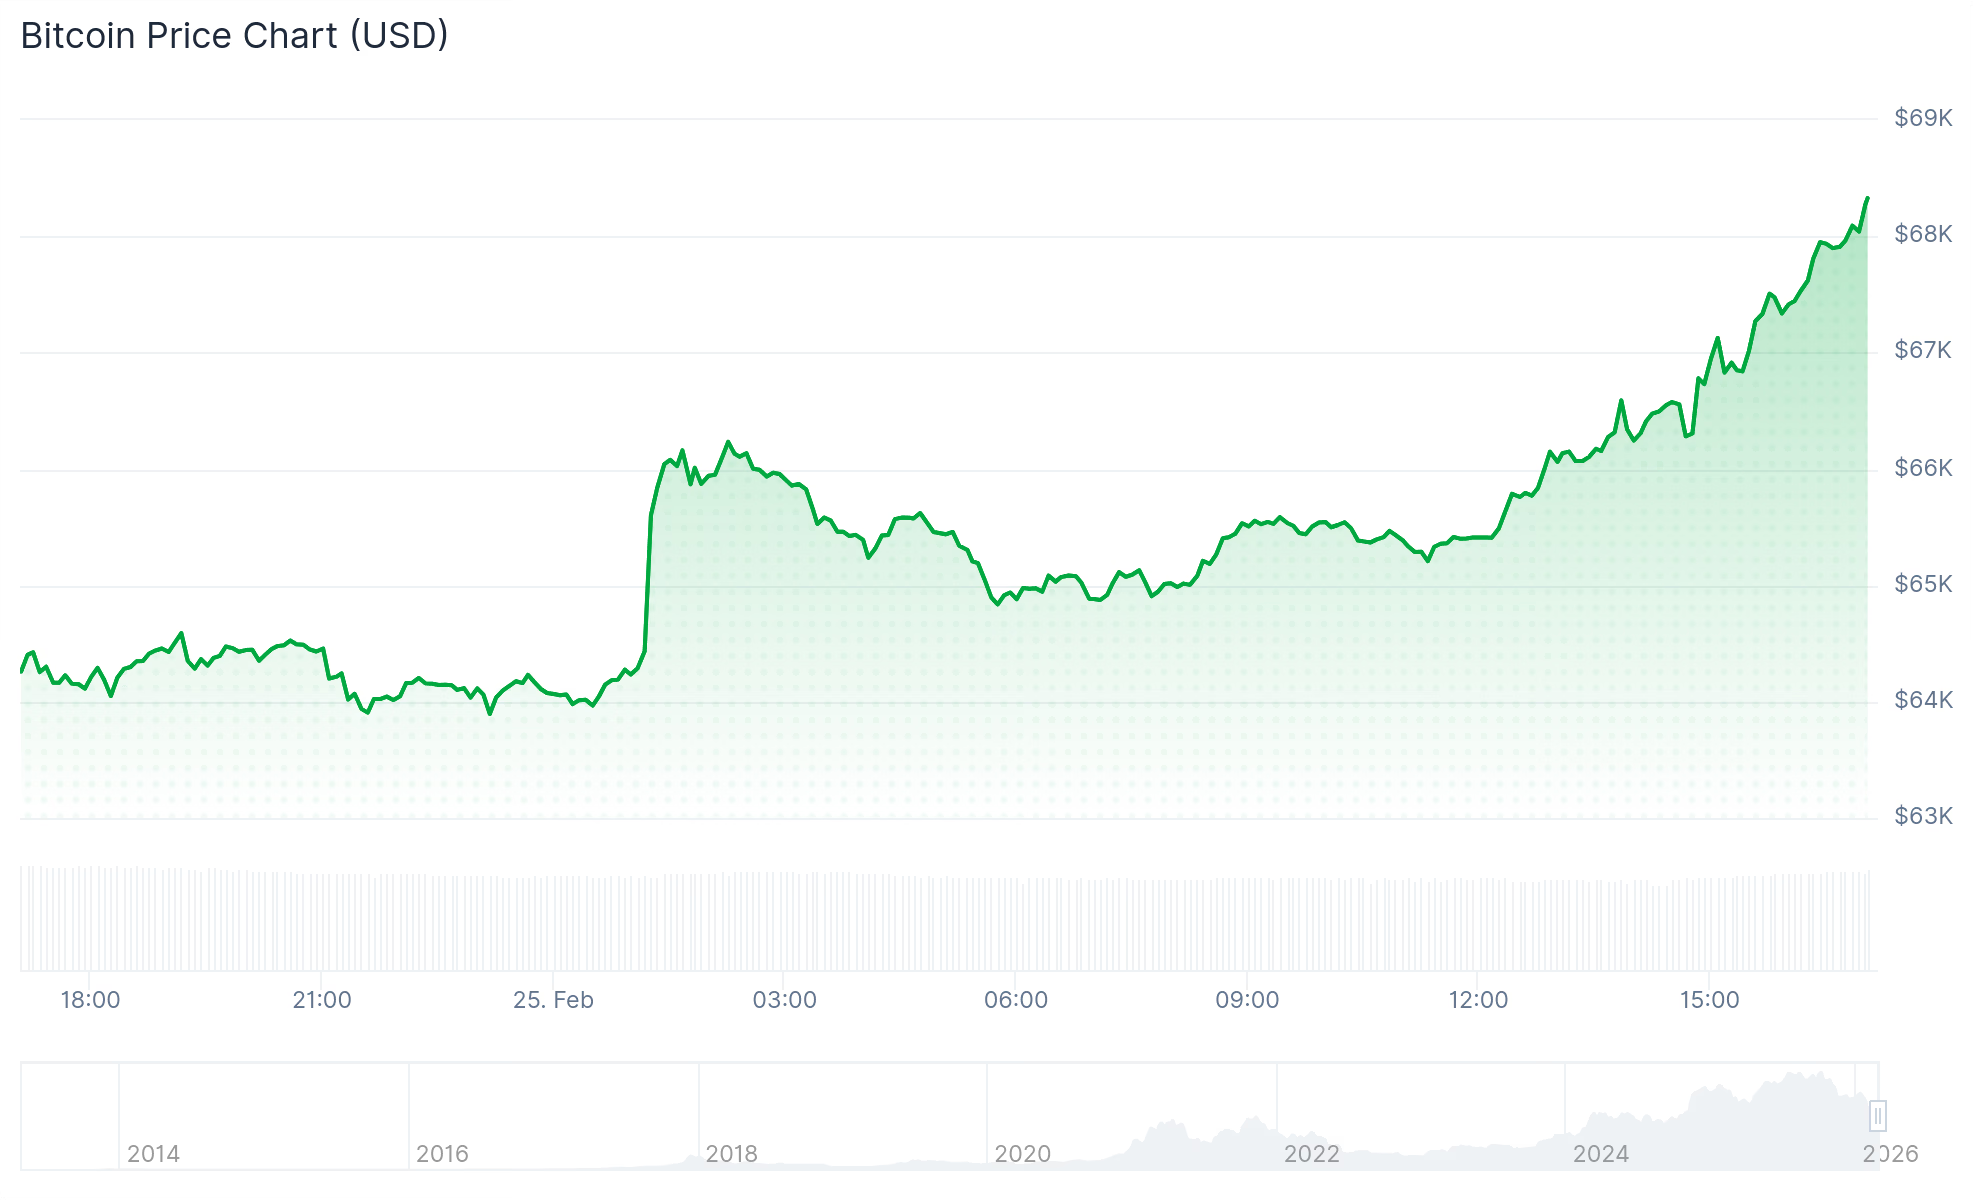
A broad-based rally lifted cryptocurrencies this morning, with BTC and ETH pushing back above key psychological levels, helped by strong spot Bitcoin ETF inflows.
Crypto markets saw a moderate bounce on Wednesday as buyers returned across major tokens, reversing some recent losses. Today, Feb. 25, total crypto market cap climbed about 6% to roughly $2.42 trillion.
Bitcoin (BTC) rose from around $62,900 late Tuesday to about $68,200 at publishing time, posting a 6.2% daily gain and pushing its weekly change just slightly into the green.

Ethereum (ETH) outperformed BTC, jumping over 10% to trade back over $2,060, and up a solid 4.6% on the week. Across the rest of the top-10 crypto assets — all trading higher — Solana (SOL) posted the biggest daily gain, up over 12%.
Unstable Footing
Despite the rebound, some on-chain indicators suggest stress hasn’t fully cleared. Analysts at glassnode said in an X post that Bitcoin’s Realized Profit/Loss Ratio (90-day SMA) has fallen below 1, signaling a shift into an excess loss-realization regime.
“Historically, breaks below 1 have persisted for 6+ months before reclaiming it, a recovery that typically signals a constructive return of liquidity to the market,” the analysts wrote.

Market sentiment is still shaky. The Crypto Fear and Greed Index ticked up to 11 from 8 a day earlier, pointing to a slight easing in fear, but it remains deep in “extreme fear” territory.
Big Movers and Liquidations
Looking at the top-100 assets by market cap, Filecoin (FIL) led gains, surging over 22%, followed by Polkadot (DOT), up almost 22% as well on the day, and Uniswap’s UNI, up 17%.
On the downside, losses were limited: MemeCore (M) slipped 2.8%, while Midnight (NIGHT) lost half a percent.
According to CoinGlass data, roughly 97,300 traders were liquidated over the past 24 hours, with total losses of $316.2 million. Short positions accounted for the bulk at $258.7 million, while BTC liquidations totaled $8.6 million, ETH slightly above $6 million, and SOL $1.6 million.
ETFs and Macro Conditions
On Tuesday, Feb. 24, spot Bitcoin exchange-traded funds recorded over $257 million in net inflows, pushing total net assets to about $81.3 billion. Spot Ethereum ETFs also saw net inflows yesterday of $9.23 million.
On the macro side, U.S. Treasury yields ticked a bit higher as investors digested Trump’s State of the Union, where he leaned hard on the economy and floated ideas ranging from a government-backed retirement plan to limits on institutional home buying, CNBC reported.
Attention now turns to upcoming U.S. economic data releases, including weekly initial jobless claims due Thursday and the producer price index (PPI) report scheduled for Friday, while traders continue to monitor geopolitical developments involving the U.S. and Iran.

5 Wildest Moments From Trump’s Trade Union Speech

Badenoch: Starmer’s Own MPs Call Labour the ‘Paedo Defenders Party’

Whitecaps extend D Tristan Blackmon, M Andres Cubas


-

 Video6 days ago
XRP News: XRP Just Entered a New Phase (Almost Nobody Noticed)
-

 Politics3 days ago
Baftas 2026: Awards Nominations, Presenters And Performers
-

 Fashion5 days ago
Weekend Open Thread: Boden – Corporette.com
-

 Sports2 days ago
Women’s college basketball rankings: Iowa reenters top 10, Auriemma makes history
-

 Politics2 days ago
Nick Reiner Enters Plea In Deaths Of Parents Rob And Michele
-
 Sports7 days ago
Clearing the boundary, crossing into history: J&K end 67-year wait, enter maiden Ranji Trophy final | Cricket News
-

 Crypto World1 day ago
XRP price enters “dead zone” as Binance leverage hits lows
-

 Business3 days ago
Mattel’s American Girl brand turns 40, dolls enter a new era
-

 Business3 days ago
Law enforcement kills armed man seeking to enter Trump’s Mar-a-Lago resort, officials say
-

 Entertainment7 days ago
Dolores Catania Blasts Rob Rausch For Turning On ‘Housewives’ On ‘Traitors’
-
 NewsBeat2 days ago
‘Hourly’ method from gastroenterologist ‘helps reduce air travel bloating’
-

 Tech3 days ago
Anthropic-Backed Group Enters NY-12 AI PAC Fight
-

 NewsBeat3 days ago
Armed man killed after entering secure perimeter of Mar-a-Lago, Secret Service says
-

 Tech1 day ago
Unsurprisingly, Apple's board gets what it wants in 2026 shareholder meeting
-

 Politics3 days ago
Maine has a long track record of electing moderates. Enter Graham Platner.
-

 Crypto World7 days ago
WLFI Crypto Surges Toward $0.12 as Whale Buys $2.75M Before Trump-Linked Forum
-
 NewsBeat20 hours ago
Police latest as search for missing woman enters day nine
-

 Crypto World20 hours ago
Entering new markets without increasing payment costs
-
 Sports2 days ago
2026 NFL mock draft: WRs fly off the board in first round entering combine week
-

 Crypto World6 days ago
83% of Altcoins Enter Bear Trend as Liquidity Crunch Tightens Grip on Crypto Market