

Crypto World
Pepe Coin price rare pattern points to a 150% jump as key metric rises

Pepe Coin price retreated this week, moving from the weekend high of $0.000005030 to the current $0.000004325.
Summary
- Pepe Coin price has formed a giant double-bottom pattern on the daily chart.
- This pattern points to a 150% surge to $0.00001080.
- Pepe’s futures open interest and volume have held steady this week.
The Pepe (PEPE) token remains well above its year-to-date low of $0.0000031, giving it a market capitalization of over $1.78 billion.
The ongoing consolidation is due to the crypto market’s price action, with Bitcoin and most altcoins remaining in a tight range.
However, on the positive side, there are signs that Pepe may be on the cusp of a strong bullish breakout, potentially to the year-to-date high of $0.000072.
Data compiled by CoinGlass show that futures open interest has continued to rise over the past few days, a sign of increased demand among traders betting on a potential rebound.
The futures open interest rose to $262 million, well above the year-to-date low of $200 million. Similarly, Pepe’s daily volume has bounced back from its lowest level this month. It stood at $435 million on Wednesday, much higher than the year-to-date low of $436 million.
Pepe’s volume was much higher than that of other top meme coins. For example, Shiba Inu had a daily volume of $114 million, while Official Trump had $152 million. The elevated volume is also a sign of demand among whale investors.
Pepe Coin price has formed a double-bottom pattern
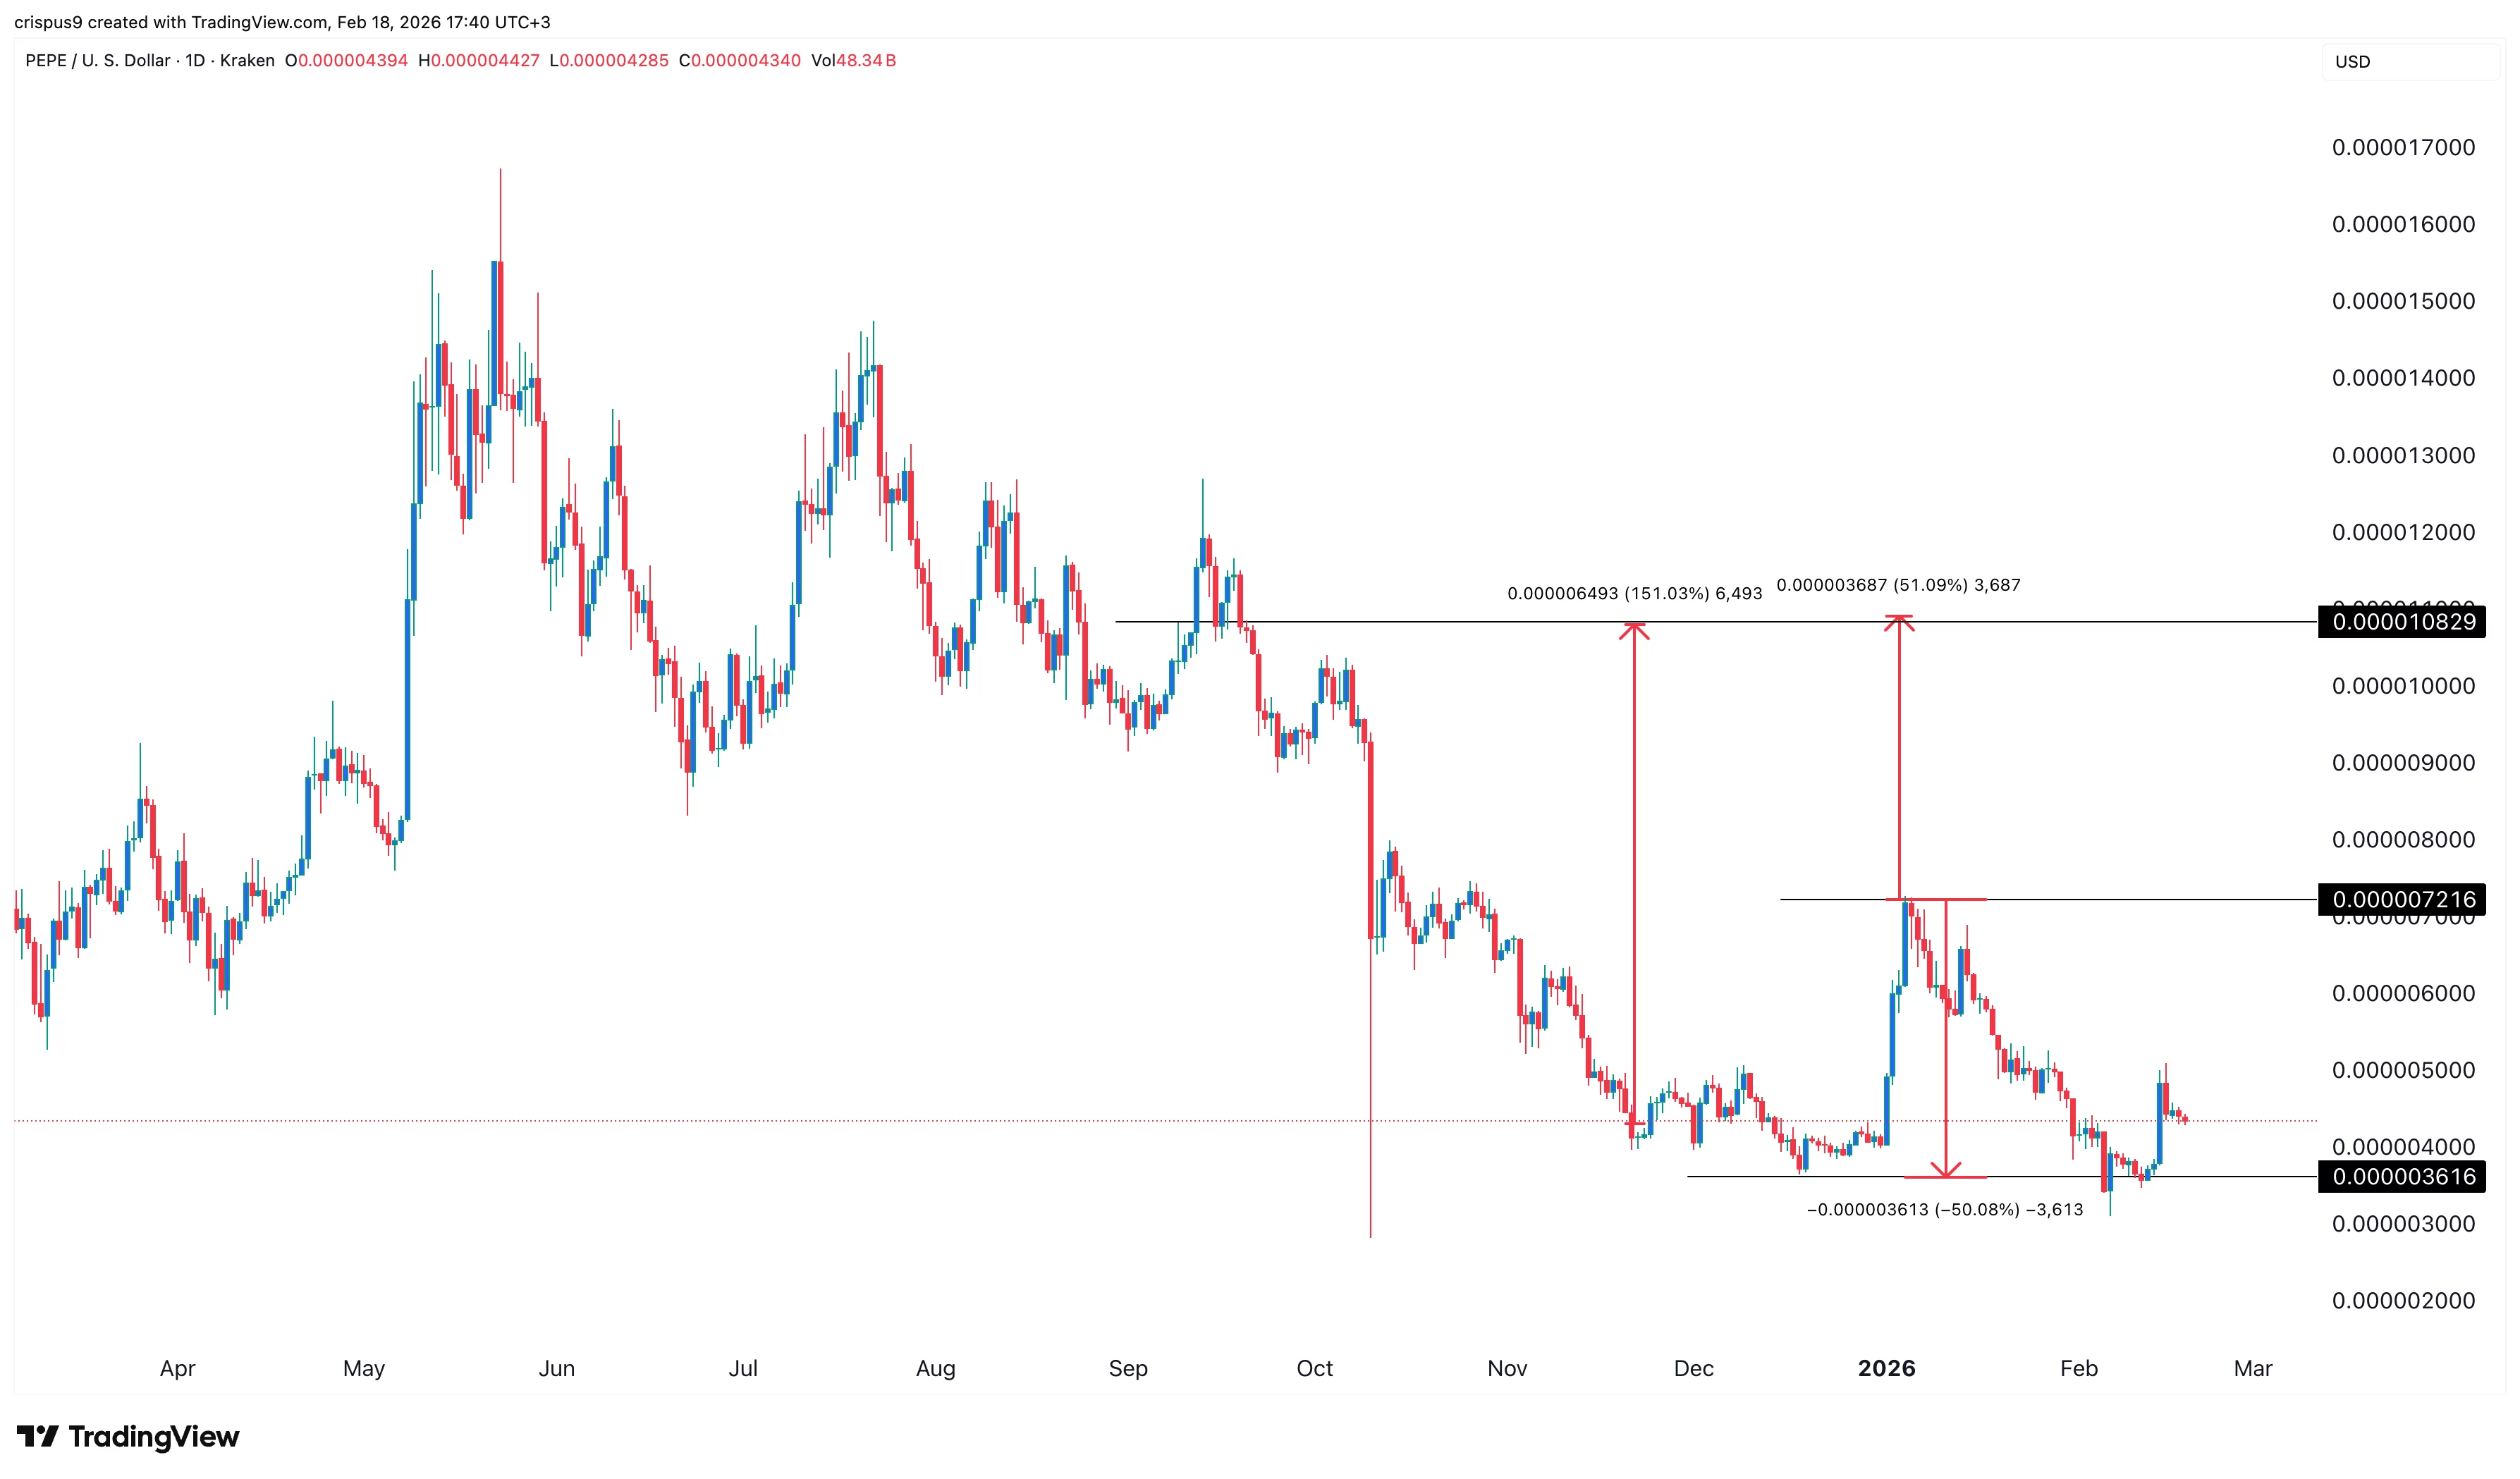
The daily chart shows that Pepe has been in a strong downward trend since 2025 as demand for meme coins waned and most altcoins tumbled.
On the positive side, it has formed a large double-bottom pattern at $0.0000036, its lowest level in December last year and this month.
A double-bottom pattern consists of two low swings and a neckline, which in this case is at $0.0000072. The profit target is determined by first measuring the distance between the neckline and the lower side.
After that, one measures the same distance from the neckline. In this case, Pepe will likely rally to $0.000p1082, up 150% from the current level.
The bullish Pepe Coin price forecast will become invalid if it drops below the double-bottom level at $0.0000036.

Bitcoin (BTC) trades in a tight $65,000–$70,000 range on Wednesday, a structure that has held for the past two weeks.
The lower time frames show a bullish divergence, signaling fading short-term selling pressure, while futures data indicate fresh long positions opened from $66,000.
Analysts say the compression may precede a breakout attempt, with liquidity clusters below $66,000 and above $71,000 being the zones that may define the next directional move.
Bitcoin’s bullish divergence rests near a support level
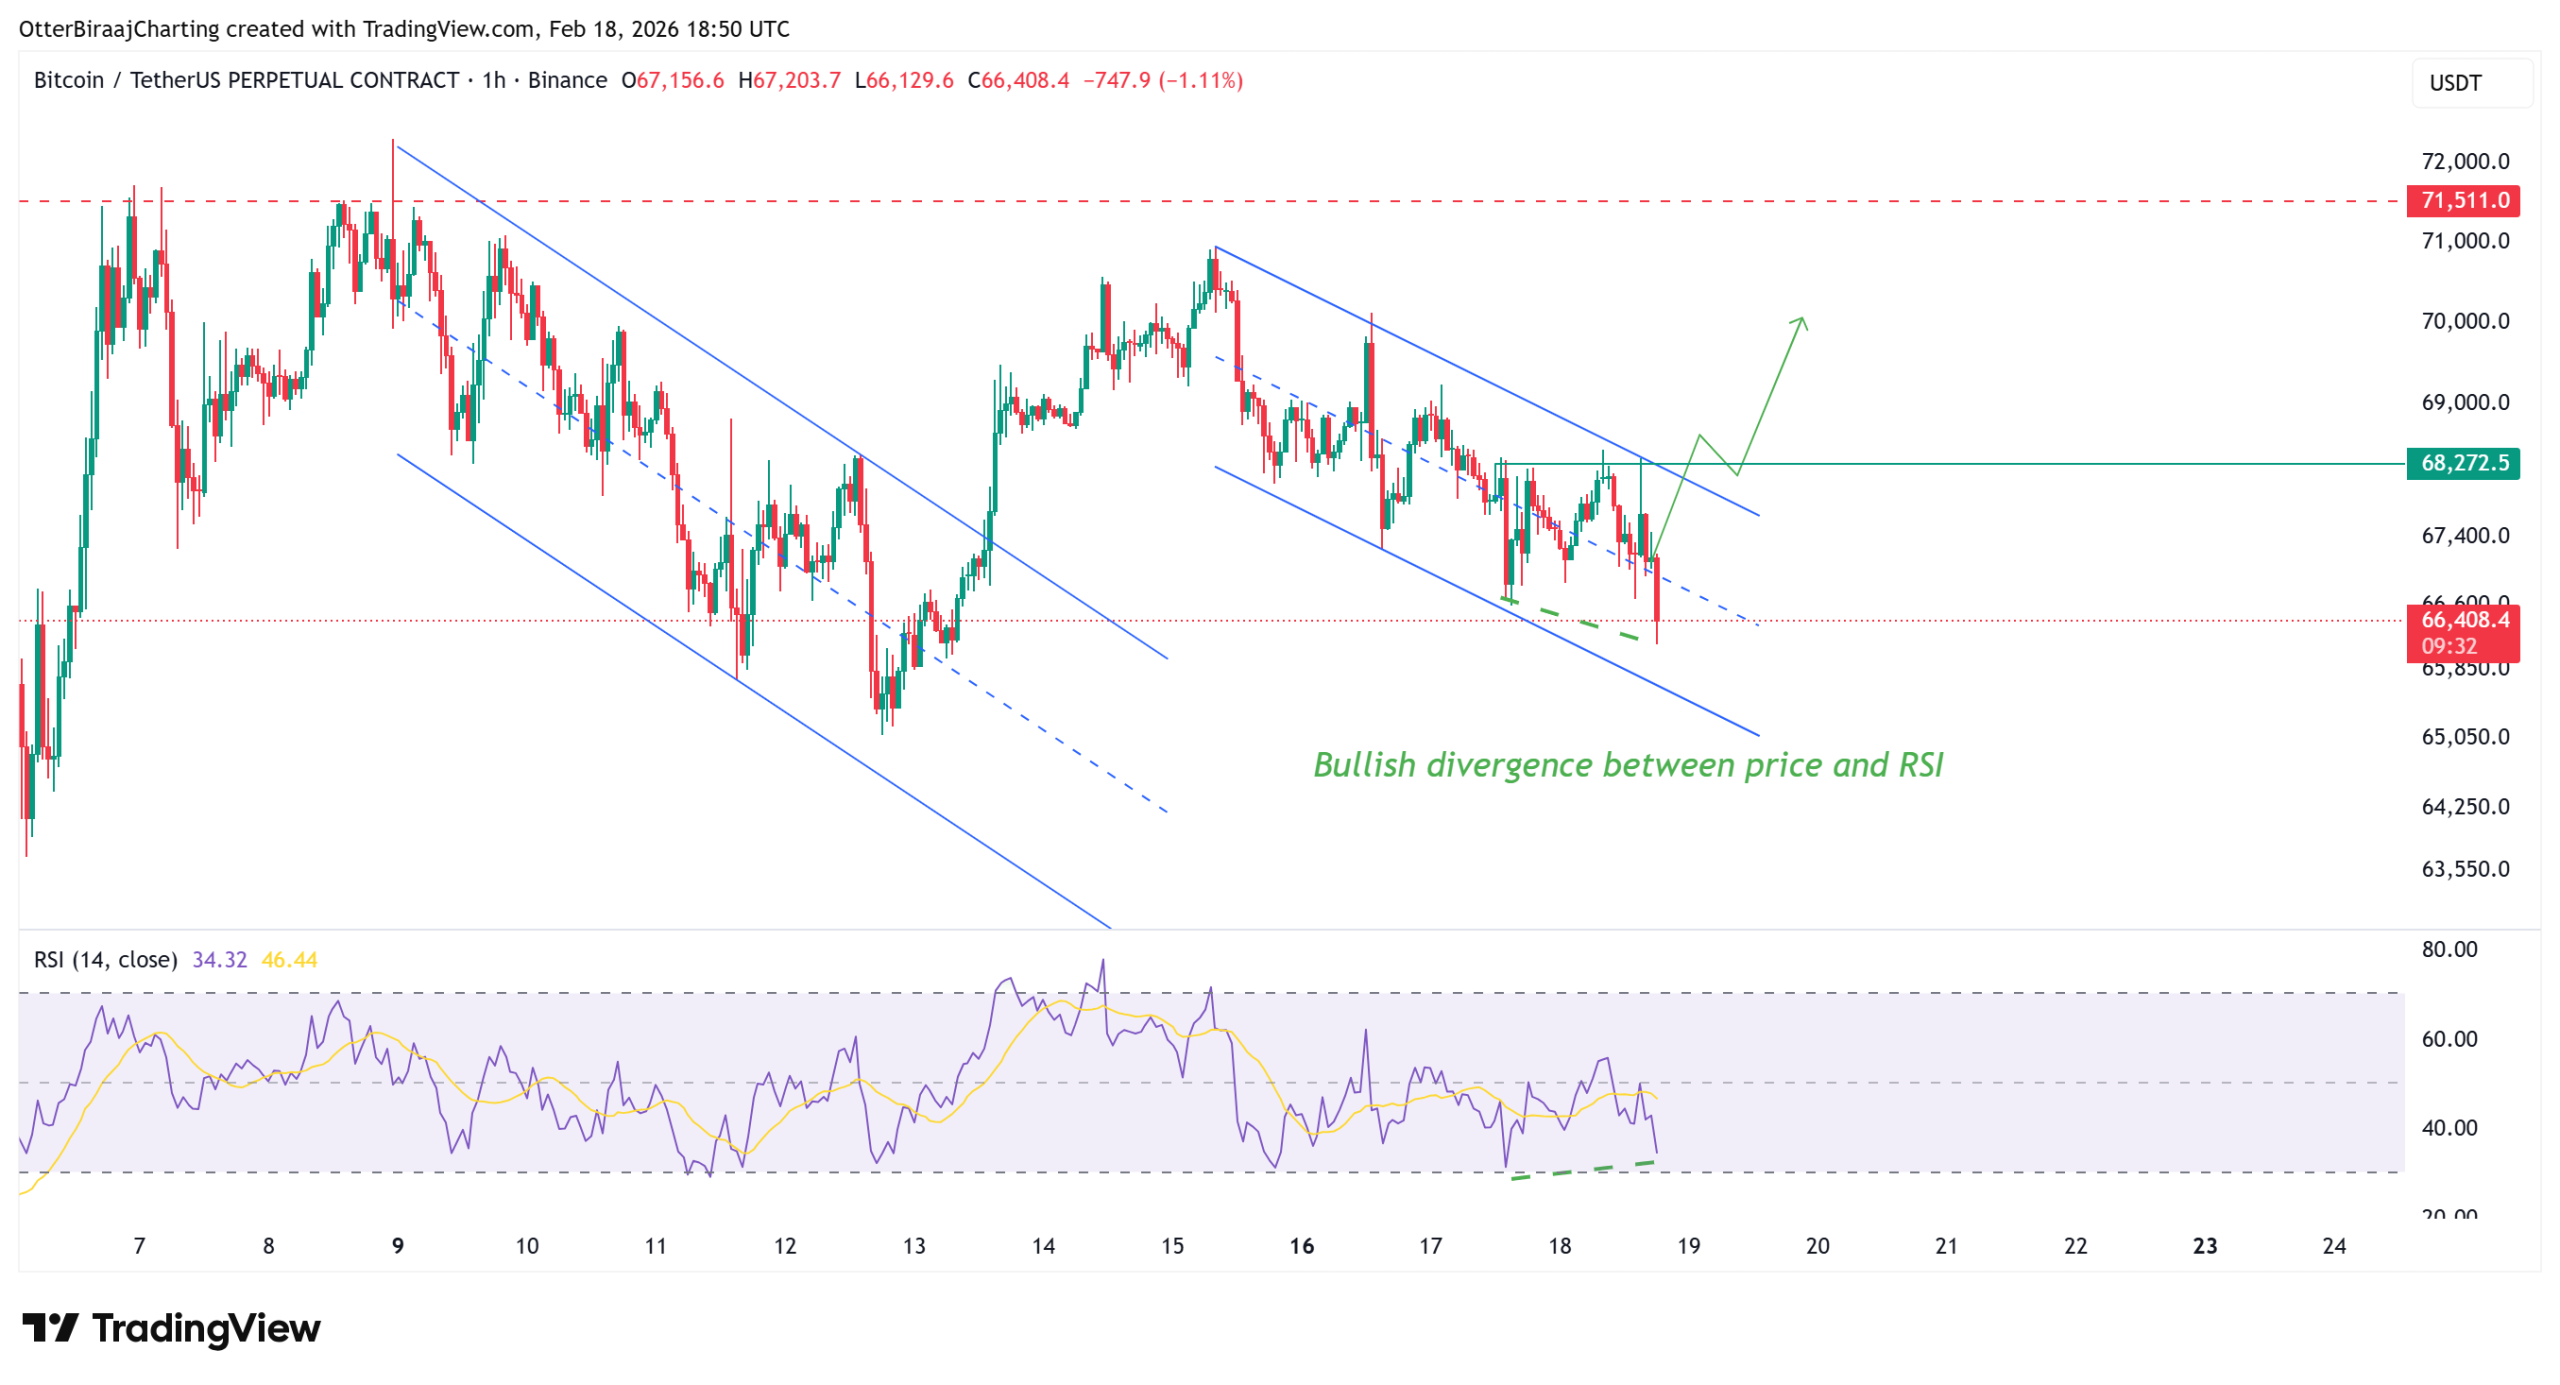
On the one-hour chart, Bitcoin is forming a descending channel similar to last week’s structure that preceded a move toward $70,000. Within this channel, a clear bullish divergence has developed in the relative strength index indicator (RSI).
A bullish divergence occurs when the price makes lower lows or equal lows while the RSI prints higher lows. This sequence suggests that selling pressure is losing strength on the shorter time frame.
A sustained break above $68,000 may confirm momentum, leading to a price rally toward the external liquidity and resistance level above $71,500.

The invalidation level sits below $66,000, where internal liquidity is present near the $65,000. A breakdown beneath that region invalidates the divergence setup and shifts focus to the higher-time-frame support range between $62,000 and $60,000.
Derivatives data shows aggregated open interest has climbed 3% to $15.50 billion from $15.10 billion over the past two days, even as the price drifted lower.
The aggregated funding rate has ticked higher to 0.046%, suggesting a growing long exposure from futures traders.
Since Feb. 15, roughly $250 million in aggregated long liquidations have occurred, forcing leveraged positions to close below $67,000. These long-side sell-offs reduce excess leverage, which may stabilize price and create better conditions for an uptrend once traders re-engage in the market.

Related: Bitcoin’s tech stock divergence is a ‘fire alarm’ for fiat: Arthur Hayes
Futures momentum and macro positioning
Crypto analyst Amr Taha noted a sharp drop in Binance Bitcoin futures power 30-day change, which tracks the net change in price, funding, and open interest. The index fell to -0.18, matching levels last seen between April and May 2024.

Taha said that this may mark a turning point for BTC, as similar deep negative readings between April and May 2024 led to a strong rebound that pushed Bitcoin above the $100,000 level, once the index turned positive in the latter half of 2024.
Meanwhile, crypto analyst Dom said that the spot order books show thin liquidity between $66,000 and $69,000, describing the current activity as neutral, with BTC’s price compressing ahead of a breakout attempt.
Liquidity heatmaps shared by BTC trader Daan show dense liquidity clusters below $66,000 and above $71,000, pointing to areas where stop orders and resting positions are likely concentrated.

Related: Bitcoin 2024 buyers steady BTC price as trader sees $52K ‘next week or so’
This article does not contain investment advice or recommendations. Every investment and trading move involves risk, and readers should conduct their own research when making a decision. While we strive to provide accurate and timely information, Cointelegraph does not guarantee the accuracy, completeness, or reliability of any information in this article. This article may contain forward-looking statements that are subject to risks and uncertainties. Cointelegraph will not be liable for any loss or damage arising from your reliance on this information.


Binance-affiliated investment firm YZi Labs (formerly Binance Labs) publicly accused asset manager 10X Capital on Wednesday of failing to comply with US securities disclosure requirements. The dispute comes amid broader governance changes at CEA Industries.
In an official blog post, the firm alleged that 10X Capital failed to comply with SEC rules requiring disclosure of ownership stakes once a certain threshold is reached.
Sponsored
YZi Labs Accuses 10X Capital of Reporting Violations
The dispute centers on CEA Industries, known by its Nasdaq ticker, BNC. The company describes itself as managing the world’s largest corporate treasury of BNB.
For crypto market participants, the situation is particularly relevant. BNC’s treasury strategy ties it closely to the Binance ecosystem. Governance or asset management changes at the company could affect how its large BNB holdings are managed.
Both YZi Labs and 10X Capital hold positions in BNC, and recent developments indicated an escalating contest over governance.
The latest accusations come just one week after BNC publicly refuted earlier claims made by YZi Labs regarding the company’s compliance with Nasdaq rules tied to the timing of its Annual Meeting of Stockholders. In that February 13 statement, BNC said it was fully compliant and rejected what it described as “false” and “reckless” assertions.
In a formal letter addressed to 10X Capital on Wednesday, YZi Labs alleged that the asset manager failed to properly report its ownership stake in CEA Industries.
Under US securities law, investors who accumulate more than 5% of a public company’s shares must disclose their holdings. That way, other shareholders are aware of potential shifts in influence.
According to YZi Labs, 10X Capital has owned more than 5% of BNC’s shares since late 2025. However, it did not file a Schedule 13D to formally report that stake or disclose that it may have been acting together with other shareholders.
YZi Labs also alleged that 10X Capital founder Hans Thomas, who serves on BNC’s board, did not submit the required SEC filing that directors must complete to disclose their initial share ownership in the company.
“SEC disclosure rules are not ‘personal preferences’ or ‘optional housekeeping’ – they are the baseline standard and non-negotiable obligations for anyone who wants a seat on a public company Board,” said Alex Odagiu, an investment partner at YZi Labs. “If you cannot manage timely Section 16 filings and clear ownership disclosure, you should not be managing a public company.”
Sponsored
The allegations surfaced the same day BNC’s Board of Directors announced a proposal to amend its Asset Management Agreement with 10X Capital.
Governance Stakes Rise Over Asset Deal
In its proposal, the Board said it is seeking lower management fees, a shorter contract term, and more flexible termination provisions. It described the move as part of a broader effort to enhance operational flexibility and long-term value.
It followed what it described as a comprehensive review of the agreement and came after YZi Labs publicly confirmed the termination of a previously undisclosed side agreement with 10X that had restricted amendments to the deal.
Sponsored
With that restriction lifted, the Board said it is moving forward with renegotiation discussions.
The developments unfold alongside YZi Labs’ own regulatory filings. The investment firm previously disclosed that it had crossed the 5% ownership threshold following the company’s share repurchases and later formed a shareholder group.
Crossing that threshold is significant under both federal securities law and Nevada corporate law, where CEA Industries is incorporated.
While federal rules require disclosure, Nevada law governs shareholder rights and board authority. Ownership levels can affect a shareholder’s ability to initiate actions, such as consent solicitations, or to influence governance decisions.
Against that backdrop, the timing of the disclosure dispute and the Board’s push to revise 10X’s asset management agreement suggest the disagreement may extend beyond regulatory filings. It may also reflect deeper questions over control and strategic direction at the BNB-focused public company.


The Federal Reserve’s January meeting minutes revealed a surprisingly hawkish committee. Several officials openly discussed rate hikes. That sets the stage for a dramatic policy clash when Kevin Warsh takes over as chair this summer.
The Fed’s hawkish stance now threatens to box in Warsh before he even starts, raising the stakes for both monetary policy and crypto markets.
Sponsored
Sponsored
A Committee Tilting Hawkish — Right Before a Leadership Change
The FOMC voted 10-2 on Jan. 28 to hold rates at 3.5%-3.75%. Governors Christopher Waller and Stephen Miran dissented. Both preferred a quarter-point cut, citing labor market risks.
But the broader committee leaned the other way. Several participants warned that further easing amid elevated inflation could signal a weakened commitment to the 2% target. A larger group favored holding rates steady. They wanted a “clear indication that disinflation was firmly back on track” before cutting again.
Most strikingly, several officials wanted the post-meeting statement to reflect possible “upward adjustments” to the federal funds rate. This was a direct reference to potential rate hikes.
Powell Out, Warsh In — And a Policy Collision Looms
Chair Jerome Powell’s term ends in May. He has two more meetings at the helm. Trump announced on Jan. 30 that former Fed Governor Warsh would replace him.
Warsh has spoken in favor of lower rates. That aligns with Trump’s repeated calls for cheaper borrowing. The White House on Wednesday insisted recent data showed inflation was “cool and stable.”
But the committee’s hawkish majority may not cooperate. Rate decisions are made by 12 voting members. Only a few lean dovish. The rest see inflation risks as the top priority.
Sponsored
Sponsored
Analysts noted that the committee’s hawkish tone could complicate Warsh’s confirmation process and limit his room to pivot toward cuts early in his tenure.
If confirmed, Warsh’s first meeting as chair would be in June. Futures traders price the next cut around the same time. But the Fed’s preferred inflation gauge — the PCE Price Index — is expected to re-accelerate in the coming months. That could delay any easing further.
Asian Liquidity Returns, Amplifying the Selloff
Bitcoin began sliding shortly after the minutes dropped during US afternoon trading. It fell from around $68,300 to below $66,500 by early Asian morning hours. That marked a 1.6% decline over 24 hours.
The timing mattered. Asian traders were returning from the Lunar New Year holiday. Rising volumes and turnover amplified the move lower. Escalating US-Iran tensions added fuel. Oil prices surged more than 4%, further weighing on risk appetite across crypto markets.
Coinbase CEO Brian Armstrong called the decline psychological rather than fundamental. He said the exchange was buying back shares and accumulating Bitcoin at lower prices.
What Comes Next
The Fed’s next meeting is on March 17-18. A cut there is effectively off the table. Markets now look to June as the earliest window.
But the real question extends beyond timing. It is whether Warsh can steer a deeply divided committee toward cuts while inflation remains sticky. The hawkish majority has made its position clear. Changing that will require more than a new chair.
For Bitcoin, the macro backdrop remains challenging. The combination of a hawkish Fed, a contested leadership transition, and returning Asian liquidity points to continued volatility in the weeks ahead.

Crypto industry executives at Cointelegraph’s LONGITUDE conference in Hong Kong stressed the importance of addressing Bitcoin’s technological risks and said that clear US regulations can’t come soon enough.
Co-hosted by crypto exchange OneBullEx, the Feb. 12 event opened with a fireside chat featuring Tron founder Justin Sun, who discussed what the industry needs to prioritize — including preparing for artificial general intelligence (AGI) — which many expect to arrive within the next few years.
“We need to create a very easy standard for AGI to use blockchain,” Sun said.

Sun’s fireside chat was followed by three panel discussions covering the quantum computing threat to Bitcoin, the potential impact of the US CLARITY Act on the industry, and the progress of crypto infrastructure toward a trillion-dollar scale.
Despite a volatile crypto market at the end of 2025, industry players expressed optimism about the industry’s future.
Bitcoiners should ‘discount the value’ until quantum solve
Quantum computing, which some in the Bitcoin community see as a serious potential threat, sparked a debate among panelists.
Capriole Investments founder Charles Edwards said the risk should be priced into Bitcoin until the asset becomes quantum-resistant.
“Today, you kind of have to start to discount the value of Bitcoin based on that risk until it’s solved,” Edwards said. He pointed to growing fears about quantum computing as a primary reason Bitcoin’s price ended the year lower than it started.

“If you just look at the data, 2025 should have been a great year for Bitcoin,” Edwards said, explaining that quantum became a “non-zero threat” and US-based Bitcoin ETF issuers began adding risk disclaimers for quantum.
Meanwhile, Matthew Roszak, Bloq chairman and Hemi co-founder, wasn’t as worried about how it might play out:
“To look at this as a movie trailer and what’s ahead for Bitcoin and quantum. Just the preview here. It’s a two-step process. We’re going to upgrade and chill. That’s it. That’s the process.”
Maelstrom managing partner and co-founder Akshat Vaidya admitted that quantum is an “existential threat,” but it will be met with a “coordinated response that’s proportionate.”
US CLARITY Act will be significant for the industry
White House crypto and AI czar David Sacks said in December that the US is “closer than ever” to passing the US CLARITY Act, which aims to provide the industry with clearer regulations.
Although the bill hasn’t passed, industry panelists agreed that the US has become noticeably more friendly toward crypto since President Donald Trump took office.

Sean McHugh, senior director at Dubai’s Virtual Assets Regulatory Authority, who previously worked in TradFi in the US, said one of the main reasons he moved to Dubai was its more crypto-friendly regulatory environment than the US.
“I think one of the reasons why I moved to Dubai is because, you know, they were committed to clarity when I left a year and a half ago,” McHugh said, adding:
“The US was in a very different place than it is now.”
Grayscale Investments’ chief legal officer, Craig Salm, pointed to past conflicts over crypto between the two US financial regulators during the Joe Biden administration.
“There used to be this whole turf war between the SEC and the CFTC,” Salm said, adding:
“Your regulator fighting over jurisdiction just isn’t productive for anybody.”
Salm also noted that the environment has changed. Instead of clashing, the SEC and CFTC are meeting together and coordinating to bring much-needed clarity to the asset class.
“Which is exactly what I think we all need,” Salm said.
Doubts over crypto infrastructure readiness for big flows
When asked whether crypto infrastructure is ready to handle trillion-dollar institutional flows, the panelists expressed some doubts.
“I would say probably not yet,” Offchain Labs chief strategy officer A.J. Warner said.

Monad Foundation head of institutional growth, Joanita Titan, echoed Warner’s sentiment. “Billion-dollar payments or billion-dollar processing is not a problem, but trillion dollars, I don’t think we’re there yet,” she said.
Warner argued that the largest bottlenecks are “continuing to scale, resiliency of networks, and user experiences.”
Cointelegraph’s exclusive LONGITUDE events will continue in 2026, with editions planned for New York, Paris, Dubai, Singapore and Abu Dhabi.

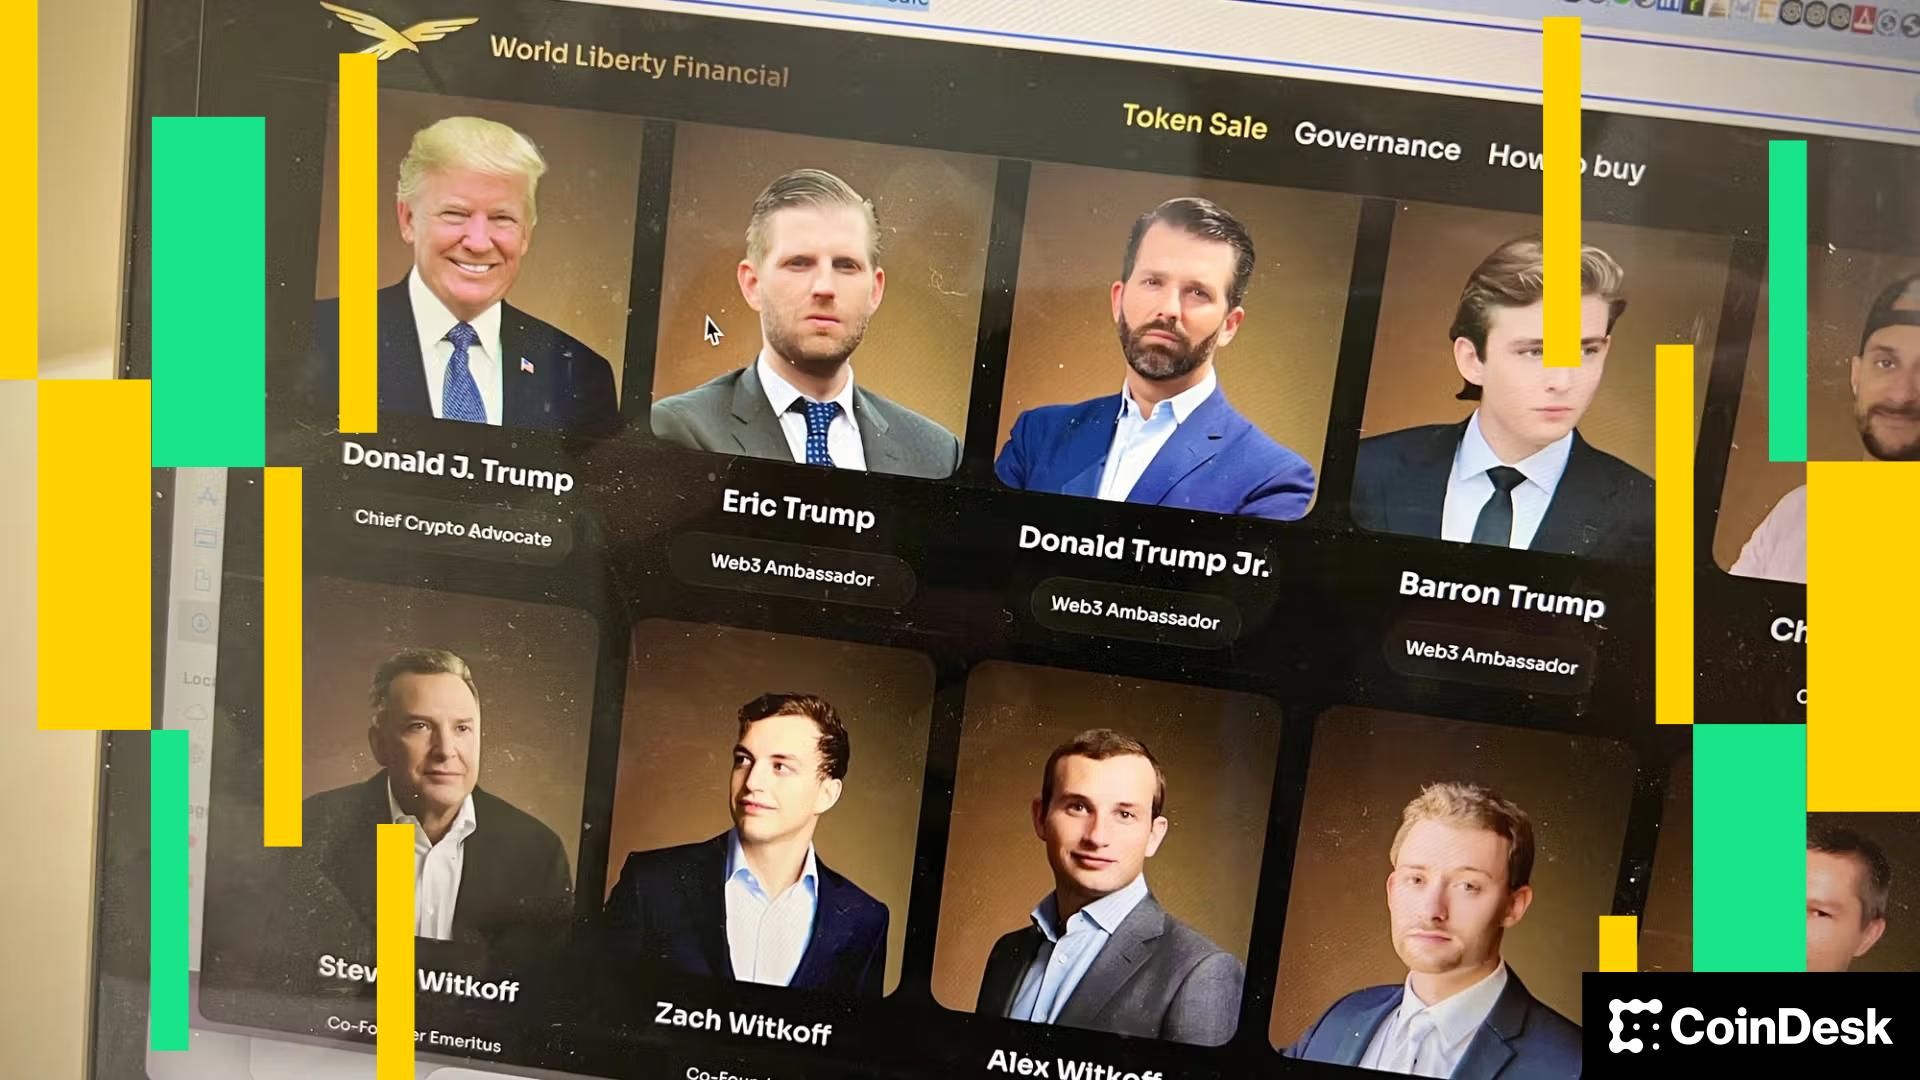
PALM BEACH, Fla. — Apex Group, a global financial services provider overseeing more than $3.5 trillion in assets, has partnered with , the crypto company affiliated with U.S. President Donald Trump, to pilot the use of a stablecoin in traditional fund operations, the companies announced at the World Liberty Forum at Mar-a-Lago on Wednesday.
The collaboration centers on WLFI’s USD1 stablecoin, which Apex will test as a payment rail for subscriptions, redemptions and distributions across its tokenized fund ecosystem, it said in a press release. Apex, which provides administrative and operational services to a broad client base that includes hedge funds, pension funds, banks and family offices, said the goal is to improve settlement speed and reduce operational overhead for institutional clients.
Zach Witkoff, the co-founder and CEO of World Liberty, called USD1 infrastructure for a future financial services ecosystem during opening remarks at the forum.
The firm has been increasingly active in the digital asset space, using blockchain to tokenize portions of the funds it services. Tokenizing funds, or issuing shares on blockchain rails, can help firms streamline reporting, lower fees and reach a wider investor base.
In May, Apex deepened its blockchain focus by acquiring Tokeny, a Luxembourg-based firm known for building infrastructure to issue and manage real-world assets (RWAs) on-chain. It also acquired London-based Globacap, an investing platform with a U.S.-registered broker-dealer, expanding Apex’s ability to tokenize regulated securities in the U.S., where interest in blockchain-based RWAs is growing among asset managers.
Apex CEO Peter Hughes said in a statement that clients “increasingly want blockchain-based solutions that deliver tangible benefits and cost savings,” in a statement.
As part of the WLFI collaboration, Apex will also explore making WLFI tokenized assets — such as real estate and infrastructure — available on the London Stock Exchange Group’s (LSEG) Digital Market Infrastructure platform, subject to regulatory approval. WLFI said it plans to launch a mobile app that connects traditional bank accounts with digital asset wallets and enables users to access these tokenized holdings.

Editor’s note: The Global Blockchain Show 2026 in Riyadh signals a maturation of the blockchain ecosystem as regional tech hubs elevate governance, finance, and collaboration. This editorial introduces the event coverage, emphasizing how policymakers, business leaders, and developers are aligning to explore practical use cases, open networks, and scalable infrastructure. As the organizers showcase a global lineup and deep dives into digital finance, governance, and Web3 tooling, readers will find a concise briefing that precedes the official press release. Our aim is to provide context for why Riyadh’s edition matters for the broader decentralized tech landscape.
Key points
- Global Blockchain Show Riyadh 2026 expects about 10,000 attendees, 250+ speakers, 200+ exhibitors, and 300+ media representatives.
- Expert-led sessions cover trends in blockchain adoption, tokenomics, and business applications with hands-on learning.
- Panels with regulators, legal experts, and industry leaders will provide guidance on navigating markets.
- Riyadh edition runs June 29–30, 2026, organized by VAP Group and powered by Times of Blockchain.
- Event aims to showcase open metaverse, governance, security, and real-world impact of decentralized tech.
Why this matters
Riyadh’s hosting of Global Blockchain Show 2026 demonstrates a growing global emphasis on blockchain as a driver of digital economy and governance. The event’s scale and high-profile speaker lineup highlight increasing regulatory dialogue, enterprise adoption, and regional collaboration. By examining real-world use cases, security, and interoperability, the conference supports informed decision-making for investors, startups, and policymakers shaping the future of decentralized technologies.
What to watch next
- Final speaker lineup and program highlights announced.
- Partner and sponsor confirmations for Riyadh edition.
- Regulatory sessions or policy guidance revealed.
- Post-event insights and industry impact assessments.
Disclosure: The content below is a press release provided by the company/PR representative. It is published for informational purposes.
Global Blockchain Show 2026: Riyadh Becomes the Hub of Decentralized Innovation
The Global Blockchain Show 2026 in Riyadh is becoming an unmatched platform for thought leaders, innovators, and blockchain enthusiasts. After a successful feat at Abu Dhabi, the next edition, organized by VAP Group and powered by Times of Blockchain, is scheduled for 29 – 30 June 2026, in Riyadh. It will focus on the capability of blockchain technology, and will cover a broad spectrum of subjects from digital finance to decentralized governance.
Global Blockchain Show (GBS) will witness over 10,000 attendees, along with 250+ speakers, 200+ exhibitors, and 300+ media representatives.
Attendees will gain access to a comprehensive suite of expert-led sessions discussing trends in blockchain adoption, tokenomics, and business applications. The event will offer hands-on learning experiences, which allows participants to experiment with the latest blockchain solutions. This will help them in making a practical impact on businesses and communities.
GBS Riyadh edition too will see panels featuring regulators, legal experts, and industry leaders who will provide guidance on navigating complicated markets.

The event has previously welcomed an impressive lineup of renowned global leaders and leading innovators in the fields of blockchain and technology. H.E. Justin Sun, Founder, Global Advisor, and Prime Minister of TRON, HTX, and Liberland, and Yat Siu, Co-Founder and Chairman of Animoca Brands, have shared their insights. Ahmed Bin Sulayem, Executive Chairman and CEO of the Dubai Multi Commodities Centre (DMCC), and John Lilic, CEO of Hilbert Group, have also contributed. The event featured Dr. Marwan Alzarouni, CEO of Dubai Blockchain Center and CEO AI for Dubai Economy & Tourism, and Jason Allegrante, Chief Legal & Compliance Officer at Fireblocks. Rachel Conlan, CMO of Binance, Sunny Lu, CEO of VeChain, Abdulla Al Dhaheri, CEO of Abu Dhabi Blockchain Center, and investor Murad Mahmudov have also been part of this impressive event.
By bringing together stakeholders from different walks of the blockchain industry, the Global Blockchain Show reinforces Riyadh’s role as a main hub for tech and innovation.
The Global Blockchain Show Riyadh 2026 convenes visionaries, innovators, and industry leaders to discuss the disruptive potential of blockchain, Web3, and decentralized technologies. In two days, the conference dives deep into the actual-world impact of blockchain, next-gen trading, and the development of the Web3 ecosystem in Saudi Arabia. Participants will be treated to sessions on the open metaverse, superintelligence and creativity, and security and scalability through cloud infrastructure. Among the highlights are provocative exchanges on the future of Ethereum, how blockchain impacts global governance, and how to balance security with sustainability. Keynotes and fireside interviews will feature NFTs and the creator economy, quantum computing advancements, tokenization of real-world assets, and Web3 wallets of the future.
Attendees will depart motivated, armed with practical knowledge, and prepared to define the next generation of digital innovation. Not only a conference, the Global Blockchain Show is a worldwide gathering of ideas, collaboration, and expansion that propels the future of decentralized technology and economic empowerment.
Media enquiries :
Press contact : Media@globalblockchainshow.com
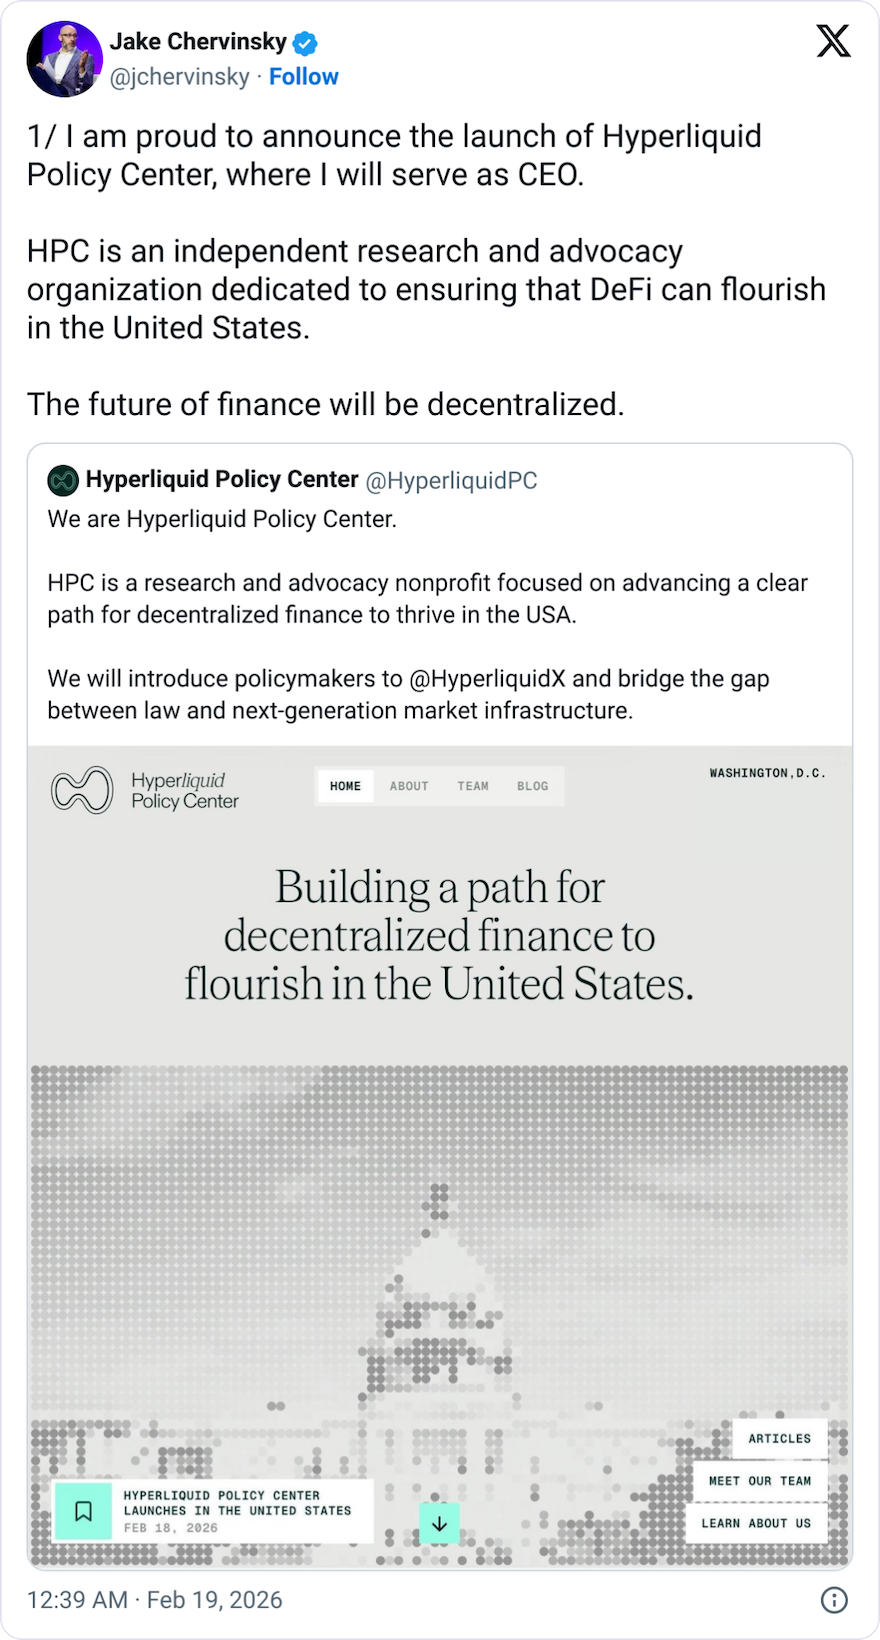
Crypto platform Hyperliquid has launched a new advocacy organization aimed at pushing through policy changes involving decentralized finance in Congress.
The Hyperliquid Policy Center said on Wednesday that it had launched in Washington, DC, and named Jake Chervinsky as founder and CEO, a veteran crypto lawyer who was the legal head at crypto venture fund Variant and former policy chief at crypto lobbyist Blockchain Association.
The organization said it will look to advance “a clear, regulated path for decentralized finance to thrive in the United States” and will push policy “with a specialty in perpetual derivatives and blockchain-based financial infrastructure.”
Hyperliquid is a layer-1 blockchain and perpetual futures exchange that has recently exploded in popularity as traders turned to commodities trading amid a broad market downturn, and the platform has looked to expand into prediction markets.
The Hyper Foundation, an independent body that backs Hyperliquid, will contribute 1 million Hyperliquid (HYPE) tokens to fund the policy center’s launch.
“Critical time” for policy, says Hyperliquid CEO
Chervinsky said more traditional finance companies are launching blockchain-based products or services because the technology offers “efficiency, transparency, and resilience that legacy systems cannot match.”
“This technology is poised to become the base layer of the global financial system,” he added. “Now the United States must choose: we can either adopt new rules that allow this innovation to thrive here at home, or we can wait and watch as other nations seize the opportunity.”

Hyperliquid co-founder and CEO Jeff Yan said on X that it was a “critical time in policy discussions” in the US and that the platform had “lacked a unified voice in important policy discussions until now.”
Related: Coin Center urges Senate not to axe crypto developer protection bill
“There is a tangible and urgent possibility of upgrading the tech stack of the existing financial system,” he said. “Global financial regulation will be shaped in the United States, and we must work to ensure that these new policies thoughtfully embrace the potential of the new financial system.”
Congress is working to pass a bill defining how market regulators are to police crypto, but the legislation is stalled in the Senate as lawmakers, along with the crypto and bank lobbies, disagree on provisions pertaining to stablecoins.
The Hyperliquid Policy Center said its founding team also included the newly-appointed policy director, Salah Ghazzal, Variant’s former policy lead, and policy counsel, Brad Bourque, a former associate at Sullivan & Cromwell, a law firm famously tied to the fraudulent crypto exchange FTX.
Magazine: How crypto laws changed in 2025 — and how they’ll change in 2026

TLDR
- Franklin Templeton’s XRP ETF holds 118 million XRP, valued at approximately $216.37 million by the end of December 2025.
- The ETF, launched on November 24, 2025, is entirely focused on XRP, with 100% of its assets allocated to the digital asset.
- As of February 17, 2026, the ETF’s net asset value (NAV) is $16.08, reflecting a year-to-date return of -18.54%.
- Since its launch, the ETF has seen a 23.20% decline in returns, primarily due to fluctuations in XRP’s price.
- Other major cryptocurrency ETFs, such as those from Bitwise and Grayscale, have contributed to the growing institutional exposure to XRP.
Franklin Templeton’s XRP exchange-traded fund (ETF), launched in late November 2025, has drawn attention for its growing holdings. The fund, trading under the ticker XRPZ, provides investors with exposure to XRP without directly purchasing the digital asset. As of December 31, 2025, the ETF’s holdings amounted to 118 million XRP, valued at $216.37 million.
118 Million XRP on the Books
According to Franklin Templeton’s latest SEC filing, the firm’s XRP ETF officially started on November 24, 2025. By the end of the year, the fund held 118,387,154 XRP, worth approximately $216.37 million. The report confirmed that 100% of the ETF’s net assets were invested in XRP.
The ETF’s primary structure focuses entirely on XRP, a pure-play approach without diversification into other assets. As of February 17, 2026, Franklin Templeton’s XRP ETF reached $243.6 million in total net assets. Despite the challenges in the crypto market, the fund has continued to attract institutional investment.
Franklin Templeton ETF Performance
Despite strong institutional interest, Franklin Templeton’s XRP ETF has faced challenges with market volatility. As of mid-February 2026, the fund’s net asset value (NAV) stood at $16.08, reflecting a year-to-date return of -18.54%. Since its inception, the ETF has experienced a decline of 23.20%, primarily due to the fluctuations in XRP’s price.
The cryptocurrency’s price saw a drop from $2.577 at launch to $1.11 by February 2026. At present, XRP price trades around $1.48, still significantly lower than its price at launch. These fluctuations have affected investor sentiment, as the firm cautions that past performance does not guarantee future results.
Franklin Templeton’s XRP ETF is part of a broader trend of institutional involvement in cryptocurrency investment products. Other major ETFs, including those from Bitwise, Canary Capital, and Grayscale, have also accumulated significant amounts of XRP. Combined with Franklin Templeton, these ETFs now control $1.06 billion in total assets focused on XRP.


Shares of Riot Platforms (RIOT) rose nearly 9% Wednesday after activist investor Starboard Value LP released a letter pressing the company to accelerate its transition from bitcoin mining to AI infrastructure provider. The aim is for Riot to pursue high-margin artificial intelligence and high-performance computing (AI/HPC) hosting deals.
Riot’s 1.7 gigawatts of fully available power capacity make the company “well positioned to execute high-quality AI/HPC deals,” said Starboard, highlighting two of Riot’s Texas-based sites, Corsicana and Rockdale, as “premier” locations for data center development.
Starboard said that if Riot can monetize its power in line with recent transactions in the space, “it could generate more than $1.6 billion” in annual EBITDA. The group praised Riot’s recent deal with AMD, which is projected to yield $311 million over 10 years.
With a market cap of $4.25 billion, Texas-based Riot is the fifth-largest bitcoin mining company in the U.S. Its shares have risen by 19% in the past year, but remain lower by about 80% from highs hit during the 2021 bitcoin bull market. They’ve also underperformed miners like IREN, Cipher Mining, and Hut 8, which were quicker to recognize and transition to AI strategies.
Starboard was Riot’s fourth-largest shareholder as of the end of last year, and this isn’t its first push on the company. In December 2024, Starboard requested that Riot convert some of its bitcoin mining sites into data centers capable of hosting HPC machines to support big tech companies.
While Riot Platforms has built its business around bitcoin mining, the pivot toward AI infrastructure could diversify revenue as power-hungry models like OpenAI’s GPT-4o and others drive data center demand. Riot’s power access, a rare commodity in the current energy-constrained data center market, could be used to lease capacity to major AI firms.
Starboard urged CEO Jason Les and Executive Chairman Benjamin Yi to act “with urgency” and position Riot as a long-term infrastructure provider for AI workloads.
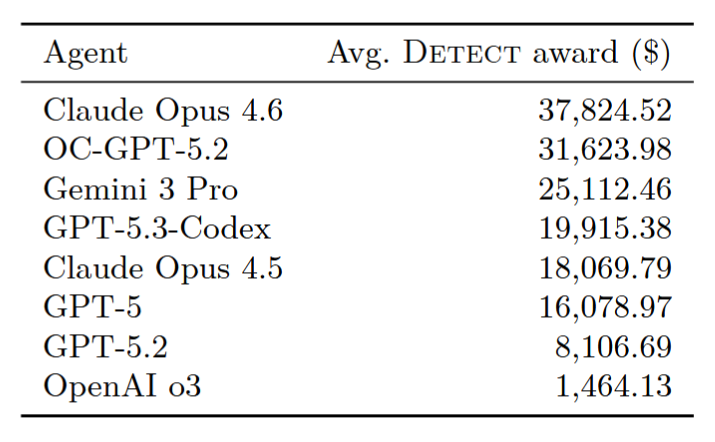
OpenAI has launched a new benchmark that evaluates how well different AI models detect, patch, and even exploit security vulnerabilities found in crypto smart contracts.
OpenAI released the “EVMbench: Evaluating AI Agents on Smart Contract Security” paper on Wednesday, in collaboration with crypto investment firm Paradigm and crypto security firm OtterSec, to evaluate how much the AI agents could theoretically exploit from 120 smart contract vulnerabilities.
Anthropic’s Claude Opus 4.6 came out on top with an average “detect award” of $37,824, followed by OpenAI’s OC-GPT-5.2 and Google’s Gemini 3 Pro at $31,623 and $25,112, respectively.

While AI agents are becoming increasingly efficient at handling basic tasks, OpenAI said it is becoming more important to evaluate their performance in “economically meaningful environments.”
“Smart contracts secure billions of dollars in assets, and AI agents are likely to be transformative for both attackers and defenders.”
“We expect agentic stablecoin payments to grow, and help ground it in a domain of emerging practical importance,” OpenAI added.
Circle CEO Jeremy Allaire predicted on Jan. 22 that billions of AI agents will be transacting with stablecoins for everyday payments on behalf of users within five years, while former Binance boss Changpeng “CZ” Zhao also recently tipped that crypto would end up being the “native currency for AI agents.”
The need to test agentic AI performance in spotting security vulnerabilities comes as attackers stole $3.4 billion worth of crypto funds in 2025, a marginal increase from 2024.
Related: China’s AI lead will shape crypto’s future
EVMbench drew on 120 curated vulnerabilities from 40 smart contract audits, most of which were sourced from open-source audit competitions. OpenAI said it hopes the benchmark will help track AI progress in spotting and mitigating smart contract vulnerabilities at scale.
Smart contracts weren’t built for humans: Dragonfly
In a post to X on Wednesday, Dragonfly’s managing partner Haseeb Qureshi said crypto’s promise of replacing property rights and legal contracts never materialized, not because the technology failed, but because it was never designed for human intuition.
Qureshi said it still feels “terrifying” to sign large transactions, particularly with drainer wallets and other threats always present, whereas bank transfers rarely provoke the same fear.
Dragonfly’s @hosseeb explains why AI agents will use crypto rather than the traditional financial system:
“You can see it right now on Moltbook. Agents are trying to find ways to pay each other for things. It’s very primitive right now, but you can see where it’s going.”
“If I… pic.twitter.com/oWzQuuZcWN
— TBPN (@tbpn) February 18, 2026
Instead, Qureshi believes the future of crypto transactions will be facilitated by AI-intermediated, self-driving wallets, which will take care of those threats and manage complex operations on behalf of users:
“A technology often snaps into place once its complement finally arrives. GPS had to wait for the smartphone, TCP/IP had to wait for the browser. For crypto, we might just have found it in AI agents.”
Magazine: IronClaw rivals OpenClaw, Olas launches bots for Polymarket — AI Eye

Haley Kalil Says Matt Kalil Penis Size Comments Aren’t Invasion of Privacy

Jio Finance share Analysis Prakash Gaba/Buy? jio financial services latest news,longterm target 2030
TUI launches new route from Manchester to beautiful Spanish city

Smart energy pays enters the US market, targeting scalable financial infrastructure

Why Israel is blocking foreign journalists from entering
Software stocks enter bear market on AI disruption fear with ServiceNow plunging 10%
Jio Finance share Analysis Prakash Gaba/Buy? jio financial services latest news,longterm target 2030

togi’s financial advice (this is not financial advice)

BITCOIN & CRYPTO MARKET JUST FLIPPED (for now)!!! – Bitcoin News Today, Ethereum & Altcoins
-

 Video2 days ago
Bitcoin: We’re Entering The Most Dangerous Phase
-

 Tech4 days ago
Luxman Enters Its Second Century with the D-100 SACD Player and L-100 Integrated Amplifier
-

 Sports2 days ago
GB's semi-final hopes hang by thread after loss to Switzerland
-

 Crypto World2 days ago
Can XRP Price Successfully Register a 33% Breakout Past $2?
-

 Video6 days ago
The Final Warning: XRP Is Entering The Chaos Zone
-
 Tech2 days ago
The Music Industry Enters Its Less-Is-More Era
-

 Business1 day ago
Infosys Limited (INFY) Discusses Tech Transitions and the Unique Aspects of the AI Era Transcript
-

 Entertainment14 hours ago
Kunal Nayyar’s Secret Acts Of Kindness Sparks Online Discussion
-

 Video2 days ago
Financial Statement Analysis | Complete Chapter Revision in 10 Minutes | Class 12 Board exam 2026
-

 Tech18 hours ago
Retro Rover: LT6502 Laptop Packs 8-Bit Power On The Go
-
 Crypto World5 days ago
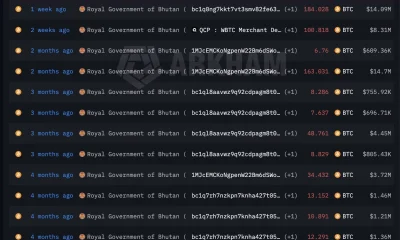
Bhutan’s Bitcoin sales enter third straight week with $6.7M BTC offload
-

 Video7 days ago
Prepare: We Are Entering Phase 3 Of The Investing Cycle
-

 Entertainment5 hours ago
Dolores Catania Blasts Rob Rausch For Turning On ‘Housewives’ On ‘Traitors’
-
 NewsBeat3 days ago
The strange Cambridgeshire cemetery that forbade church rectors from entering
-

 Business7 days ago
Barbeques Galore Enters Voluntary Administration
-

 Business20 hours ago
Tesla avoids California suspension after ending ‘autopilot’ marketing
-

 Crypto World6 days ago
Kalshi enters $9B sports insurance market with new brokerage deal
-

 Crypto World8 hours ago
WLFI Crypto Surges Toward $0.12 as Whale Buys $2.75M Before Trump-Linked Forum
-
 Crypto World6 days ago
Ethereum Price Struggles Below $2,000 Despite Entering Buy Zone
-
 NewsBeat4 days ago
Man dies after entering floodwater during police pursuit