
Crypto World
Pi Network bucks crypto market crash as major mainnet upgrade fuels hype
Pi Network price managed to brush off the bearish sentiment prevailing in the broader crypto market amid a major mainnet upgrade that introduced smart contract functionality to the Pi ecosystem.
Summary
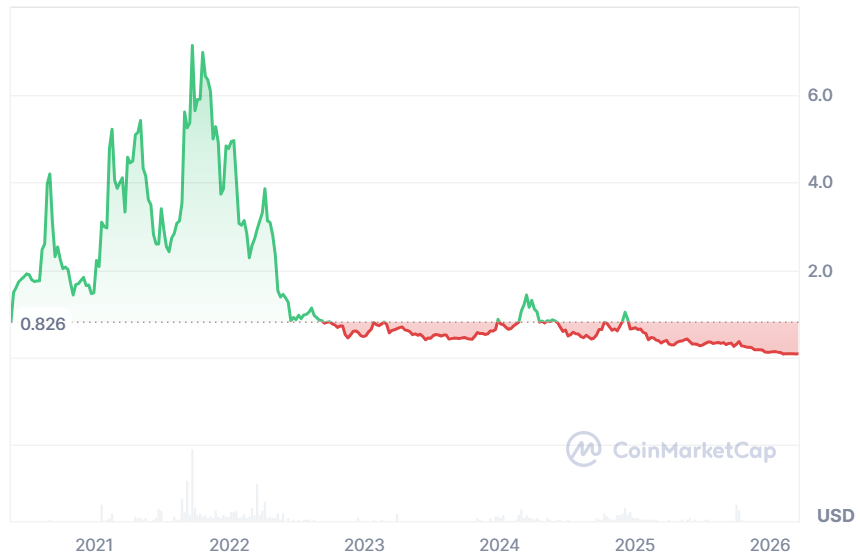
- Pi Network price held steady near $0.177 after a brief drop, defying a broader crypto market downturn despite remaining nearly 40% below its post-listing high.
- The resilience followed the rollout of mainnet version 20, which introduced smart contract capabilities and boosted expectations for ecosystem growth.
- Technical indicators remain bearish, with PI trading below key moving averages and facing downside risk if support near $0.176 fails.
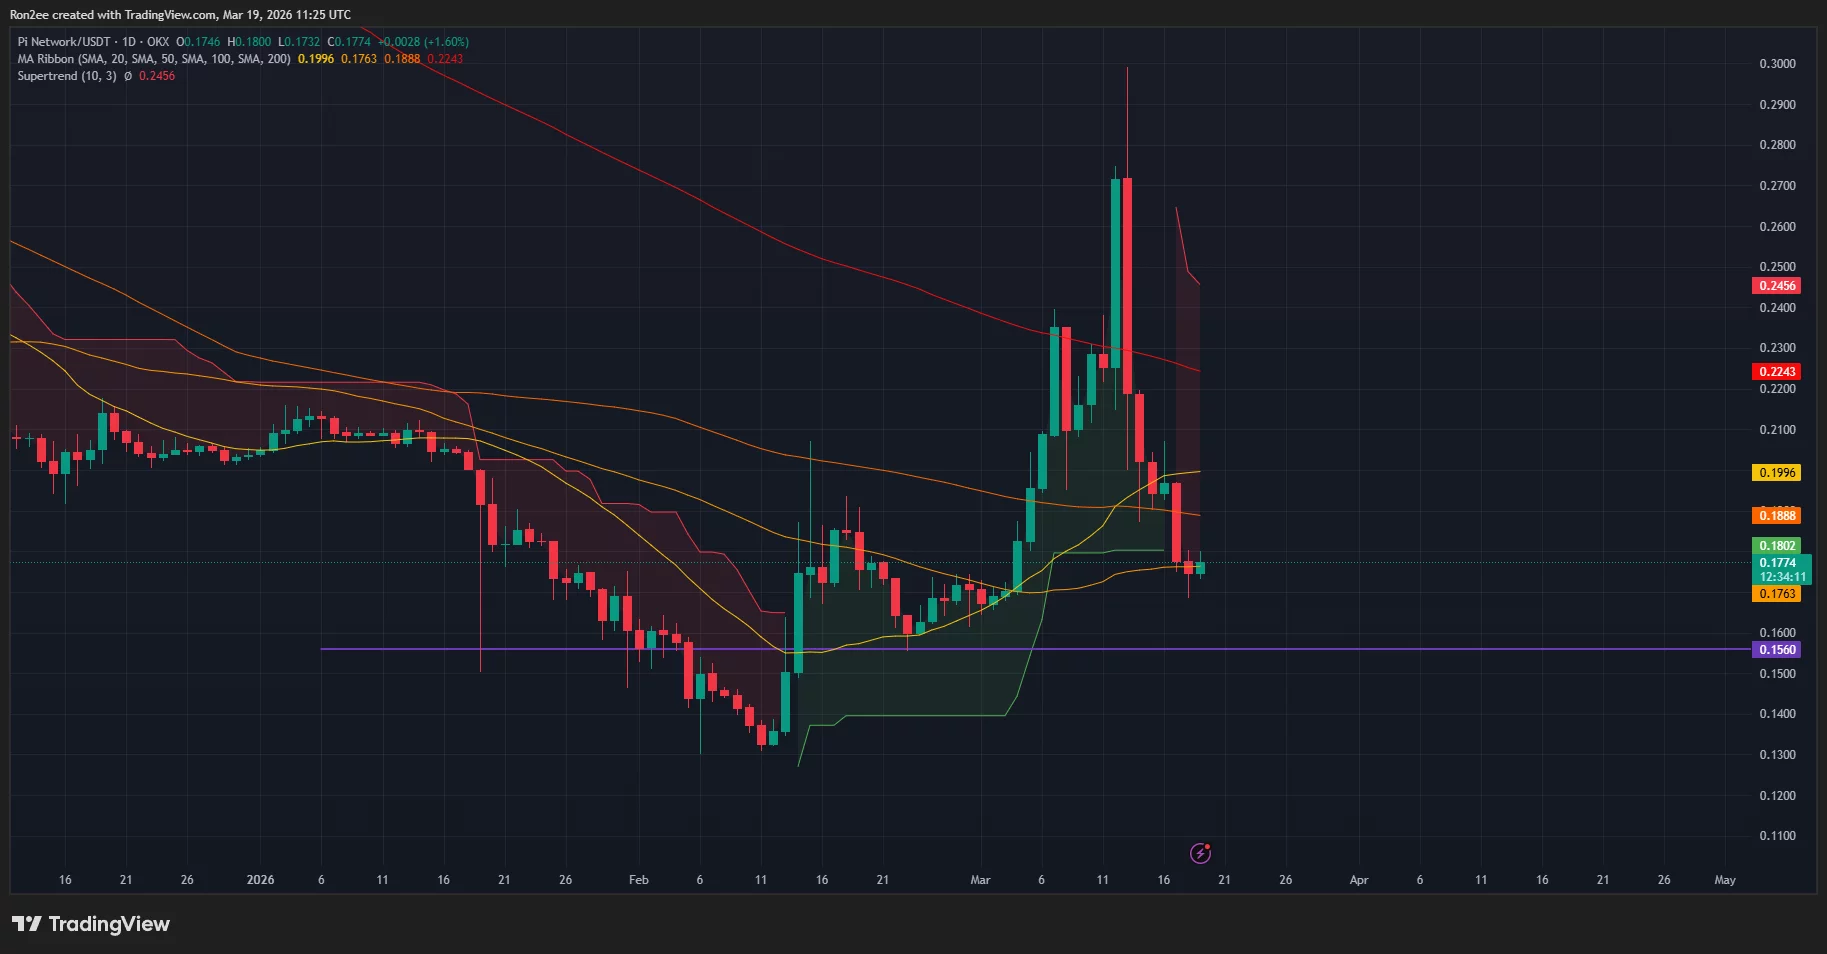
According to data from crypto.news, Pi Network (PI) price initially fell 5% to an intraday low of $0.171 on March 19 before recouping from its losses and edging higher to $0.177 at press time. The token, however, remains nearly 40% lower than its high, which it attained following its highly anticipated listing on crypto exchange Kraken.
Pi Network’s resilience amidst the sectorwide downturn can be attributed to hype surrounding its mainnet upgrade to version 20. The latest upgrade brings the ability to support smart contracts to the network. This means developers can now build decentralized applications and other services on the platform, which could ultimately drive development and adoption of the Pi ecosystem.
In a March 19 X post, Pi developers also revealed that version 21 of the protocol would soon be rolled out. They instructed node operators to ensure their systems are up to date and to wait for more detailed instructions.
Major announcements such as these tend to boost investor demand for the token and thus add upward pressure on its price.
The latest upgrade follows a series of protocol updates that began on Feb. 20, when the team rolled out its first upgrade of the year to version 19.6.
Despite the bullish development for the Pi ecosystem, charts seem to present a bearish outlook for the Pi token for the upcoming sessions.
On the daily chart, Pi Network price has fallen below the 50, 100, and 200-day moving averages, a sign that the long-term trend has shifted decisively in favor of sellers. The only exception was the 20-day SMA at $0.176, which stands as the final line of support preventing a deeper slide into bearish territory.

As PI price fell, it flipped the Supertrend indicator red, which means the market bias has turned negative and volatility is now working against the bulls. Furthermore, the MACD lines have pointed downwards, which indicates that bears have seized dominance over the price action, and momentum is currently favoring further downside.
For now, $0.176 is the most important support level to keep an eye on. A drop below this could instill confidence in bears to push prices down to the Feb 23 low of $0.156. However, a break above the $0.200 psychological resistance would invalidate the bearish forecast and potentially signal a trend reversal.
Disclosure: This article does not represent investment advice. The content and materials featured on this page are for educational purposes only.

Bitcoin (BTC) price support could “fail” by the weekly close in a major blow to Bitcoin bulls, analysis warns.
Key points:
-
BTC price downside versus local highs at $76,000 nears 10%.
-
Bitcoin brings its 200-week trend line back into focus, but little hope remains that it will rescue price.
-
A trader warns of “months” of ranging at current levels.
200-week BTC price trend line “unreliable”
In his latest X update on Thursday, crypto trader and analyst Rekt Capital brought a long-term BTC price trend line back into focus.
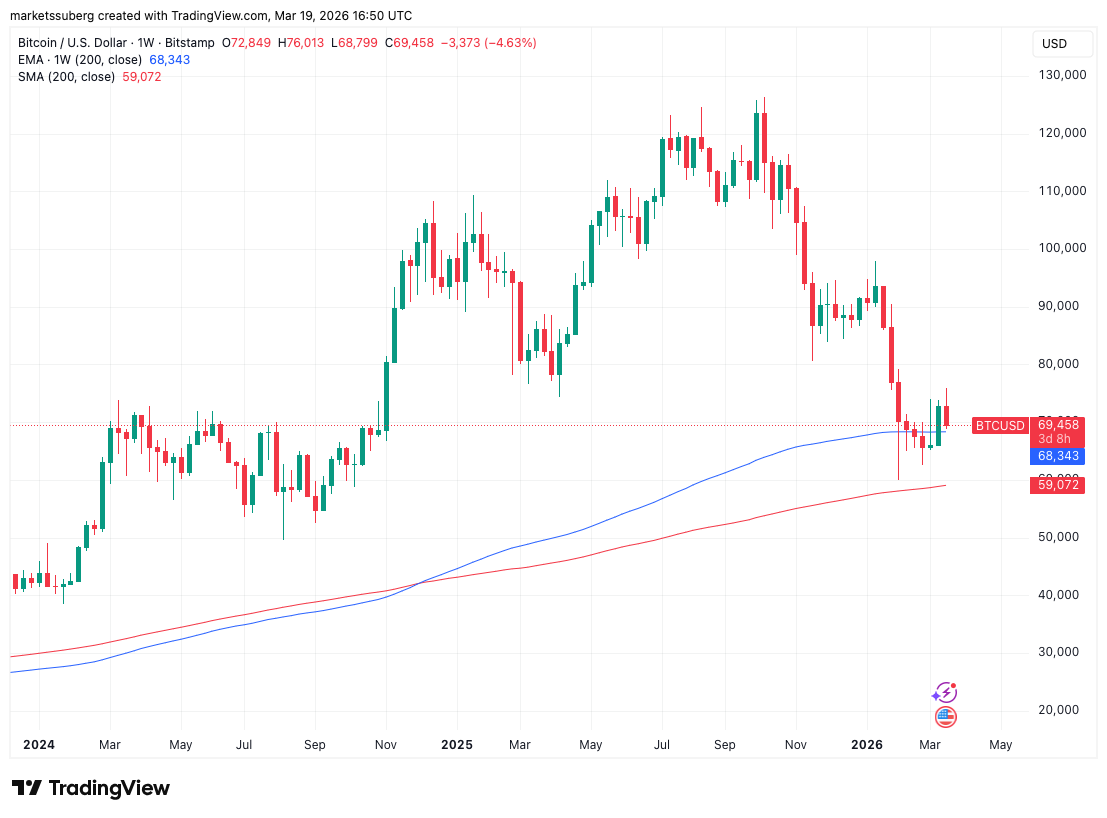
The 200-week exponential moving average (EMA) for BTC/USD, currently at around $68,300, is coming in for its first retest in over a week.
“Bitcoin is pulling back in towards the 200-week EMA (black) to check if it can successfully turn the EMA into new support after having broken it as resistance last week,” he summarized.
The 200-week EMA has long been on the radar for traders. Along with its equivalent simple moving average (SMA) near $59,000, it forms a key support band for price as Bitcoin’s latest bear market takes shape.

BTC/USD has crisscrossed the 200-week EMA multiple times in 2026, but its significance remains.
“A successful retest of the EMA would fully confirm the breakout beyond it to enable future trend continuation to the upside and further build on this Macro Relief Rally,” Rekt Capital continued.
“However, it is important to consider whether Bitcoin could fail this upcoming retest into new support, in the same way price failed to bearish retest the 200 EMA into new resistance before.”

The post describes the EMA as “unreliable” thanks to price crossing both above and below it with ease.
“A Weekly Close below the 200 EMA would mean that price failed its upcoming retest to in turn strengthen the case for the EMA acting as unreliable support,” Rekt Capital concluded.
Bitcoin trader: Current range could last “months”
The current low-time frame BTC price trading range contains multiple important lines in the sand.
Related: $58K BTC price still in play? Five things to know in Bitcoin this week
Bitcoin’s old all-time high from 2021 is at $69,500, while its 2025 lows currently mark the start of overhead resistance at $74,500.
So far, bulls have been unable to clear sellers and continue past $76,000, and many market participants expect new macro lows to come as a result as price retreats by nearly 10%.
Updating X followers on his thoughts, trader Roman, long entertaining a trip to $50,000 or lower, said that price may form a frustrating sideways range first.
“It’s very possible we range here for months,” he warned.
$BTC 1D
Always amazed that price going up a few % can drive people crazy.
Anyways, back into our range, rejected resistance once again. My only issue with thinking this WONT breakdown yet is volume is now low on the sell side.
It’s very possible we range here for months. https://t.co/XqaMz3cezg pic.twitter.com/oncvXxVp4i
— Roman (@Roman_Trading) March 19, 2026
This article does not contain investment advice or recommendations. Every investment and trading move involves risk, and readers should conduct their own research when making a decision. While we strive to provide accurate and timely information, Cointelegraph does not guarantee the accuracy, completeness, or reliability of any information in this article. This article may contain forward-looking statements that are subject to risks and uncertainties. Cointelegraph will not be liable for any loss or damage arising from your reliance on this information.
Crypto World
XRP Price Prediction in March 2026: Ripple Targets Latin America, HYPE Could Break Out, but Is DeepSnitch AI a Sleeping Giant Ready to Rise?

Ripple just announced a major expansion move. It may be one of the more credible fundamental catalysts XRP has seen in a while. Ripple is expanding its services in Brazil by offering integrated services that include payments, custody, stablecoins, trading, and treasury solutions.
The company is targeting banks, fintech firms, and crypto exchanges, allowing them to manage the entire lifecycle of digital assets within a single ecosystem. It’s looking like a strong business story for Ripple, but there’s a timing problem. The XRP price prediction for 2026 is interesting, but it requires patience that most investors don’t have.
DeepSnitch AI’s presale is closing on March 31st, and it potentially offers more asymmetric growth, especially in the short term.

Ripple eyes Latin America
With Ripple’s expansion into Brazil, the company is targeting institutions, and several have already signed up, including Banco Genial, Brasa Bank, and Nomad.
Ripple is also pushing its own stablecoin, RLUSD, into the region. The stablecoin has now crossed $1.5 billion in market cap and is available on several exchanges in Brazil. To stay compliant, Ripple plans to apply for a VASP license with the Central Bank of Brazil.
It’s a good step forward for Ripple, but for investors watching the XRP price, the fundamentals may be improving, but this doesn’t necessarily translate into short-term price action.
Is DeepSnitch AI the best crypto presale before March 31?
While Ripple builds institutional infrastructure across Latin America, DeepSnitch AI is giving retail investors the tools to navigate the crypto market right now.
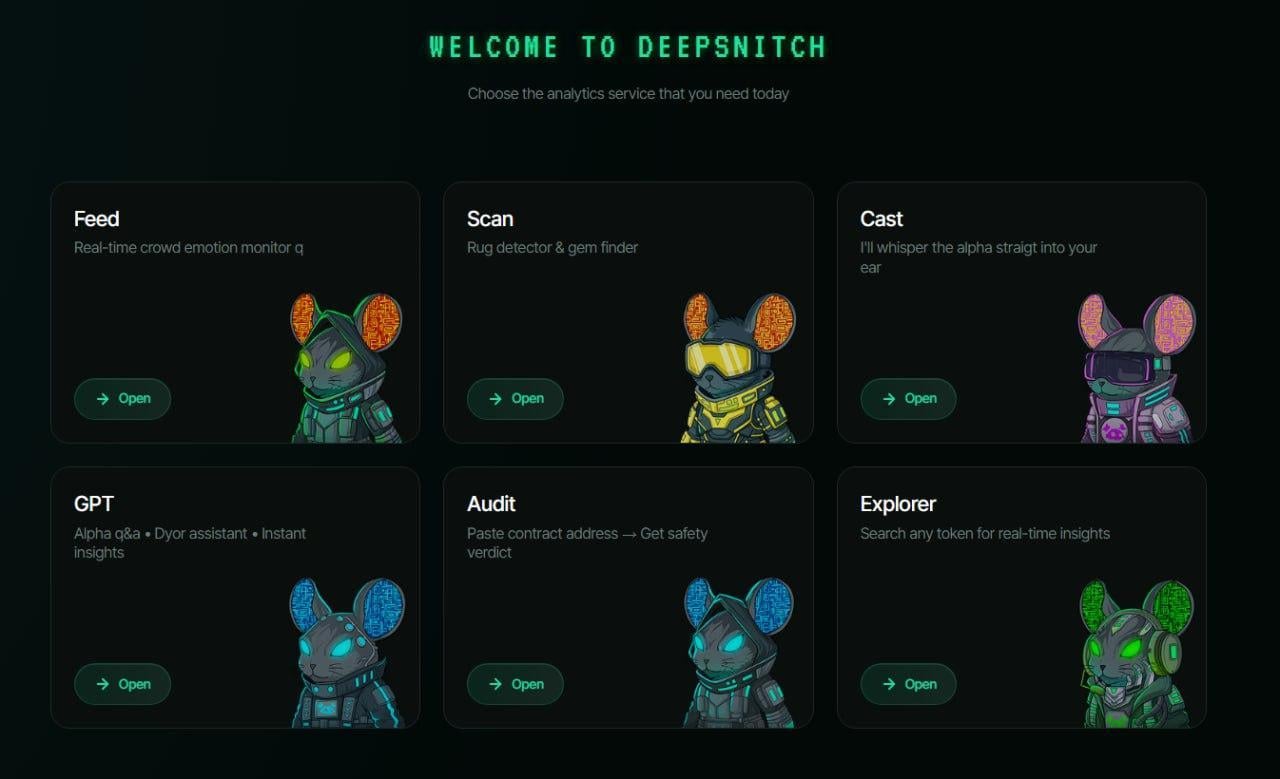
The platform has five AI agents that run continuously, tracking whale activity, screening tokens for any red flags, and sending instant alerts to your phone. In Telegram, SnitchGPT is ready to answer any token-related question in plain language, even if you’re not very technical.
The DSNT token is in Stage 7 of 15, trading at $0.04487. That means it’s up an impressive 197% from the starting price of $0.01510, with over $2.2 million raised so far. After March 31st, there’s a seven-day claiming period, giving investors time to secure their tokens and switch on staking rewards. There’s already a confirmed Uniswap listing. And from there, further CEX and DEX listings are on the horizon.
All VIP bonus codes are still active. This means you’ll get an extra 30–300% tokens, depending on the size of your purchase. A $10,000 position at the current price would yield over 222,000 tokens (before bonuses).
XRP price prediction: A strong story with a long road ahead
Any credible XRP price prediction for 2026 has to account for both Ripple’s business momentum and the broader macro environment. XRP was trading around $1.53 on 18 March, down roughly 20% since January.
Even though the Latin America expansion is good news, it’s the kind of news that takes time to translate into price. Institutional infrastructure rollouts don’t pump tokens overnight. And historically, XRP has tracked Bitcoin’s price closely, which means the broader macro environment matters as much as Ripple’s business wins.
Most of the XRP forecasts for 2026 are between $1.60 and $8.60. LiteFinance analysts project a range of $1.60 to $6.41 by year-end 2026, depending heavily on macro conditions and BTC performance. More optimistic models, like analyst Celal Kucuker’s chart-based target of $8.60, probably need more time to play out if his thesis proves correct.
The current XRP market outlook is constructive, but it’s likely not going to be a breakout story. Brazil is a meaningful expansion, and Latin America is a high-growth region for digital payments.
Brazil’s rapidly developing digital economy and widespread adoption of instant payment systems such as Pix have made the country an attractive destination for blockchain companies, and Ripple sees it as a gateway to the broader Latin American region. That’s a strong foundation, but not necessarily a near-term price catalyst.
Cardano price prediction: Good long-term story, short-term ceiling is visible
Cardano is a credible long-term Layer-1 with decent fundamentals. It has a research-driven development process, growing DeFi activity, and real-world adoption in emerging markets. ADA’s 2026 roadmap emphasizes DeFi, stablecoins, and real-world assets, backed by significant treasury funding.
ADA was trading around $0.28 as of 18th March. The conservative base case for ADA in 2026 ranges from $0.27 to $0.80, while bullish projections target the psychological $1.20 level if key upgrades succeed. Many of these price predictions would require a shift in the broader market environment that nobody can time with precision.
Despite the bullish projections, near-term price action depends on a broader market recovery that has not materialized yet. Even optimistic projections on ADA would yield a 4X return by year-end. That’s the structural ceiling that comes with investing in a large-cap token that’s already reached the mainstream investment pools.
Presale pricing beats waiting for the market to cooperate
The XRP price prediction for 2026 is compelling, and Brazil is a real expansion. Hyperliquid has genuinely strong fundamentals, and Cardano has a credible long-term roadmap. All three are reasonable positions for investors who want established token exposure and are willing to wait.
But none of them can offer what a limited-time crypto presale can offer. DeepSnitch AI’s presale offers ground-floor pricing before the public market has access, with a confirmed listing date and a working product already being used.
DeepSnitch AI’s presale closes March 31. Visit the official DeepSnitch AI presale for more information.
Frequently asked questions
What is the XRP price prediction for 2026?
The XRP price prediction for 2026 ranges from around $0.80 on the conservative end to $1.20 in a bullish scenario. More bullish targets depend largely on macro conditions playing their part between now and December 2026.
Does Ripple’s Latin America expansion affect the XRP forecast for 2026?
It’s a positive fundamental development, but the XRP market outlook still depends heavily on Bitcoin’s price and broader market sentiment. Institutional infrastructure rollouts typically take time to show up in price.
Why is DeepSnitch AI considered one of the best crypto presale options right now?
It combines a live, working product with presale pricing at $0.04487, a confirmed March 31 Uniswap launch, and over $2.1 million raised. Plus, all VIP bonus codes are still active. It is the kind of setup that makes it one of the best new token presale projects right now.
Disclaimer: This is a Press Release provided by a third party who is responsible for the content. Please conduct your own research before taking any action based on the content.


Centrifuge’s largest tokenized fund, JTRSY, is among the first of its products to adopt LayerZero.
LayerZero and Centrifuge are partnering to integrate Centrifuge’s institutional tokenization infrastructure into the interoperability protocol’s ecosystem, according to a press release shared exclusively with The Defiant. The companies said that the deal aims to make access and distribution of tokenized real world asset (RWA) products broader with multichain reach from launch.
The partnership addresses the issue of blockchain fragmentation for institutional tokenization. Via LayerZero’s OApp standard, issuers can extend products across over 165 blockchain networks, while retaining a unified supply, according to the release.
The first Centrifuge products to adopt LayerZero includes three of its tokenized funds, JTRSY — its largest by total value, with nearly $861 million in tokenized U.S. Treasuries — as well as JAAA, and SPXA, which launched in September as the first licensed tokenized S&P 500 index fund.
The three tokenized funds will expand across Ethereum, Solana, Avalanche, BNB Chain, Base, Optimism, and HyperEVM, per the release. Data from RWAxyz shows that JTRSY is currently mostly on Ethereum, while SPXA is exclusively on Coinbase’s Base.
The partnership also sets the stage for Centrifuge assets to be deployed on Zero, LayerZero’s recently launched Layer 1 blockchain, backed by Citadel Securities, The Depository Trust & Clearing Corporation, Intercontinental Exchange, and Google Cloud, and designed as core infrastructure for financial markets.
Bryan Pellegrino, CEO of LayerZero Labs, told The Defiant:
“We want partners building on LayerZero to extend into Zero, and Centrifuge, with its institutional client base and tokenization suite, is exactly the kind of asset we’re designing the network for.”
For its part, Centrifuge said that it sees deploying on LayerZero’s Zero as a plan for the future, when the L1 has a more established user base and liquidity.
“As part of our broader multichain distribution strategy, we see Zero as an important ecosystem over time,” Anil Sood, chief strategy and growth officer at Centrifuge Labs, told The Defiant, continuing:
“Our objective is to make key products such as JTRSY, JAAA, and SPXA accessible across the networks where liquidity, users, and onchain utility are forming.”
LayerZero Labs’ told The Defiant that the interoperability protocol currently has over $90 billion in assets secured, and more than 700 projects building in its ecosystem, though The Defiant was unable to independently verify this data. As of last May, the company said it handles over 70% of all cross-chain messaging traffic in web3.
Bhaji Illuminati, CEO of Centrifuge Labs said in a statement, “For institutions, tokenization becomes strategic when products are built to move beyond a single venue or chain and enter markets with real distribution from day one.”
Centrifuge, whose CFG token rallied 60% this week on a Binance listing announcement, currently has a total of $1.33 billion in distributed asset value across its tokenized RWA products, per RWAxyz.
Today’s move comes as tokenized RWAs on chain reached $18.4 billion at end of 2025, with RWA holders growing from 84,000 to 564,000 over the course of the year, per a report from Centrifuge — a trend The Defiant documented in depth as RWAs became Wall Street’s gateway to crypto last year.
This article was written with the assistance of AI workflows. All our stories are curated, edited and fact-checked by a human.
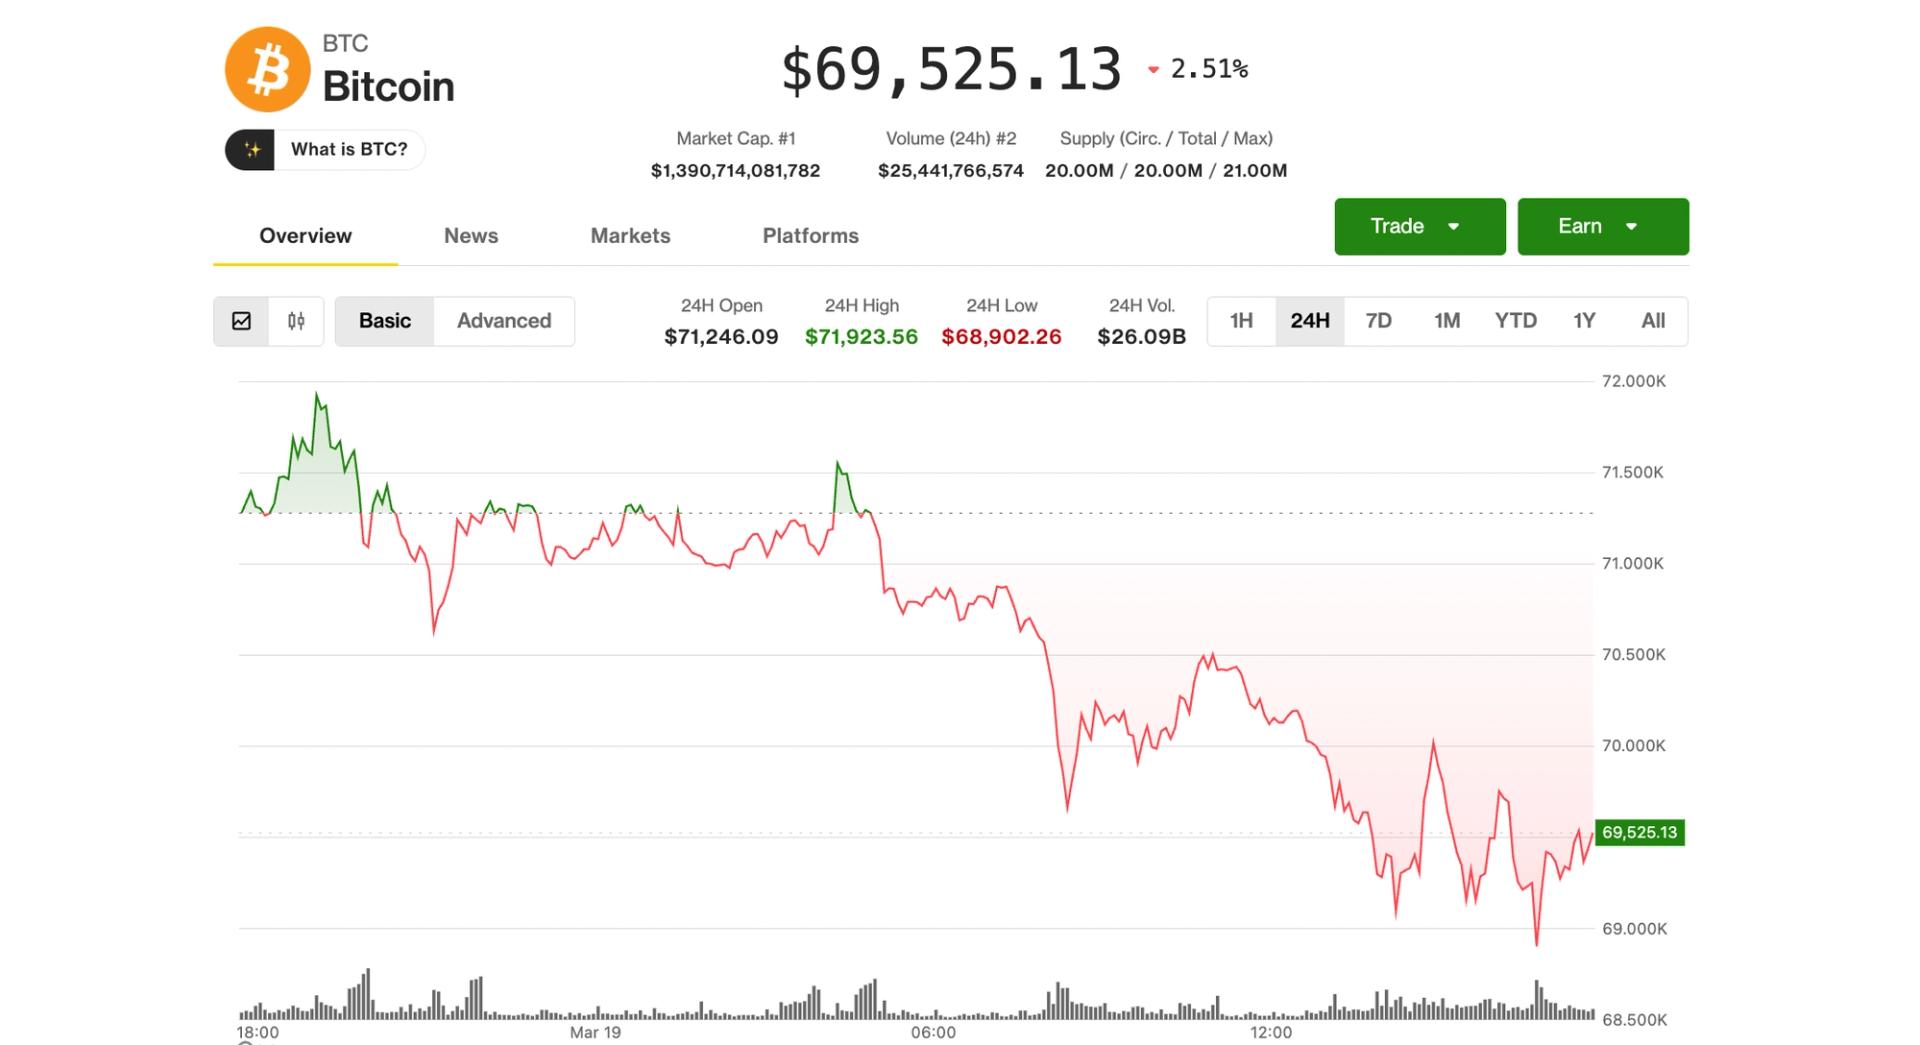

Bitcoin drifted toward $69,000 on Thursday as the deepening conflict in Iran is spiraling across the Middle East, hitting energy infrastructure and spilling into global markets.
Oil remained at the center of the action, as investors pulled back from risk amid fresh headlines around attacks on energy infrastructure. Prices swung back toward $100 a barrel after a Politico report said the U.S. is not considering a crude export ban, reversing earlier declines and keeping inflation worries alive.
That backdrop weighed on traditional markets, especially as investors began to consider that central banks might delay rate cuts or even mull rate hikes, wary of inflationary pressures from an energy shock and supply disruptions. The S&P 500 and Nasdaq slid nearly 1% in morning trading, both hitting fresh 2026 lows.
The more notable move, though, came from metals. Gold dropped 5% to around $4,500 an ounce, its lowest since early February, while silver fell 6.6%, extending a sharp unwind after weeks of outsized gains.
Crypto, by comparison, looked relatively steady. Bitcoin was last trading around $69,400, down about 2.6% on the day. Most major tokens, including ether (ETH), XRP (XRP), BNB and solana (SOL), were all down, but losses stayed under 3%, and the broader CoinDesk 20 Index was off about 2.1%.
Crypto-linked stocks also moved lower, though not to the same extent seen elsewhere. Crypto exchange Coinbase (COIN) slipped 1.7%, bitcoin treasury firm Strategy (MSTR) fell 2.6%, while stablecoin issuer Circle (CRCL) pulled back 6%, giving up some ground after more than doubling over the past three weeks.
Bitcoin holds ground in risk-off move
The simultaneous drop in both gold and bitcoin points to broad de-risking rather than a rotation into safe havens, said Alvin Kan, COO of Bitget Wallet. Rising energy prices are feeding into inflation expectations, reinforcing a “higher-for-longer” interest rate outlook and tightening liquidity — a difficult mix for risk assets, he added.
Still, bitcoin has outperformed gold by around 20% during the initial phase of the Iran conflict, noted Bryan Tan, trader at Wintermute, an unusual dynamic for an asset typically treated as a riskier tech name. But the lack of follow-through above $75,000 suggests markets remain cautious and rangebound.
“When sentiment swings on each headline about the conflict, and correlation to oil prices are so elevated, being flat is a strong position,” he said.
“We lean towards reserving dry powder until we see a meaningful confirmation in either direction or a material change in market conditions,” Tan added.

Disclosure: This article does not represent investment advice. The content and materials featured on this page are for educational purposes only.
Crypto investors shift focus beyond majors, seeking early-stage gems across emerging blockchain ecosystems.
Summary
- Investors in 2026 are shifting focus to early-stage “crypto gems,” seeking high-growth tokens before mainstream adoption.
- Home of crypto gems platforms help users discover low-cap tokens early through listings, launchpads, and communities.
- Finding crypto gems requires strong research, on-chain analysis, and risk management due to high volatility.

The crypto market has evolved far beyond Bitcoin and Ethereum. In 2026, investors are no longer just chasing established assets—they are actively searching for the next breakout opportunity. This is where the concept of a home of crypto gems becomes essential. It refers to platforms and ecosystems where early-stage, high-potential tokens are discovered before they reach mainstream attention.
In this guide, we’ll explore what defines a true home of crypto gems, how to find hidden opportunities, and the best strategies to identify high-growth projects before the market catches on.
Key Takeaways
- A home of crypto gems is a platform or ecosystem where early-stage tokens with high growth potential are discovered.
- Crypto gems typically offer higher returns but come with increased risks and volatility.
- Early access through listings, launchpads, and communities is key to success.
- Fundamental analysis and on-chain data help separate real gems from hype projects.
- Risk management is critical when investing in low-cap cryptocurrencies.
- Exchanges with diverse listings and strong discovery tools play a major role in finding crypto gems.
What does “home of crypto gems” really mean?
The term home of crypto gems has become increasingly popular among crypto investors, but its meaning goes beyond marketing language.
At its core, it represents a hub for early discovery — a place where promising projects emerge before reaching mass adoption.
Key Characteristics
A true home of crypto gems typically offers:
- Early listings of new tokens
- Access to low market cap assets
- Strong community engagement
- Transparent project information
- Advanced trading tools
Unlike traditional exchanges that focus only on top-tier assets, these platforms prioritize innovation and diversity.
Why crypto gems attract investors
Crypto gems are appealing because they offer something rare in traditional finance: asymmetric upside.
High growth potential
Many well-known cryptocurrencies started as small-cap projects:
- Early investors in Ethereum saw exponential returns
- Meme coins and niche tokens have delivered unexpected gains
Finding these opportunities early is what defines success in a home of crypto gems ecosystem.
Lower entry barriers
Compared to large-cap assets:
- Entry prices are often low
- Smaller investments can yield meaningful exposure
- Retail investors can compete with institutions
Innovation-driven value
Crypto gems often represent:
- New blockchain technologies
- Emerging sectors (AI, DeFi, GameFi, DePIN)
- Experimental tokenomics models
This innovation attracts both developers and investors.
How to identify real crypto gems
Not every low-cap token is a gem. In fact, many are short-lived or purely speculative. Identifying quality projects requires a structured approach.
- Strong fundamentals
Look for:
- Clear use case
- Real-world utility
- Sustainable tokenomics
- Active development team
- Team and backing
A credible team increases trust:
- Public founders or reputable developers
- Strong venture capital backing
- Strategic partnerships
- Community growth
Community is a powerful signal:
- Active social media presence
- Organic engagement (not bots)
- Developer and user participation
- On-chain Metrics
Data-driven insights include:
- Wallet distribution
- Transaction volume
- Liquidity depth
A genuine home of crypto gems provides access to this kind of data for better decision-making.
Where to find the best crypto gems
Finding crypto gems requires access to the right platforms and tools.
Centralized Exchanges (CEXs)
Top exchanges often act as the first gateway:
- Early token listings
- High liquidity
- User-friendly interfaces
Some platforms are known as a home of crypto gems due to their ability to list promising projects early.
Launchpads and token sales
Launchpads offer early-stage access:
- Initial Exchange Offerings (IEOs)
- Token Generation Events (TGEs)
Benefits include:
- Lower entry prices
- Early investor advantages
Decentralized Exchanges (DEXs)
DEXs provide even earlier access:
- Tokens listed before centralized exchanges
- Higher risk but higher reward
However, due diligence is essential due to the lack of regulation.
Crypto communities
Information spreads fast in crypto:
- Twitter (X)
- Discord groups
- Telegram channels
Being active in communities can help someone discover trends before they go mainstream.
Strategies to maximize gains from crypto gems
Simply finding a crypto gem is not enough — there is a need for a strategy to capitalize on it.
Diversification
Avoid putting all funds into one project:
- Spread investments across multiple gems
- Balance risk and reward
Entry timing
Timing is crucial:
- Early entry = higher upside
- Avoid buying after hype peaks
Profit-taking strategy
Many investors fail by not taking profits:
- Set price targets
- Use partial exits
- Avoid emotional decisions
Long-term vs Short-term
Some gems are:
- Short-term hype plays
- Long-term infrastructure projects
Understanding the difference helps optimize your approach.
Risks of investing in crypto gems
While the rewards can be significant, the risks are equally high.
High volatility
Prices can swing dramatically:
- Rapid gains
- Sudden crashes
Low liquidity
Some tokens have:
- Limited trading volume
- Difficulty exiting positions
Scams and rug pulls
Not all projects are legitimate:
- Fake teams
- Unsustainable models
This is why choosing a trusted home of crypto gems is critical.
Regulatory uncertainty
Crypto regulations vary globally:
- Sudden policy changes
- Listing restrictions
Investors must stay informed.
The role of exchanges as a home of crypto gems
Exchanges play a central role in the crypto ecosystem.
A strong platform acts as a curation layer, helping users discover quality projects while filtering out low-quality ones.
What makes an exchange stand out?
- Early access to trending tokens
- Transparent listing criteria
- Strong security infrastructure
- Low trading fees
- Global accessibility
Such platforms become the go-to home of crypto gems for both beginners and experienced traders.
Conclusion
In today’s fast-moving crypto landscape, finding the next big opportunity requires more than luck — it requires access, strategy, and the right platform. A true home of crypto gems provides early exposure to high-potential projects, empowering investors to identify and act on opportunities before they reach the mainstream.
By combining fundamental analysis, smart risk management, and the use of reliable exchanges, investors can significantly improve their chances of success. While risks remain, those who approach the market with discipline and knowledge are best positioned to uncover the hidden gems that define the future of crypto.
FAQs
What is a home of crypto gems?
A home of crypto gems is a platform or ecosystem where investors can discover early-stage cryptocurrencies with high growth potential before they become widely known.
How can I find the cheapest way to invest in crypto gems?
Use low-fee exchanges, trade on spot markets, and avoid high spreads. Combining these strategies helps you reduce costs while accessing early-stage tokens.
Are crypto gems safe investments?
Crypto gems are high-risk investments. While they offer strong upside potential, they can also experience volatility, low liquidity, or project failure.
Where can beginners find crypto gems?
Beginners can explore centralized exchanges, launchpads, and crypto communities. Platforms known as a home of crypto gems are the best starting point.
How much should I invest in crypto gems?
Only invest what you can afford to lose. Diversifying across multiple projects is a safer approach when exploring crypto gems.
Disclosure: This content is provided by a third party. Neither crypto.news nor the author of this article endorses any product mentioned on this page. Users should conduct their own research before taking any action related to the company.

TLDR
- Cardano expects the Node 10.7.0 Target prerelease within days as part of Protocol 11 preparations.
- Node 10.7.0 serves as one of the required releases for the van Rossem hard fork.
- Developers will integrate the new node into ecosystem tools and conduct performance testing.
- Version 10.7.x will transition to version 11 to fork the Preview and PreProd testnets.
- The Protocol 11 upgrade introduces new Plutus built-ins, including CIP-138 and CIP-153.
Cardano advances preparations for its intra-era upgrade to Protocol 11, known as the van Rossem hard fork. Intersect confirmed that Cardano Node 10.7.0 Target prerelease should arrive within days. The release sets the stage for ecosystem integration and testing before the network moves toward testnet and mainnet upgrades.
Cardano Hard Fork Moves Closer With Node 10.7.0
Intersect reported that Cardano Node 10.7.0 Target prerelease is expected within days. The organization operates as a member-based body within the Cardano ecosystem. It outlined the release timeline in a recent technical update.
Cardano Node 10.7.0 stands as one of two required releases for the van Rossem hard fork. Earlier, developers deployed Node 10.6.2 in February to begin preparations. Now, the upcoming version introduces new features beyond hard fork functionality.
The ecosystem will integrate Node 10.7.0 into tooling once developers publish the release. Teams will conduct integration testing and performance checks across services. Dependent on results, developers may issue further minor updates.
Intersect stated, “Cardano Node 10.7.0 Target prerelease is expected within a few days.” The group added that prerelease 10.7.0 supports feature testing. Version 10.7.x will later transition to version 11 for testnet forks.
Developers will promote version 11 to fork the Preview and PreProd testnets. After testnet validation, they will prepare for the mainnet fork. The upgrade process follows established Cardano governance procedures.
Protocol 11 Introduces New Plutus Built-Ins
The Cardano hard fork to Protocol 11 will introduce new Plutus built-ins. These include CIP-138 for Array type support. They also include CIP-153 for the MaryEraValue type.
Developers will add CIP-109 for modular exponentiation functionality. They will also implement the CIP-132 drop list built in. In parallel, CIP-133 enables multi-scalar multiplication over BLS12-381.
Intersect confirmed that SanchoNet already runs Protocol version 11. Therefore, developers can test the new built-ins on that network. Scalus updated its smart contract tooling to support these features.
The upgrade does not change the transaction shape. As a result, teams expect limited disruption to existing integrations. Hardware wallets should face no serialization issues under this release.
DBSync compatible with Node 10.7.0 will follow soon after the release. Intersect stated that no serialization changes are included. The upgrade focuses on performance improvements and cleaner ledger rules.
The van Rossem hard fork operates as a small intra-era upgrade. It enhances Plutus performance and introduces new cryptographic capabilities. Existing smart contracts will continue operating without breaking changes.


Summary
- BTQ’s Bitcoin Quantum Testnet v0.3.0 now supports BIP 360’s Pay-to-Merkle-Root (P2MR) outputs, which remove Taproot’s key path spending and force all UTXOs through hash-based script paths to reduce long-exposure quantum risk.
- The testnet validates the full P2MR lifecycle — from address creation and funding to signing, mempool acceptance and confirmation — while preserving compatibility with Lightning, BitVM, Ark, multisig and timelocks.
- BTQ’s release, with one-minute blocks, restored SegWit discount and Dilithium-focused sigop hardening, tackles today’s “harvest-now, decrypt-later” public key exposure but leaves short-exposure quantum attacks to future signature-level upgrades.
BTQ Technologies Corp. announced Thursday the completion of the first functional implementation of Bitcoin Improvement Proposal 360 (BIP 360) on its Bitcoin Quantum Testnet v0.3.0 — marking the first time a quantum-resistant transaction format derived from a formal Bitcoin improvement proposal has been activated in a practical, live testing environment. The announcement, released via PR Newswire, moves BIP 360 from a draft concept into what BTQ describes as “usable, testable infrastructure” available to developers, miners, and researchers today.
BIP 360, co-authored by Hunter Beast, Ethan Heilman, and Isabel Foxen Duke, proposes a new Bitcoin output type called Pay-to-Merkle-Root (P2MR) — a direct response to one of Bitcoin’s most discussed long-term vulnerabilities: the exposure of elliptic curve public keys to quantum computing attacks. Under current Bitcoin architecture, certain transaction types — particularly P2PK outputs and Taproot (P2TR) addresses — leave public keys exposed on-chain, where a sufficiently powerful quantum computer running Shor’s algorithm could theoretically derive the corresponding private keys and drain the associated funds. An estimated 6.26 million BTC, representing roughly $440 billion at recent prices, sits in quantum-vulnerable address types.
P2MR operates with nearly identical functionality to Bitcoin’s existing Taproot output type but with one critical modification: it removes the key path spending mechanism introduced by Taproot, which allows a transaction to be authorised by a single public key signature. Under P2MR, all UTXOs must be spent exclusively through script paths — Tapscript Merkle trees — which rely on hash-based commitments rather than elliptic curve public keys. Since hash functions are considered substantially more resistant to quantum attacks than elliptic curve cryptography, this eliminates a major surface area for long-exposure quantum attacks.
Crucially, P2MR retains full compatibility with Bitcoin’s existing smart contract capabilities, including multi-signature arrangements, timelocks, and complex custody structures. BIP 360’s authors have also confirmed compatibility with the Lightning Network, BitVM, and Ark — the key Bitcoin scaling and programmability frameworks that depend on Taproot architecture — making the upgrade additive rather than disruptive to the ecosystem.
BTQ’s v0.3.0 testnet release validates BIP 360 across the full transaction lifecycle: address creation, funding, transaction construction, signing, mempool acceptance, broadcast, and confirmation. Additional enhancements include optimised one-minute block spacing for faster iteration, a restored SegWit discount — critical given that post-quantum signature schemes using NIST-standardised ML-DSA (Dilithium) cryptography produce substantially larger transactions than standard Bitcoin signatures — and Dilithium signature hardening through improved sigop counting and tapscript security fixes. The testnet currently connects over 50 miners and has processed more than 100,000 blocks.
It is important to note the boundaries of what BIP 360 achieves. The proposal addresses long-exposure quantum vulnerability — the risk that an attacker harvests today’s public keys for decryption once quantum hardware matures — but does not yet protect against short-exposure attacks, where a quantum computer would need to break a signature within the time a transaction is unconfirmed. Full post-quantum security for Bitcoin will require additional proposals covering signature schemes. BIP 360 is, by its authors’ own description, a necessary first step rather than a complete solution — but Thursday’s deployment demonstrates that the infrastructure for that transition is no longer purely theoretical.


As AI agents become a bigger topic in crypto, Pranav Ramesh told CoinDesk that Nasdaq has already been using them across several sections of its business and has sharply expanded that use over roughly the past 18 months.
Ramesh, head of options research at Nasdaq and co-founder and CTO of Leadpoet, said the most meaningful shift has been in trust. “AI agents are relatively new, probably being used more and more over the last six months,” he said, arguing that earlier systems hallucinated too often for sensitive enterprise workflows.
He said Nasdaq is using AI agents in areas including market surveillance, compliance, and market microstructure analysis, and pointed to Nasdaq Verafin’s “Agentic AI Workforce,” which Nasdaq says automates “low-value, high-volume compliance processes” in anti-money laundering work.
Ramesh also pointed to Nasdaq’s AI-powered order type. Nasdaq announced in 2023 that its Dynamic M-ELO order type had become the first exchange AI-powered order type approved by the SEC, using an AI model with more than 140 factors to adjust to real-time market conditions.
For Ramesh, that experience informs how he sees crypto. He said crypto trading platforms are likely to move aggressively on AI agents for both internal operations and retail-facing tools, including position analysis, trade suggestions and execution support. “The crypto trading world is actually going to lead the charge on how AI is used within the retail trading environment,” he said.
He did not describe that shift as fully autonomous. Instead, he said the model he sees taking hold is one in which agents handle most of the analysis and workflow while humans retain final approval. In the interview, he said that at Nasdaq, many systems still stop short of full automation, with human review remaining in the last step.
AI and AI Agents will replace a lot of human labor
Ramesh’s views are also unusually blunt on labor. “Yes, it will take a lot of jobs,” he said of AI agents, adding that he believes lower-level software, customer service and analyst roles are already being displaced as systems become faster, cheaper and more reliable. He framed that as an observable trend rather than a prediction.
And he seems to be right as companies, including the most recent being Crypto.com, which laid off 12% of its staff in a push for greater automation and efficiency through AI. Earlier, crypto research firm Messari parted ways with several of its staff and its chief executive as the company transitioned into what the new CEO called an “AI-first company.” Last month, Block, the payments company founded by Jack Dorsey, announced plans to slash 40% of employees, over 4,000 people, citing improved AI models.
The AI trend lead to founding Leadpoet
That thesis also shaped his path into Leadpoet, the startup he co-founded with Gavin Zaentz. According to a February 2026 company fact sheet, the two met at Nasdaq and founded the company after repeatedly encountering the same problem: outbound tools could generate static lists, but identifying real buying intent still required manual research.
Leadpoet describes itself as an AI-powered lead qualification platform that turns web signals and company context into “decision-ready lead recommendations,” emphasizing “precision over volume.” The company says it supports private deployments so customers can score intent and generate outreach on their own data without exposing it to a vendor.
The fact sheet says Leadpoet uses Bittensor, which describes itself as a decentralized, blockchain-powered AI network that allows participants to contribute models and compute while earning rewards. Ramesh said that a decentralized, competitive structure is part of the appeal, because it can improve models faster than a centralized roadmap.
Leadpoet also says it is a member of NVIDIA Inception, NVIDIA’s startup program for AI companies. NVIDIA describes Inception as a free program that offers technical resources, go-to-market support and access to its broader ecosystem.
In the company’s February 2026 fact sheet, Leadpoet says it reached a $1 million annualized run rate in its first quarter after launch and received backing from DSV Fund and Astrid. In that same material, DSV Fund CIO Siam Kidd said Ramesh and Zaentz combine “deep AI engineering expertise with a real understanding of day-to-day sales.”
Ramesh tied the company directly to what he says he saw inside large institutions adopting AI: agents moving from assistants to systems that can handle real operational work. In crypto, he said, that shift is likely to become visible faster than in many other corners of finance.
Opera, a Nasdaq-listed web browser company, is proposing to change how it is compensated by the Celo ecosystem, opting to receive native tokens instead of cash as it deepens its involvement with the network.
The company said Thursday it has proposed restructuring its commercial agreement, moving from US dollar-denominated quarterly payments to an allocation of 160 million CELO (CELO) tokens, subject to approval by Celo’s onchain governance community.
If approved, the shift would more directly align Opera’s financial incentives with the network’s performance and make it one of the largest institutional holders of CELO.
Celo is an Ethereum-aligned protocol focused on mobile-first payments, particularly for stablecoin transfers in emerging markets. Last year, it transitioned from a standalone layer-1 blockchain to an Ethereum layer-2 network.

Opera said the proposed change reflects its “belief in the long-term value” of the Celo ecosystem. The two have worked together since 2021, when Opera integrated Celo-native stablecoins into its browser wallet.
The partnership has increasingly centered on Opera’s MiniPay wallet, a self-custodial app built on Celo, which the company says has grown to 14 million users and focuses on stablecoin payments in emerging markets. MiniPay initiated connections with Latin America real-time payment platforms PIX and Mercado Pago in November.
To be sure, Opera isn’t the only company to accumulate tokens tied to a blockchain protocol. Ethereum software company ConsenSys has exposure to Ether (ETH) through its work on core infrastructure, such as MetaMask. Blockstream, a Bitcoin infrastructure company, holds Bitcoin (BTC) while developing products and services around the network.
Related: US ban on stablecoin yield could see others fill the void: Ledger exec
Opera reports revenue growth, announces buyback
Opera’s deeper integration with Celo comes on the heels of stronger-than-guided results, as the company reported growth across its core browser business and newer product segments.
In February, Opera reported fourth-quarter revenue of $177.2 million, up 22% year-over-year. Adjusted earnings came in at $41.9 million, representing a 24% margin.
For the full year, revenue reached $614.8 million, with adjusted earnings of $142.5 million.
The company also announced a $300 million share repurchase program, which reduces the number of outstanding shares and can increase earnings per share.
Opera’s Nasdaq-traded shares are up more than 21% over the past month and currently trading at around $15 a share, giving the company a market capitalization of roughly $1.3 billion.

Related: Abra targets Nasdaq listing in $750M deal with New Providence SPAC
Ripple keeps broadening its reach outside the US, while whales have shown notable interest in XRP.
Ripple remains one of the most talked-about projects in the crypto space, driven by constant developments across its ecosystem.
Despite the ongoing market correction, XRP (the company’s native token) has posted weekly gains, whereas some key indicators suggest a more substantial rally could be on the horizon.
The Global Expansion and More
In the last several months, the American-based entity expanded its footprint in the Middle East, while earlier in March, it announced plans to secure an Australian Financial Services License. Such a permit would allow the firm to operate a fully licensed payments platform in Australia and offer services under a recognized regulatory framework.
Just a few days ago, Ripple widened its reach across Brazil by becoming “the only solution in the region capable of serving institutions across the full spectrum of financial needs – from cross-border payments and digital asset custody to prime brokerage and treasury management.” Additionally, the company applied for a Virtual Asset Service Provider (VASP) license with the nation’s central bank.
It also made strides in the North American market by teaming up with i-payout to help the latter enable fast, transparent cross-border payments.
Another major news related to Ripple is Evernorth’s step forward to listing on the Nasdaq. The venture that focuses on accumulating, managing, and providing institutional exposure to XRP filed a Form S-4 registration statement with the US SEC in connection with its planned merger with Armada Acquisition Corp. II. Last year, the entity revealed that it had raised over $1 billion in gross proceeds from major institutions such as Ripple Labs, Pantera Capital, Kraken, SBI Holdings, and others.
The ETF Front
2025 was pivotal for Ripple, not only because its long-running legal battle with the SEC finally ended, but also due to the launch of the first spot XRP ETF, which offered full exposure to the asset. This happened in November, and the company behind the product was Canary Capital.
You may also like:
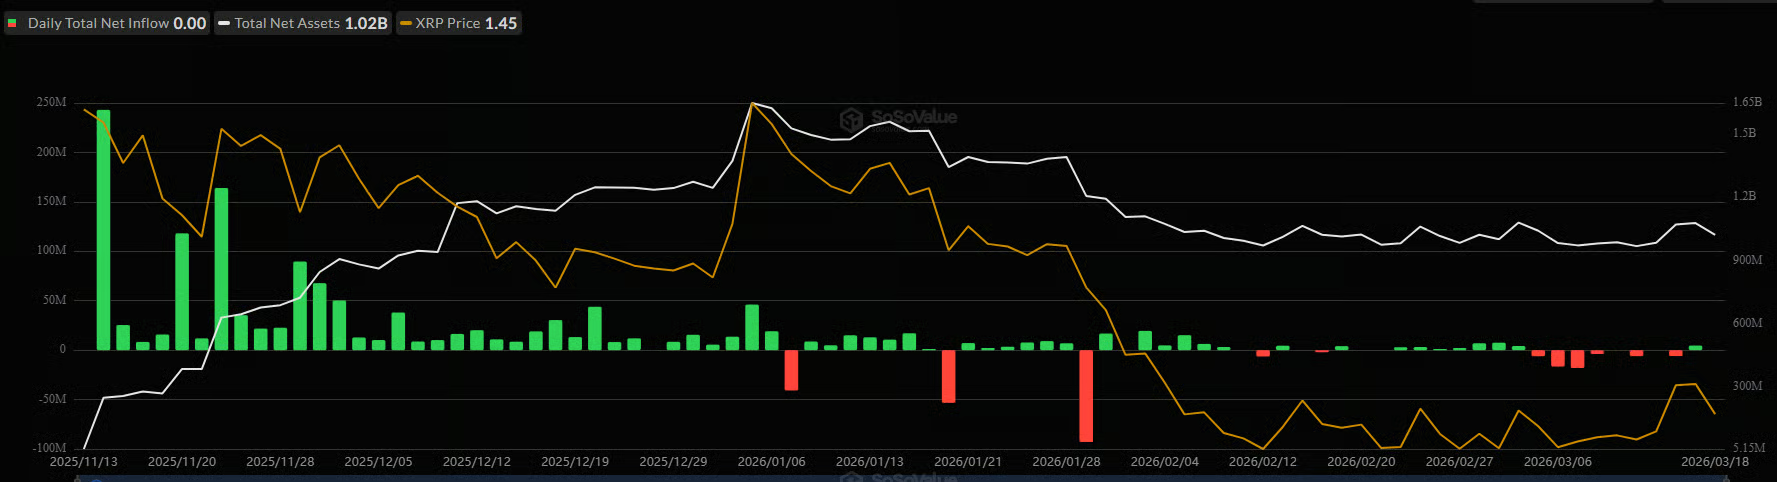
Some renowned firms, including Bitwise, Franklin Templeton, 21Shares, and Grayscale, followed suit, and the investment vehicles have so far generated a cumulative total net inflow of more than $1.2 billion.
However, over the past week, outflows have dominated inflows, indicating that institutional appetite for Ripple’s native token has been declining. After several consecutive red days, the netflow finally flashed green on March 17, and we have yet to see whether the interest will pick up in the short term.

XRP Outlook
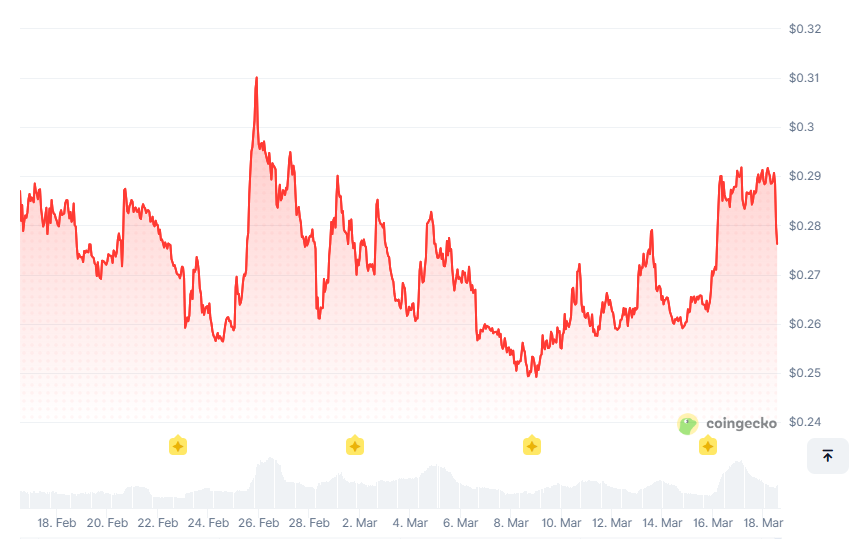
As of this writing, Ripple’s cross-border token trades at around $1.44 (per CoinGecko), representing a 4% weekly increase. This contrasts with the losses that many other altcoins have posted during that timeframe.
The broken negative streak on the ETF front, as well as the recent whale accumulation, suggest XRP may record additional gains in the near future. As CryptoPotato reported, large investors purchased 200 million coins in the past two weeks, showing strong confidence in the asset and setting the stage for a possible move north.
The USD equivalent of the stash is roughly $290 million, and this group of market participants now controls 11.1 billion tokens, or 19% of XRP’s circulating supply.
Binance Free $600 (CryptoPotato Exclusive): Use this link to register a new account and receive $600 exclusive welcome offer on Binance (full details).
LIMITED OFFER for CryptoPotato readers at Bybit: Use this link to register and open a $500 FREE position on any coin!

Here we go again with Giannis Antetokounmpo

Your inbox is someone else’s business model. It doesn’t have to be
Last One Laughing UK season 2 episode release schedule as fans face wait


-
Crypto World6 days ago
HYPE Token Enters Net Deflation as HyperCore Buybacks Outpace Staking Rewards
-

 Tech4 days ago
Your Legally Registered ‘Motorcycle’ Might Not Count Under Proposed US Law
-

 Fashion6 days ago
Weekend Open Thread: Addict Lip Glow
-
 Tech2 days ago
Are Split Spacebars the Next Big Gaming Keyboard Trend?
-
Sports5 days ago
Why Duke and Michigan Are Dead Even Entering Selection Sunday
-

 Business4 days ago
Search for Savannah Guthrie’s Mother Enters Seventh Week with No Arrests
-

 Business5 days ago
US Airports Launch Donation Drives for Unpaid TSA Workers as Partial Government Shutdown Enters Fifth Week
-
Crypto World5 days ago
Coinbase and Bybit in Investment Talks: Could Bybit Finally Enter the US Crypto Market?
-

 Business3 days ago
Australian shares drop as Iran war enters third week
-

 Business5 days ago
Country star Brantley Gilbert enters growing non-alcoholic beer market
-

 Crypto World3 days ago
Crypto Lender BlockFills Enters Chapter 11 with Up to $500M in Liabilities
-

 Sports6 days ago
College Basketball Best Bets: Conference Tournament Semifinal Picks
-

 Politics1 day ago
The House | The new register to protect children from their abusers shows Parliament at its best
-

 Business7 days ago
Trump demands Powell cut rates as Iran conflict raises energy prices
-

 Fashion3 days ago
25 Celebrities with Curly Hair That Are Naturally Beautiful
-

 News Videos1 day ago
RBA board divided on rate cut, unusually buoyant share market | Finance Report | ABC NEWS
-

 Crypto World7 days ago
Senate Votes to Include CBDC Ban in Bipartisan Housing Bill
-

 NewsBeat7 days ago
Deane Road crash near Bolton colleges and university
-

 Crypto World1 day ago
Canada’s FINTRAC revokes registrations of 23 crypto MSBs in AML crackdown
-

 News Videos7 days ago
Tom Lee: The 100x Opportunity EVEN Bigger Than Bitcoin (New Ethereum Prediction 2026)


You must be logged in to post a comment Login