
Crypto World
Pi Network’s PI Taps 3-Month High, Bitcoin (BTC) Fights for $68K: Weekend Watch
Pi Network’s PI token continues to defy the overall market trend with a massive double-digit gains daily.
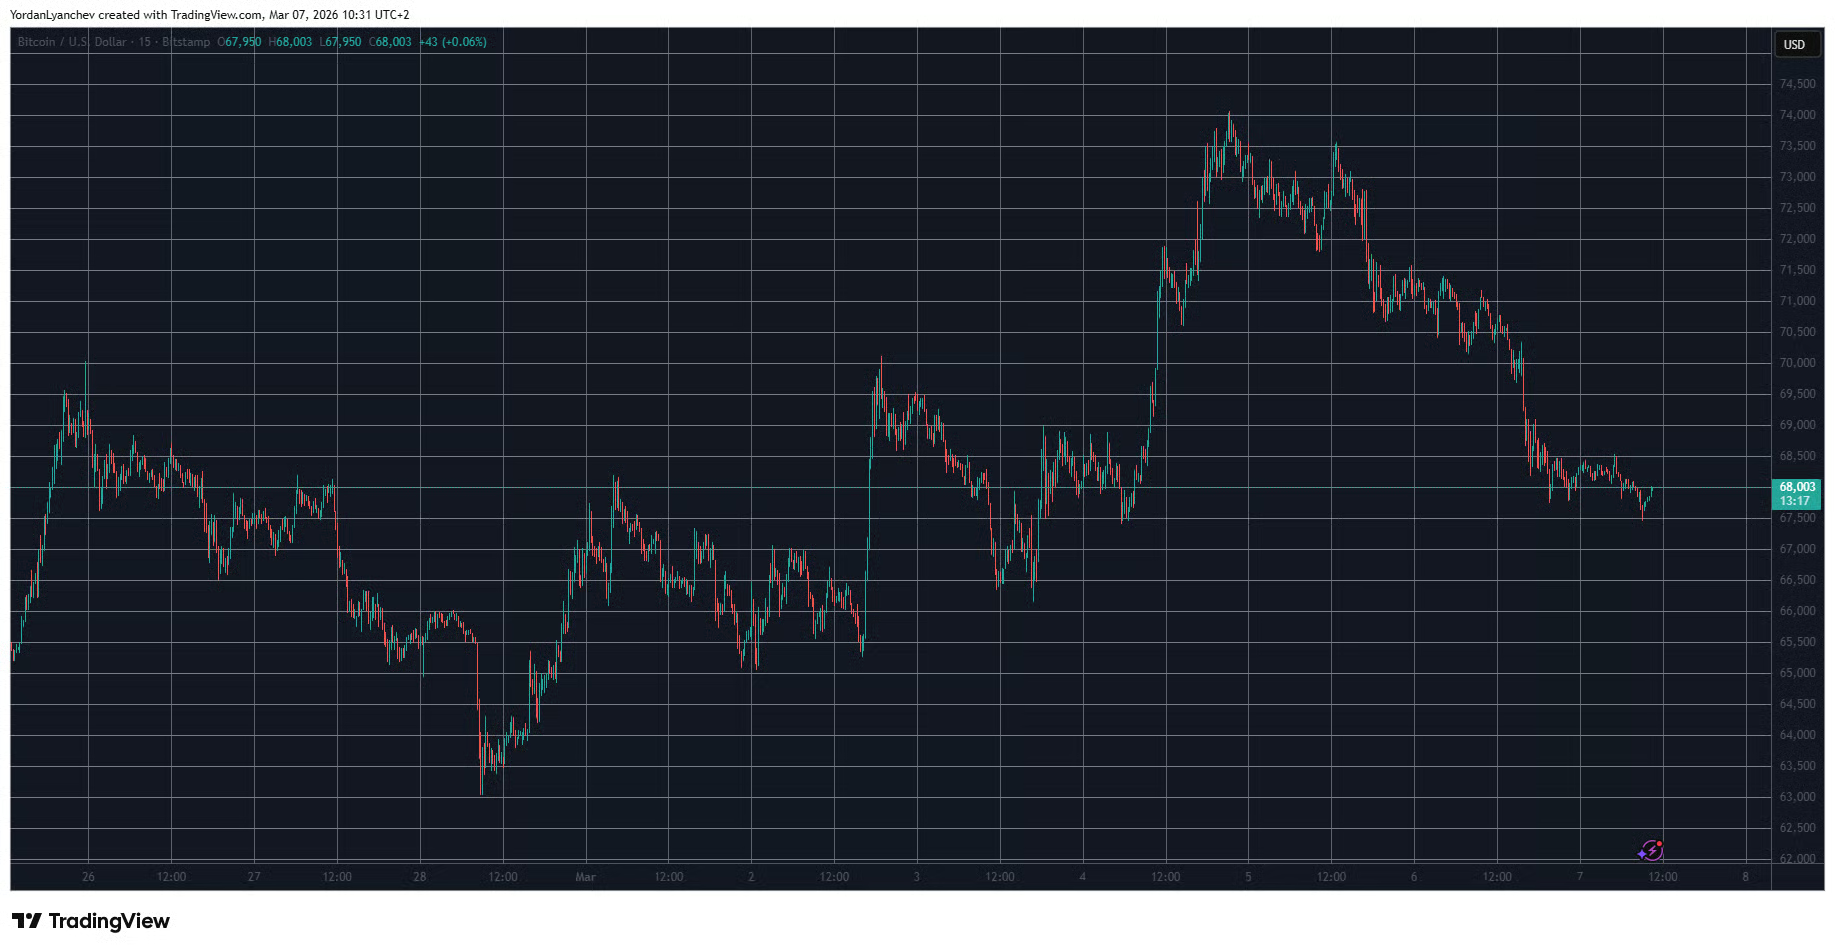
Bitcoin’s price failed to maintain the $70,000 level and has dropped by an additional two grand since then, currently fighting for the $68,000 support.
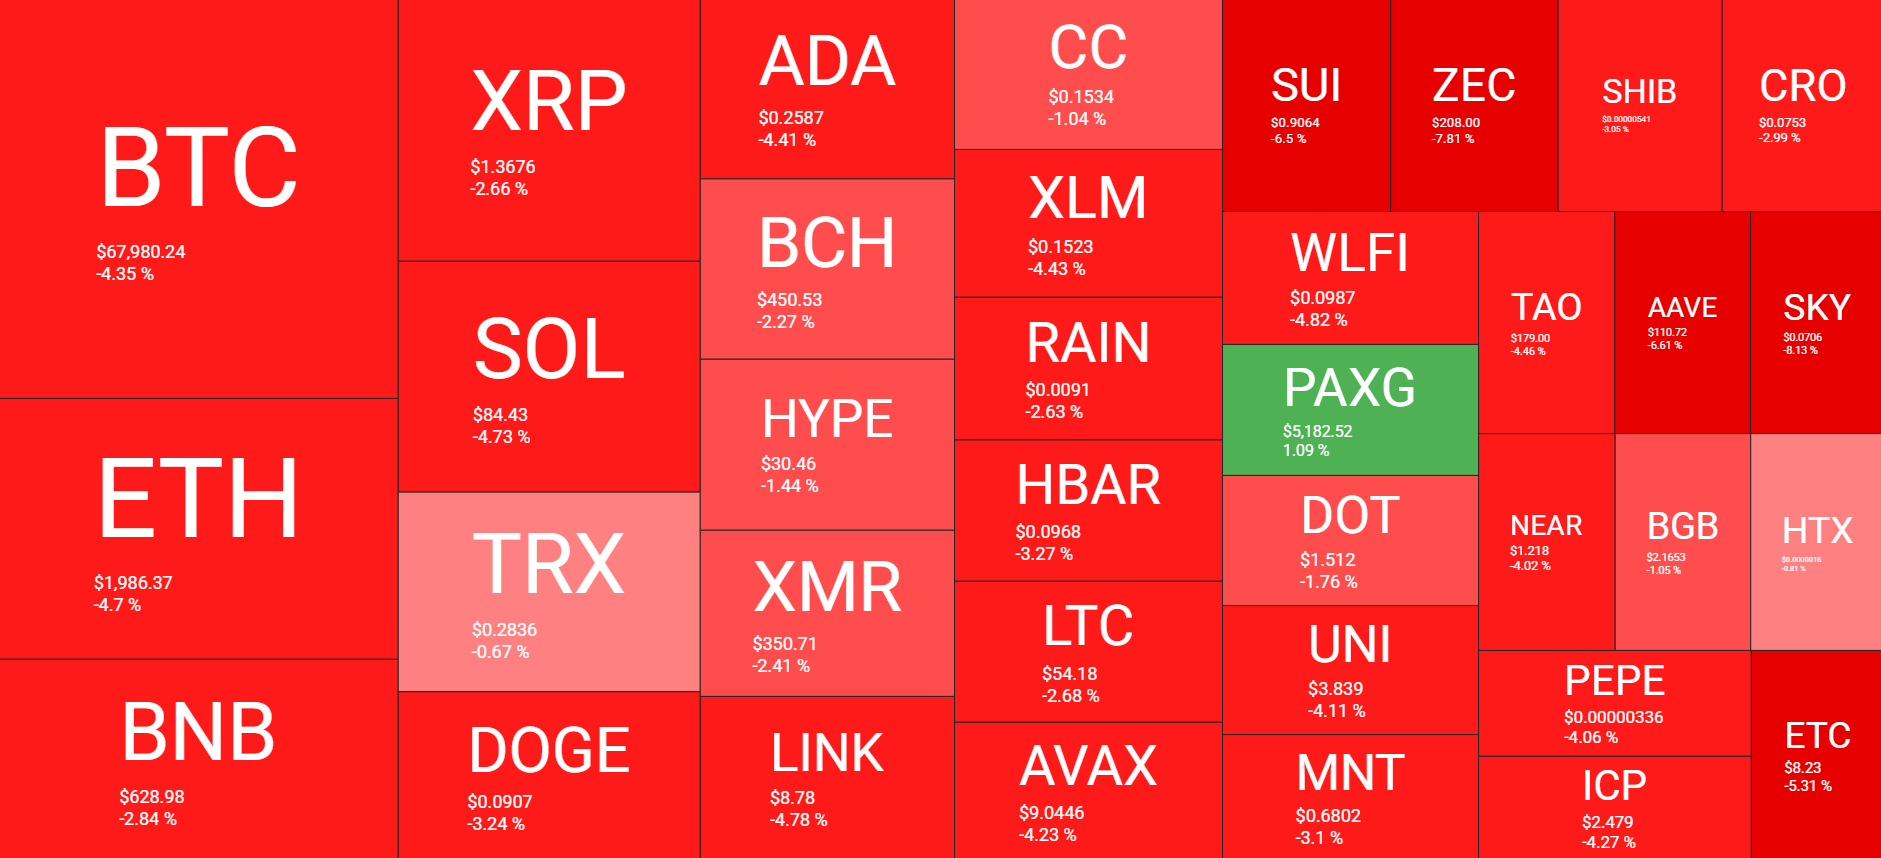
The altcoins are bleeding out as well daily, with ETH going below $2,000, and BNB dipping beneath $630. PI is among the few exceptions today with a notable price surge.
BTC Drops to $68K
Last Saturday was quite eventful as the US and Israel initiated air strikes against Iran. The Middle Eastern country retaliated immediately against numerous nations in the region, even though its Supreme Leader was killed during the attacks. BTC reacted with an immediate price drop from $67,000 to $63,000 after the initial strikes, but rebounded to $68,000 on the same day.
Its fluctuations continued as other financial markets opened on Monday morning, but the bulls seemed in control. By Wednesday, they had driven the cryptocurrency to its highest level in a month at $74,000. After gaining $11,000 since the Saturday low, BTC was due for a correction that began on the same day and culminated earlier on Saturday.
As reported yesterday, bitcoin lost the $70,000 level following a weak US jobs report and Trump’s latest remarks on Iran and Cuba. It kept dropping to a multi-day low of $67,500 marked on Saturday morning.
It has rebounded to roughy $68,000 since then, but it’s still 4% down daily. Its market cap has declined to $1.360 trillion, while its dominance over the alts is at 56.6%.
PI Defies the Market
The graph below will clearly demonstrate that the bears continue to dominate the altcoin market. ETH is down by nearly 5% to under $2,000 now, SOL has lost a similar percentage to $84, while BNB, XRP, DOGE, BCH, and XMR are down by 2-3%.
Even more painful losses are evident from SKY, ZEC, SUI, and AAVE. In fact, the only notable exception from the top 100 alts is Pi Network’s native token. PI has soared by another 13% daily and now trades close to $0.23 for the first time in three months. Perhaps the most probable reason behind this impressive performance is the ongoing protocol updates.
Nevertheless, the total crypto market cap has shed over $50 billion in a day and is down to $2.4 trillion on CG.
Binance Free $600 (CryptoPotato Exclusive): Use this link to register a new account and receive $600 exclusive welcome offer on Binance (full details).
LIMITED OFFER for CryptoPotato readers at Bybit: Use this link to register and open a $500 FREE position on any coin!
Disclaimer: Information found on CryptoPotato is those of writers quoted. It does not represent the opinions of CryptoPotato on whether to buy, sell, or hold any investments. You are advised to conduct your own research before making any investment decisions. Use provided information at your own risk. See Disclaimer for more information.

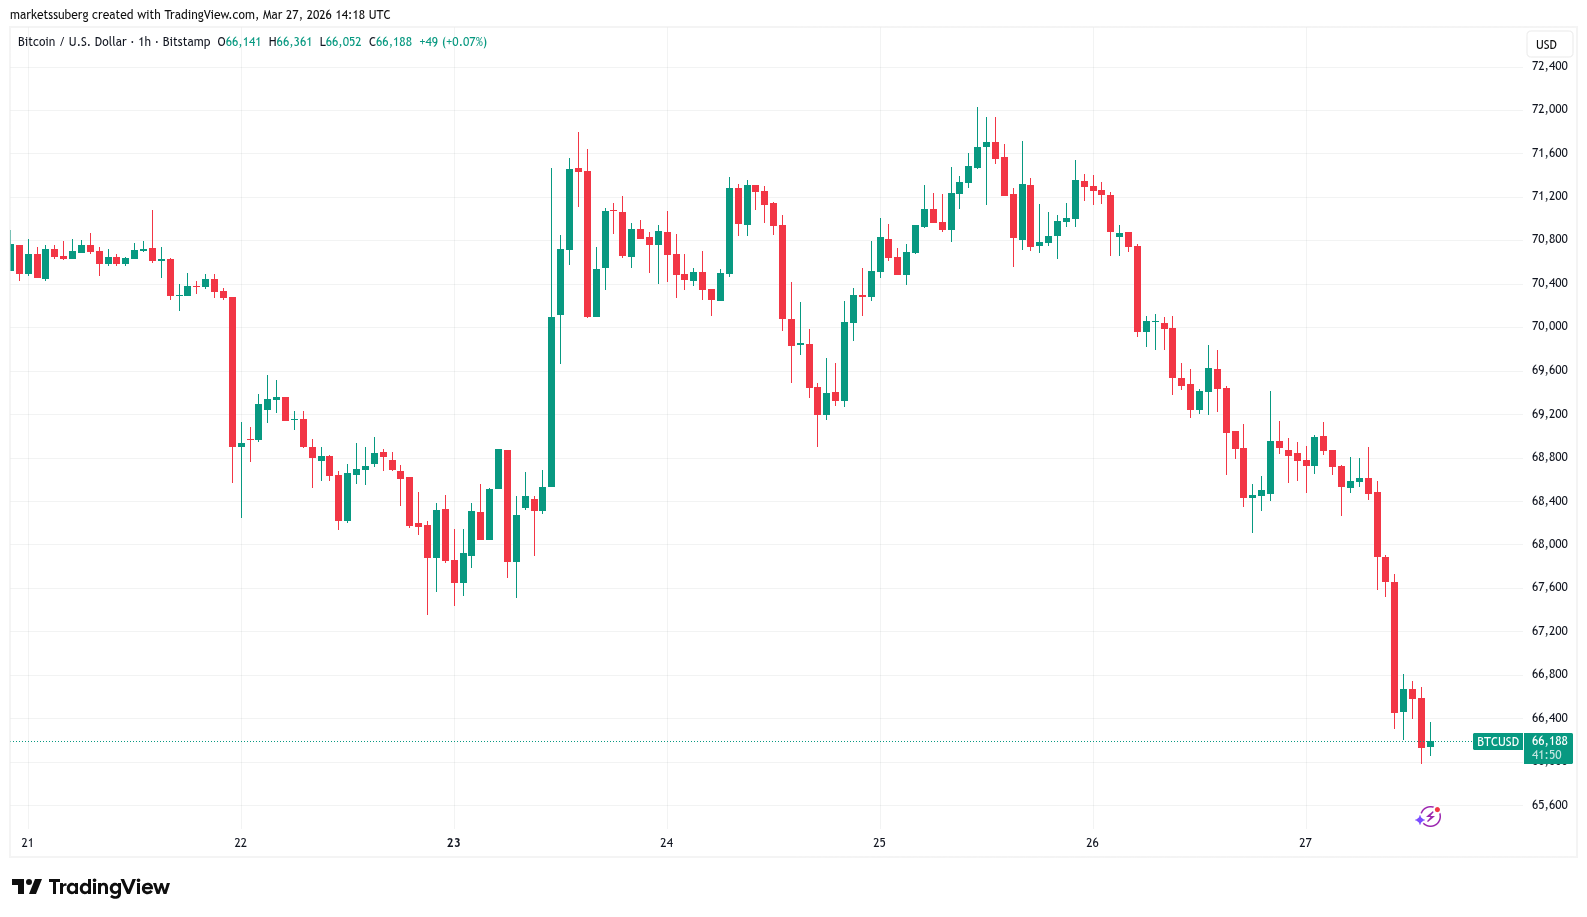
Bitcoin (BTC) neared $66,000 at Friday’s Wall Street open as analysis called US inflation trends “objectively unsustainable.”
Key points:
-
Bitcoin drops further on oil-supply woes as Iran closes the Strait of Hormuz.
-
BTC price performance is set to seal its sixth straight month of losses at the March close.
-
Traders eye the lows with $70,000 back as resistance.
Oil squeeze creates US bond-market havoc
Data from TradingView captured ongoing BTC price losses, which approached 4% on the day and threatened to turn March into Bitcoin’s sixth consecutive “red” month.

Macro headlines drove weakness across risk assets. US stocks opened downward after Iran closed the Strait of Hormuz, sharpening nerves over global oil supplies.
With the US-Iran war set to extend into April, markets showed stress everywhere — including US bonds.
“The US bond market is in major trouble today,” trading resource The Kobeissi Letter warned in a post on X.
Kobeissi noted that the 10-year Treasury note was now at its highest levels since the war began, creating a major headache for the Federal Reserve as it tries to tame inflation as labor-market conditions worsen.
“In less than one month, markets have gone from discussing rate cuts to rate hikes, with the base case showing a Fed PAUSE for the next 18 months,” it continued.
“Keep in mind, the Fed was cutting interest rates because the labor market was weak, and it remains weak. However, inflation expectations have just become an even bigger problem than the labor market. This is objectively unsustainable.”

As Cointelegraph reported, oil prices have a pronounced impact on US inflation trends, while markets have also raised expectations of recession hitting in 2026.
“Inflation expectations have become so bad that the market is trading like an emergency Fed rate hike is imminent,” Kobeissi founder Adam Kobeissi added.

Bitcoin price resistance settles in at $70,000
Among Bitcoin traders, the mood was just as wary as BTC/USD circled its lowest levels in three weeks.
Related: Bitcoin value ‘off the chart’ as BTC price metric hits record lows in 2026
Analyzing four-hour time frames, Telegram trading resource Technical Crypto Analyst predicted a “likely” return to $64,000 next.
“BTC has clearly broken its ascending trendline and is now showing lower highs under the 70–72K supply, confirming a short-term bearish shift; with price losing the 68K support, continuation toward the 64–65K demand zone is likely, and only a reclaim above 70K would invalidate the bearish momentum,” it told subscribers.

Data from CoinGlass revealed the high stakes for price into the March monthly close, with BTC/USD readying its first six straight months of losses since the end of its 2018 bear market.

“Indeed seeing the market derisking into the weekend as expected and as we’ve been seeing several weeks now,” trader Daan Crypto Trades continued.
“Eyes on that $65.6K low from last week Monday. Main area to watch for me will be the range low. Seeing there’s still quite a bit of liquidity around that area.”

This article does not contain investment advice or recommendations. Every investment and trading move involves risk, and readers should conduct their own research when making a decision. While we strive to provide accurate and timely information, Cointelegraph does not guarantee the accuracy, completeness, or reliability of any information in this article. This article may contain forward-looking statements that are subject to risks and uncertainties. Cointelegraph will not be liable for any loss or damage arising from your reliance on this information.

XRP price is trading at $1.35, down almost 2% on the day, and the headline reason for optimism is, paradoxically, part of the prediction problem. Ripple’s freshly announced AI security upgrade for the XRP Ledger landed this week with institutional fanfare. The price barely moved. What’s actually driving the tape right now tells a more complicated story.
On March 26, Ripple published a detailed blog post outlining an AI-driven security framework for XRPL: adversarial code scanning for every pull request, AI-assisted code reviews, dedicated red-team fuzzing, and large-scale attack simulations.
— Crypto Briefing (@Crypto_Briefing) March 26, 2026
 NEW: Ripple is rolling out AI-driven security testing across the XRP Ledger, deploying an AI-assisted red team that has already identified new vulnerabilities. pic.twitter.com/1kjhAlIEcu
Data flags surging Binance open interest, repeated long liquidations, and a bearish wedge breakdown as the dominant near-term forces. Fundamental upgrades and derivative-market mechanics rarely move on the same clock.
With leverage rebuilding and technical structure under pressure, the question isn’t whether XRPL is becoming more secure; it clearly is, but whether the market cares right now.
Discover: The best crypto to diversify your portfolio with
XRP Price Prediction: Can Ripple Price Hit $1.5 Before Month-End?
The technical picture is cautious. XRP has spent the past several weeks range-bound, printing a bearish pin bar rejection at the upper boundary of a consolidation channel that has defined price action since late January. The token hit $1.60 earlier in March before a 3.3% retreat, a level that now acts as near-term resistance.
Key levels to watch: $1.27 is the critical floor, aligning with the 23.6% Fibonacci retracement and what analysts describe as the bear market support line. To the upside, $1.51 represents the 61.8% Fibonacci retracement; breaking and holding above it would signal a structural shift.

On-chain data shows limited meaningful resistance until the $1.75–$1.80 range, where approximately 1.85 billion XRP were accumulated. But it’s a long way to go.
Longer-dated year-end forecasts range from $1.64 to $2.15, with AI models flagging a “significant disconnect between market panic and a projected H2 surge.” That may well play out, but traders watching the daily chart need $1.51 to flip before conviction builds.
Discover: The best pre-launch token sales
LiquidChain Targets Early Mover Upside as XRP Tests Key Levels
XRP holding the $1.27 floor is far from a disaster, but the asymmetry here is limited; even a clean breakout to $1.80 represents roughly 31% upside from current levels. For traders already positioned and watching leverage risk accumulate, that risk/reward ratio demands scrutiny.
Early-stage infrastructure plays offer a different calculus entirely, particularly when the macro argument (cross-chain liquidity, institutional rails) overlaps with XRP’s own use case.
LiquidChain is a Layer 3 infrastructure project building what it calls the Cross-Chain Liquidity Layer, fusing liquidity from Bitcoin, Ethereum, and Solana into a single execution environment. The architecture centers on a Unified Liquidity Layer, Single-Step Execution, Verifiable Settlement, and a Deploy-Once structure that lets developers access all three ecosystems without redeployment.
A new layer emerges. Only a few see it first. — LiquidChain (@getliquidchain) March 24, 2026
The future is LiquidChain  ⟁https://t.co/vqvBcdSj94 pic.twitter.com/R7ZeZ0NPGl
The presale is currently priced at $0.014, with more than $600K raised to date. The project also offers more than 1700% APY staking rewards for early buyers.
The early-stage entry price is the obvious draw. Presales carry meaningful risk — no live mainnet, no exchange listing yet, and liquidity post-launch is never guaranteed. Traders weighing XRP’s compressed near-term range against alternative positioning may find the comparison useful. Research LiquidChain here before the current presale tranche closes.
This article is not financial advice. Crypto markets are highly volatile. Always conduct your own research before investing.
The post XRP Price Prediction: AI Growth Not Lifting XRP, For Now appeared first on Cryptonews.


Solana meme coin WhiteWhale has crashed about 50% after its founder quit over family pressure and “pump the price” demands, locking $13m in tokens as the meme hangover deepens.
Summary
- Solana-based meme coin WhiteWhale plunged about 50% after its founder “The White Whale” abruptly quit the project.
- The trader cited a family crisis and pressure to “pump the price,” permanently locking 500 million tokens worth roughly $13 million.
- WhiteWhale’s market cap now sits near $12 million, with $5.4 million in 24-hour trading volume as traders reassess the project.
Solana (SOL) meme coin WhiteWhale has crashed by roughly 50% after its leading figure, the trader known as “The White Whale,” suddenly announced his exit from the project, saying he could no longer handle the personal and community pressures surrounding the token. According to a ChainCatcher report relayed by KuCoin, the coin’s market capitalization has dropped to about $12 million, with 24-hour trading volume at $5.4 million as of March 27. In his farewell, the founder cited a “personal family crisis” and exhaustion from constant demands to “pump the price,” and moved to lock 500 million WHITEWHALE tokens—valued at approximately $13 million at the time—into a non-spendable address.
Before the latest plunge, WhiteWhale had become one of Solana’s breakout meme assets, briefly topping a $110 million market cap in early January while trading near $0.11 and logging a 2,700% gain over 30 days, with more than 12,000 holding addresses and $4.8 million in daily volume, according to BlockBeats data cited by KuCoin.
BlockBeats separately reported that the token’s market cap had earlier surpassed $90 million on a rebound from around $0.04, with a 24-hour volume of $3.84 million. That speculative run-up made WhiteWhale a key part of Solana’s late-2025 meme coin narrative, where tokens routinely added tens of millions of dollars in value on little more than social media momentum.
In his parting note, the trader behind @TheWhiteWhaleV2 insisted the move was not a rug pull but an attempt to remove himself from the price loop. “Our largest private holder exited the majority of their position… we didn’t participate in the selling, although we did do some buybacks,” he had previously written when defending an earlier January crash, framing it as a “liquidity event” that broadened token distribution rather than a treasury-driven dump. This time, however, he said he could not continue with the community’s constant fixation on short-term gains and accusations whenever the chart turned.
WhiteWhale’s collapse comes against a darker backdrop for Solana’s meme ecosystem. A Protos investigation last year found that 12 Solana pre-sale meme coin founders who raised a combined $26.7 million had already abandoned their projects, leaving most tokens nearly worthless. As Phemex recently noted, Solana’s broader meme coin crash in early 2026 saw weekly DEX volume on key platforms like Pump.fun and Meteora collapse, as speculative flows dried up and SOL itself slid from around $116 to $85, erasing billions in paper wealth.
In a previous crypto.news story, analysts warned that meme coins like WhiteWhale—despite occasional 2,000% rallies—are structurally fragile, with concentration among early insiders and no fundamental cash flows to anchor valuations. WhiteWhale’s latest 50% wipeout, triggered not by code exploits but by one trader’s decision to walk away and lock $13 million in tokens, now serves as a stark reminder of how much of this market still revolves around personalities rather than products.


Backpack CEO Armani Ferrante denies BP OTC cash‑outs and downplays FDV focus as anger over “witch hunt” Sybil bans forces appeals, buybacks and a fairness rethink.
Summary
- Backpack founder Armani Ferrante denied that the team sold BP tokens over-the-counter to cash out, calling the rumors “FUD.”
- Ferrante said earlier OTC comments were only meant to help large buyers find liquidity, not to facilitate insider sales.
- He admitted the exchange’s handling of “witch hunt” Sybil cases was “too mechanical” and promised re-evaluations, while downplaying short-term FDV as a meaningful metric.
Backpack founder and CEO Armani Ferrante has moved to calm a backlash around the exchange’s BP token launch, publicly denying that the team conducted over-the-counter sales to exit its position and conceding that its aggressive anti-Sybil process has unfairly hit parts of the community. In a detailed post on X, Ferrante wrote: “OTC. I can’t believe I have to say this, no, we aren’t OTCing our own tokens to cash out,” adding that “FUD is an opportunity to either address misunderstandings or to identify mistakes and simply fix them.” [x.com] He stressed that past mentions of OTC were “only about helping serious buyers find tokens,” not about offloading the team’s allocation.
The comments follow days of anger over BP’s token generation event on March 23, where airdrop rewards were sharply reduced or revoked for users flagged as “witches,” or suspected Sybil accounts. On X, Ferrante acknowledged that the review process had become overly rigid, writing that the team’s approach to witch cases had been “too mechanical” and that “more complex cases are being re-evaluated.” An analysis by AInvest noted that Backpack has now opened an appeal channel and committed to restoring up to 50% of tokens for some affected users, alongside a buyback program aimed at stabilizing BP’s secondary-market liquidity.
The storm erupted as BP began trading with a fully diluted valuation that quickly pushed toward the $200 million range, in line with probabilities markets had already priced in. In February, Odaily reported Polymarket markets assigning a 98% chance that BP’s FDV would exceed $100 million and an 87% chance it would surpass $200 million on the day after listing, implying a price range of roughly $0.10 to $0.20 per token. AInvest later estimated that BP had fallen to about $0.27, putting its FDV near $200 million as community trust wobbled.
Ferrante, however, urged users to look past short-term market swings. “FDV is not the core metric we are optimizing for,” he wrote, arguing instead that “long-term product-market fit, compliance and transparency” would determine Backpack’s eventual value. As [KuCoin] reported ahead of TGE, Backpack has touted a more “IPO-like” tokenomics structure tied to its underlying equity and compliance footprint, operating in fewer than half of global jurisdictions to stay within regulatory guardrails.
The current crisis lands at an awkward time for Backpack, which has heavily marketed itself as a post-FTX “safety first” exchange with daily proof-of-reserves and a Solana-focused trading stack. In a previous crypto.news story, Ferrante described the exchange as an attempt to “do it the right way” after losing $14.5 million in the FTX collapse and watching industry trust evaporate. Now, the exchange’s promise of fairness is being tested by users who feel blindsided by airdrop clawbacks and suspicious of any hint of OTC activity.
Backpack’s response—public denials of OTC cash-outs, a softer line on witch cases, and a renewed emphasis on long-term alignment—will determine whether the BP launch is remembered as a messy but fixable rollout or as the moment the project’s social capital peaked. In a market still scarred by exchange blowups and opaque token deals, how Ferrante follows through on these promises may matter more than BP’s next tick on the chart.

The odds of Sam Bankman-Fried receiving a presidential pardon remain a niche, high-profile topic shaping crypto policy discourse rather than a near-term legal turn. After a March interview with CNN featuring Bankman-Fried’s parents, the two leading American prediction markets trimmed their odds for a pardon in 2026, underscoring how public appeals and framing of the case can subtly influence sentiment around the former FTX chief executive.
Polymarket and Kalshi kept their 2026 pardon probability estimates in the single digits, yet each nudged slightly downward in response to the interview and subsequent media attention. Polymarket’s price implied an 11% chance of a presidential pardon this year, while Kalshi priced in about 9%. The moves followed a CNN broadcast in which Barbara Fried and Joseph Bankman argued that their son’s fraud conviction should be reconsidered and that Alameda Research borrowed customer funds from FTX, but the funds were not used improperly.
Key takeaways
- The latest prediction-market odds assign about 11% (Polymarket) and 9% (Kalshi) to a 2026 pardon for Sam Bankman-Fried, with minor declines after the parents’ CNN interview.
- FTX-related litigation has evolved from a 2023 bankruptcy-era dispute to a 2026 appellate effort, with Fried filing an appeal in February 2026 claiming new testimony could undermine government assertions about insolvency and Alameda’s deficits.
- The interview framed Bankman-Fried’s actions as mischaracterized by prosecutors, while his mother and father argued the prosecution was political and pledged to pursue exoneration, highlighting tensions over crypto policy and political influence.
- Political donations and crypto policy remain interwoven in the public narrative, as lawmakers and presidential contenders weigh the implications of clemency while crypto industry stakeholders monitor enforcement signals and regulatory direction.
Bankman-Fried pardon odds and the CNN interview
Market attention around a possible presidential clemency for Bankman-Fried has historically hovered between speculative and symbolic. After CNN aired an interview with Bankman-Fried’s parents, the probability signals on Polymarket and Kalshi shifted modestly downward. The interviews framed the case through a defense of the family’s view that the fraud conviction was built on a contested understanding of the funds flow and the role Alameda played alongside FTX. In their portrayal, they acknowledged that Alameda borrowed from FTX, but insisted the money was never misused and remained adequately secured in the system.
The interview also re-centered the public narrative around the family’s involvement in the case. Bankman-Fried has long positioned himself as a controversial figure in U.S. crypto policy—donating to both Democratic and other political figures—while the interview sought to separate his personal political activity from the broader enforcement actions taken by the government. The narrative tension—between alleged corporate mismanagement, political overtones, and the fate of customer funds—continues to shape how observers interpret the likelihood of a pardon.
Legal backstory: the bankruptcy case, the appeal, and what changed
FTX’s bankruptcy saga has been a central thread in the discourse around Bankman-Fried’s legal exposure. In a Delaware bankruptcy filing, FTX alleged that Bankman and his mother engaged in transfers and misappropriation, seeking to recover a $10 million cash gift and a $16.4 million Bahamas property. The filing painted a picture of a broader culture of misrepresentation and mismanagement, at least from the exchange’s perspective. The case was eventually dismissed without prejudice in February 2025, meaning it could be refiled in the future.
In February 2026, Fried filed an appeal on behalf of her son, arguing that new testimony could undermine three central government claims about FTX’s condition in late 2022. Those points were that FTX was insolvent on November 11, 2022; that there was no reasonable prospect of customer repayment; and that Alameda ran a multi-billion-dollar deficit on FTX’s books. Bankman-Fried countered that the money remained in place and never left the corporate estate, asserting that “the money was always there” and that Alameda possessed sufficient security.
The appellate move also sought to challenge the presiding judge, alleging “extreme prejudice” during the trial. Fried framed the prosecution as political, and both parents echoed a view that the Biden administration’s crypto stance contributed to a broader crackdown on the industry. While Bankman-Fried’s donations to Democratic politicians were noted in coverage, the interview emphasized a distinction between political activity and the merits of the case itself, arguing that the outcome should hinge on the facts rather than politics.
A broader frame: politics, policy, and the crypto industry
The discussion around pardons sits within a larger ecosystem of crypto regulation and enforcement in the United States. Analysts and lawmakers have long debated how clemency dynamics interact with the policy landscape—especially when high-profile figures are connected to the sector. A Campaign Legal Center analysis highlighted how clemency practices have sometimes rewarded loyalty or brokered deals, a lens some observers apply to the Bankman-Fried case as part of a broader clemency playbook.
On the political front, Senator Cynthia Lummis has publicly cautioned against expectations of a pardon, underscoring the harm she believes Bankman-Fried’s actions caused to individuals and the sector. President Trump’s own stance, as reported, has suggested he would not pardon Bankman-Fried, a position that, in turn, feeds into the wider public debate about the proper boundaries of executive clemency and the optics surrounding crypto-related prosecutions. Bloomberg has reported that Fried and Bankman-Fried have explored pathways to obtain a pardon since Trump’s ascent to the presidency, including discussions with advisers and figures in Trump’s orbit.
Meanwhile, Bankman-Fried’s March social-media post supporting a hardline stance on Iran’s policies—alongside a widely discussed ceasefire forecast in market betting odds—demonstrates how a single public posture can become a proxy for broader political risk signals within the crypto space. The market’s attention to these signals—ranging from clemency to geopolitical flashpoints—reflects a sector that remains highly sensitive to policy shifts, enforcement tone, and the personalities at the center of the case.
What readers should watch next
As the appellate process unfolds and the political weather around crypto policy continues to evolve, investors and users should monitor several threads. First, any fresh testimony or filings in the bankruptcy proceedings could reshape the government’s asserted facts about FTX and Alameda, potentially influencing both legal strategy and public perception. Second, the pardon conversation—whether it gains new momentum or fades—will continue to reflect the interplay between political considerations and crypto industry sentiment. Finally, broader regulatory developments, congressional inquiries, and executive actions will shape how the market prices risk around enforcement and governance as the case moves forward.
In short, while a Bankman-Fried pardon remains a speculative and low-probability event in the near term, the episode continues to serve as a barometer for how policy, politics, and a high-profile crypto failure interact in real time. Watch for new courtroom filings, any shifts in pardon discourse, and the evolving stance of policymakers on the crypto industry as the year progresses.


Prediction market traders trimmed the odds of a presidential pardon for former FTX CEO Sam Bankman-Fried after his parents renewed their public defense of him in a CNN interview.
Summary
- Polymarket and Kalshi lowered Sam Bankman-Fried pardon odds after his parents defended him on CNN.
- Joseph Bankman and Barbara Fried argued Alameda borrowed customer funds but did not misuse them.
- The family appeal challenges claims that FTX was insolvent and customers lacked repayment options altogether.
Polymarket placed the chance of a pardon this year at 11%, while Kalshi showed 9%, both lower than before the March 21 interview. The move was small, but it followed fresh public efforts by Joseph Bankman and Barbara Fried to challenge the fraud case and appeal for a different view of their son’s conduct.
Prediction markets in the United States showed a slight decline in the odds of a pardon for Bankman-Fried after the CNN appearance by his parents. Polymarket fell by 2 percentage points and Kalshi dropped by 1 point, leaving the chances in single digits to low teens.
The decline came as the interview brought the case back into public discussion. Traders appeared to respond to the renewed attention, even though neither market showed a major shift. The figures still suggested that a pardon remained unlikely in 2026.
In the interview with Michael Smerconish, Bankman and Fried said they believed the judgment against their son was wrong. Bankman said, “There’s an appeal on the case, but we don’t think it’s fraud.” Both also accepted that Alameda Research borrowed customer funds from FTX, but they argued that those funds were not misused.
Bankman said Alameda “acted like everybody else, putting in money and borrowing money.” He also said “the money was always there” and claimed Alameda had enough backing to cover its positions. Fried said, “All the money, it was there, every penny of it,” while arguing that the assets ended up in the FTX estate during the bankruptcy process.
The parents’ defense has also renewed attention on their own links to FTX. Bankman worked as a paid adviser to the exchange, while Fried was described as a political consultant. During FTX’s bankruptcy process in 2023, the estate sued them in Delaware, seeking to recover funds and property it said were improperly transferred.
The complaint alleged that they discussed receiving a $10 million cash gift and a $16.4 million luxury property in the Bahamas. It also said Bankman helped sustain a culture of misstatements and poor management inside the company. That case was dismissed without prejudice in February 2025, which means the claims were not permanently closed.
Appeal and pardon effort face political barriers
In February 2026, Fried filed an appeal on behalf of her son. The filing argued that new testimony would challenge three key government claims: that FTX was insolvent on Nov. 11, 2022, that customers had no real prospect of repayment, and that Alameda regularly carried a multi-billion-dollar deficit on FTX.
The family has also tried to frame the case in political terms. Fried said, “Sam’s prosecution was essentially political,” and argued that parts of the Biden administration targeted the crypto industry. Still, public support for a pardon appears limited. Senator Cynthia Lummis told Politico, “I hope the president doesn’t fall for that. […] He hurt a lot of people.”
Trump has also reportedly indicated that he would not pardon Bankman-Fried, leaving betting market traders with little reason to raise the odds.


Summary
- ECB staff paper finds top 100 holders in Aave, MakerDAO, Ampleforth and Uniswap control over 80% of governance tokens.
- Concentrated voting blocs threaten DeFi protocols’ claims to “fully decentralized” status under MiCA.
- Findings raise risk that leading DeFi DAOs could be pulled inside the EU’s licensing and compliance regime.
The European Central Bank (ECB) has published a working paper arguing that governance in flagship DeFi protocols like Aave, MakerDAO, Ampleforth and Uniswap is far more centralized than their “decentralized autonomous organization” branding suggests, a conclusion that could strip them of regulatory safe harbor under the EU’s MiCA regime. The staff study, titled “Who to regulate? Identifying actors within DeFi’s governance,” finds that the top 100 holders in each of the four protocols collectively control more than 80% of governance token supply, with “around half or more holdings linked” to the protocols themselves or exchanges.
According to the ECB researchers, voting power is even more concentrated than token ownership, with top voters “mostly delegates, who, in many cases, could not be identified nor linked to token holders.” In Ampleforth, the paper highlights that the top 20 voters account for roughly 96% of proxy voting rights, a structure that leaves real control in the hands of a small, opaque elite. That concentration, the authors warn, turns many DAOs into what prior academic work has called “minority rule,” where a few large token holders or delegates can effectively dictate protocol outcomes.
Under the EU’s Markets in Crypto-Assets regulation, crypto-asset services that are “provided in a fully decentralised manner without any intermediary” can fall outside the core licensing perimeter. The ECB paper directly questions whether Aave, MakerDAO’s Sky ecosystem, Uniswap and Ampleforth can plausibly claim that status when more than half of governance tokens in some cases are linked to founding teams or centralized exchanges such as Binance. “The concentration of governance power remains stable over time,” the authors write, arguing that decentralization here is “form over substance.”
For policymakers, the study’s aim is explicit: identify “regulatory anchor points” in systems that were designed to avoid having a traditional issuer, board or CEO. The authors stress that limited on-chain transparency about the real-world identities behind key delegates “complicates efforts to assess accountability and reinforces concerns about the concentration of power.” That, in turn, bolsters arguments from EU agencies and legal commentators that MiCA’s decentralization exemption must be interpreted narrowly, with regulators focusing on where effective decision-making and operational control actually sit, rather than on marketing language about DAOs.
In practice, the ECB’s approach signals that supervisors are ready to treat DeFi governance structures with the same forensic scrutiny applied to large banks’ shareholder registers and control chains. If Aave, Uniswap or MakerDAO cannot demonstrate materially dispersed and accountable governance, their DAOs may be forced into the same kind of licensing, capital, and compliance obligations now facing centralized crypto-asset service providers across the bloc.
Crypto World
Bitcoin price (BTC) slides alongside software stocks following leak of new Anthropic model


Anthropic, the artificial intelligence company behind Claude, has begun testing a new AI model more capable than any it has released previously, Fortune reported.
The company said the model represents “a step change” in performance and is “the most capable we’ve built to date.” It is currently being tested with a small group of early access customers as Anthropic evaluates its behavior and risks.
Among the names moving sharply lower on the news: Palo Alto Networks (PANW), Crowdstrike (CRWD) and Fortinet (FTNT) are all down 4%-6%. The broader iShares Expanded Tech-Software Sector ETF (IGV) is off 2.5%.
The overnight leak likely contributed to bitcoin’s tumble back to $66,000 after flirting with $70,000 hours earlier.
Details about the model surfaced after internal materials were accidentally exposed in a publicly accessible data store, according to Fortune. Around 3,000 assets linked to Anthropic’s blog were available online, including draft announcements and internal content that had not yet been released.
Among the files was a draft blog post referring to the model as “Claude Mythos.” The document warned that the system could pose serious cybersecurity risks, pointing to its ability to identify and exploit software vulnerabilities.
Anthropic currently offers three tiers of models — Opus, Sonnet and Haiku — which vary in size, cost and capability. The leaked materials suggest the company is developing a new tier called “Capybara,” which would be even larger and more intelligent than Opus, the company’s most advanced model to date.

TLDR
- Intercontinental Exchange invested $600 million in Polymarket as part of its funding agreement.
- ICE plans to purchase up to $40 million in Polymarket securities from existing holders.
- The new investment completes ICE’s previously announced $2 billion commitment.
- ICE made its initial $1 billion investment in Polymarket in October 2025.
- The October 2025 deal valued Polymarket at about $8 billion before the investment.
Intercontinental Exchange confirmed a new $600 million direct cash investment into Polymarket on Friday morning. The company also plans to acquire up to $40 million in securities from existing holders. With these steps, ICE completes its previously announced investment arrangement with the platform.
ICE Expands Financial Commitment to Polymarket
ICE disclosed that the $600 million payment forms part of Polymarket’s ongoing equity capital raise. The company also expects to purchase up to $40 million in securities from certain current shareholders. Together, these transactions fulfill ICE’s structured commitment of up to $2 billion.
ICE made its first direct investment in October 2025 with a $1 billion tranche. That transaction valued Polymarket at about $8 billion before the investment. The post-money valuation ranged between $9 billion and $10 billion. However, ICE has not yet disclosed the valuation attached to the new $600 million tranche.
The company stated that it will release specific terms after Polymarket completes its fundraising. ICE confirmed that these investments will not materially affect its financial results. It also said the transactions will not alter expected capital return plans.
ICE owns and operates the New York Stock Exchange. The company ranks among the largest providers of financial market technology and data worldwide. Therefore, the transaction adds Polymarket to its portfolio of strategic investments.
ICE structured the funding as a multi-part program. The latest payment and planned secondary purchases complete that program. No executive statements accompanied the March 2026 disclosure.
Polymarket Partnership and Market Position
Polymarket operates a prediction market platform focused on real-world event outcomes. Users place wagers based on aggregated probabilities of future events. During the 2024 U.S. presidential election, the platform recorded elevated activity from retail and institutional participants.
The October 2025 agreement included plans for ICE to distribute Polymarket’s event-driven data globally. ICE aimed to provide that data to institutional clients through its existing channels. The companies also referenced collaboration on tokenization initiatives at that time.
However, the latest announcement did not revisit distribution or tokenization plans. ICE focused solely on confirming the completion of its capital commitment. The company described the investment as part of its existing arrangement.
Polymarket’s primary competitor remains Kalshi, which operates under CFTC regulation. Both platforms offer contracts tied to event outcomes and probabilities. ICE did not comment on competitive positioning in its statement.
ICE reiterated that its total commitment now reaches the upper limit of the original agreement. The combined primary and secondary investments account for the full planned allocation. Specific valuation details will follow once Polymarket finalizes its equity raise.


GameStop said it did not sell the 4,709 Bitcoin tied to its January balance sheet change.
Summary
- GameStop pledged 4,709 BTC with Coinbase Credit and kept economic exposure instead of selling outright.
- The covered-call strategy generated premium income but capped upside if Bitcoin rises above strike prices.
- GameStop reclassified the pledged Bitcoin and recorded digital asset receivables on its balance sheet.
Instead, the company used the holdings in a covered-call arrangement with Coinbase Credit, according to its latest annual filing.
GameStop’s latest 10-K filing showed that the company still kept exposure to the Bitcoin it bought in 2025. The filing said the retailer pledged 4,709 BTC as collateral with Coinbase Credit instead of selling the assets outright.
That disclosure addressed earlier market speculation that GameStop had exited the position in January. The value of the pledged Bitcoin was about $324 million at the time, based on market pricing referenced in the report.
The filing said GameStop entered an agreement with Coinbase Credit during the fourth quarter of fiscal 2025. Under that arrangement, the company sold covered call options on part of the Bitcoin it owned. GameStop said,
“In the fourth quarter of fiscal 2025, we entered into an agreement with Coinbase Credit, Inc., under which we sold covered call options on a portion of the bitcoin we own.”
The strategy allows the company to collect premium income while keeping overall exposure to Bitcoin price moves.
The strike prices on the options ranged from $105,000 to $110,000. That means the company would limit its upside if Bitcoin rises above those levels, but it would still earn income from the options premiums.
The agreement is set to expire on Friday, according to the filing. As of Jan. 31, the call option contracts created a $700,000 liability and an unrealized gain of about $2.3 million.
Coinbase control changed accounting treatment
GameStop also said Coinbase Credit had the right to “rehypothecate, commingle, or unilaterally sell” the pledged Bitcoin. Because of that, the company said control of the assets had moved to the counterparty under the agreement.
The filing stated,
“Accordingly, we derecognized the Pledged Bitcoin as an intangible asset and recognized digital assets receivable of $368.3 million within ‘Digital assets and related receivables’ on our Consolidated Balance Sheets as of January 31, 2026.”
The company added that its economic exposure remained consistent with direct Bitcoin ownership.
GameStop also reported an unrealized loss of $59.7 million tied to digital asset receivables during fiscal 2025. The filing added that some of the covered-call contracts expired unexercised after the fiscal year ended on Jan. 31.
Mum-of-three found dead in freezer at home as man charged with murder

Anaergia Inc. 2025 Q4 – Results – Earnings Call Presentation (TSX:ANRG:CA) 2026-03-27

Bitcoin Preps Sixth Red Month in a Row as Oil Fears Surge


-
 Crypto World7 days ago
NIO (NIO) Stock Plunges 6.5% as Shelf Registration Sparks Dilution Worries
-
 NewsBeat2 days ago
Manchester United reach agreement with Casemiro over contract clause amid transfer speculation
-

 Fashion7 days ago
Weekend Open Thread: Adidas – Corporette.com
-

 Politics7 days ago
Jenni Murray, Long-Serving Woman’s Hour Presenter, Dies Aged 75
-

 Crypto World6 days ago
Best Crypto to Buy Now: Strategy Just Spent $1.57 Billion on Bitcoin During Fear While Early Investors Quietly Enter Pepeto for 150x Potential
-

 Crypto World6 days ago
Bitcoin Price News: Bhutan Sells $72 Million in BTC Under Fiscal Pressure, but the Smart Money Entering Pepeto Sees What the Market Does Not
-

 News Videos2 days ago
Parliament publishes latest register of MPs’ financial interests
-

 Sports4 days ago
Remo Stars and Kano Pillars Strengthen Survival Hopes in NPFL
-

 Sports4 days ago
Gary Kirsten Accuses Pakistan Cricket Board Of ‘Interference’, Mohsin Naqvi Responds
-

 Tech5 days ago
Give Your Phone a Huge (and Free) Upgrade by Switching to Another Keyboard
-

 Business5 days ago
No Winner in March 21 Drawing as Prize Rolls to $133 Million for Next
-

 Sports7 days ago
2026 Kentucky Derby horses, odds, futures, preview, date: Expert who nailed 12 Derby-Oaks Doubles enters picks
-

 Tech5 days ago
AI enters the chat: New Seattle dating app relies on tech to facilitate meaningful human connections
-

 News Videos4 days ago
Ch 9 Financial Management Part 1 | Detailed One Shot | Class 12 Business Studies Boards 2026
-
Business7 days ago
Columbia Sportswear enters $500 million credit agreement with JPMorgan Chase
-

 Tech6 days ago
Today’s NYT Connections Hints, Answers for March 22 #1015
-

 Business18 hours ago
Instagram, YouTube Found Responsible for Teen’s Mental Health Struggle in Historic Ruling
-
 Crypto World7 days ago
Small-cap Russell 2000 enters correction territory
-

 Business5 days ago
Will Duke Basketball Win It All? Duke Basketball Enters Second Round as Third Favorite to Claim NCAA Title
-

 Sports4 days ago
2026 Kentucky Derby horses, odds, futures, preview, date: Expert who hit 12 Derby-Oaks Doubles enters picks
You must be logged in to post a comment Login