
Crypto World
Polymarket Bitcoin Price Prediction Says $75K, But Charts Don’t
Bitcoin price has traded mostly flat over the past 24 hours near $68,000, reflecting continued indecision. The broader seven-day trend still shows a mild decline, highlighting the lack of strong bullish momentum. Yet one prediction market’s positioning is telling a far more optimistic story.
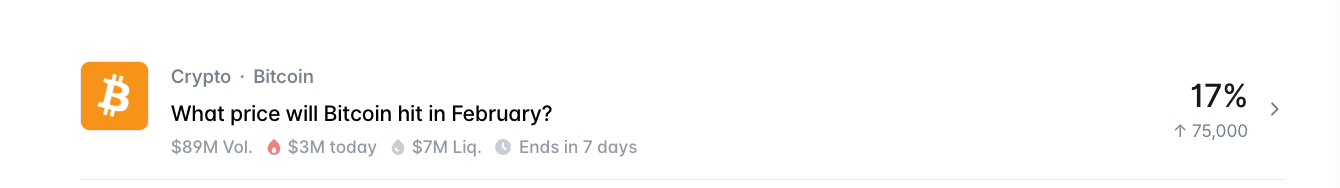
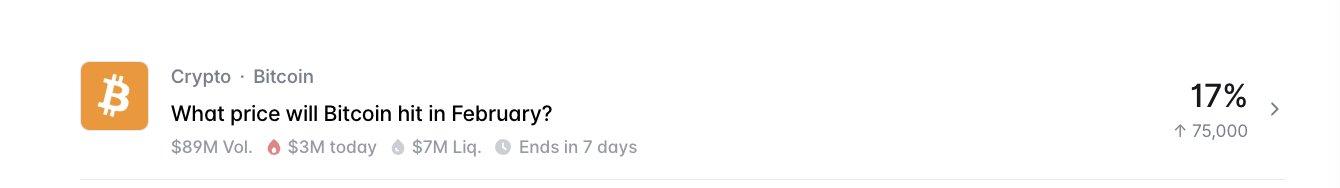
On Polymarket, the single largest February outcome, at 17%, expects Bitcoin to cross $75,000. This makes it the most popular directional bet as the month approaches its final week. However, market structure, on-chain activity, and whale positioning suggest reality may not align with this bullish expectation.
Prediction Markets Favor $75,000 — But Hidden Bearish Divergence Signals Trouble
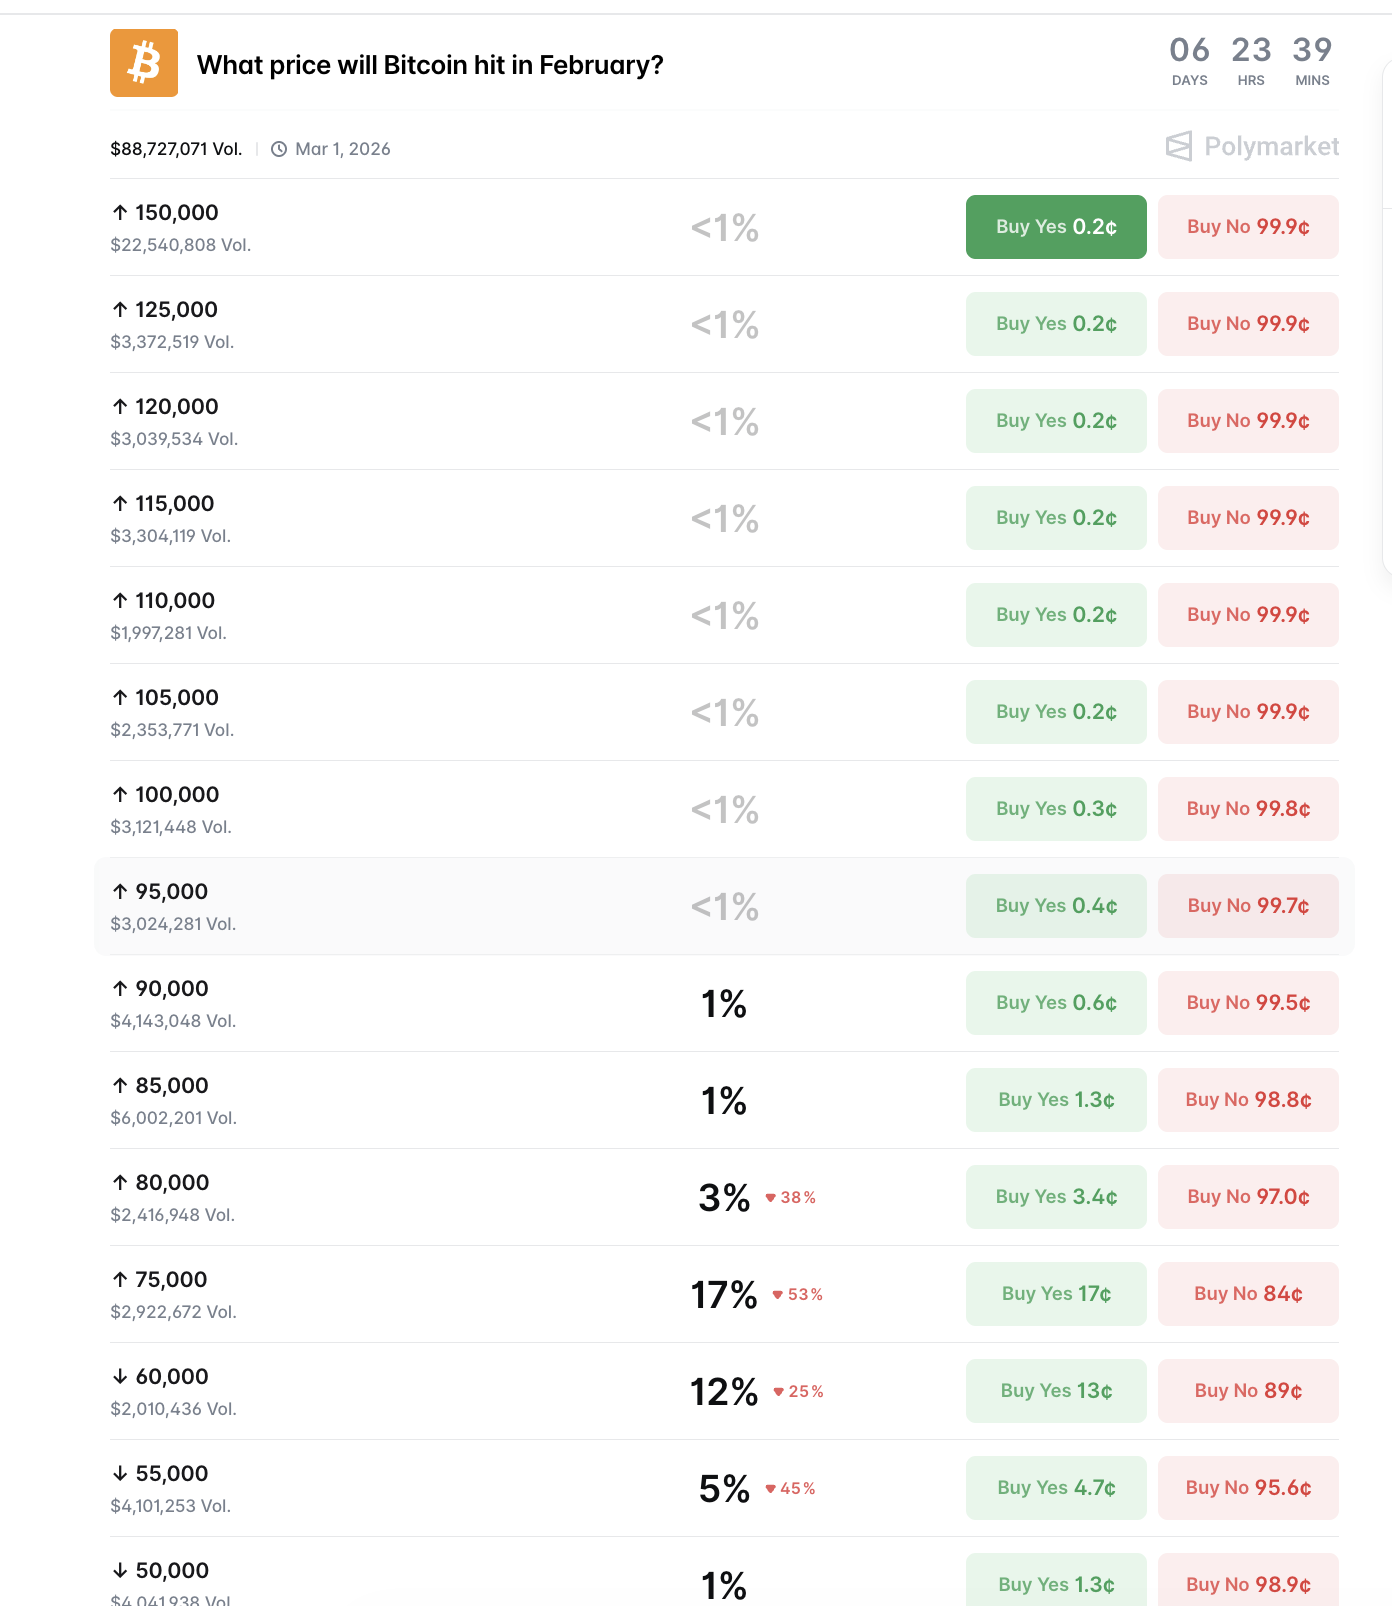
Prediction market data shows ‘above $75,000’ remains the most favored February target despite weakening sentiment. Polymarket volumes, for this bet, exceed $88 million, with millions in active liquidity.
However, the probability of the $75,000 outcome has already declined by more than 50%, reflecting fading confidence.
At the same time, the next most likely outcome sits at ‘under $60,000’ with a 12% probability. This positioning reveals a growing split in expectations. While many traders still hope for upside, a large portion of the market is increasingly preparing for a deeper correction instead.
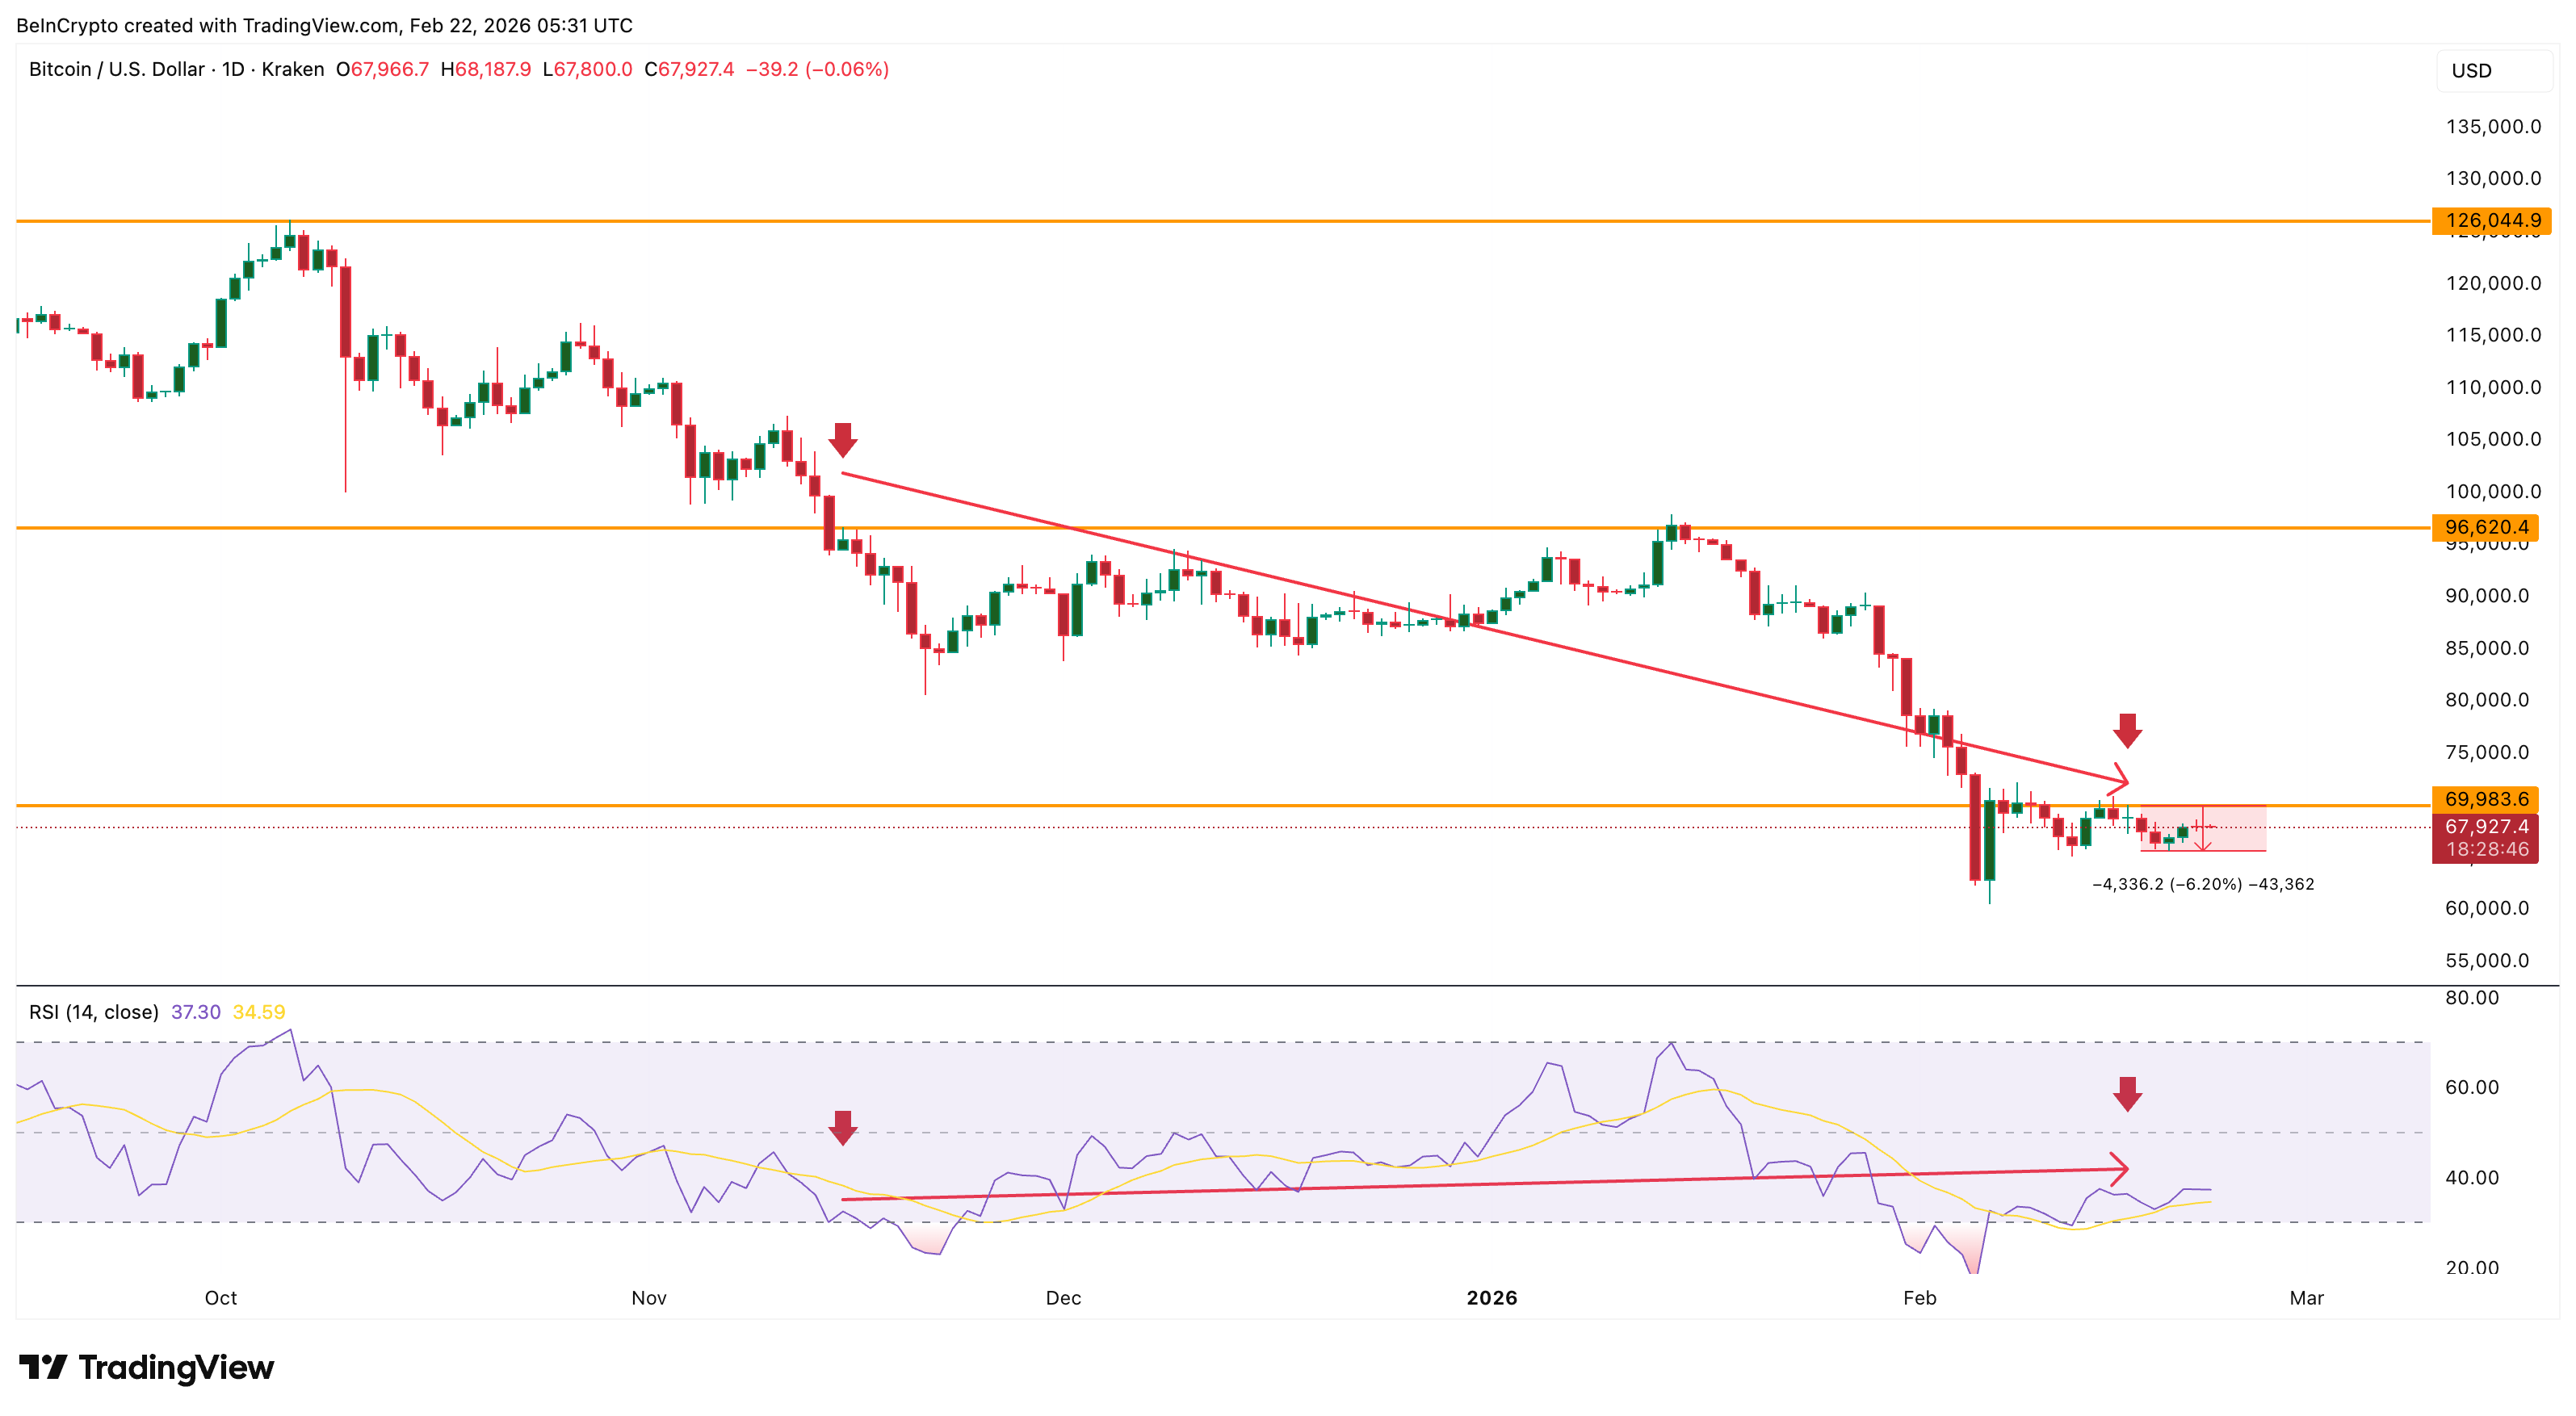
This growing caution aligns closely with Bitcoin’s technical structure.
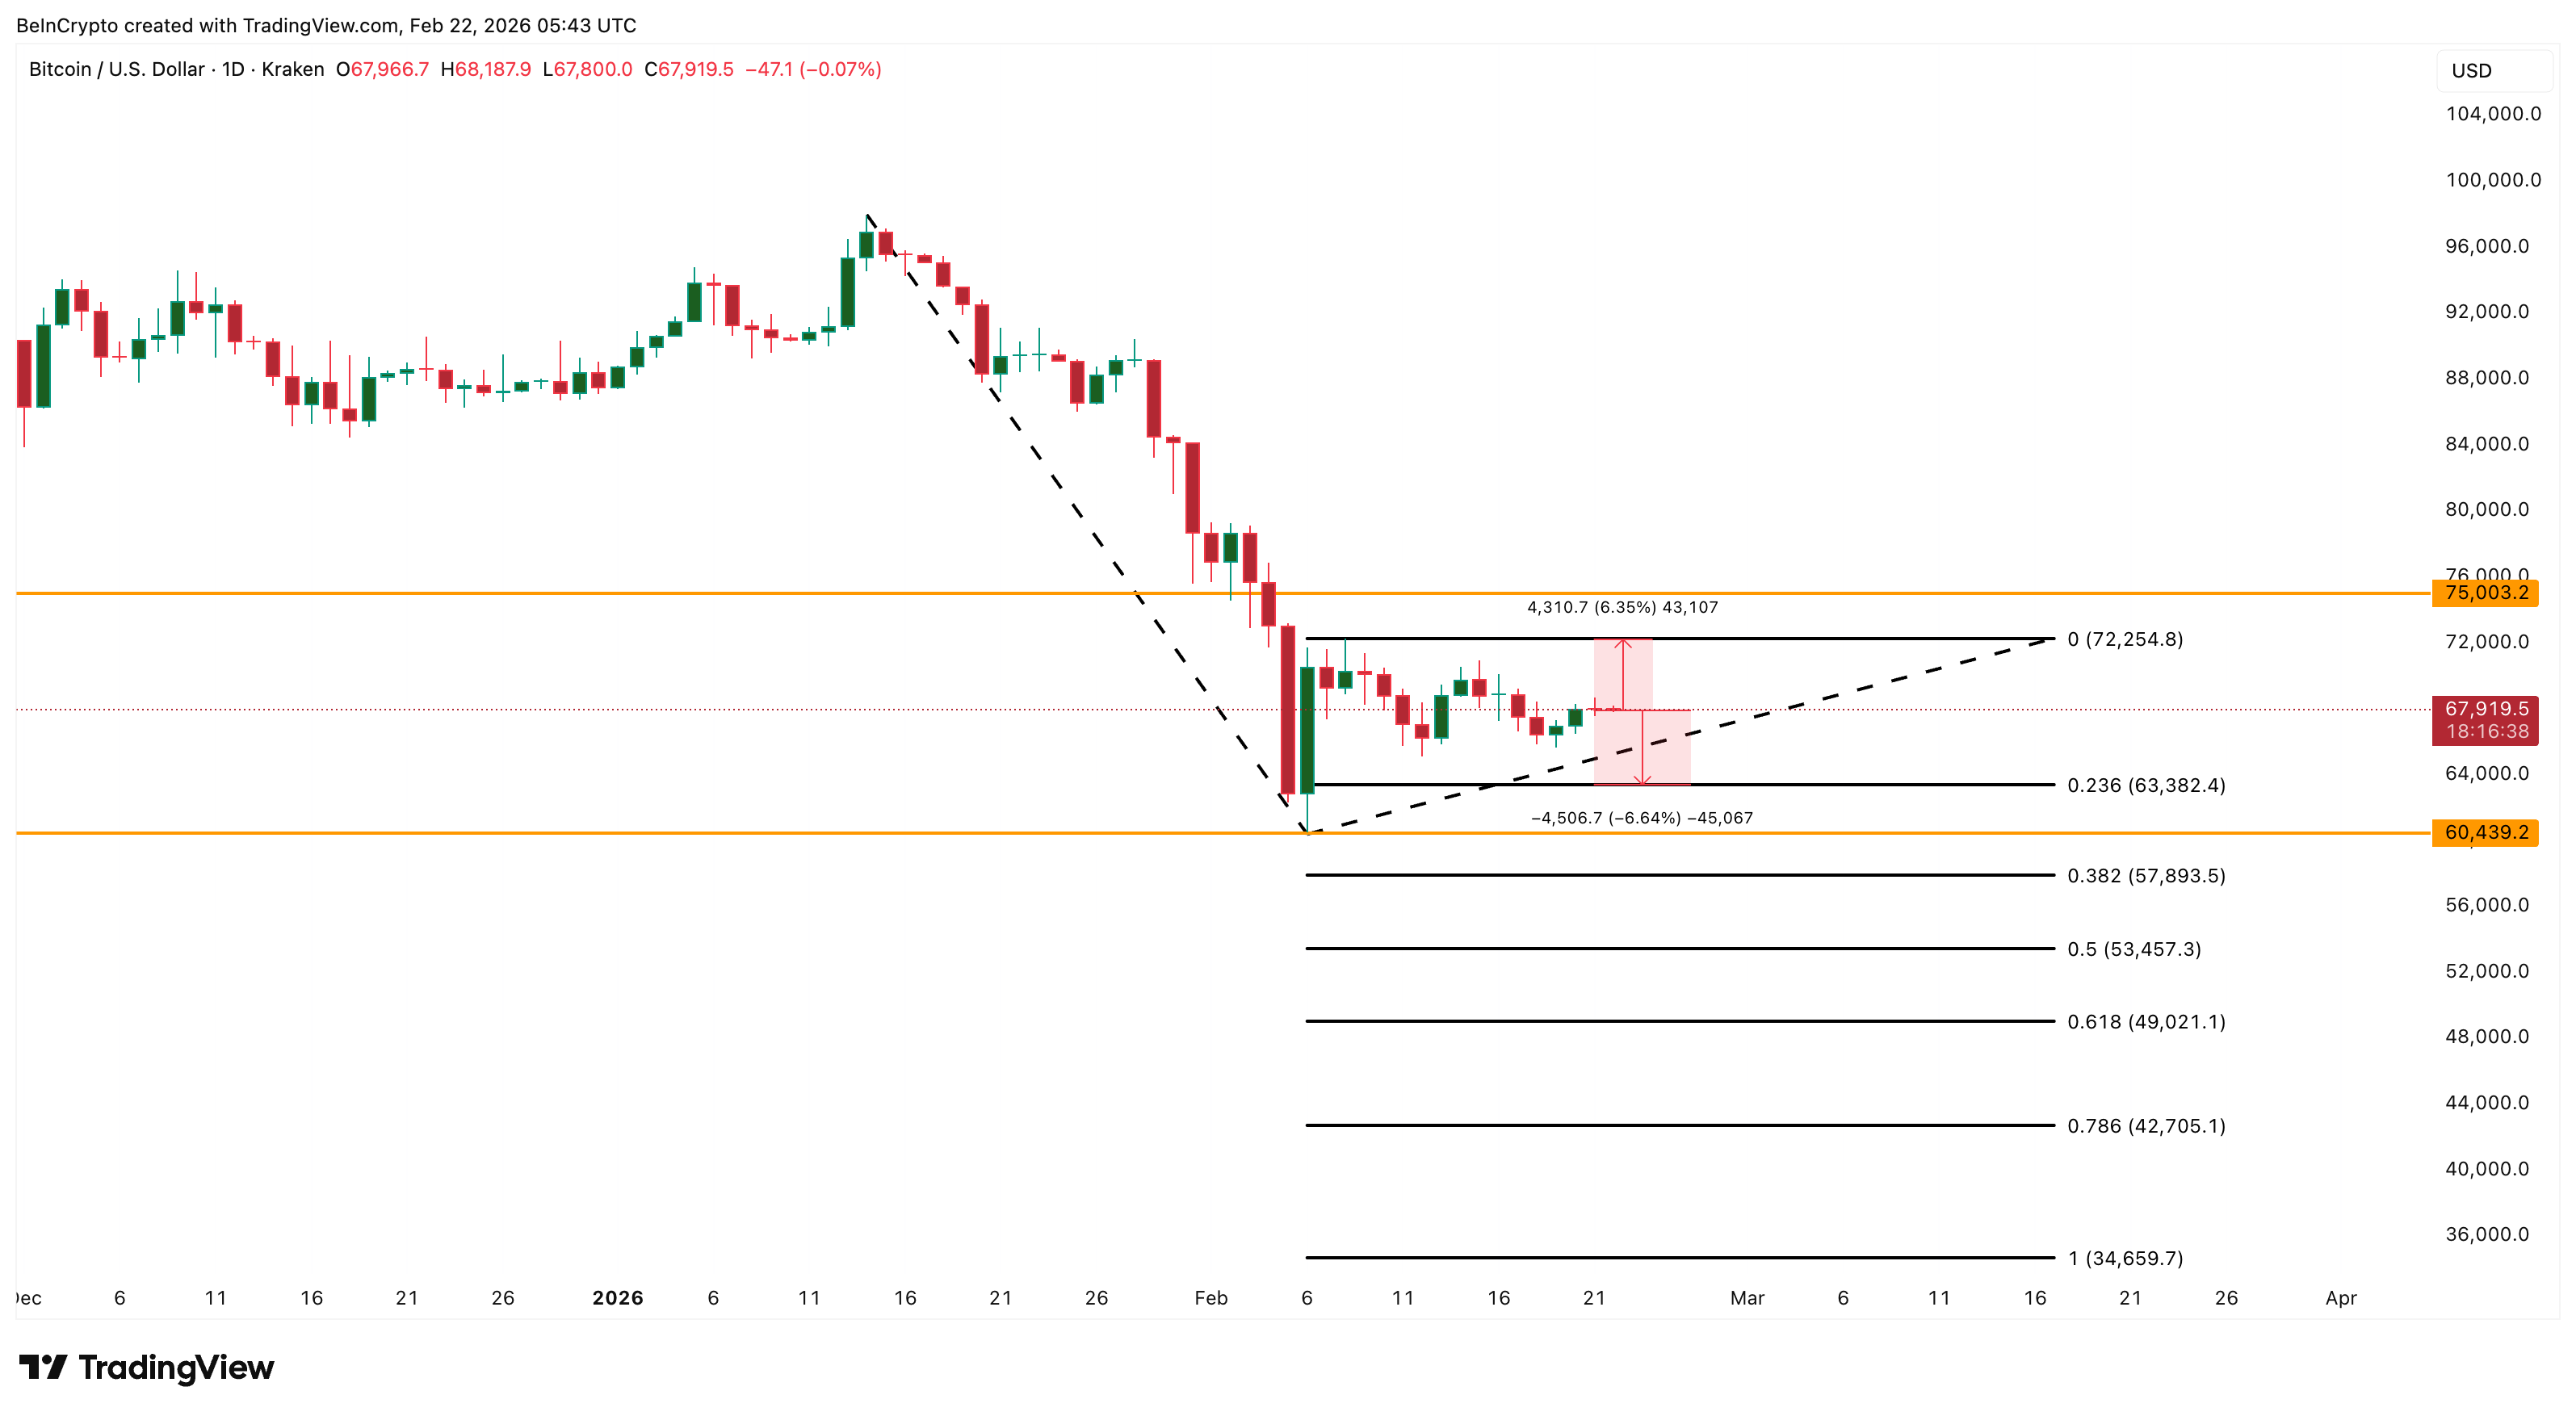
On the daily chart, Bitcoin formed a lower high between November 15 and February 16. This means price failed to fully recover during its latest rally attempt.
Meanwhile, the Relative Strength Index (RSI), which measures momentum strength, formed a higher high during the same period.
Want more token insights like this? Sign up for Editor Harsh Notariya’s Daily Crypto Newsletter here.
Because Bitcoin was already in a downtrend, this creates a hidden bearish divergence. This pattern usually signals continuation of the existing downtrend rather than a bullish reversal. It shows that even though momentum improved briefly, the broader selling pressure remains intact.
Since this divergence appeared, Bitcoin has already corrected nearly 6%. As long as this signal remains active, the probability of reaching the prediction market’s $75,000 target remains limited.
Long-Term Holders Have Slowed Selling, But Have Not Started Buying
Long-term holder activity helps explain why prediction markets still retain some optimism, even as risks increase. These investors may have held Bitcoin for more than 1 year. Their buying and selling patterns often determine whether Bitcoin enters a sustained rally or correction.
On February 5, long-term holders reduced their holdings by 244,919 BTC (30-day rolling change), a sign of extremely heavy selling. By February 21, this number improved to 81,019 BTC. This marks a roughly 67% reduction in selling pressure.
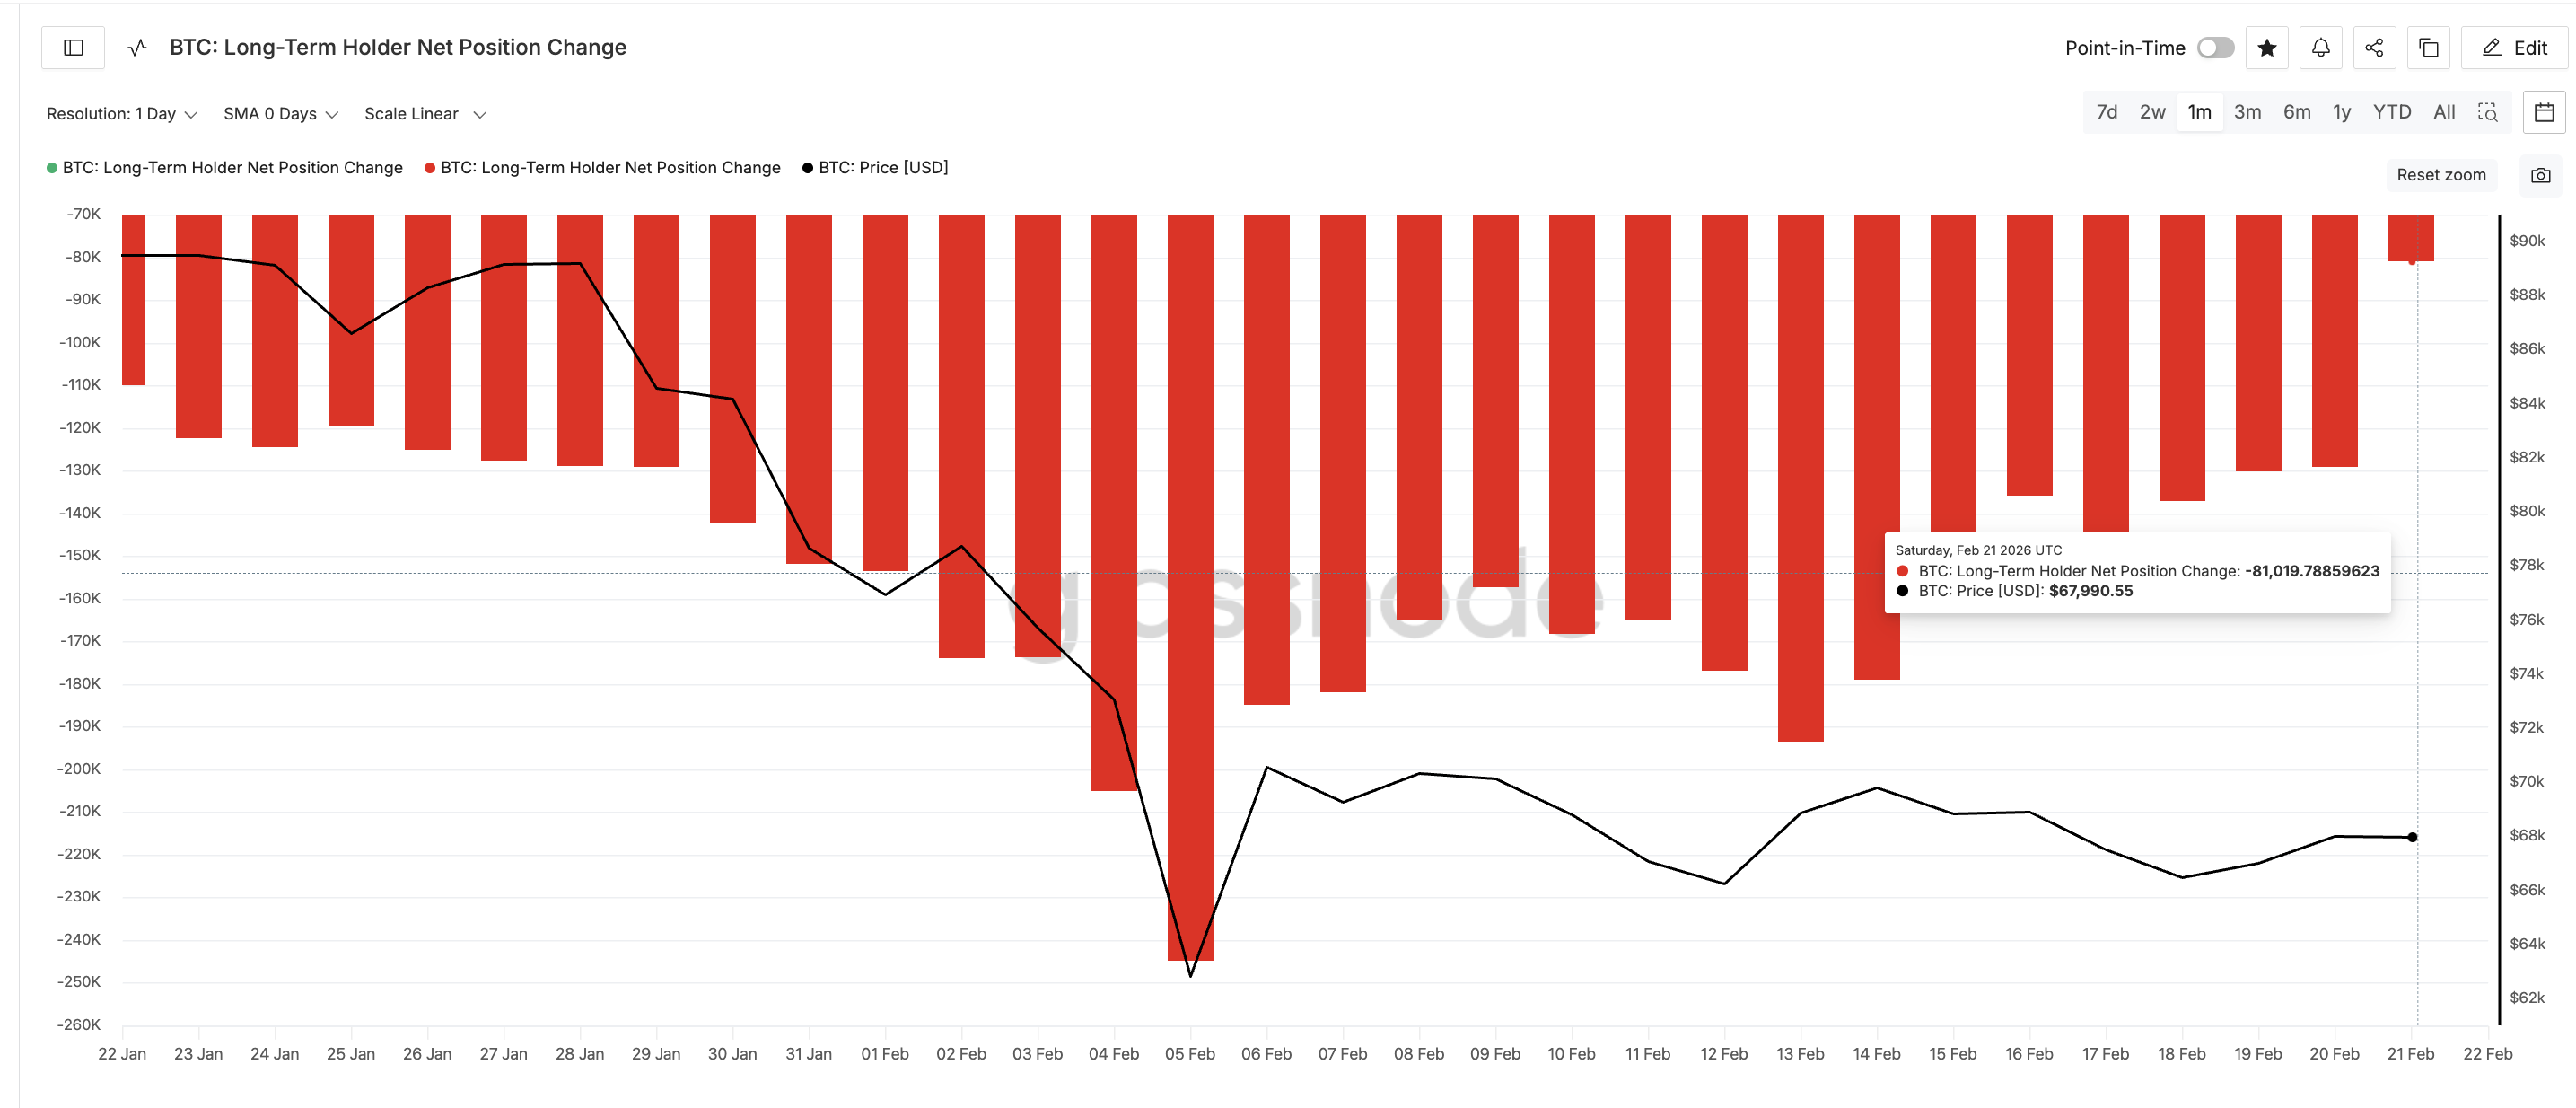
This sharp slowdown in selling helps stabilize Bitcoin’s price and explains why some traders still expect upside.
However, long-term holders are still net sellers overall. They have not yet transitioned into accumulation. Their activity has improved, but they are not yet providing the strong buying support needed to push Bitcoin toward new highs.
This creates a neutral balance. Bitcoin may avoid immediate collapse, but it also lacks the strength needed for a major breakout to push it close to $75,000.
Whale Behavior Is Split
Whale positioning further reflects uncertainty.
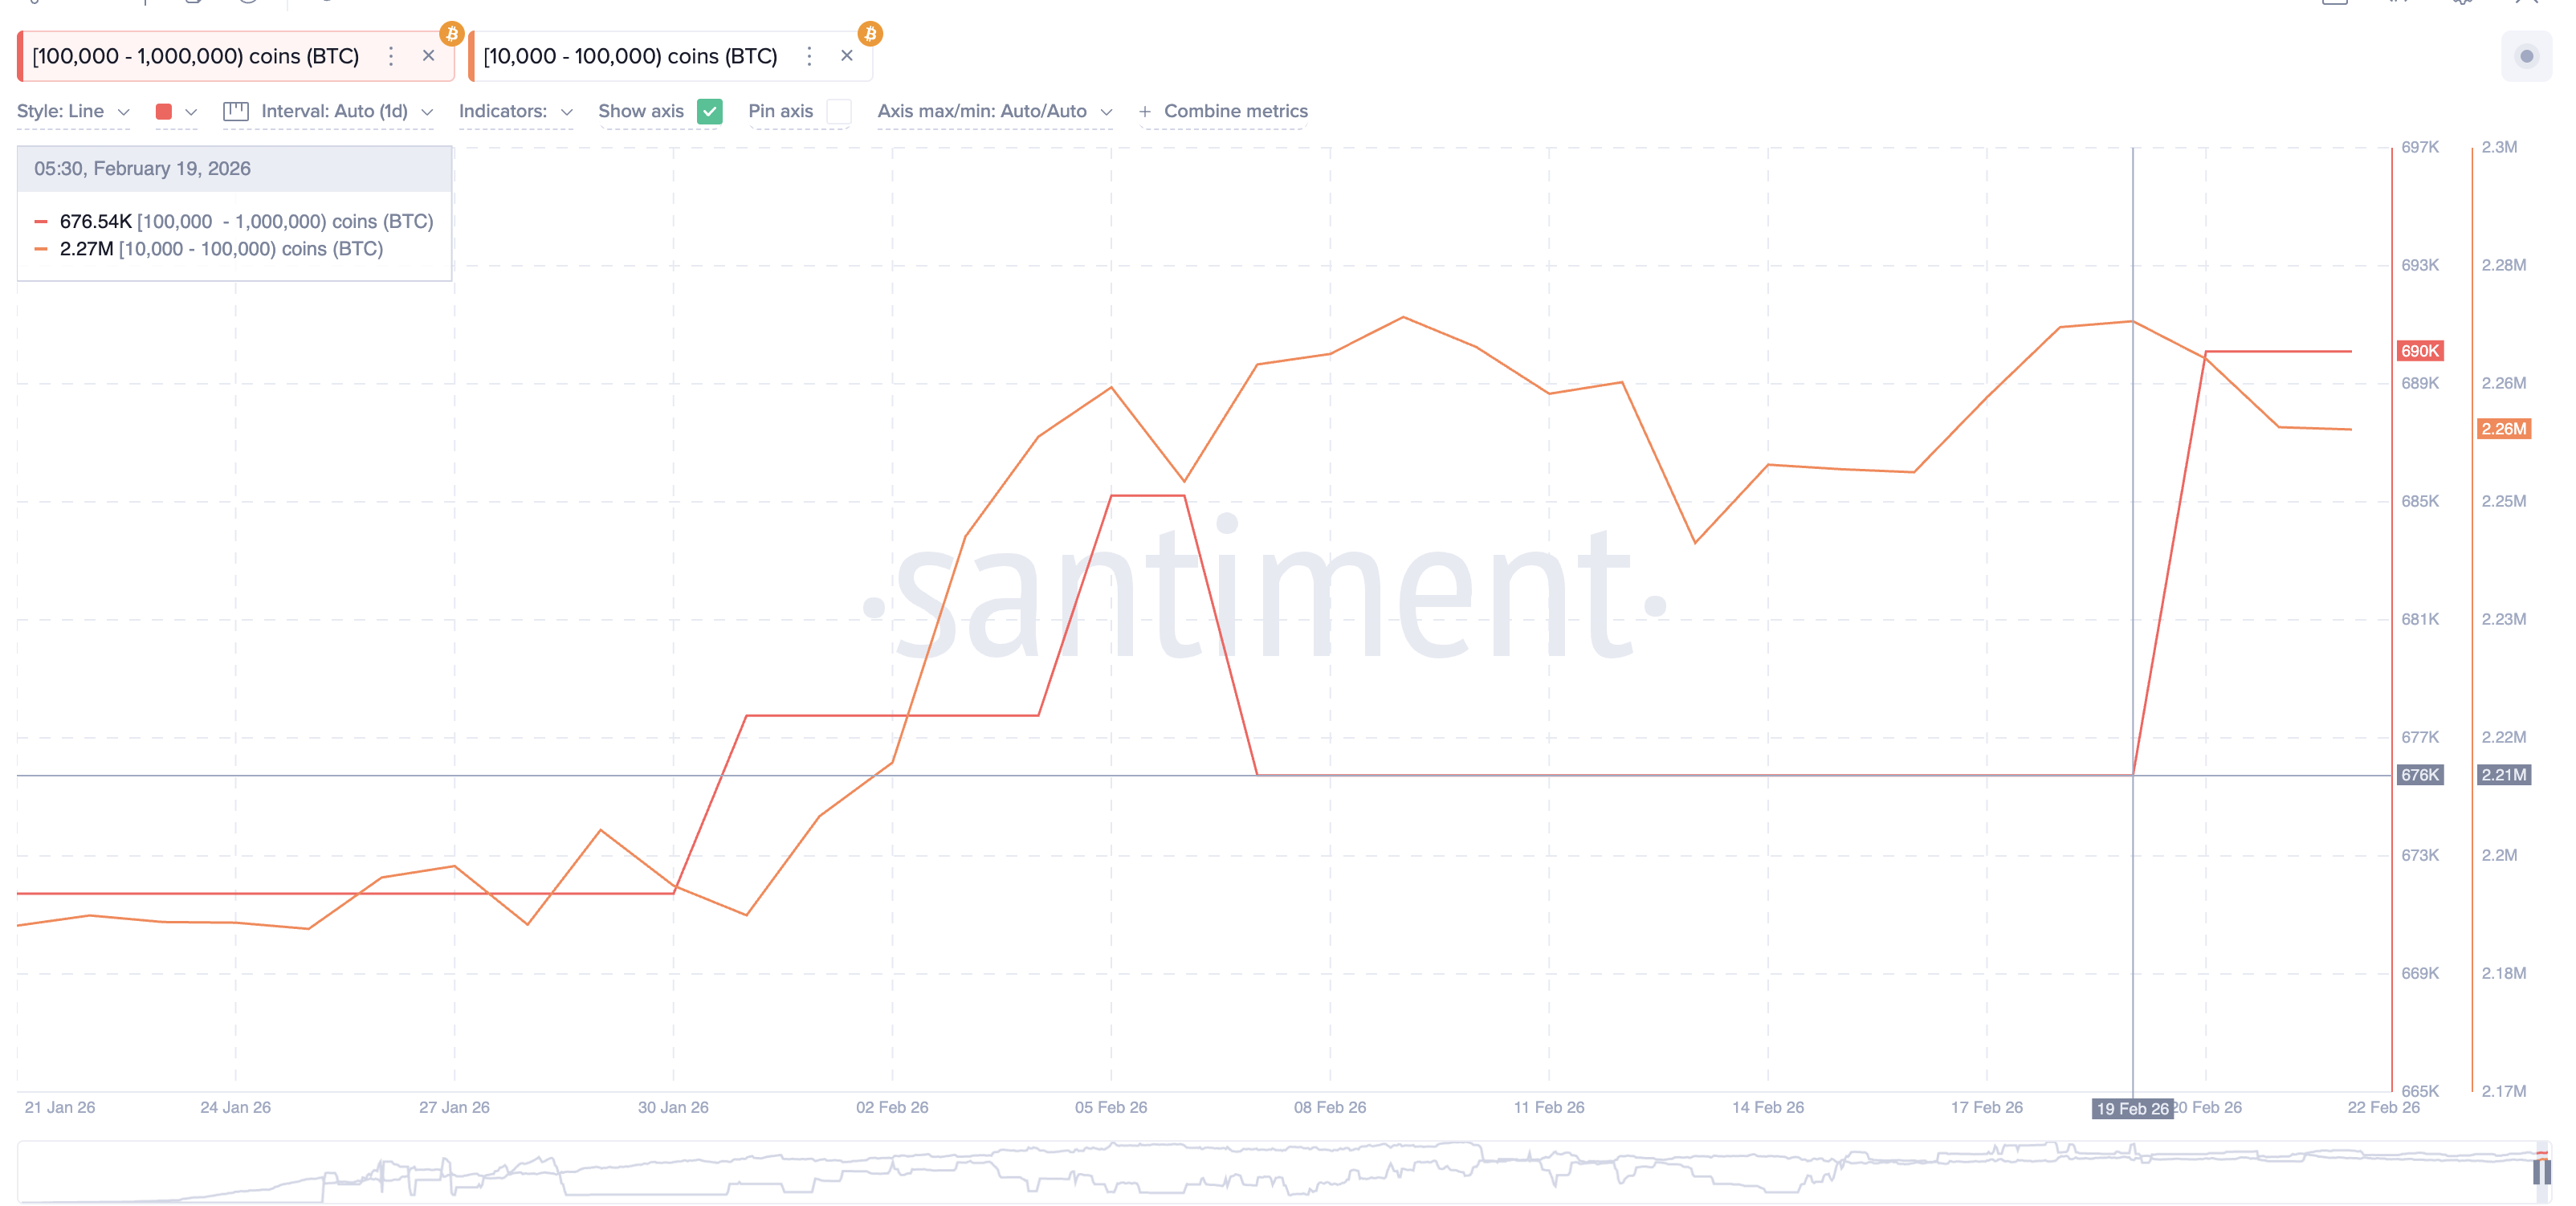
The largest Bitcoin whales, holding between 100,000 and 1 million BTC, increased their holdings from 676,540 BTC to 690,000 BTC. This represents an accumulation of about 13,460 BTC, signaling cautious buying.
However, smaller whales holding between 10,000 and 100,000 BTC reduced their holdings from 2.27 million BTC to 2.26 million BTC. This means roughly 10,000 BTC were sold during the same period.
This opposing behavior shows a lack of unified conviction, even though the net balance slightly tilts towards accumulation. Some whales are preparing for a rebound, while others remain defensive.
At the same time, cost basis distribution data reveals a major resistance cluster between $72,600 and $73,200. Around 149,000 BTC were accumulated in this range. These levels also appear clearly on the price chart as a major resistance zone just below $75,000.
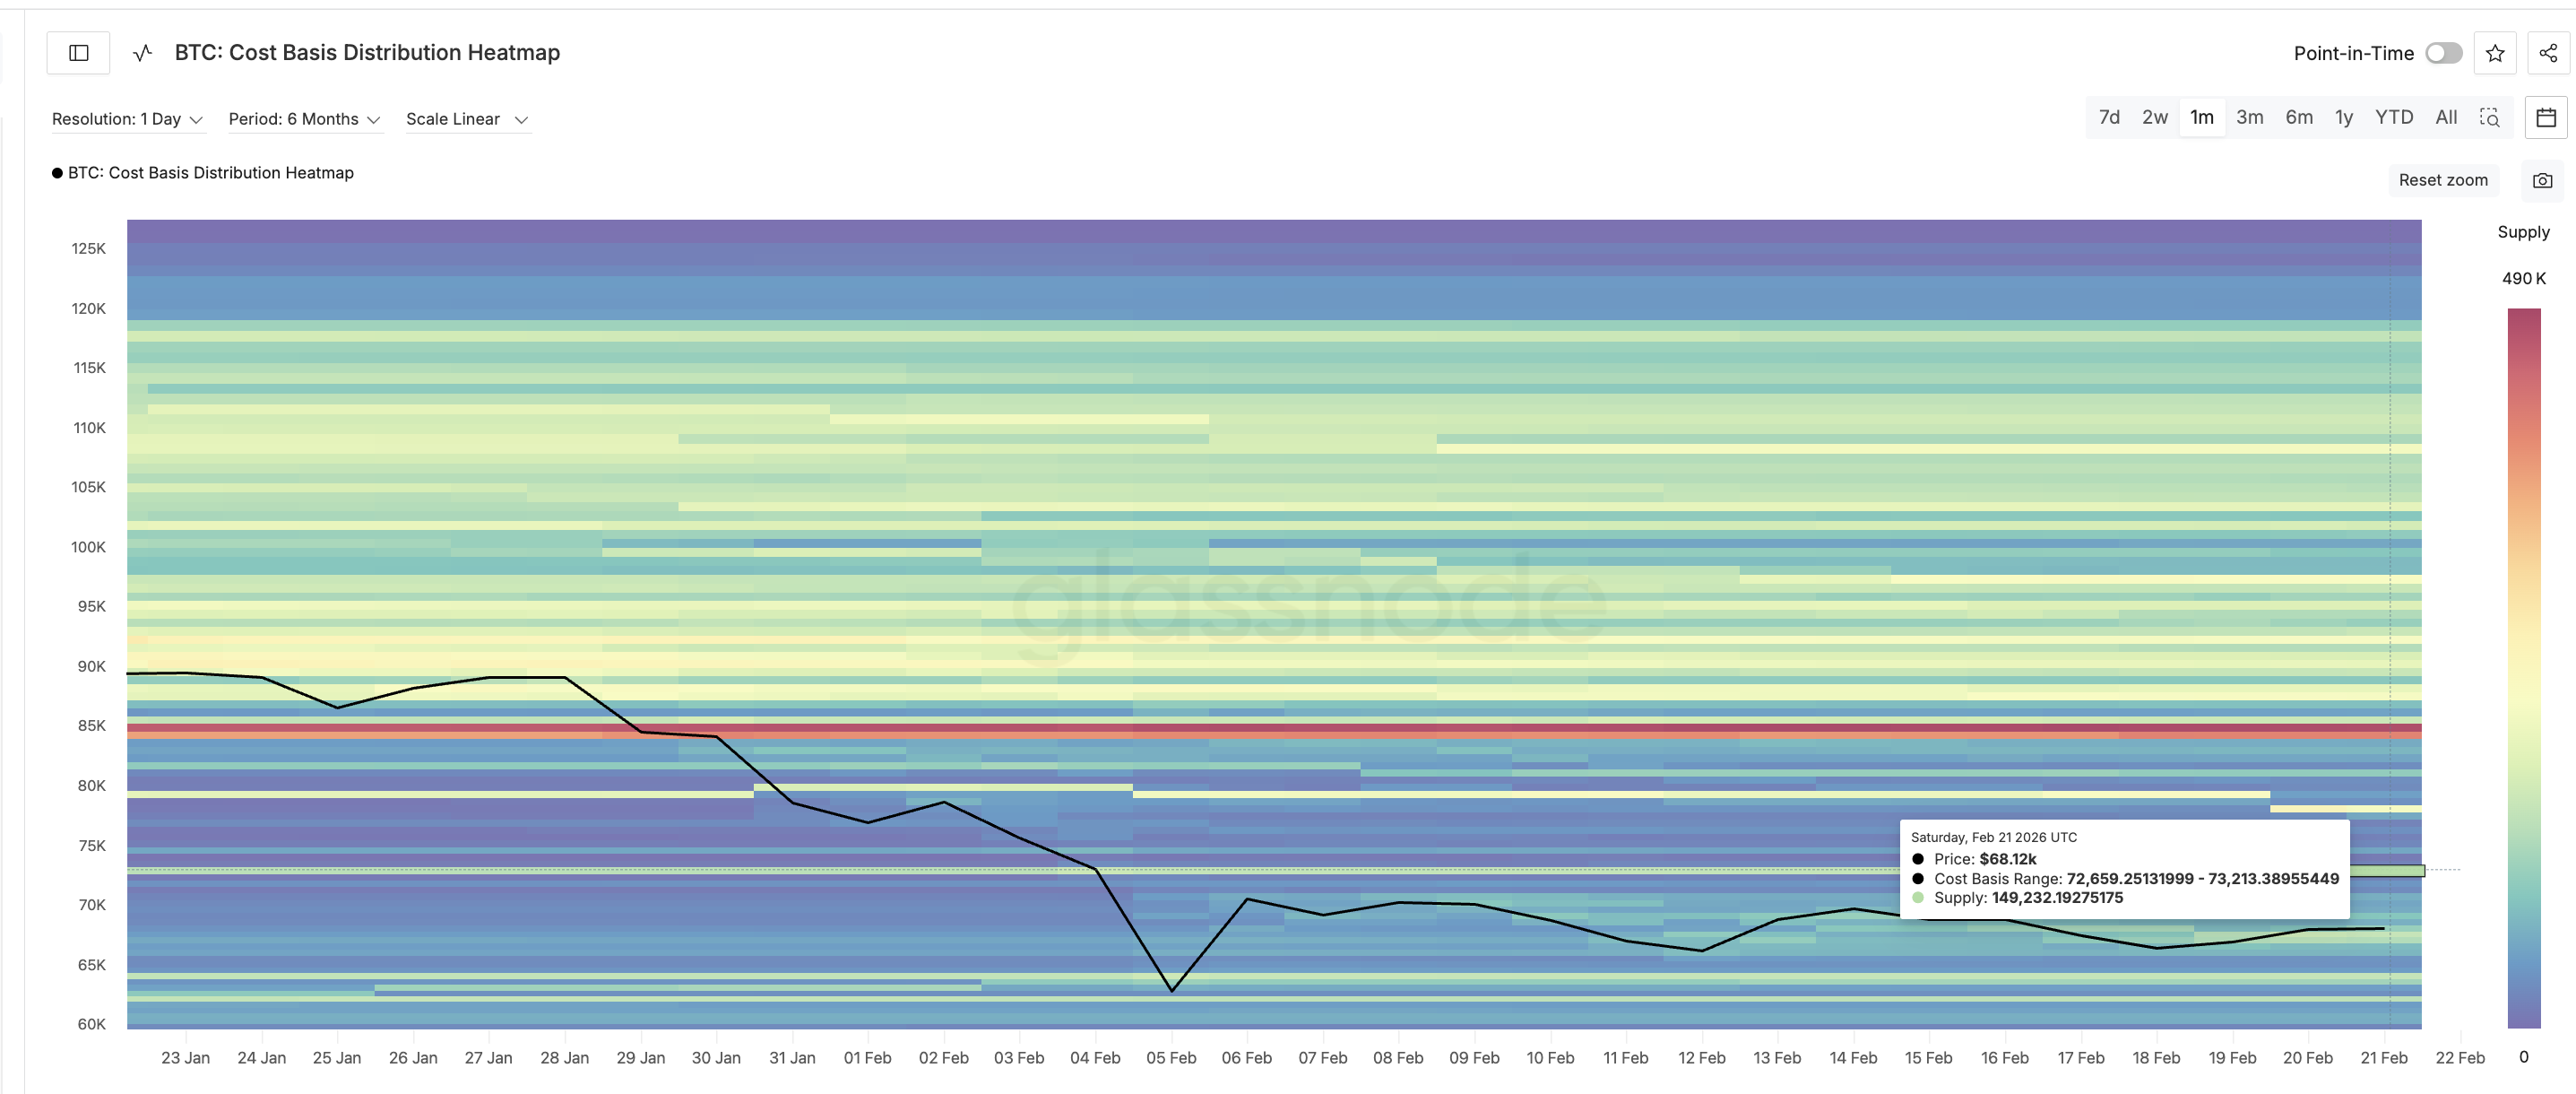
When Bitcoin approaches this area, many holders may sell to exit at breakeven. And the whale accumulation strength, as seen, isn’t strong enough to absorb the supply yet. This selling pressure creates a strong barrier that prediction markets may be underestimating.
Bitcoin Price Structure Shows BTC May Remain Trapped Between Key Levels
Bitcoin’s price structure closely aligns with these on-chain cost basis clusters.
To reach the $75,000 prediction target, Bitcoin must first break above $72,200. This level represents both technical resistance and is close to one of the largest cost basis clusters on the chart. Breaking this zone would require a rally of more than 6% from current levels.
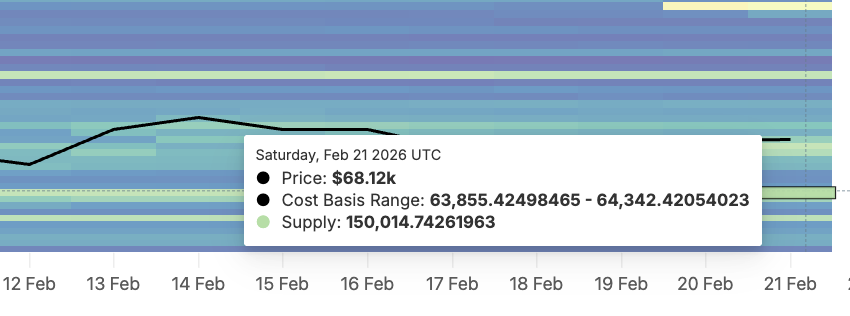
However, failure to break this resistance increases the likelihood of continued range-bound movement. On the downside, strong support exists between $64,300 and $63,800, where approximately 150,000 BTC were accumulated.
On the Bitcoin price chart, the key support level resembling the zone is $63,300, breaking which would also mean the supply cluster break. Breaking under $63,300 can make the $60,000 zone, the 12% probability bet on Polymarket, come to fruition.
As a result, Bitcoin is currently trapped between two major cost basis zones. Resistance near $72,200 limits upside, while support near $63,300 prevents immediate collapse.
This range-bound structure suggests that prediction markets may be overestimating the probability of a breakout toward $75,000 while underestimating the growing risk of continued consolidation or a correction.

The Bitcoin (BTC) network needs a “conservative” Bitcoin client node software implementation to preserve its monetary properties and strengthen network decentralization, according to Jimmy Song, co-founder of ProductionReady, a non-profit organization funding open source Bitcoin node software development and education.
The organization has a “bias” against significant code changes, unless there is “overwhelming” community support for the change, Song told Cointelegraph.
“The general principle is: if you’re not sure a change makes the money better, don’t make it,” he said.

ProductionReady expects to restore the 83-byte OP_Return data limit for arbitrary, non-monetary information in Bitcoin transactions, he said, adding that keeping node storage costs down by limiting arbitrary data is essential to network decentralization. He said:
“The more self-sovereign Bitcoin users are, the more decentralized and resilient the network becomes. That means keeping the cost of running a node low enough for ordinary people to do it.
“When storage and bandwidth requirements grow, fewer people verify for themselves, and the network centralizes by default. A conservative client takes that tradeoff seriously,” Song continued.
Maximizing nodes and making them accessible to the average user hardens the Bitcoin network, reducing the chances of cheating by submitting false transactions or a few actors colluding to centralize the network.

Related: 72% of subsea cables would need to fail to impact Bitcoin, study shows
Bitcoin Core 30 removes the OP_Return data limit, sparking major pushback
Node storage and onchain spam became hot-button topics in 2025 after Bitcoin Core developers unilaterally changed the 83-Byte data limit in Bitcoin Core version 30, the latest major upgrade to the reference implementation for Bitcoin node software.
The limit was changed to 100,000 bytes despite significant pushback from the Bitcoin community. For context, the proposal to change the limit received about 4 times as many downvotes as it did upvotes, according to the proposal’s GitHub pull request page.
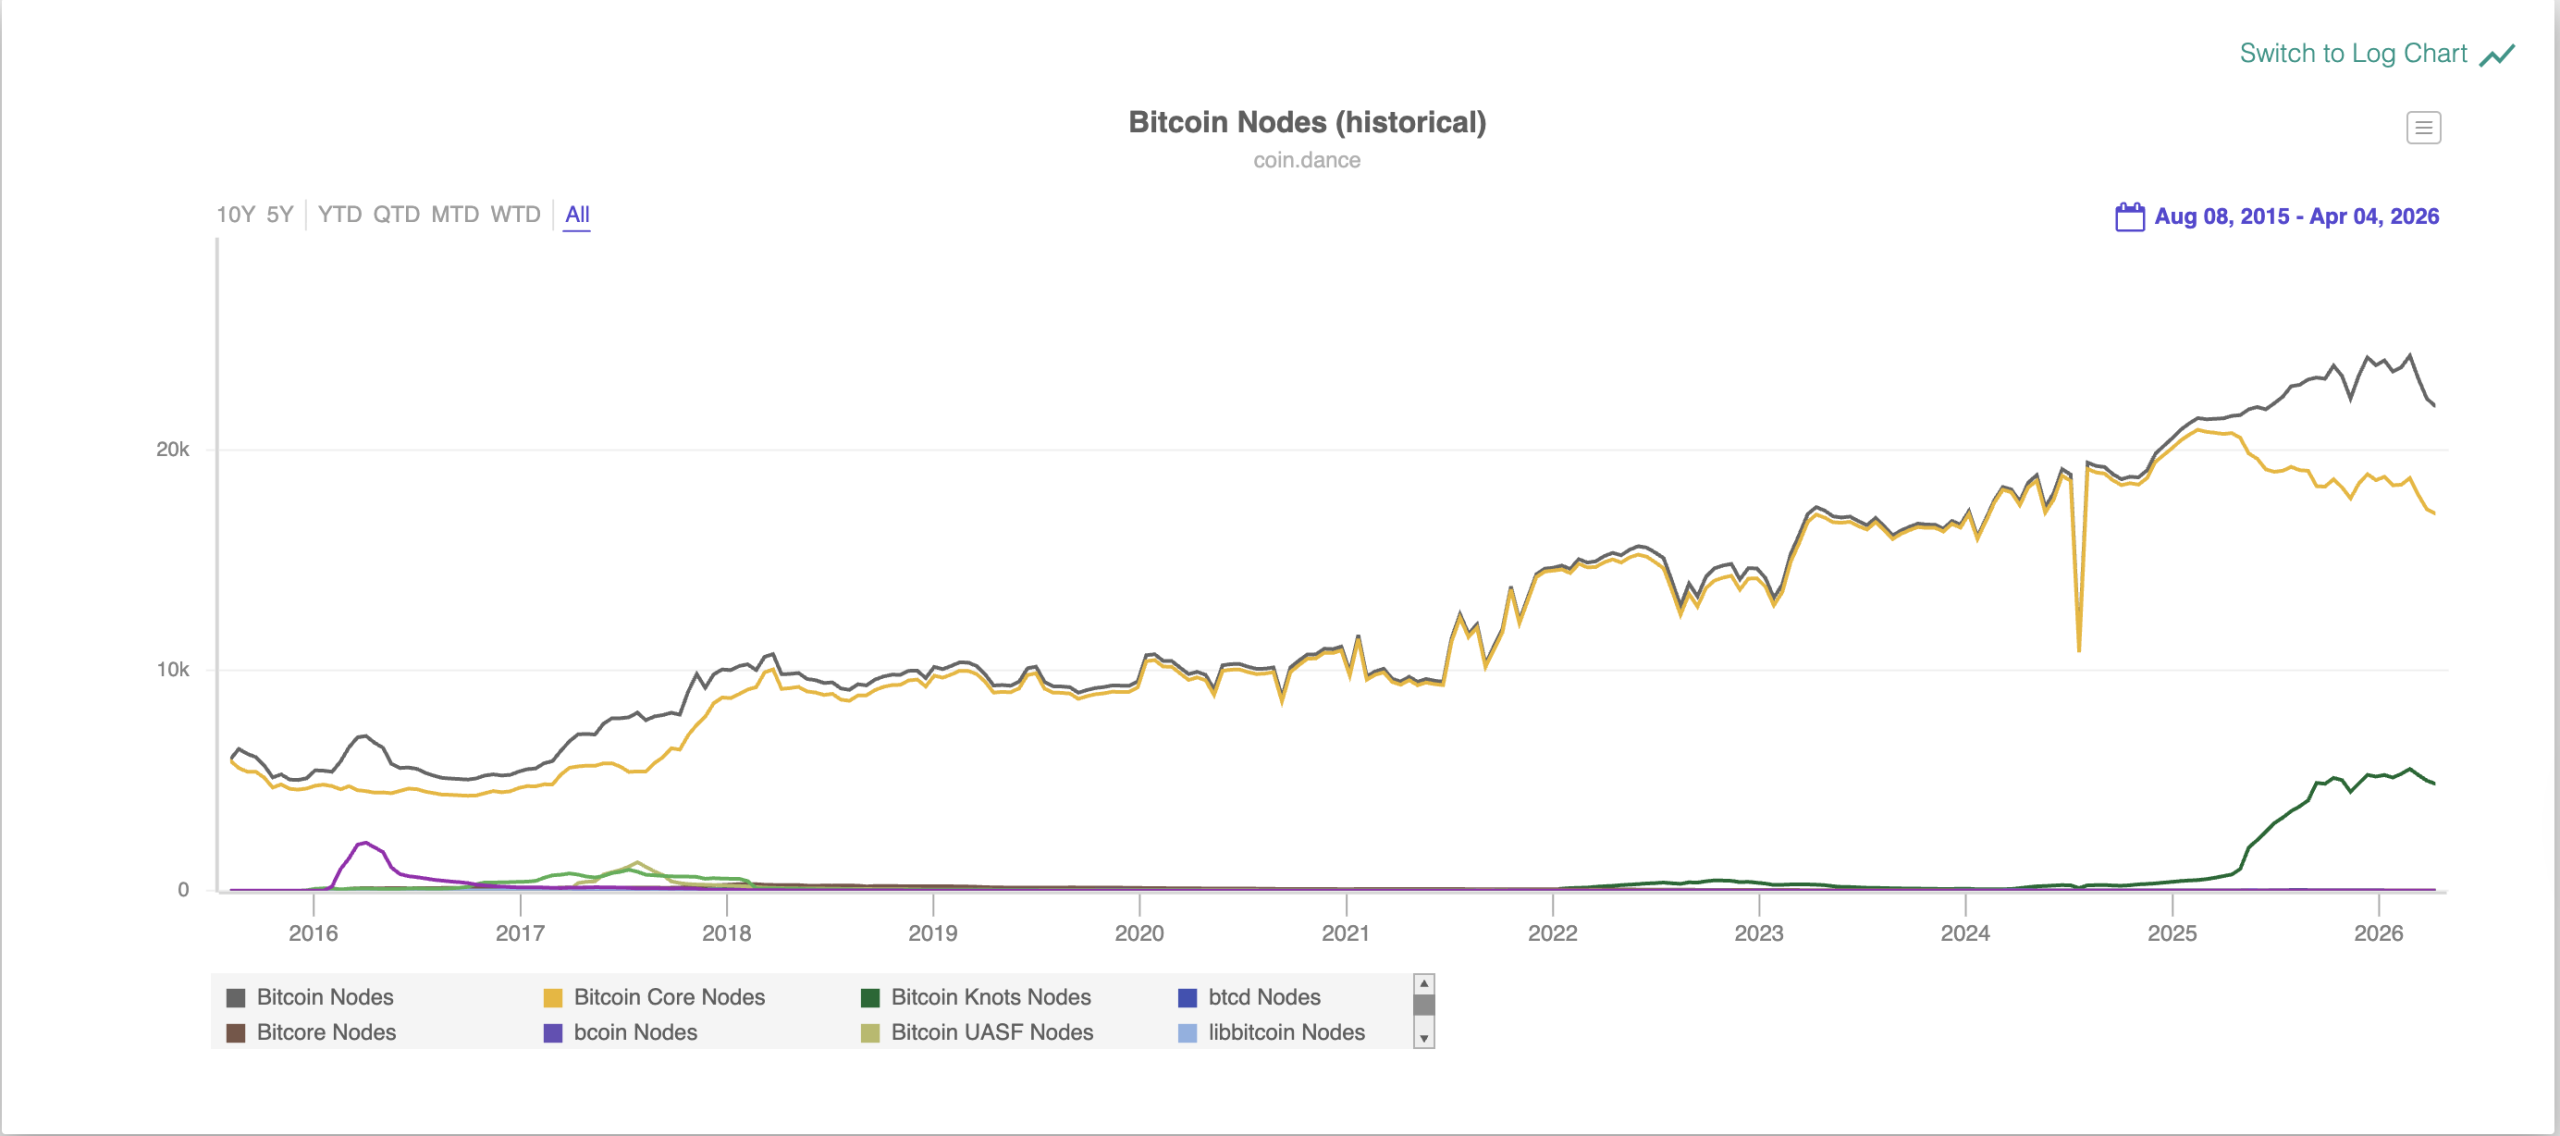
Bitcoin Core 30 went live in October 2025, triggering a historic surge in the number of Bitcoin nodes running Bitcoin Knots, an alternative implementation of the node client software.

There are 4,746 Bitcoin Knots nodes, representing over 21.7% of nodes on the network, according to Coin Dance.
Only about 1% of the network was running the Knots software in 2024 before the decision to remove the OP_Return function was announced.
Magazine: Bitcoin may face hard fork over any attempt to freeze Satoshi’s coins
Crypto World
XRP Price Prediction: Can XRP Price Ever Reach The $100 Dream ? While Pepeto Delivers the True 150x Entry
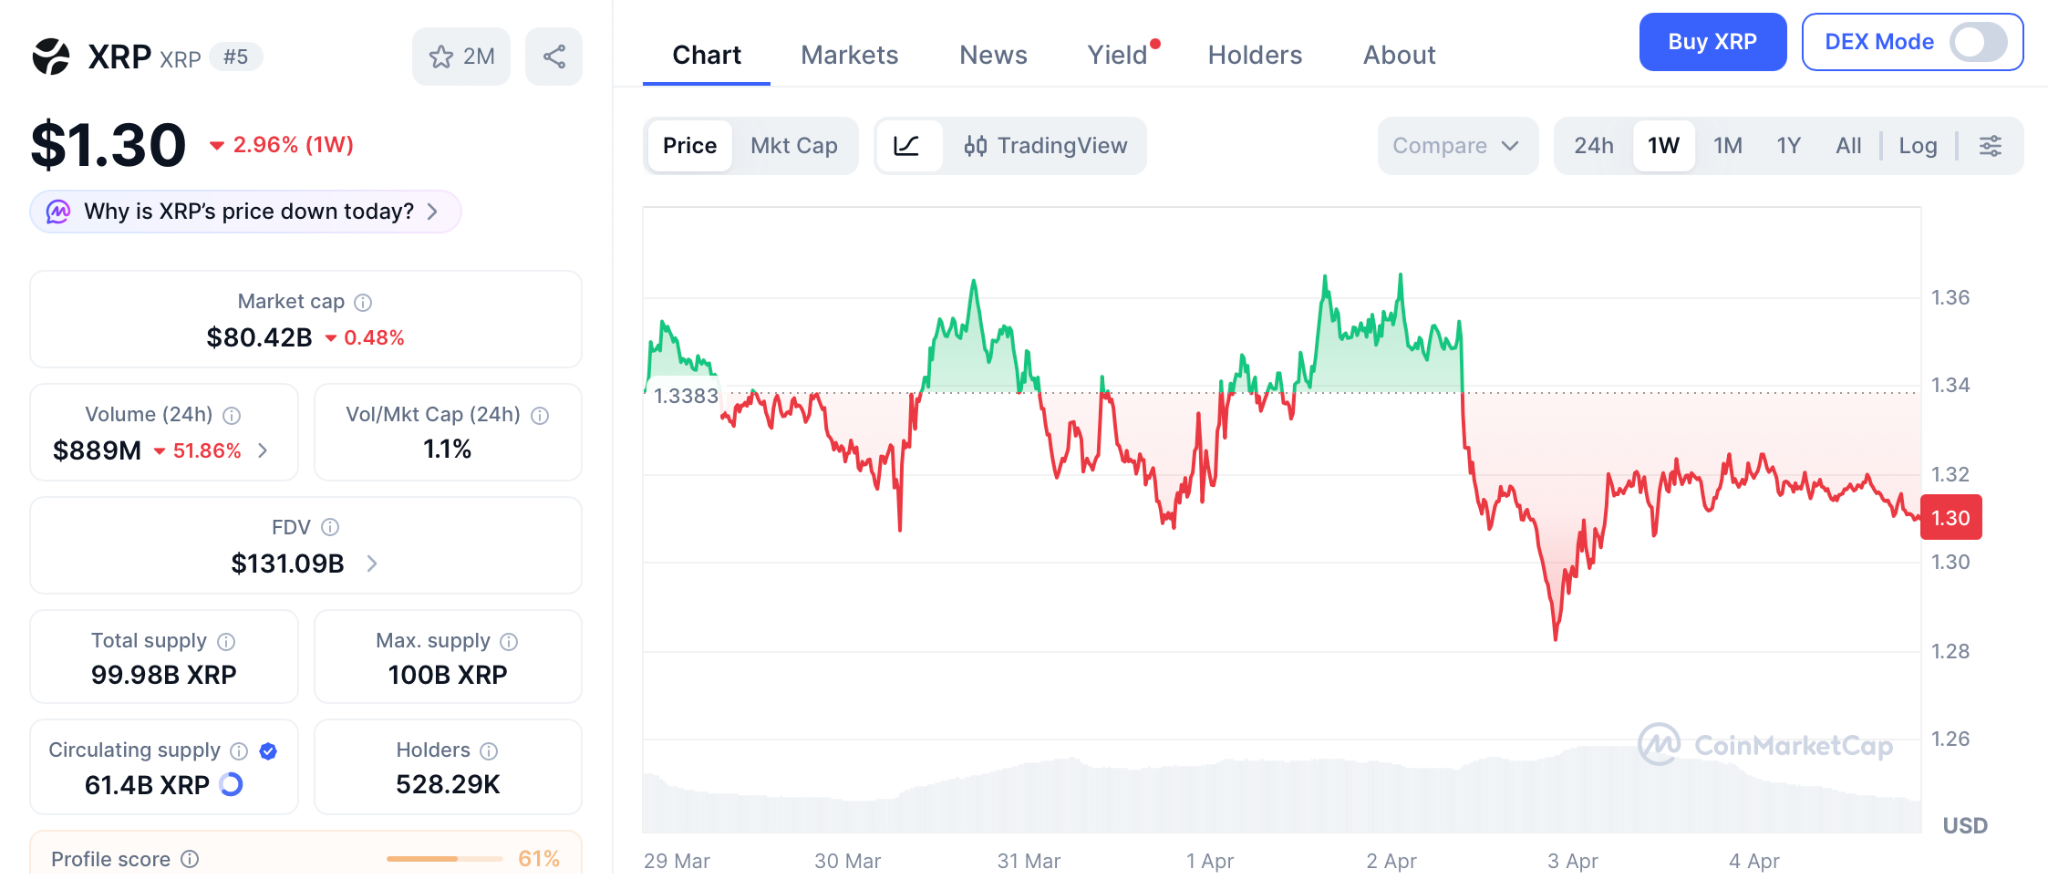
The xrp price prediction crowd has chased the $100 target for years. Goldman Sachs just revealed a $153.8 million position spread across four XRP ETFs, making it the largest institutional holder by a factor of six, according to 24/7 Wall St. The CLARITY Act faces its make-or-break Senate markup in late April, and if it passes, Standard Chartered projects $4 to $8 billion in fresh ETF inflows that could push XRP toward $3.50 to $6, according to Yahoo Finance.
Yet XRP sits at $1.30, and reaching $100 still demands a $5.7 trillion market cap, larger than the entire crypto market combined. While XRP holders wait for a target that math alone cannot justify, one presale built by the team behind a $7 billion token is offering 150x at a price most investors have never seen this low. This piece breaks down the xrp price prediction reality and where the return math actually lives.
Goldman Sachs Loads XRP ETFs as CLARITY Act Approaches Binary Vote
24/7 Wall St reported that Goldman Sachs holds $153.8 million across Bitwise, Franklin Templeton, Grayscale, and 21Shares XRP ETFs, while CoinMarketCap confirmed $11.4 billion in XRP left Binance on April 2, tightening exchange supply to multi-month lows. The partnership validates XRP’s institutional case, but a validated use case and a profitable entry from $1.30 remain entirely different calculations.
The XRP Price Prediction Ceiling vs the Pepeto Floor: Where Returns Actually Live
Pepeto: The Presale That Converts XRP’s Validation Into Actual Holder Wealth
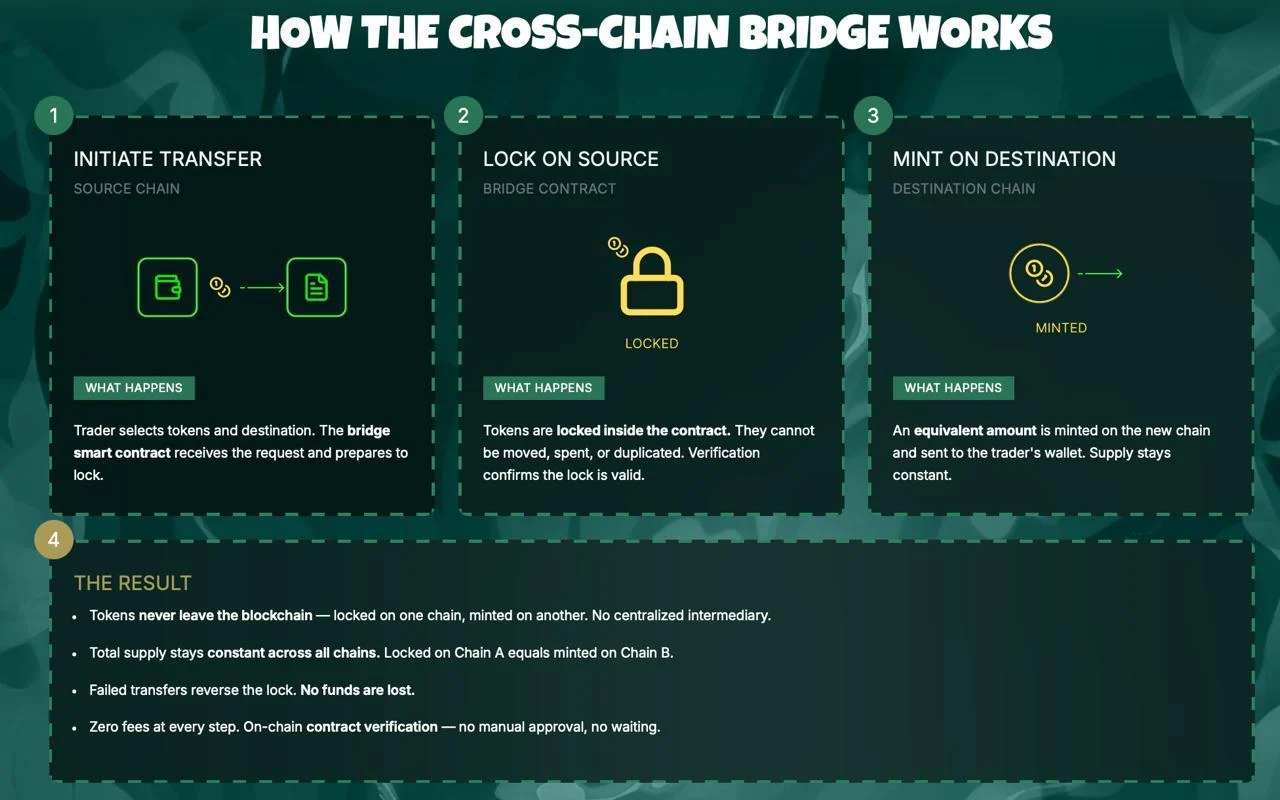
Finding a presale that combined meme token pricing with functional exchange infrastructure used to be nearly impossible. Most projects offered dashboards, chatbots, or lending tools that thousands of competitors already shipped. Pepeto changed the equation by delivering a full exchange ecosystem with zero-fee trading, a cross-chain bridge spanning Ethereum, BNB Chain, and Solana, and 188% APY staking that compounds daily.
These tools are not placeholder features on a roadmap. The exchange processes volume across three blockchains simultaneously, and every component runs on smart contracts verified through a SolidProof audit. That foundation keeps Pepeto in structural demand regardless of whether the market trends up or down, because utility drives volume in every condition.
At $0.0000001862, a $1,000 entry secures billions of tokens. The original Pepe shares the same 420 trillion total supply and peaked at an $11 billion market cap with zero products behind it. Reaching that valuation turns a $1,000 position into approximately $150,000, a 150x return that analysts treat as conservative because Pepeto has the audited exchange, the cross-chain bridge, and the working infrastructure Pepe never built. The cofounder who took Pepe from zero to $7 billion architects this project, and a former Binance executive shapes the listing strategy.
With the Binance listing approaching, these projections mirror BNB’s trajectory from $0.15 at ICO to over $700 once real trading activity powered the token. Staking at 188% APY grows every position daily before listing day. The wealth that changed lives in every prior cycle was captured by wallets that entered infrastructure presales while others hesitated, and Pepeto’s confirmed Binance listing will permanently eliminate this entry along with the 150x math attached to it.
XRP Price Prediction: Why $100 Demands More Capital Than Crypto Has Ever Seen
XRP trades at $1.30 according to CoinMarketCap with an $80 billion market cap. Hitting $100 would require a valuation above $5.7 trillion, exceeding the entire crypto market’s current $2.38 trillion capitalization by more than two times. The bullish xrp price prediction from ChatGPT targets $3.50 to $6 if the CLARITY Act passes in late April, delivering 160% to 340% from current levels, according to 24/7 Wall St.
Even reaching $10 demands a $570 billion valuation that rivals Ethereum at its historic peak. The xrp price prediction is constructive long term, but the math confirms the largest percentage returns already happened for holders who entered under $0.20. From $1.30, the upside is measured in percentages while Pepeto measures it in multiples.
Conclusion
Goldman Sachs loaded $153.8 million into XRP ETFs and the token barely moved. That is the ceiling of an $80 billion asset. Pepeto sits at $0.0000001862 with a SolidProof audited exchange, 188% APY staking, and a Binance listing approaching.
A $1,000 entry targets $150,000 at a fraction of what Pepe achieved with nothing. XRP needs $5.7 trillion for $100. Pepeto needs a sliver of what Pepe reached for 150x. The gap is not close. Visit the Pepeto official website and secure the entry that the xrp price prediction will never offer you at this stage.
Click To Visit Pepeto Website To Enter The Presale

FAQs
Is $100 a realistic target for the xrp price prediction?
Reaching $100 requires a $5.7 trillion market cap. Most analysts see $3.50 to $6 as realistic if the CLARITY Act passes.
Why does Pepeto offer stronger return math than XRP from here?
At $0.0000001862 with 420 trillion supply, matching Pepe’s ATH delivers 150x, a multiple XRP at $80 billion cannot produce.
What impact does Goldman Sachs buying XRP ETFs have on price?
Goldman holds $153.8M in XRP ETFs, confirming institutional interest, but XRP remains rangebound until the CLARITY Act advances.
Disclaimer: This is a Press Release provided by a third party who is responsible for the content. Please conduct your own research before taking any action based on the content.

Bitcoin has struggled to reclaim its recent highs near $75,000, but a move up to $72,000 could trigger a substantial squeeze in the futures market, potentially flushing billions in short bets. With macro headwinds from geopolitics and a fragile risk appetite shaping investor flow, analysts say the next price move could reveal how much of the current downside positioning is leaning on leverage rather than a fundamental shift in demand.
According to data provider Coinglass, a climb to $72,000 from around $67,100 could unleash roughly $2.5 billion in liquidations of Bitcoin short positions. That magnitude underscores how quickly a price rally can reverse a crowded bearish setup, even as bears maintain their leverage-heavy stance amid ongoing macro uncertainty.
Key takeaways
- Liquidation risk at $72,000: Coinglass estimates approximately $2.5 billion in Bitcoin futures short liquidations if price advances to $72,000 from current levels.
- Bear pressure from miners and equities: Miner dispositions, notably MARA selling 15,133 BTC in late March to de-leverage and pivot to AI compute, add to downside momentum alongside a weaker S&P 500.
- Funding signals a bear tilt in leverage: Negative funding rates in BTC perpetual futures point to tepid demand for bullish leverage and potential vulnerability to squeeze-driven moves.
- ETF inflows could re-accelerate a rally: Inflows into U.S. listed BTC ETFs have shown bursts of interest, with around $1.5 billion net inflows over two weeks during a prior period, suggesting catalysts exist for renewed upside if demand returns.
- Geopolitics and macro data as swing factors: Oil’s rally in the wake of the Iran conflict and broader recession concerns shape liquidity and risk appetite, making a break above key levels a noteworthy signal for traders and investors alike.
Macro drivers, miner behavior, and the price framework
The immediate backdrop is fragile: oil prices have surged as geopolitical tensions intensify, elevating logistic costs and pressuring consumer demand. At the same time, equities have shown signs of strain; after peaking near the end of January, the broad market faced a notable drawdown through March, stoking concerns about a potential downturn in growth signals and central-bank policy space.
Bitcoin’s price action has been tethered to these macro currents even as mining dynamics remain a focal point for downside pressure. MARA Holdings, a publicly traded Bitcoin miner, disclosed on March 26 that it liquidated a sizable portion of its Bitcoin holdings—selling 15,133 BTC to reduce debt exposure and reallocate capital toward AI computing. The move underscores how mining profitability and balance-sheet management can feed into broader market sentiment during risk-off periods.
Against this backdrop, the S&P 500’s wobble and the resilience (or lack thereof) of alternative risk assets influence whether BTC can extend a rally. The market’s nerves around economic resilience and central-bank policy endure, with traders pricing in a high probability that the Federal Reserve will hold rates steady in the near term, while maintaining a cautious stance on future tightening or easing. The latest odds from market-implied rate expectations reflect a complex calculus where inflation persistence and growth concerns coexist with policy fatigue.
Liquidity conditions in the futures market add another layer. Bitcoin perpetual futures have shown negative funding rates, a sign that the current demand for long leverage is limited relative to the supply of capital seeking hedges or short exposure. In practical terms, negative funding rates can complicate the path for bulls, especially if liquidity dries up or volatility spikes higher on headlines.
Reflation catalysts: ETF inflows and potential upside triggers
One potential pathway for renewed upside is the return of institutional demand via exchange-traded products. Earlier episodes showed notable inflows into U.S.-listed Bitcoin ETFs, with data tracking net flows hitting material levels over a two-week window. If ETF demand resumes, it could provide an additional incentive for price discovery and help clear the overhead supply that has weighed on BTC around the $70,000–$75,000 zone.
The market has also watched for the resilience of external demand factors that once propelled rapid gains. A strong ETF inflow narrative paired with favorable macro signals could catalyze a broader move, potentially helping Bitcoin reclaim the $72,000 level and set the stage for a deeper test of the prior highs.
Investor attention remains anchored to the balance between macro risks and the crypto market’s own internal dynamics. The market has historically shown that even in the absence of a perfect macro backdrop, a combination of short squeezes, inflows, and stabilizing macro data can kindle a meaningful move higher. The next phase may hinge on whether ETF demand re-accelerates or if macro pressures reassert themselves.
What to watch next
Looking ahead, traders will be watching for any shift in the Iran-related geopolitics, changes in oil pricing, and any new ETF inflows that could re-energize demand. If BTC can clear the $72,000 hurdle with sustained activity, the ensuing price action could attract fresh risk-taking, particularly from funds that have been sidetracked by volatility and funding-rate dynamics. Conversely, persistent macro weakness or renewed risk-off sentiment could prolong the current range or push prices lower, especially if miners continue to adjust balance sheets to manage debt pressures.
For investors and traders, the key takeaway is that the next few weeks may reveal whether current downside risk has been priced in or if a tactical squeeze can unlock a broader rally. Given Bitcoin’s current position around 47% below its all-time high, a decisive move above $72,000 would carry outsized implications for market sentiment, liquidity cycles, and the setup for a possible spring or early-summer bull run.
Readers should stay alert to ETF flow updates, changes in leveraged positioning, and any headline-driven shifts in risk appetite, as these factors tend to precede more substantial moves in the Bitcoin market.

Disclosure: This article does not represent investment advice. The content and materials featured on this page are for educational purposes only.
BlockDAG stands out among the top crypto gainers with a limited $0.000022 entry price, as the Pippin crypto price drops and the Dogecoin price prediction remains uncertain.
Sentiment across crypto sits at extreme fear right now, with the Fear & Greed Index barely scraping double digits and altcoins absorbing the worst of it. Pippin is a clear example: whale exits hammered the price over 10% in 24 hours, volume dried up, and key support near $0.0427 is now holding by a thread. Dogecoin is in a similar holding pattern, stuck inside a descending triangle after a near-30% slide since February.

Neither coin is broken, but neither is giving traders much reason to feel confident right now. That’s actually the context that makes BlockDAG (BDAG) worth slowing down on. Priority access at $0.000022 closes April 8. CoinMarketCap already shows $0.40. That’s a 39,900% difference. Global listings on BitMart, Coinstore, and P2B open the same day, bringing real exchange exposure. Analysts called $0.30 to $0.40 months ago. That range already happened. Now $0.70 is the number people are watching.
Pippin Plummets 10% Amid Whale Sell-Off
Pippin (PIPPIN), a Solana-based memecoin, has dropped over 10% in the past 24 hours, driven by a whale sell-off and growing bearish sentiment among traders. On March 29, PIPPIN fell 10.52% to $0.0512, while trading volume slid 18% to $40.20 million, reflecting reduced market interest. Analytics from Nansen showed whales cut holdings by 25%, even as the top 100 wallets slightly increased theirs.
Major players, including Solana co-founder Raj Gokal, reportedly rotated into PUNCH, signaling weakening momentum. The Pippin crypto price currently trades near key support at $0.0427, consolidating between $0.047 and $0.0599. If support holds, recovery is possible, but a break could trigger sharper declines.
Overall, short-term bearish pressure continues, and the Pippin crypto price remains volatile, with bulls struggling. Traders are eyeing $0.0467 and $0.0605 for key activity, shaping the Pippin crypto price outlook.
Dogecoin Faces Critical Support as Market Awaits Next Move
The DOGE price is at a critical juncture as the chart compresses within a descending triangle, with highs dropping while support near $0.0886 holds. Since mid-February, DOGE has fallen almost 30%, from $0.1280 to $0.0905, putting pressure on this key level. Analysts note that if support holds, a bounce toward $0.1050 is possible, but a break could drive prices down to $0.0820.
Historical cycles suggest DOGE has repeated accumulation and breakout phases, with prior gains of 190% and 480%. This has traders watching closely. Short-term momentum is mixed, making the Dogecoin price prediction uncertain. Current conditions suggest that Dogecoin price prediction hinges on reclaiming higher ranges, and the next decisive move could shape the broader trend. Overall, the Dogecoin price prediction remains volatile but watchful.
BlockDAG Unveils 85x Price Jump Chance
BlockDAG has emerged as one of the top crypto gainers this year thanks to an exceptional rise in price and a limited-time priority access offer. The current priority access at $0.000022 remains available but only until April 8 which can guarantee at least 85x price jumps as compared to BDAG lowest price on the open market, while today’s CoinMarketCap price reached $0.4, representing a 39,900% increase from Stage 1 and 700% above the listing price.
This massive gap between the entry price and the current market price highlights an opportunity few investors ever encounter. The three-month head start before community deposits open in June allows early participants to secure positions far below market levels.

Global trading opens on April 8, with listings across BitMart, Coinstore, and P2B, exposing BlockDAG to millions of traders worldwide. The combination of limited priority access and broad exchange exposure has accelerated interest and amplified the sense of urgency.
Market analysts had projected the $0.3–$0.4 range, which has already been achieved, and now attention has shifted to $1 prediction for the near future. For those holding priority access at $0.000022, the ROI potential is nearly unimaginable, reaching hundreds of thousands of percent if prices move as predicted.
Network fundamentals support the growth story. Developer engagement continues to rise, mining hardware distribution strengthens the system between April and June, and futures markets add depth to liquidity. The combination of strong infrastructure, early gains, and priority access highlights an opportunity to enter the market at $0.4 or higher, allowing participants to benefit from early positioning.
Final Thoughts
Pippin’s support at $0.0427 is doing a lot of work right now, and whether it holds or breaks will define the Pippin crypto price outlook for the next few weeks. Dogecoin is in a similar wait-and-see spot. The Dogecoin price prediction stays clouded until bulls actually reclaim ground, not just defend it.
BlockDAG is where the math gets interesting. Buying at $0.000022 when CoinMarketCap shows $0.40 is a gap most people stumble across after it closes. April 8 is when global listings go live, and that $0.000022 entry goes with it. Among top crypto gainers this year, few offer a closing window this specific. Specific tends to matter.
For more information, visit the official website, presale, Telegram, and Discord.
Disclosure: This content is provided by a third party. Neither crypto.news nor the author of this article endorses any product mentioned on this page. Users should conduct their own research before taking any action related to the company.

TLDR:
- Kiyosaki ties the 1974 petrodollar system to today’s rising oil prices and growing global conflict risks.
- The shift from pensions to 401(k)s after ERISA left millions of baby boomers without guaranteed retirement income.
- Kiyosaki recommends gold, silver, and Bitcoin as real stores of value amid dollar weakness and inflation.
- He calls on schools to teach financial literacy, a message he has repeated since writing Rich Dad Poor Dad in 1997.
Robert Kiyosaki, author of Rich Dad Poor Dad, has renewed his warnings about the U.S. economy. He links two major 1974 policy shifts to today’s financial instability.
The “Rich Dad” author points to the petrodollar system and the passage of ERISA as turning points. According to Kiyosaki, those decisions have now created conditions that threaten millions of Americans, particularly retiring baby boomers facing an uncertain financial future.
The Petrodollar and Rising Oil Prices
In 1974, the U.S. dollar moved away from the gold standard and became backed by oil. This shift created the petrodollar system, which has shaped global trade for decades. However, Kiyosaki argues that this arrangement is now under serious pressure in 2026.
He posted on X, warning that “the world stands on the edge of world war over oil.” Rising oil prices are pushing inflation higher across food and fuel markets. These increases are hitting everyday consumers hard as purchasing power continues to weaken.
The U.S. also carries one of the largest debt burdens in its history. Kiyosaki notes that whole countries and individuals are deeply in debt simultaneously. This convergence of debt and rising commodity prices creates a fragile economic environment.
He continues to recommend holding gold, silver, and Bitcoin as alternatives to fiat currency. These assets, in his view, represent real money that retains value over time. His long-standing position has not changed, even as market conditions shift.
ERISA, Retirement Insecurity, and Financial Education
The 1974 passage of ERISA marked a major transition in how Americans save for retirement. Before that year, most employees received guaranteed lifetime income through pension plans. After ERISA, the shift toward 401(k)s, IRAs, and RRSPs transferred investment risk to individuals.
Kiyosaki warns that millions of baby boomers will soon discover their retirement savings fall short. Social Security and Medicare are also facing serious funding challenges, he says. Many retirees may find themselves without stable income once they stop working.
He raises a broader concern about financial literacy in schools. “Why do our schools not teach the subject of money to students?” he wrote. This question, which he first raised in Rich Dad Poor Dad in 1997, remains central to his message today.
Kiyosaki encourages people to invest in their personal financial education. He acknowledges that while many credible teachers exist on YouTube, there are also unreliable sources. He advises people to stay alert and verify the information they consume carefully.

MicroStrategy co-founder Michael Saylor says Bitcoin (BTC) has won the global narrative war, but flags BIP-110 protocol changes as the asset’s greatest remaining threat.
Meanwhile, Bitcoin Conference organizer David Bailey extends an invitation to BIP-110 supporters, invigorating debate that has split the Bitcoin community into opposing camps.
BIP-110 is a proposal to change how new Bitcoin blocks are selected by allowing miners to vote on which valid block to accept, rather than strictly following the longest-chain rule.
In simple terms, it tries to make Bitcoin’s consensus more flexible and resistant to certain mining attacks.
Why the BIP-110 Debate Matters Now
Saylor argues that the BTC price is now driven by institutional capital flows rather than halving cycles.
He describes the four-year cycle as “dead” and emphasized that bank lending and digital credit will shape Bitcoin’s growth going forward.
However, the most provocative line targeted protocol development. The MicroStrategy executive calls “bad ideas driving iatrogenic protocol changes” the single biggest risk to Bitcoin.
“Iatrogenic” is a medical term meaning harm caused by medical examination, treatment, or advice from health professionals.
That warning lands squarely on the BIP-110 controversy. The Bitcoin Improvement Proposal, introduced by developer Dathon Ohm and backed by the Bitcoin Knots team, seeks a temporary one-year soft fork to restrict non-monetary data in Bitcoin transactions.
It targets Ordinals inscriptions, BRC-20 tokens, and large OP_RETURN payloads that critics say bloat the blockchain and burden node operators.
A Community Split in Two
The first block signaling support for BIP-110 was mined by the Ocean pool in March 2026.
Proponents frame it as a necessary defense of Bitcoin’s identity as sound money. They argue that arbitrary data competes unfairly with payments and drives up fees for ordinary users.
Opponents see a different picture entirely. Blockstream CEO Adam Back warned that consensus-level intervention could damage Bitcoin’s credibility as a store of value.
He argued the proposal risks setting a precedent for future transaction censorship.
The activation threshold itself remains contentious. BIP-110 proposes a 55% hash power requirement, far below the traditional 95% consensus standard for Bitcoin upgrades.
Bailey, CEO and Chairman of Nakamoto and founder of BTC Inc., acknowledged his own role in mocking BIP-110 supporters online.
Several BIP-110 supporters dismissed the gesture as a PR move tied to ticket sales rather than genuine bridge-building.
Notwithstanding, the Bitcoin 2026 Conference and a Federal Reserve meeting are both scheduled for late April, creating a dense catalyst window for BTC.
The BIP-110 signaling process remains active, with a potential activation decision approaching later in 2026.
It is a contest over whether Bitcoin should remain a minimal monetary tool or allow broader on-chain experimentation.
The post Michael Saylor Calls BIP-110 Bitcoin’s Biggest Self-Inflicted Risk appeared first on BeInCrypto.
TLDR:
- The IRGC collected Hormuz transit tolls in USDT via Tron, settling payments in seconds outside U.S. banking systems.
- Chainalysis reported the IRGC moved $3 billion through cryptocurrency in 2025, with over 50% of Iranian crypto activity linked to it.
- TRM Labs traced $1 billion in IRGC flows through Zedcex and Zedxion, both later designated by OFAC on January 30, 2026.
- Iran’s Central Bank held $507 million in USDT per Elliptic, while its Defence Ministry accepted crypto for arms exports in January 2026.
USDT, the dollar-pegged stablecoin, has become central to a documented IRGC financial operation. The token settles transactions on the Tron blockchain in under three seconds.
It bypasses American banking infrastructure entirely and cannot be frozen by the Federal Reserve. Bloomberg reported on April 1 that the Islamic Revolutionary Guard Corps collects tolls from tankers transiting the Strait of Hormuz. Payments are accepted in Chinese yuan or stablecoins, including USDT.
IRGC Toll Collection at Hormuz Runs on Crypto Rails
According to Bloomberg, tanker operators contact an IRGC-linked intermediary to begin the process. The operator submits vessel ownership, flag, cargo, crew list, and destination for review.
Hormozgan Provincial Command screens submissions using a one-to-five friendliness ranking toward the U.S. and Israel. If cleared, the operator negotiates a toll starting at one dollar per barrel.
Rates can reach up to two million dollars per supertanker, depending on the agreement reached. Payment settles either in Chinese yuan through CIPS or in USDT through the Tron blockchain.
Once payment is confirmed, a VHF passcode is issued to the vessel. An IRGC patrol boat then escorts the tanker safely through the Larak corridor.
Analyst Shanaka Anslem Perera posted on X that the toll system is “live and collecting revenue tonight.” He described the setup as the first conflict in history where an enemy’s currency funds both sides.
In January 2026, Iran’s Ministry of Defence also began accepting cryptocurrency for arms exports. Drones, missiles, and defense equipment were all settled on the same blockchain rails.
The toll system did not require new technology to operate at the Strait of Hormuz. It applied existing stablecoin infrastructure that was already running at global industrial scale.
The Central Bank of Iran had accumulated $507 million in USDT, according to Elliptic. That reserve was already in place well before the current conflict escalated further.
Blockchain Analytics Firms Documented Billions in IRGC Crypto Flows
Chainalysis reported that the IRGC moved $3 billion through cryptocurrency in 2025 alone. IRGC-linked wallet addresses accounted for over 50 percent of all Iranian crypto activity by Q4 2025.
TRM Labs traced approximately $1 billion in IRGC flows through two UK-registered exchanges. Those exchanges, Zedcex and Zedxion, conducted transactions almost entirely in USDT on Tron.
TRM described the operation as “a sanctioned military organization operating exchange-branded crypto infrastructure offshore.” The firm further called it “infrastructure-level control” over offshore stablecoin exchange activity.
The U.S. Office of Foreign Assets Control designated both exchanges on January 30, 2026. Twenty-nine days after those designations, military strikes on Iran began.
The U.S. Treasury issues bonds to fund its own war effort against Iran. Those bonds finance aircraft carriers, interceptors, and the 2,400 sorties flown over Iran in five weeks.
Meanwhile, USDT — a token bearing “USD” on its face — funds toll payments on the opposing side. Both instruments denominate in dollars yet operate on entirely separate financial rails.
One rail runs through the Federal Reserve; the other through a British Virgin Islands-registered blockchain. Both systems settle in seconds and reference the same dollar.
The IRGC captures revenue from dollar-denominated tolls without needing access to American financial systems. Neither party controls how the other side uses the dollar’s name in this ongoing conflict.
Crypto World
Gold Reserves Top $4 Trillion, Surpassing Foreign-Held U.S. Treasuries for the First Time
TLDR:
- Central bank gold holdings crossed $4 trillion, exceeding $3.9 trillion in foreign-held U.S. Treasuries in early 2026.
- Global central banks purchased 863 tonnes of gold in 2025, marking three consecutive years of record-level buying.
- Gold dropped from $5,608 to $4,676 amid Iran war inflation pressures, yet institutional price targets remain above $5,400.
- The 2022 freeze of $300 billion in Russian reserves triggered a structural move by central banks toward unfreezable gold assets.
Gold reserves held by the world’s central banks have crossed a critical threshold in early 2026. For the first time, the collective value of sovereign gold holdings — roughly $4 trillion — now exceeds the $3.9 trillion in U.S. Treasury securities held by foreign governments.
The shift represents the most consequential change in global reserve composition since the dollar displaced the British pound sterling decades ago.
Central Banks Drive Structural Gold Accumulation
The scale of central bank gold purchases has been consistent and growing. In 2025, central banks collectively bought 863 tonnes of gold. That marks the third consecutive year above 1,000 tonnes when unreported purchases estimated by the World Gold Council are factored in.
Poland added 20 tonnes in February alone. China’s central bank has maintained purchases for over 15 consecutive months.
Meanwhile, global gold ETF holdings reached an all-time high of 4,171 tonnes, reflecting broad institutional participation beyond sovereign buyers.
As analyst Shanaka Perera noted on social media: “The buying is not speculative. It is structural. It is central banks replacing the asset that can be frozen with the asset that cannot.”
The catalyst for this shift traces back to February 2022. That month, the United States and Europe immobilized approximately $300 billion in Russian central bank reserves held in Western financial institutions. The message to non-aligned central banks was direct — reserves held in foreign bonds carry political risk.
Gold Price Correction Masks Long-Term Momentum
Gold currently trades at $4,676, down from $5,608 in January. The decline stems largely from short-term war-driven market mechanics.
The Iran conflict pushed oil above $140, driving inflation and keeping the U.S. Federal Reserve’s rates at 3.50 to 3.75 percent. Higher real yields have temporarily made the dollar more attractive relative to gold.
The same conflict that is straining U.S. strategic influence at the Strait of Hormuz is, at least in the near term, supporting dollar strength through inflationary channels. Gold is therefore caught between short-term rate pressures and longer-term reserve diversification trends.
Major financial institutions have not revised their bullish outlook. JPMorgan and Wells Fargo project targets between $6,100 and $6,300. Goldman Sachs forecasts $5,400 by year-end. Institutional buyers appear to be accumulating during the dip rather than exiting positions.
The broader context remains unchanged. Gold cannot be frozen by executive order, does not settle through SWIFT, and requires no foreign custodian.
That combination of properties, rather than any speculative thesis, continues to drive sovereign demand. The $4 trillion crossover reflects a measured, ongoing rebalancing of global reserve strategy — one tonne at a time.
Crypto World
Taurox (TAUX) Pre-KYA Opening Announcement Secures Renewed Interest From (Ripple) Investors

XRP trades near $1.32. April has recorded the highest average monthly returns for XRP since 2014 at 24.8%. The OCC final rule took effect on April 1, enabling Ripple’s conditionally approved National Trust Bank to move forward with expanded digital asset custody operations, while the Senate Banking Committee markup of the CLARITY Act remains scheduled for the second half of the month.
Taurox, an AI-driven trading protocol, is equipped to respond to these developments through autonomous agents that deliver diversified, risk-managed returns to stakers.
Handling XRP Supply Dynamics and Regulatory Timelines with Taurox’s Methodical Framework
XRP faces ongoing pressure from the April 1 escrow release of 1 billion tokens combined with regulatory milestones, resulting in moderate volatility and repeated 20-30% price movements for holders despite institutional progress. Taurox presents a steadier solution by uniting deposits of USDT, BTC, or XRP inside one central trading pool guided by autonomous agents. These agents are created by an international network of developers, quants, and AI engineers to achieve reliable proportional profits.
Each agent is limited to no more than 2% of total pool assets to reduce concentration risk, with KYA tiers ensuring strategies stay within conservative, moderate, or aggressive categories. Demanding Sharpe ratios of at least 1.5 and drawdown limits below 15%, Taurox generates more consistent outcomes than direct asset ownership or standard hedge funds that charge 2% management fees under any market circumstance.

Early Agent Submission Portal Open: Accelerating Strategy Integration
Taurox recently achieved an important roadmap acceleration by launching the Pre-KYA Registration Table. This gateway enables developers, quants, and AI specialists to submit trading agents early, before the full Know Your Agent framework activates. Early registrants gain front-of-line access to the Proving Ground for quicker testing and faster capital deployment. They also qualify for additional rewards from the Agent Creator Fund, which accounts for 10% of total TAUX supply. Strategists with proven systems now have a prime window to secure early positioning inside the Taurox ecosystem.
Taurox Operational Framework: AI Strategies with Layered Risk Protections
Taurox collects staker contributions into one central trading pool and issues txTokens valued at the current net asset value per share, starting at $1.00. The protocol reserves 15% of assets in stablecoins to support liquidity and allocates the balance through a performance-weighted system. Agents implement strategies such as statistical arbitrage using secure on-chain vaults or limited-access CEX accounts.
Before activation, each agent completes evaluation in the Proving Ground with sponsor capital until it satisfies statistical thresholds, such as a minimum of 500 trades for high-frequency approaches. Protective measures consist of 2% daily loss limits, 5% single-trade exposure caps, and an automatic 5% pool-wide drawdown halt. Gradual reallocation procedures help prevent abrupt liquidations, and KYA classification confirms that agents adhere strictly to their designated risk parameters within a transparent and auditable structure.

TAUX Economic Model: Capped Supply Enhanced by Systematic Burns
TAUX maintains a fixed supply of 2 billion tokens with no possibility of additional minting after launch, removing any dilution risk. In contrast to standard hedge funds, Taurox imposes no base fees and retains only 5% of gross profits, acquired directly on the open market. Thirty percent of this revenue is sent permanently to a dead address for burning, while seventy percent is directed to the DAO treasury.
The remaining profit share follows a tiered model that prioritizes stakers, allocating 80% for returns between 0-20% and reducing progressively to 43% once returns surpass 300%, with all calculations based on high-water mark net gains. Allocations assign 40% to the presale, 15% to ongoing block-by-block staking rewards, 10% to milestone-based agent incentives, and 5% to the team under a six-month cliff vesting schedule.
Taurox Presale Progress: Entry Opportunity with Defined Growth Projections
The Taurox Presale has advanced into Phase 4 and surpassed $950K raised. TAUX is currently available at $0.018. Phase 4 participants can expect nearly 4.5x upside at listing when the token debuts at $0.08. If the protocol reaches a $1 billion pool, early backers could realize up to 103x returns with TAUX at $1.85. A $500 investment today would grow to roughly $2,220 at listing and approach $28,000 at the $1 valuation.
The presale includes a one-month cliff and 20% monthly releases from months two to five, allowing immediate staking while limiting early transfers. Combined with 30% revenue burns, tiered profit sharing, 15% staking rewards, and an 8% security allocation, it presents attractive potential across both near-term and extended horizons.
Final Assessment: Taurox Establishing Reliable Yield Mechanisms in Dynamic Markets
Taurox integrates advanced AI autonomy with rigorous on-chain risk protocols and a built-in deflationary mechanism to establish a new benchmark in decentralized finance. Supported by contributions from developers around the world and sustained by ongoing token burns, the protocol maintains a clear path for measured growth as the need for consistent and transparent yield generation increases across market cycles.
Learn More
Buy TAUX: https://taurox.io
Whitepaper: https://docs.taurox.io/
Official Telegram: https://t.me/tauroxlabs
Official X/Twitter: https://x.com/TauroxProtocol
Disclaimer: This is a Press Release provided by a third party who is responsible for the content. Please conduct your own research before taking any action based on the content.


Kwasi Kwarteng, the UK’s former Chancellor of the Exchequer who served just weeks in September 2022, is re-emerging with a new focus on bitcoin, monetary history, and long-term economic thinking.
Reflecting on the infamous mini-budget in an interview with CoinDesk, he was candid about the missteps. “The mini budget was literally two weeks after we took office, it was just very, very rushed business,” he said, referring to the period immediately after taking office on Sept. 6, followed by the death of Queen Elizabeth II two days later. The compressed timeline left little room for coordination or scrutiny. The fallout was severe, sending gilt yields sharply higher and helping expose the UK’s Liability-Driven Investment pension crisis.
Kwarteng still defends the intent behind the policy, warning the UK is now stuck in a fiscal “doom loop” where “you’re spending more money than you can raise in taxation,” and rising taxes ultimately “kill incentives in the economy.”
He also criticised the short-termism dominating both politics and markets. “Everything’s quarterly driven, people are either euphoric or freaking out. And actually, you’ve got to take a longer view.”
That longer view now shapes his thinking on bitcoin and money more broadly. While in office, he said, “the Treasury, the Bank of England are certainly aware of bitcoin and digital assets, but its still incredibly small,” highlighting what he sees as the UK’s reluctance to embrace innovation.
He also pointed to a cultural gap with Europe, noting Paris is becoming “quite forward leaning on digital assets.”
Kwateng also pushed back on criticism from Boris Johnson, after the former prime minister claimed Bitcoin was a “Ponzi,” arguing instead for a more open-minded view of emerging forms of money.
A new bitcoin treasury venture
Now involved with UK bitcoin treasury firm Stack BTC (STAK) as executive chairman, Kwarteng is putting those ideas into practice, with the company holding 31 BTC on its balance sheet.
The firm has drawn increasing political attention, with Reform UK leader Nigel Farage taking a 6% stake in the company.
For Kwarteng, the shift reflects a move away from reactive policymaking toward what he sees as a more resilient monetary future grounded in long-term thinking.
The Vikings’ Biggest Offseason Surprises So Far

How I Cracked My Finance Placement | Waystone
Britain’s Got Talent viewers issue same ‘bored’ complaint moments into show


-

 NewsBeat2 days ago
Steven Gerrard disagrees with Gary Neville over ‘shock’ Chelsea and Arsenal claim | Football
-

 Business2 days ago
No Jackpot Winner and $194 Million Prize Rolls Over
-

 Fashion1 day ago
Weekend Open Thread: Spanx – Corporette.com
-
Entertainment5 days ago
Fans slam 'heartbreaking' Barbie Dream Fest convention debacle with 'cardboard cutout' experience
-

 Crypto World3 days ago
Gold Price Prediction: Worst Month in 17 Years fo Save Haven Rock
-

 Tech6 days ago
The Pixel 10a doesn’t have a camera bump, and it’s great
-
Crypto World4 days ago
Dems press CFTC, ethics board on prediction-market insider trades
-
 Entertainment7 days ago
Lana Del Rey Celebrates Her Husband’s 51st Birthday In New Post
-

 Tech6 days ago
Avatar Legends: The Fighting Game comes out in July and it looks pretty slick
-

 Business3 days ago
Login and Checkout Issues Spark Merchant Frustration
-

 Sports4 days ago
Tallest college basketball player ever, standing at 7-foot-9, entering transfer portal
-

 Tech4 days ago
EE TV is using AI to help you find something to watch
-

 Fashion7 days ago
Amazon Sundays: Soft Spring Layers
-

 Tech6 days ago
Elon Musk’s last co-founder reportedly leaves xAI
-

 Fashion5 days ago
The Best Spring Trends of 2026
-

 Tech4 days ago
How to back up your iPhone & iPad to your Mac before something goes wrong
-

 Tech5 days ago
Apple will hide your email address from apps and websites, but not cops
-

 Politics5 days ago
Should Trump Be Scared Strait?
-

 Crypto World5 days ago
U.S. rule change may open trillions in 401(k) funds to crypto
-

 Tech5 days ago
Flipsnack and the shift toward motion-first business content with living visuals
You must be logged in to post a comment Login