

Crypto World
Polymarket Bitcoin Price Prediction Says $75K, But Charts Don’t
Bitcoin price has traded mostly flat over the past 24 hours near $68,000, reflecting continued indecision. The broader seven-day trend still shows a mild decline, highlighting the lack of strong bullish momentum. Yet one prediction market’s positioning is telling a far more optimistic story.
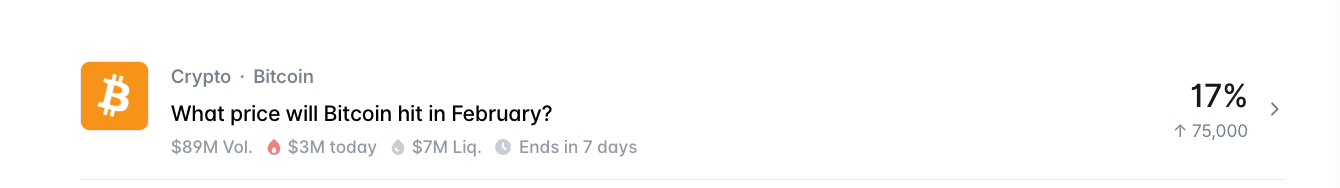
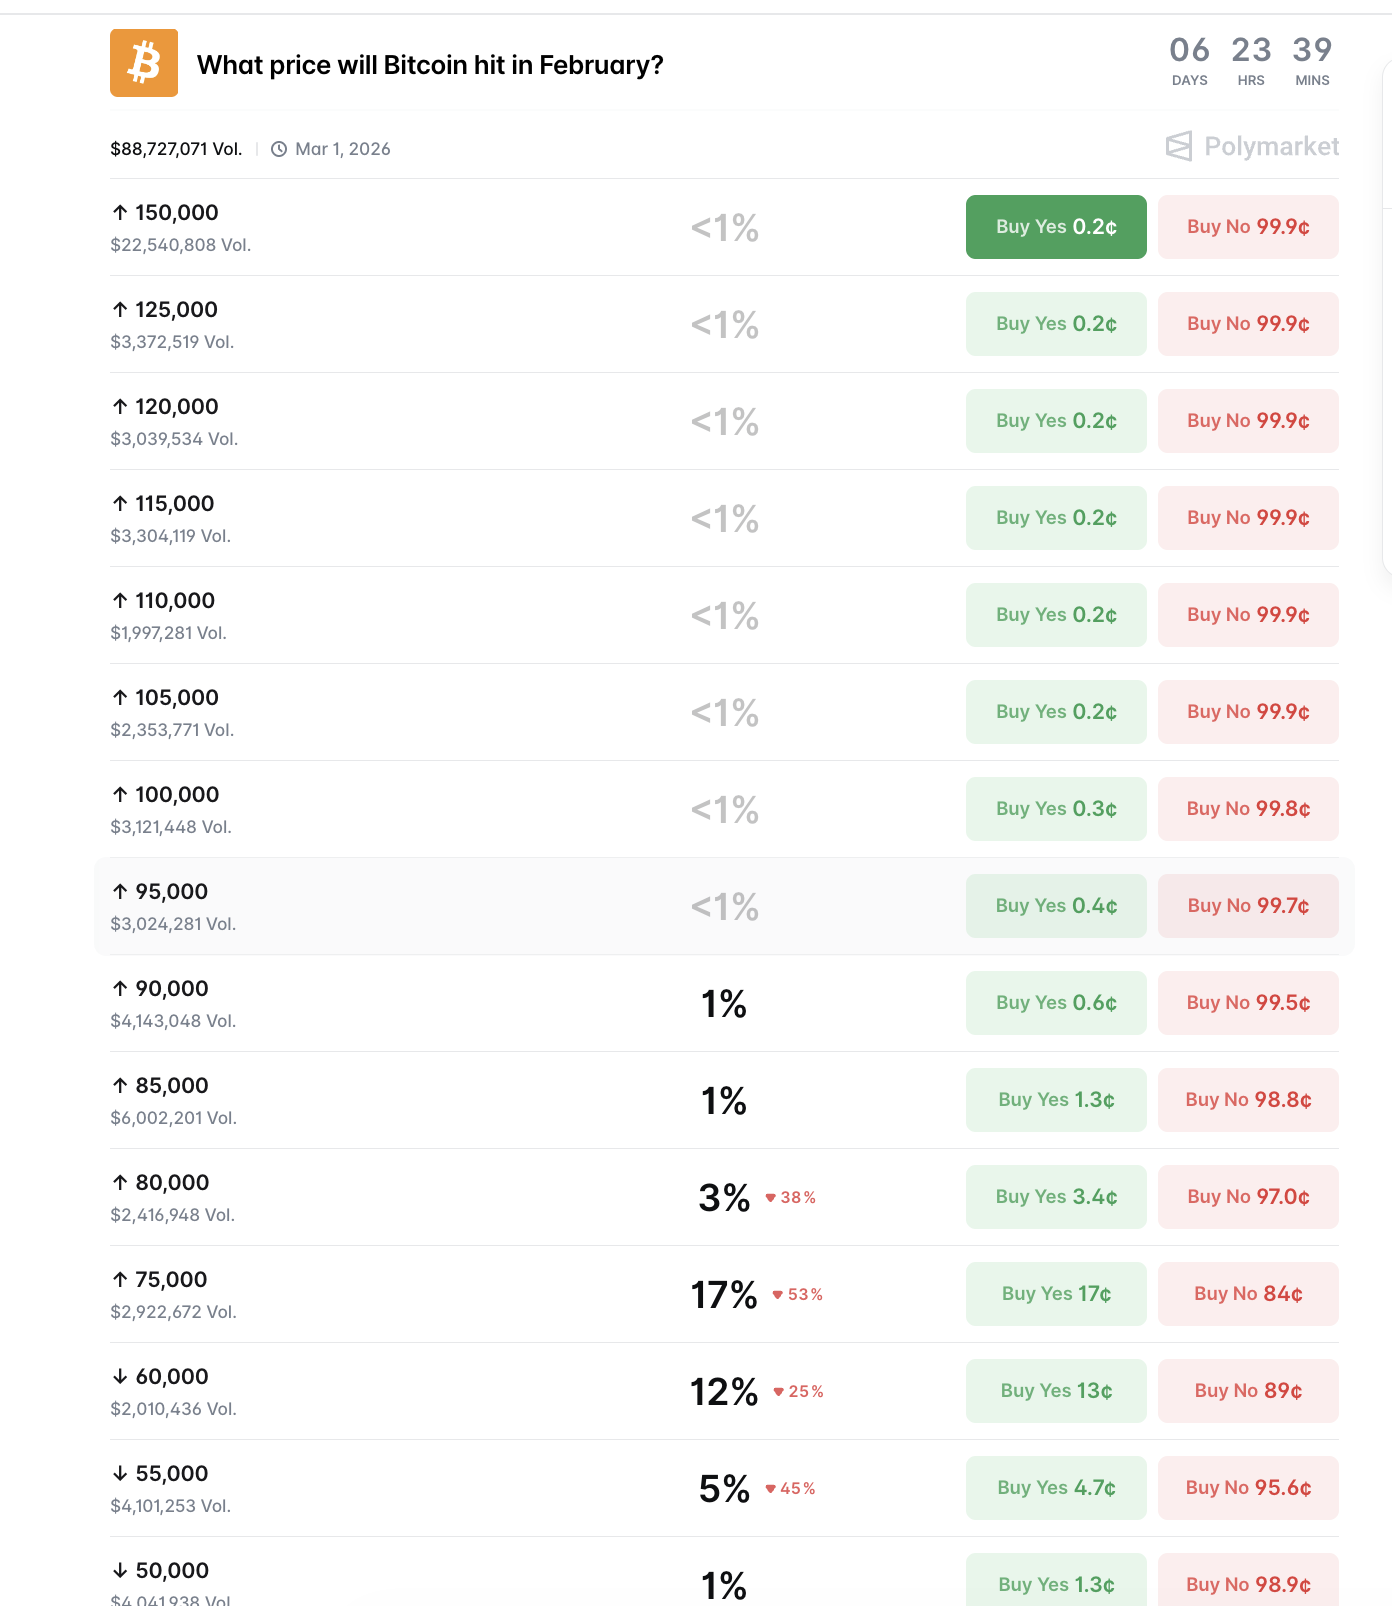
On Polymarket, the single largest February outcome, at 17%, expects Bitcoin to cross $75,000. This makes it the most popular directional bet as the month approaches its final week. However, market structure, on-chain activity, and whale positioning suggest reality may not align with this bullish expectation.
Prediction Markets Favor $75,000 — But Hidden Bearish Divergence Signals Trouble
Prediction market data shows ‘above $75,000’ remains the most favored February target despite weakening sentiment. Polymarket volumes, for this bet, exceed $88 million, with millions in active liquidity.
However, the probability of the $75,000 outcome has already declined by more than 50%, reflecting fading confidence.
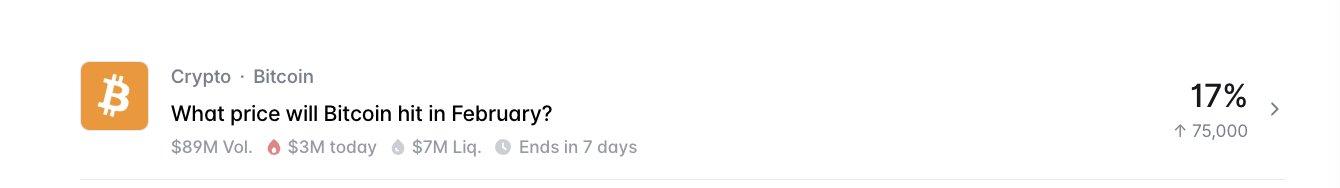
At the same time, the next most likely outcome sits at ‘under $60,000’ with a 12% probability. This positioning reveals a growing split in expectations. While many traders still hope for upside, a large portion of the market is increasingly preparing for a deeper correction instead.
This growing caution aligns closely with Bitcoin’s technical structure.
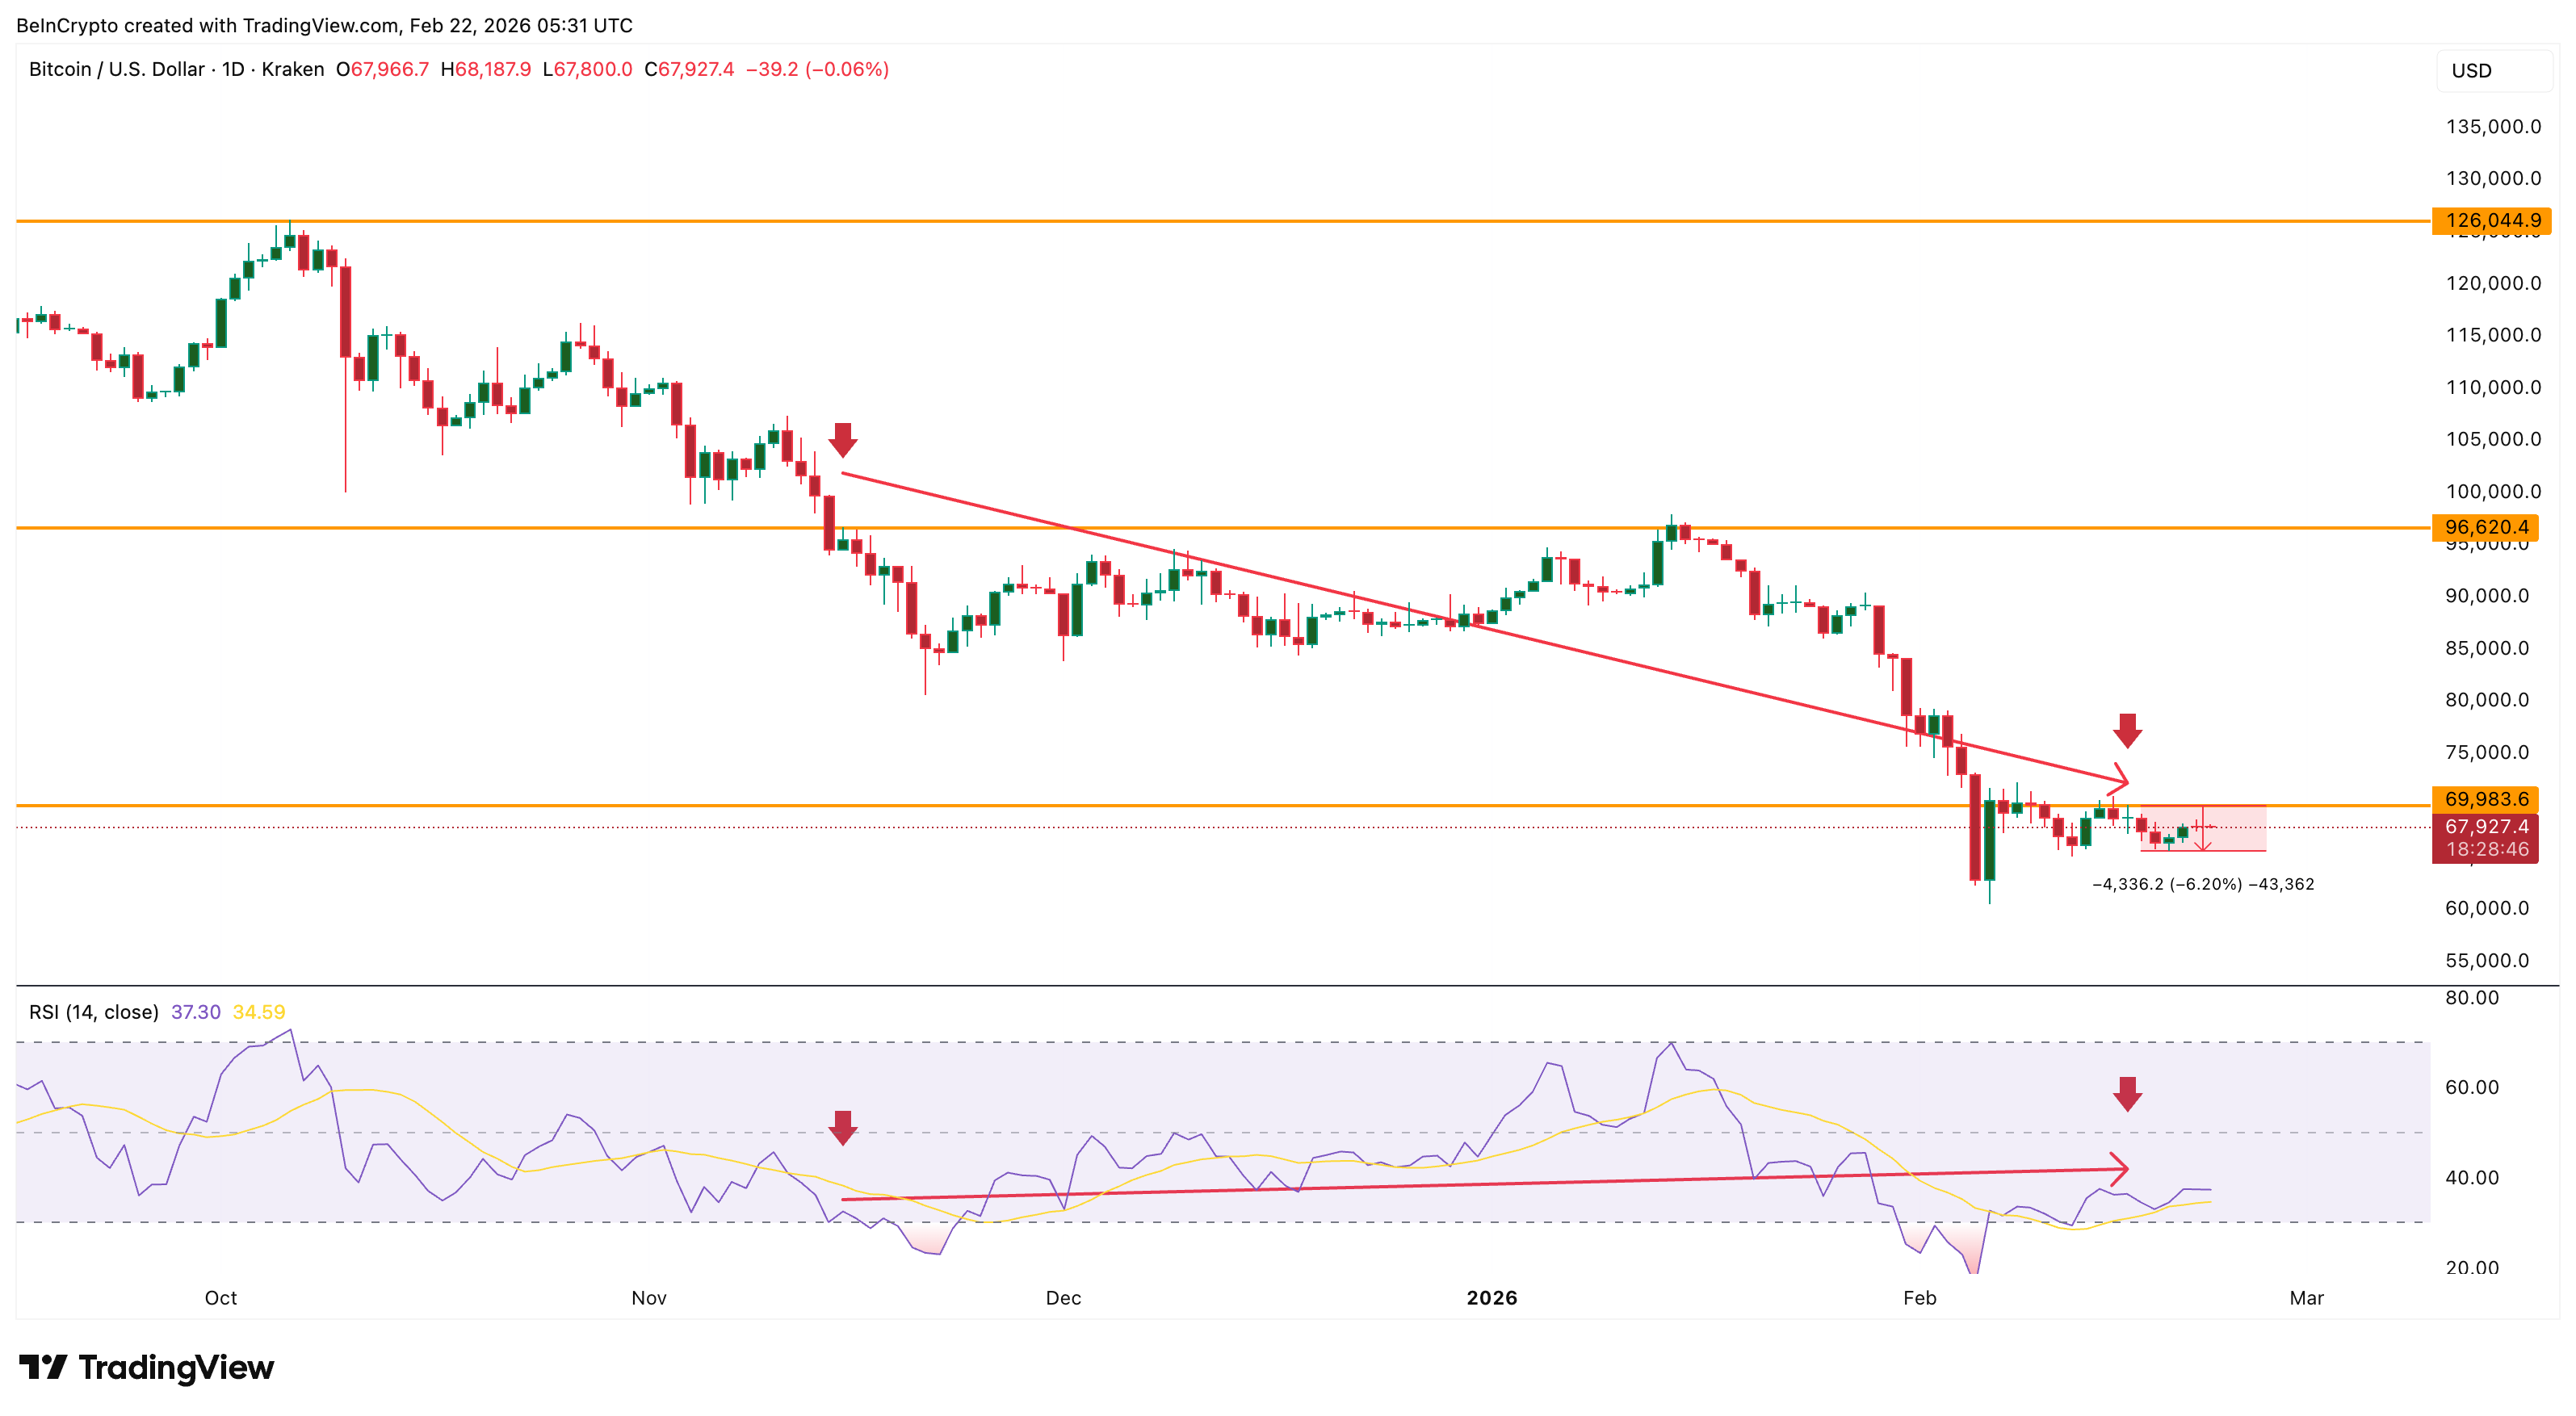
On the daily chart, Bitcoin formed a lower high between November 15 and February 16. This means price failed to fully recover during its latest rally attempt.
Meanwhile, the Relative Strength Index (RSI), which measures momentum strength, formed a higher high during the same period.
Want more token insights like this? Sign up for Editor Harsh Notariya’s Daily Crypto Newsletter here.
Because Bitcoin was already in a downtrend, this creates a hidden bearish divergence. This pattern usually signals continuation of the existing downtrend rather than a bullish reversal. It shows that even though momentum improved briefly, the broader selling pressure remains intact.
Since this divergence appeared, Bitcoin has already corrected nearly 6%. As long as this signal remains active, the probability of reaching the prediction market’s $75,000 target remains limited.
Long-Term Holders Have Slowed Selling, But Have Not Started Buying
Long-term holder activity helps explain why prediction markets still retain some optimism, even as risks increase. These investors may have held Bitcoin for more than 1 year. Their buying and selling patterns often determine whether Bitcoin enters a sustained rally or correction.
On February 5, long-term holders reduced their holdings by 244,919 BTC (30-day rolling change), a sign of extremely heavy selling. By February 21, this number improved to 81,019 BTC. This marks a roughly 67% reduction in selling pressure.
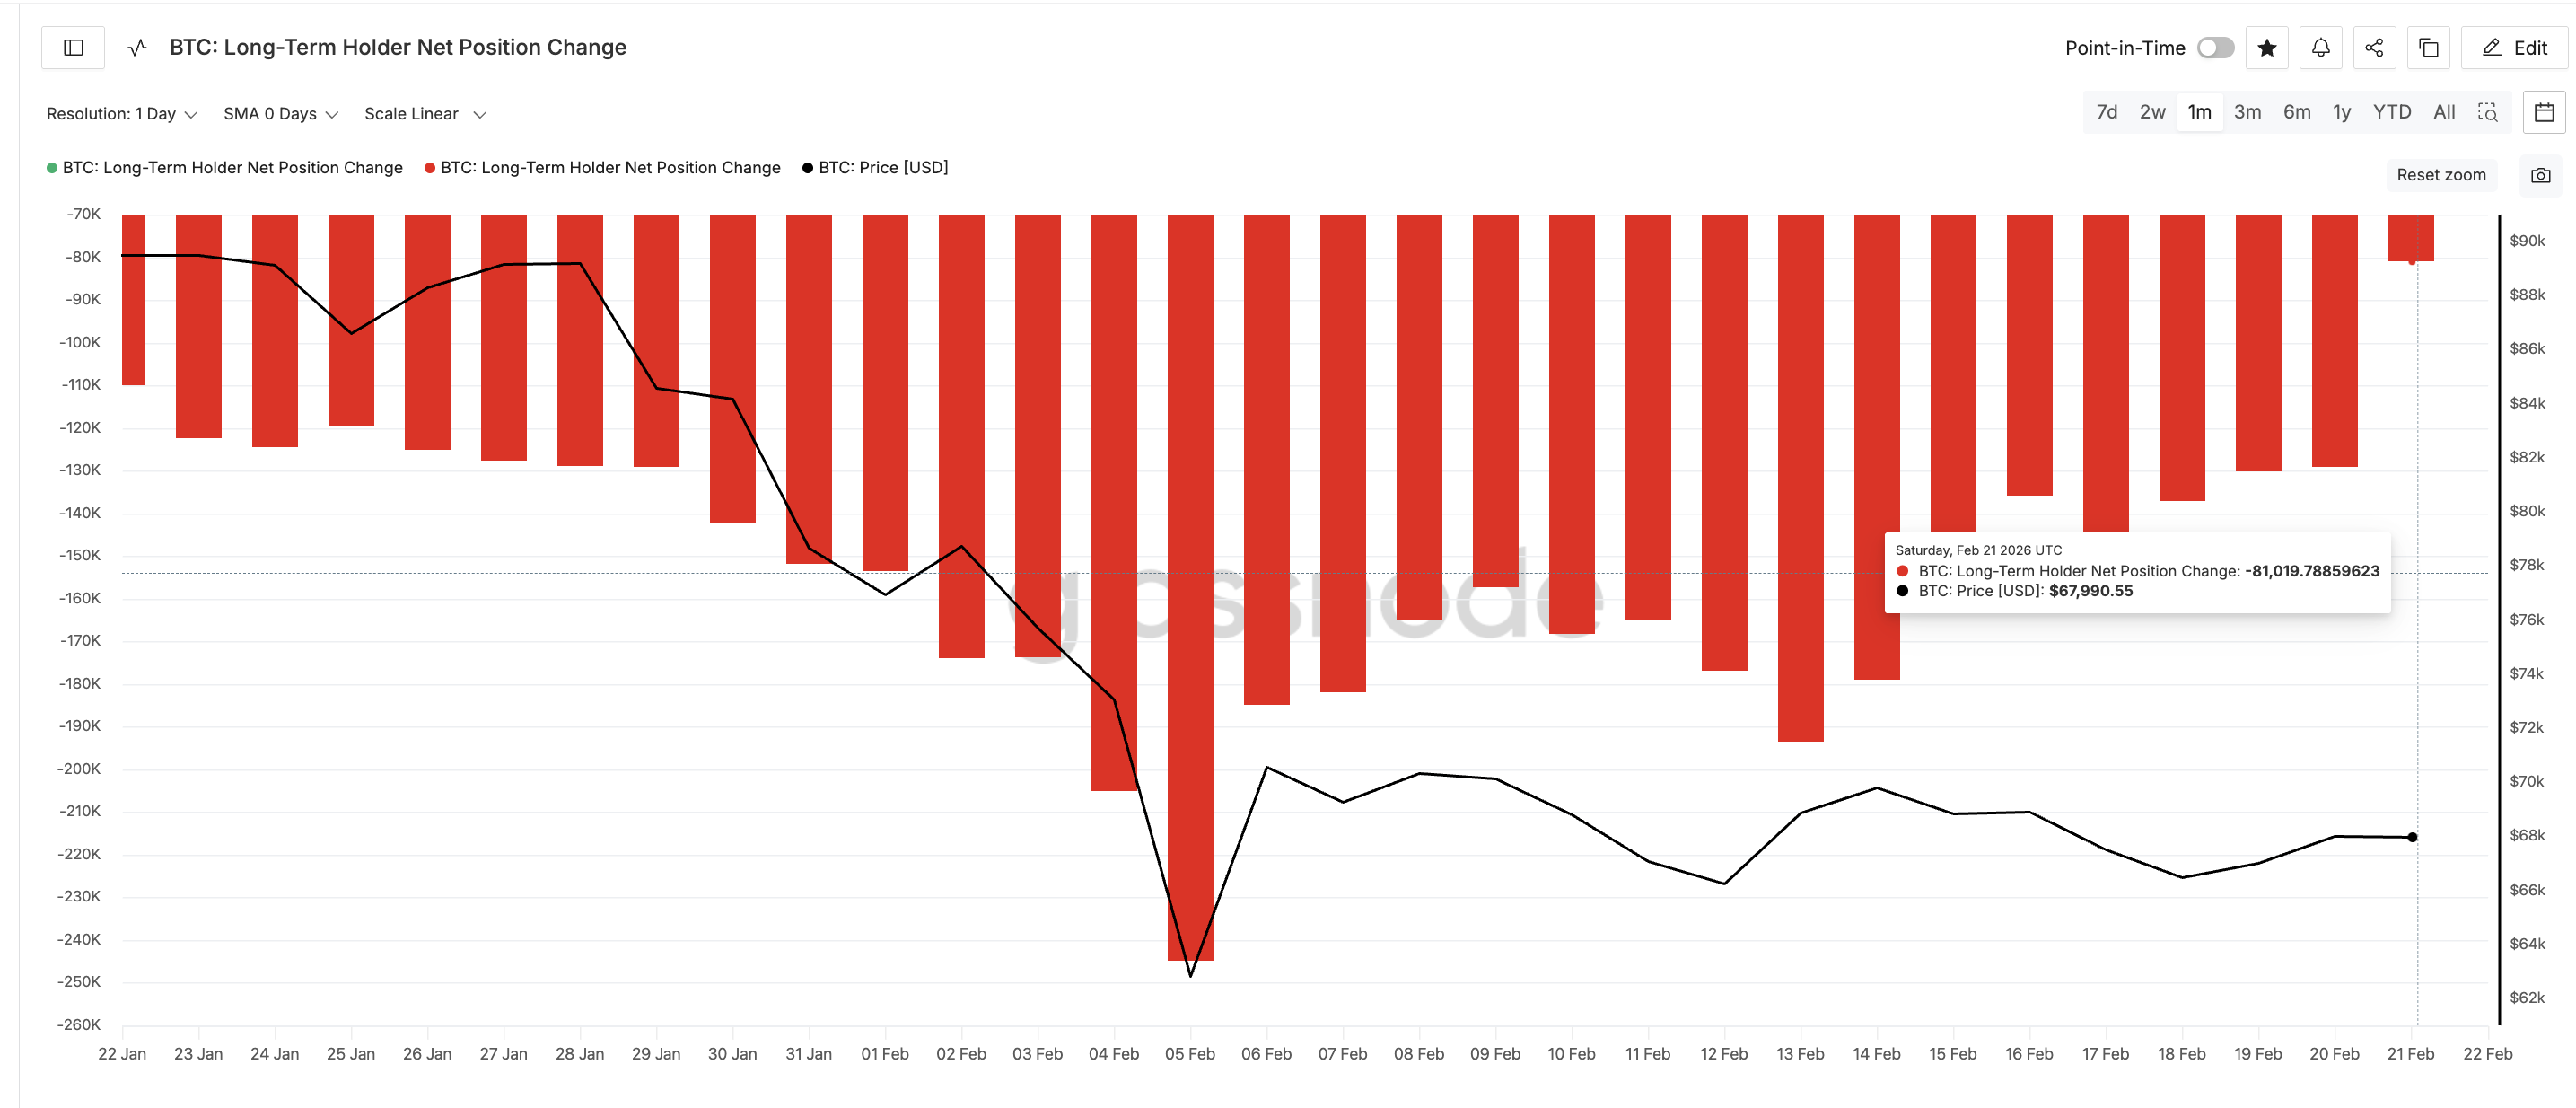
This sharp slowdown in selling helps stabilize Bitcoin’s price and explains why some traders still expect upside.
However, long-term holders are still net sellers overall. They have not yet transitioned into accumulation. Their activity has improved, but they are not yet providing the strong buying support needed to push Bitcoin toward new highs.
This creates a neutral balance. Bitcoin may avoid immediate collapse, but it also lacks the strength needed for a major breakout to push it close to $75,000.
Whale Behavior Is Split
Whale positioning further reflects uncertainty.
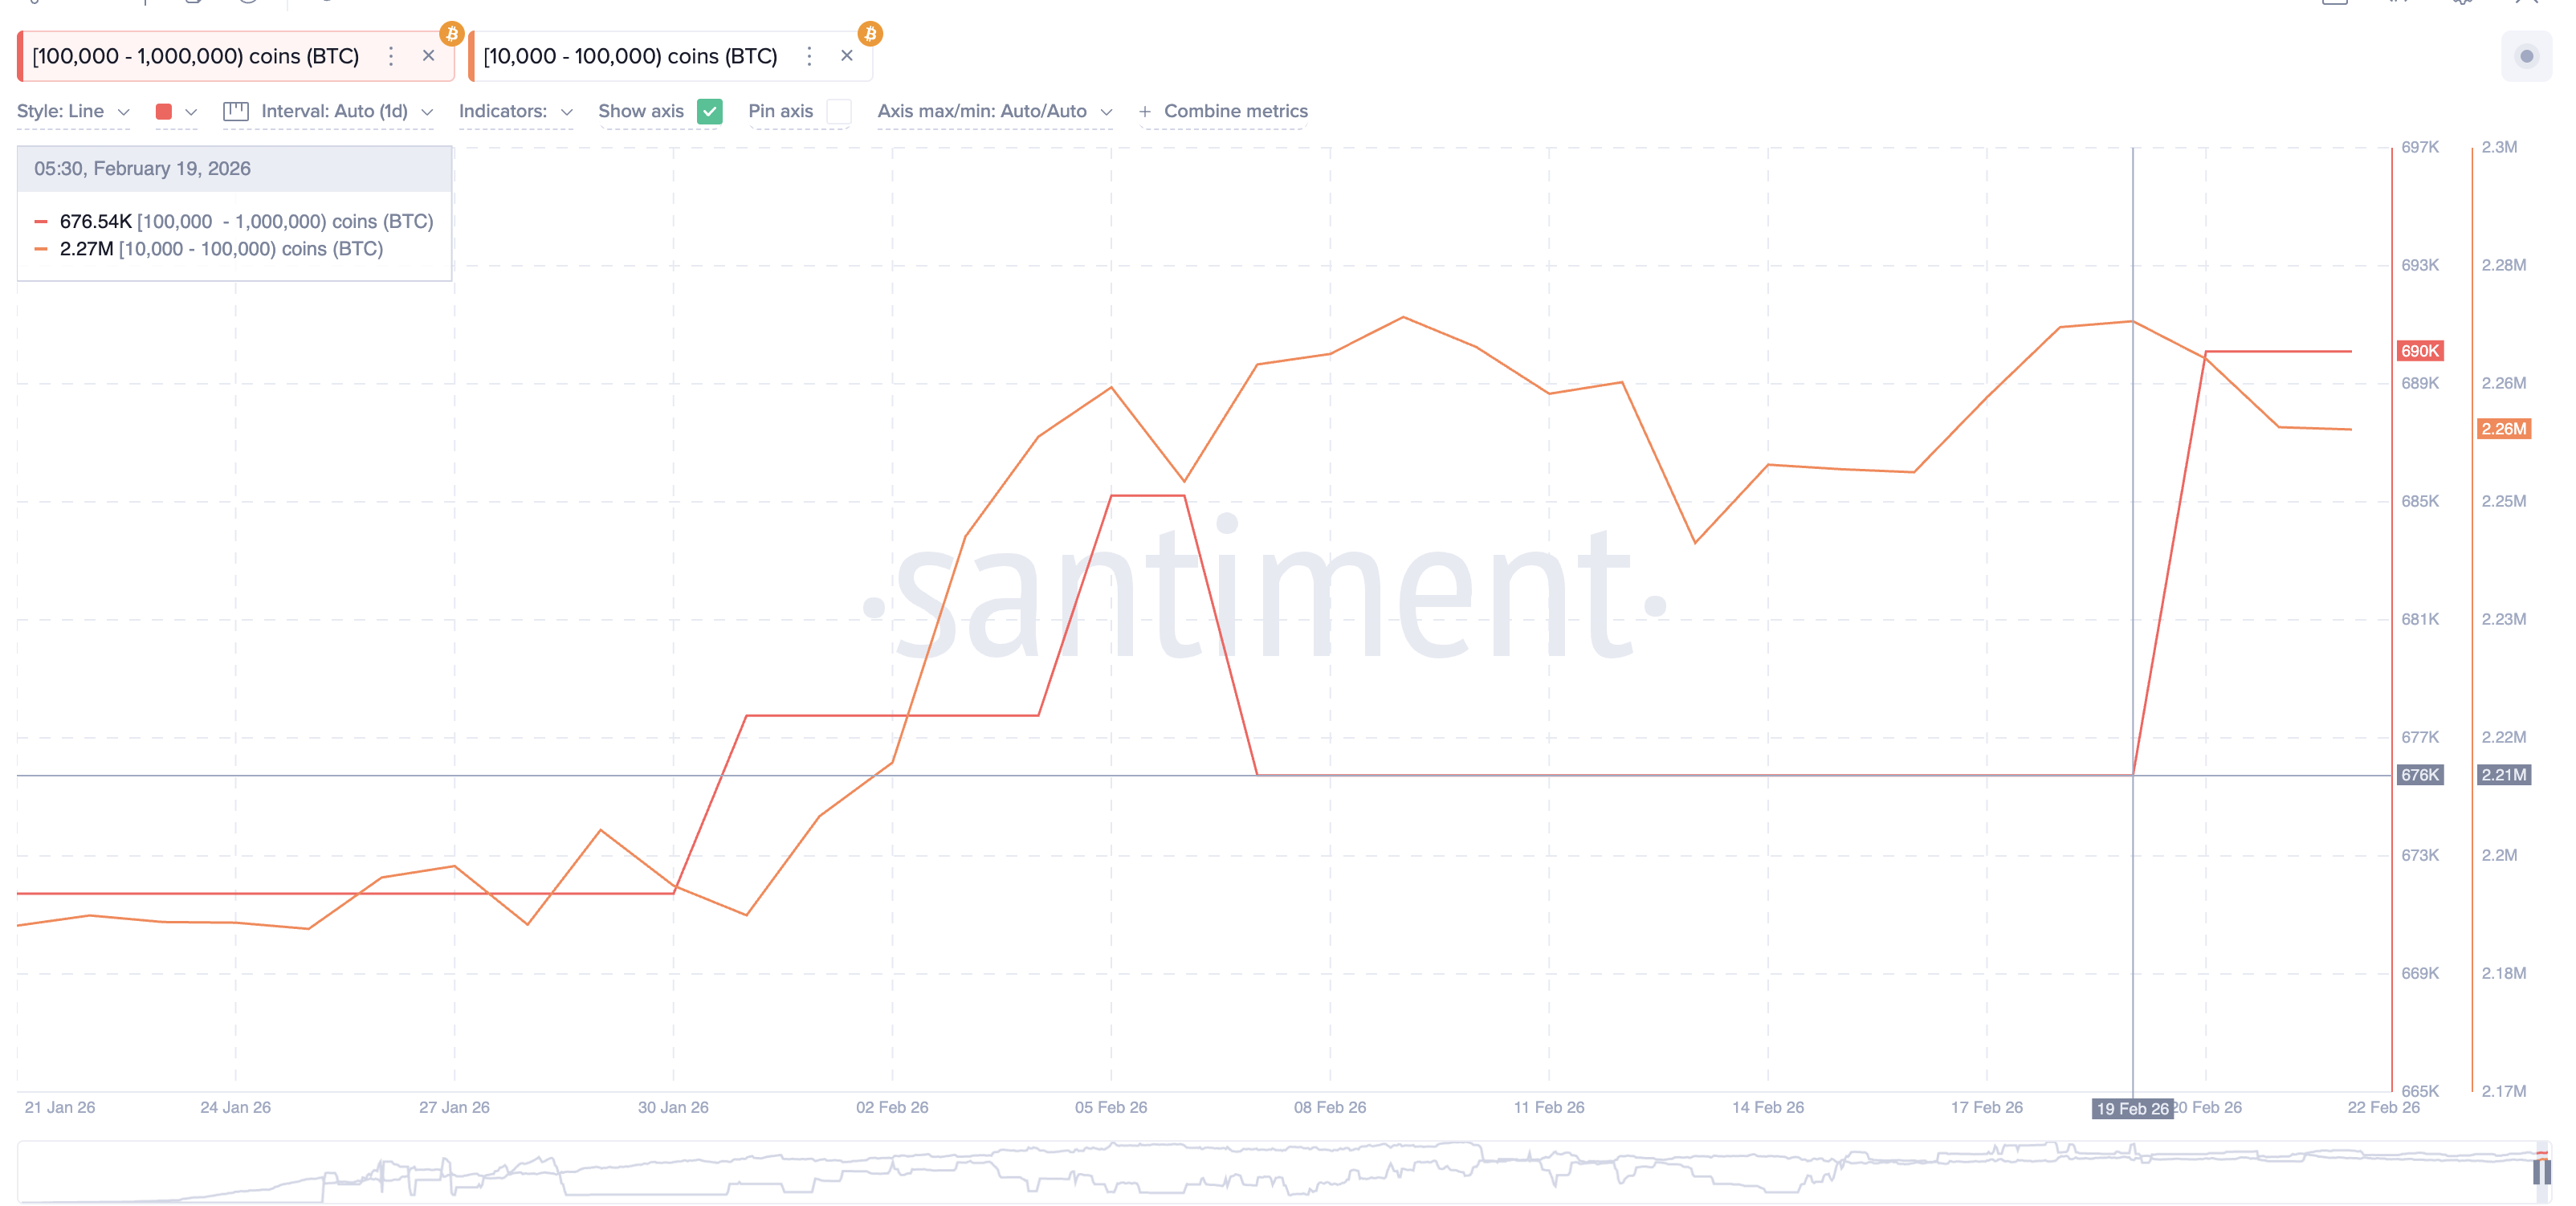
The largest Bitcoin whales, holding between 100,000 and 1 million BTC, increased their holdings from 676,540 BTC to 690,000 BTC. This represents an accumulation of about 13,460 BTC, signaling cautious buying.
However, smaller whales holding between 10,000 and 100,000 BTC reduced their holdings from 2.27 million BTC to 2.26 million BTC. This means roughly 10,000 BTC were sold during the same period.
This opposing behavior shows a lack of unified conviction, even though the net balance slightly tilts towards accumulation. Some whales are preparing for a rebound, while others remain defensive.
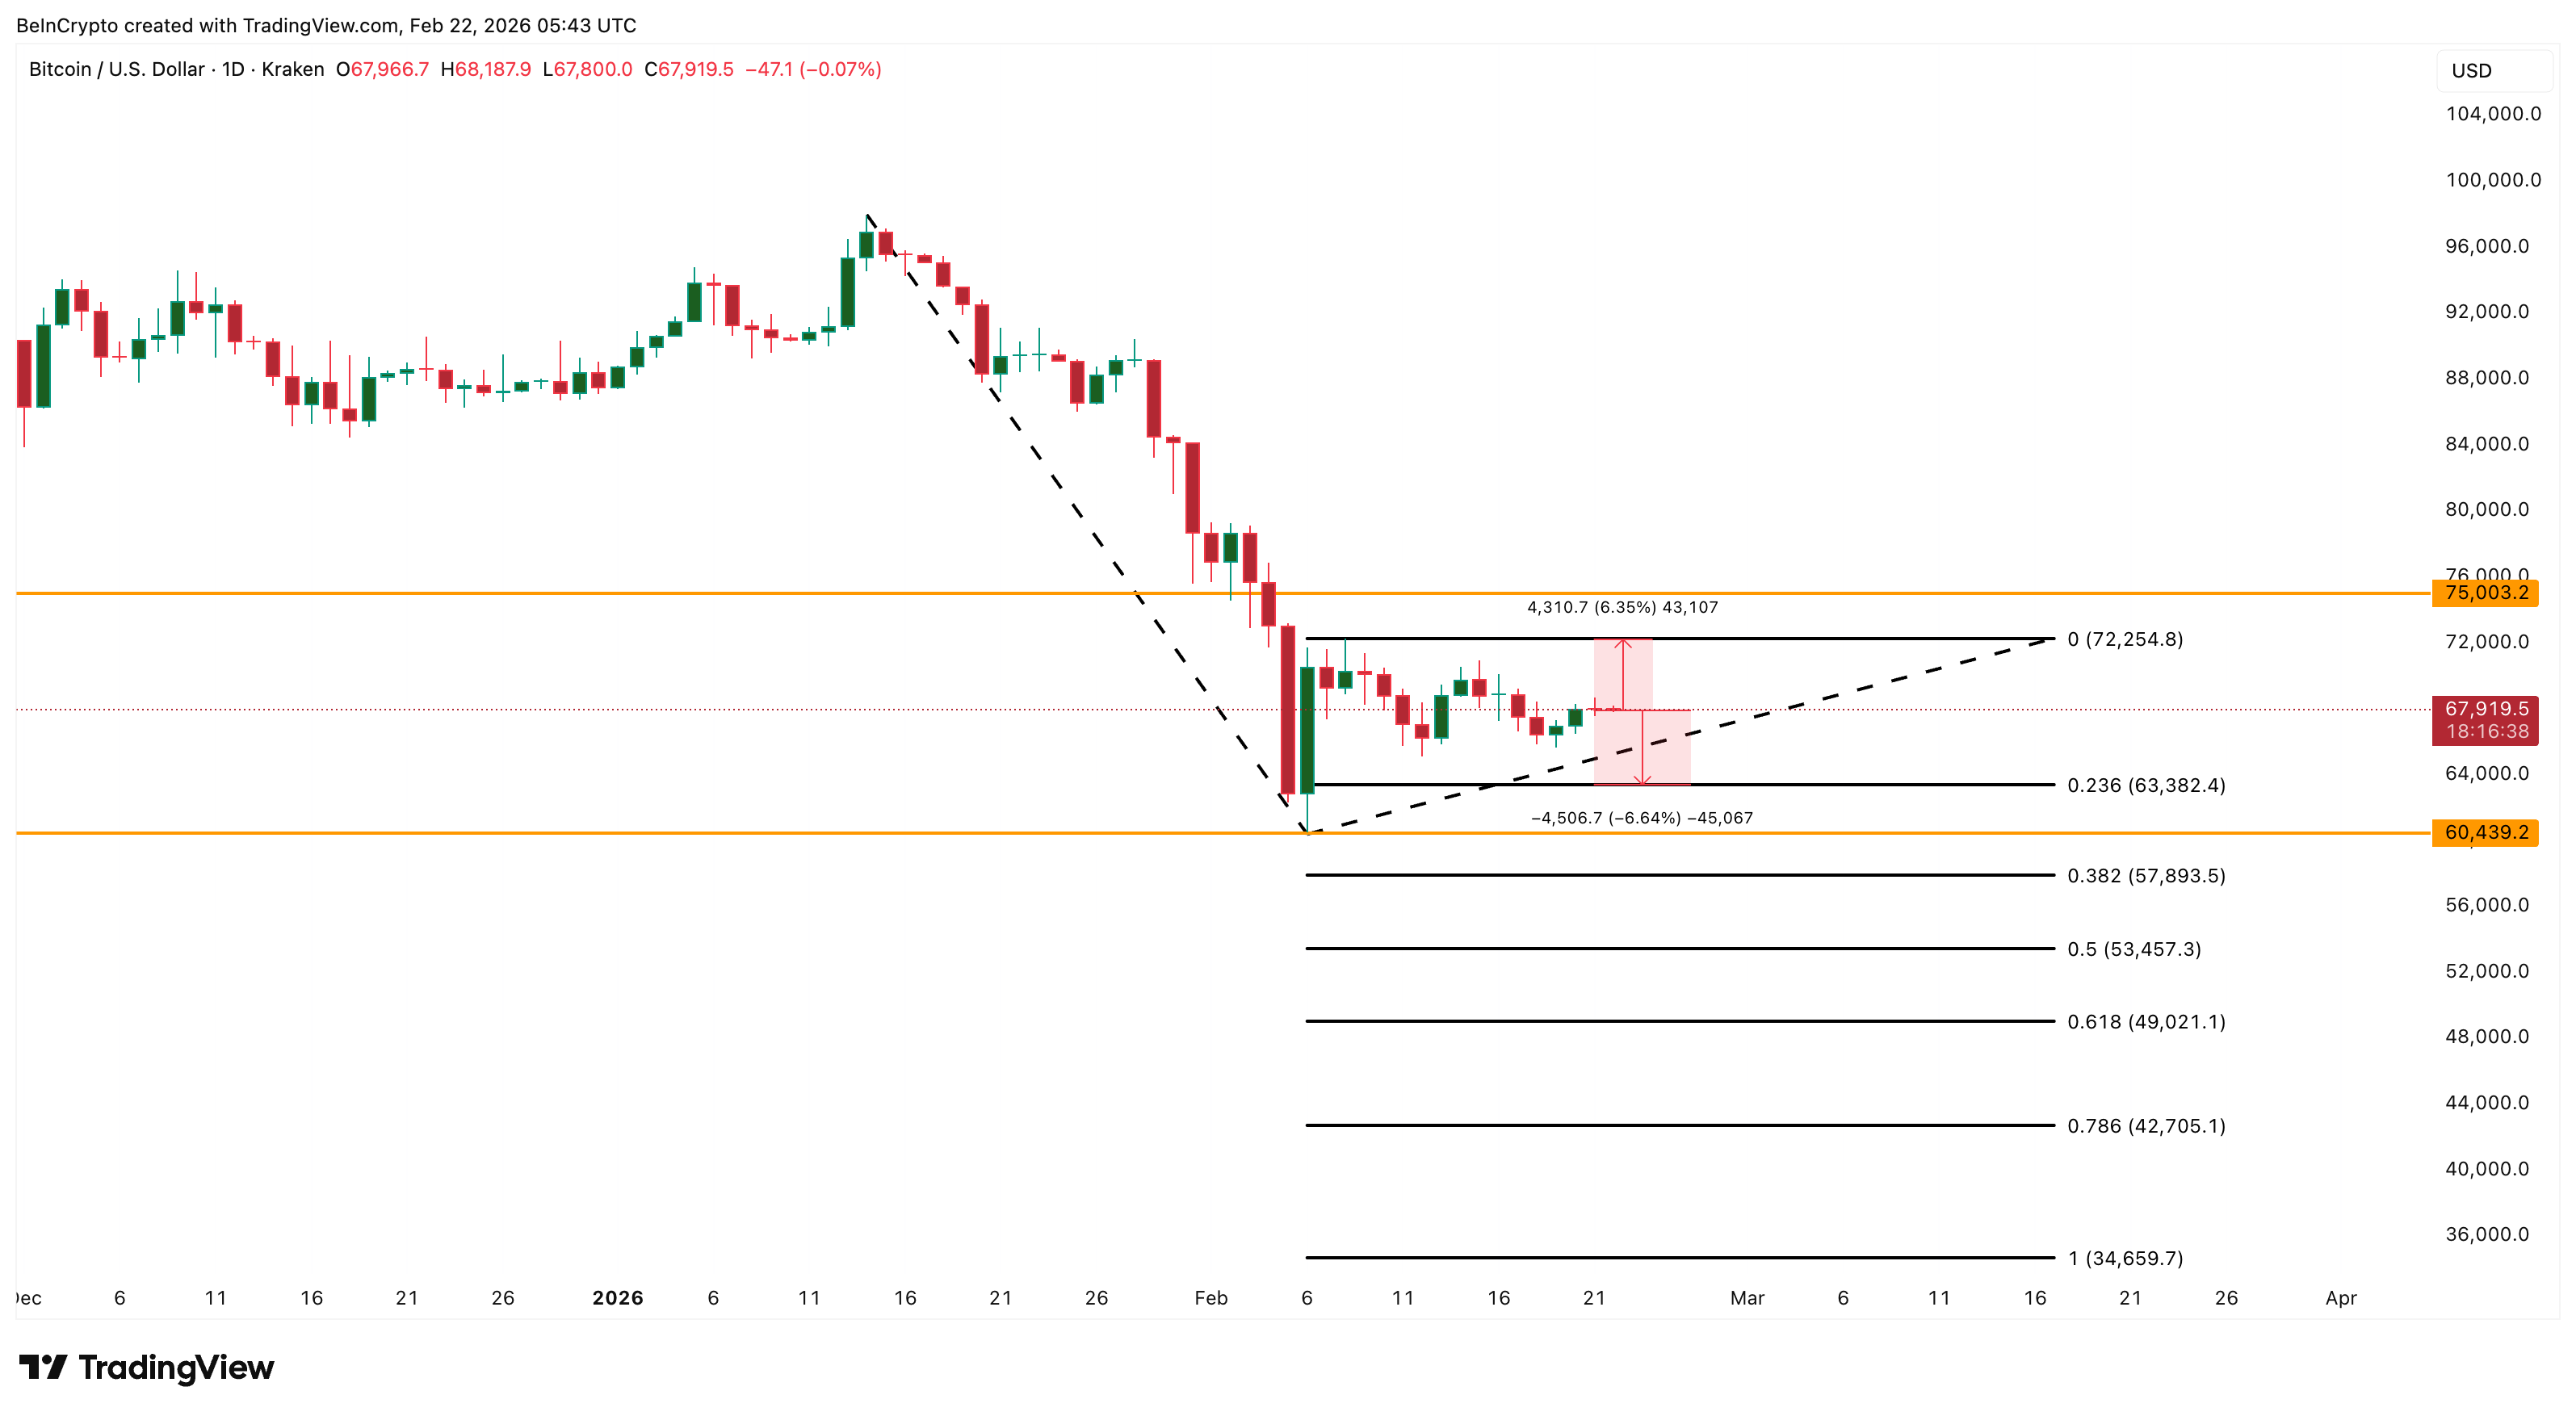
At the same time, cost basis distribution data reveals a major resistance cluster between $72,600 and $73,200. Around 149,000 BTC were accumulated in this range. These levels also appear clearly on the price chart as a major resistance zone just below $75,000.
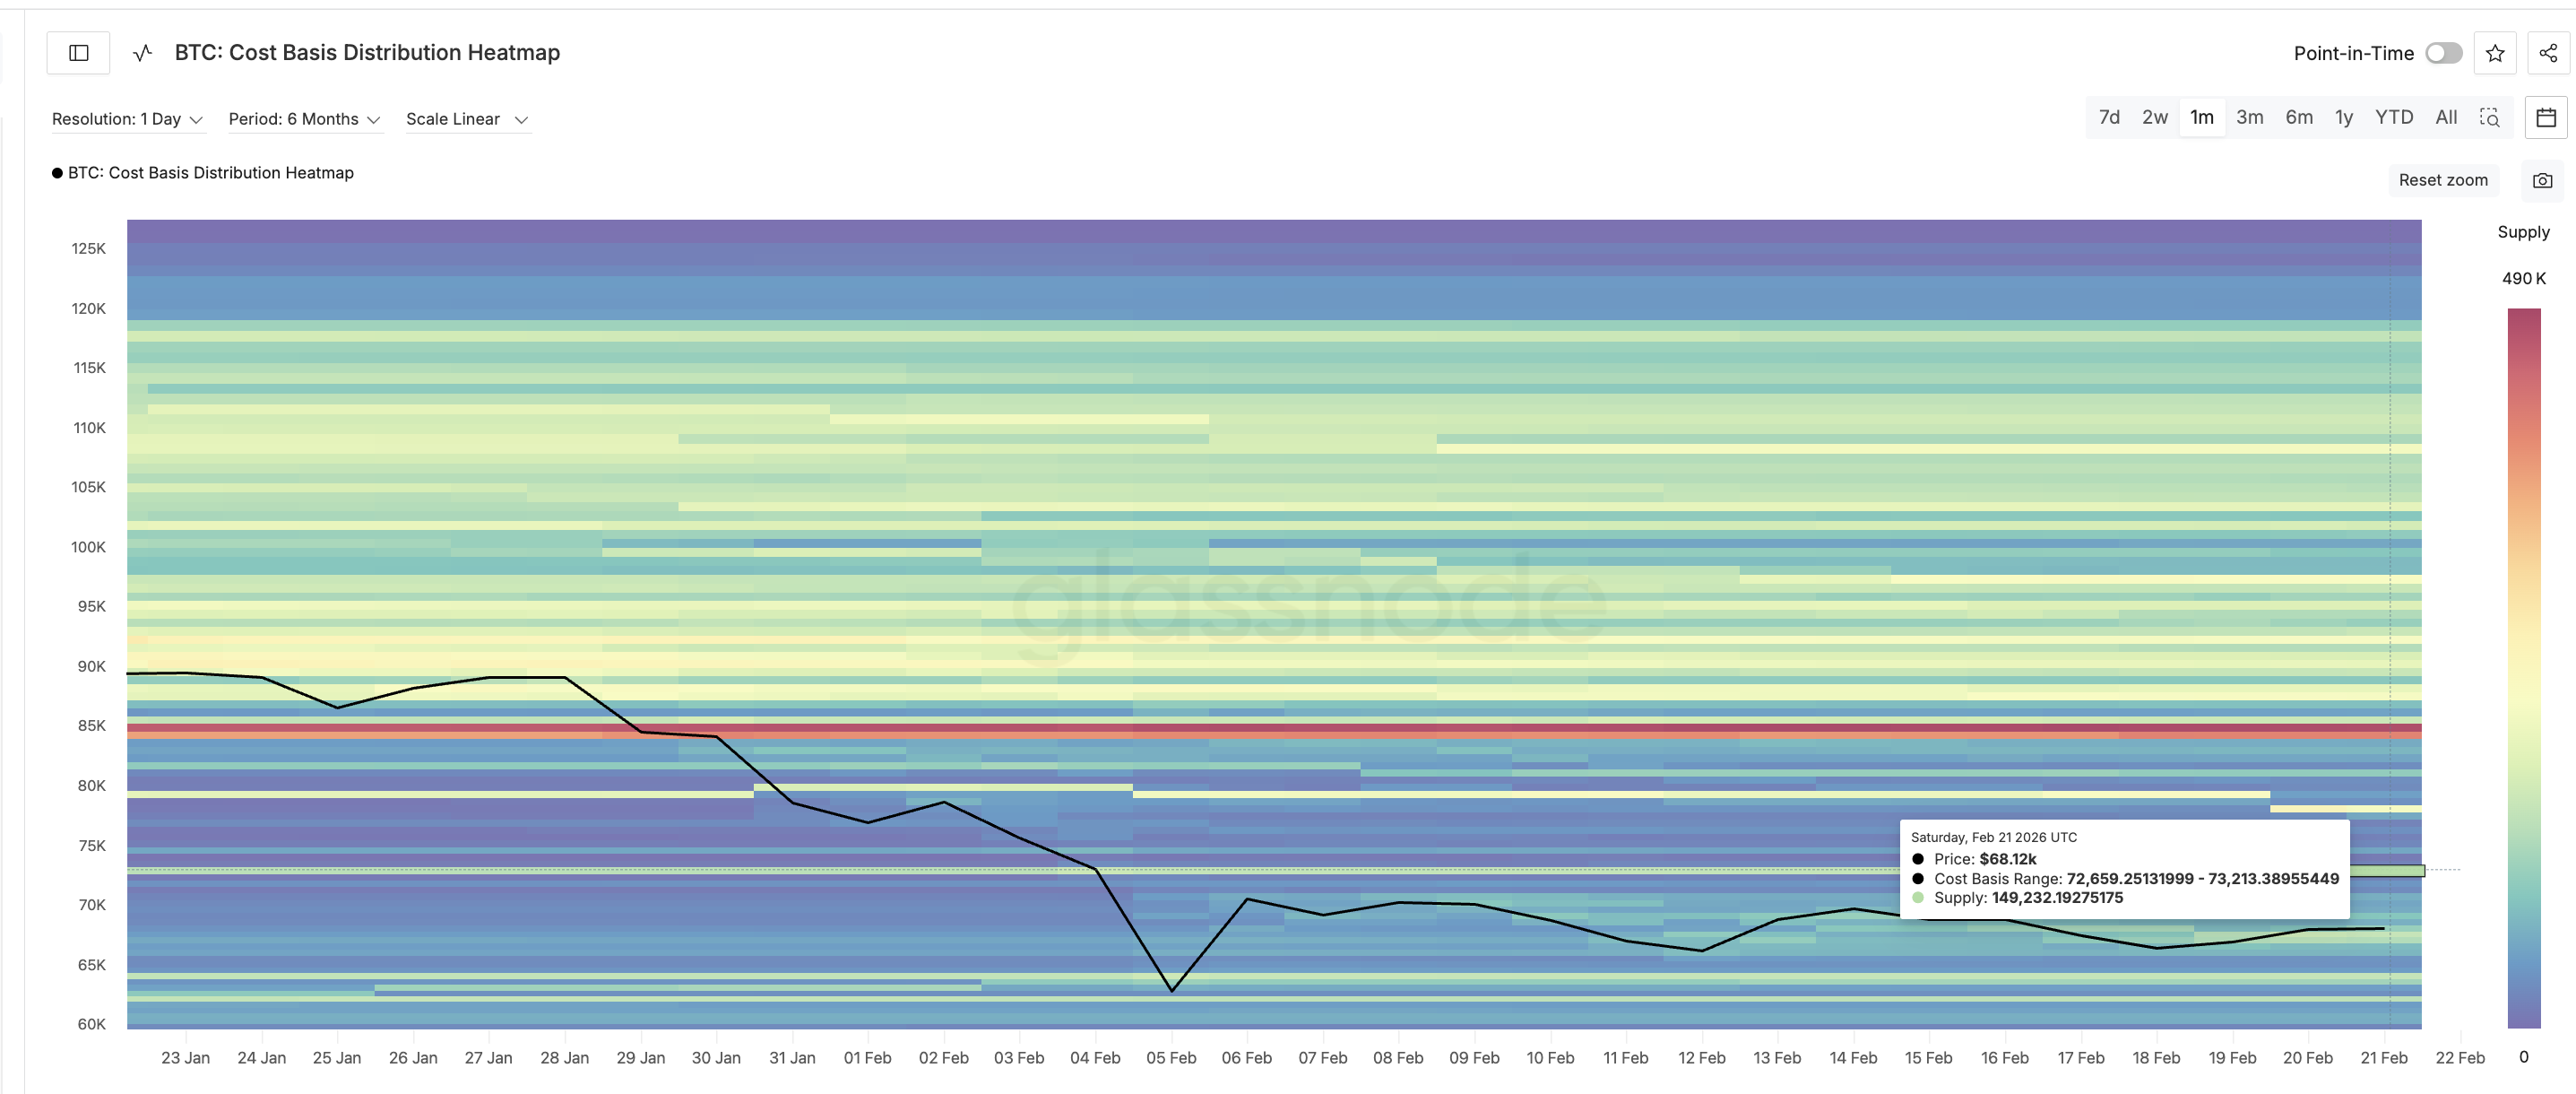
When Bitcoin approaches this area, many holders may sell to exit at breakeven. And the whale accumulation strength, as seen, isn’t strong enough to absorb the supply yet. This selling pressure creates a strong barrier that prediction markets may be underestimating.
Bitcoin Price Structure Shows BTC May Remain Trapped Between Key Levels
Bitcoin’s price structure closely aligns with these on-chain cost basis clusters.
To reach the $75,000 prediction target, Bitcoin must first break above $72,200. This level represents both technical resistance and is close to one of the largest cost basis clusters on the chart. Breaking this zone would require a rally of more than 6% from current levels.
However, failure to break this resistance increases the likelihood of continued range-bound movement. On the downside, strong support exists between $64,300 and $63,800, where approximately 150,000 BTC were accumulated.
On the Bitcoin price chart, the key support level resembling the zone is $63,300, breaking which would also mean the supply cluster break. Breaking under $63,300 can make the $60,000 zone, the 12% probability bet on Polymarket, come to fruition.
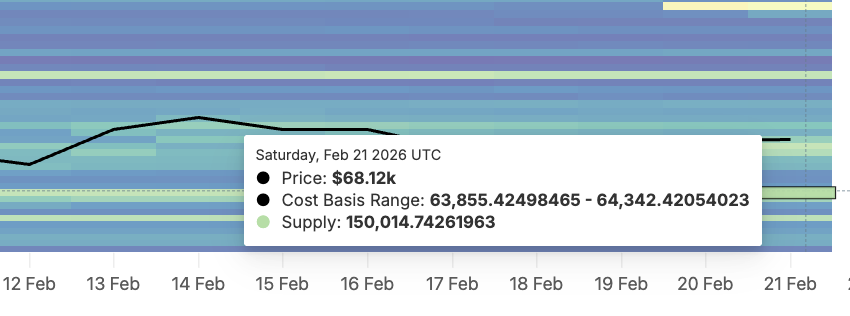
As a result, Bitcoin is currently trapped between two major cost basis zones. Resistance near $72,200 limits upside, while support near $63,300 prevents immediate collapse.
This range-bound structure suggests that prediction markets may be overestimating the probability of a breakout toward $75,000 while underestimating the growing risk of continued consolidation or a correction.

Crypto World
‘Bitcoin to Zero’ Hits Peak Search Interest in the U.S., yet a Clean Bottom Signal Remains Elusive
TLDR:
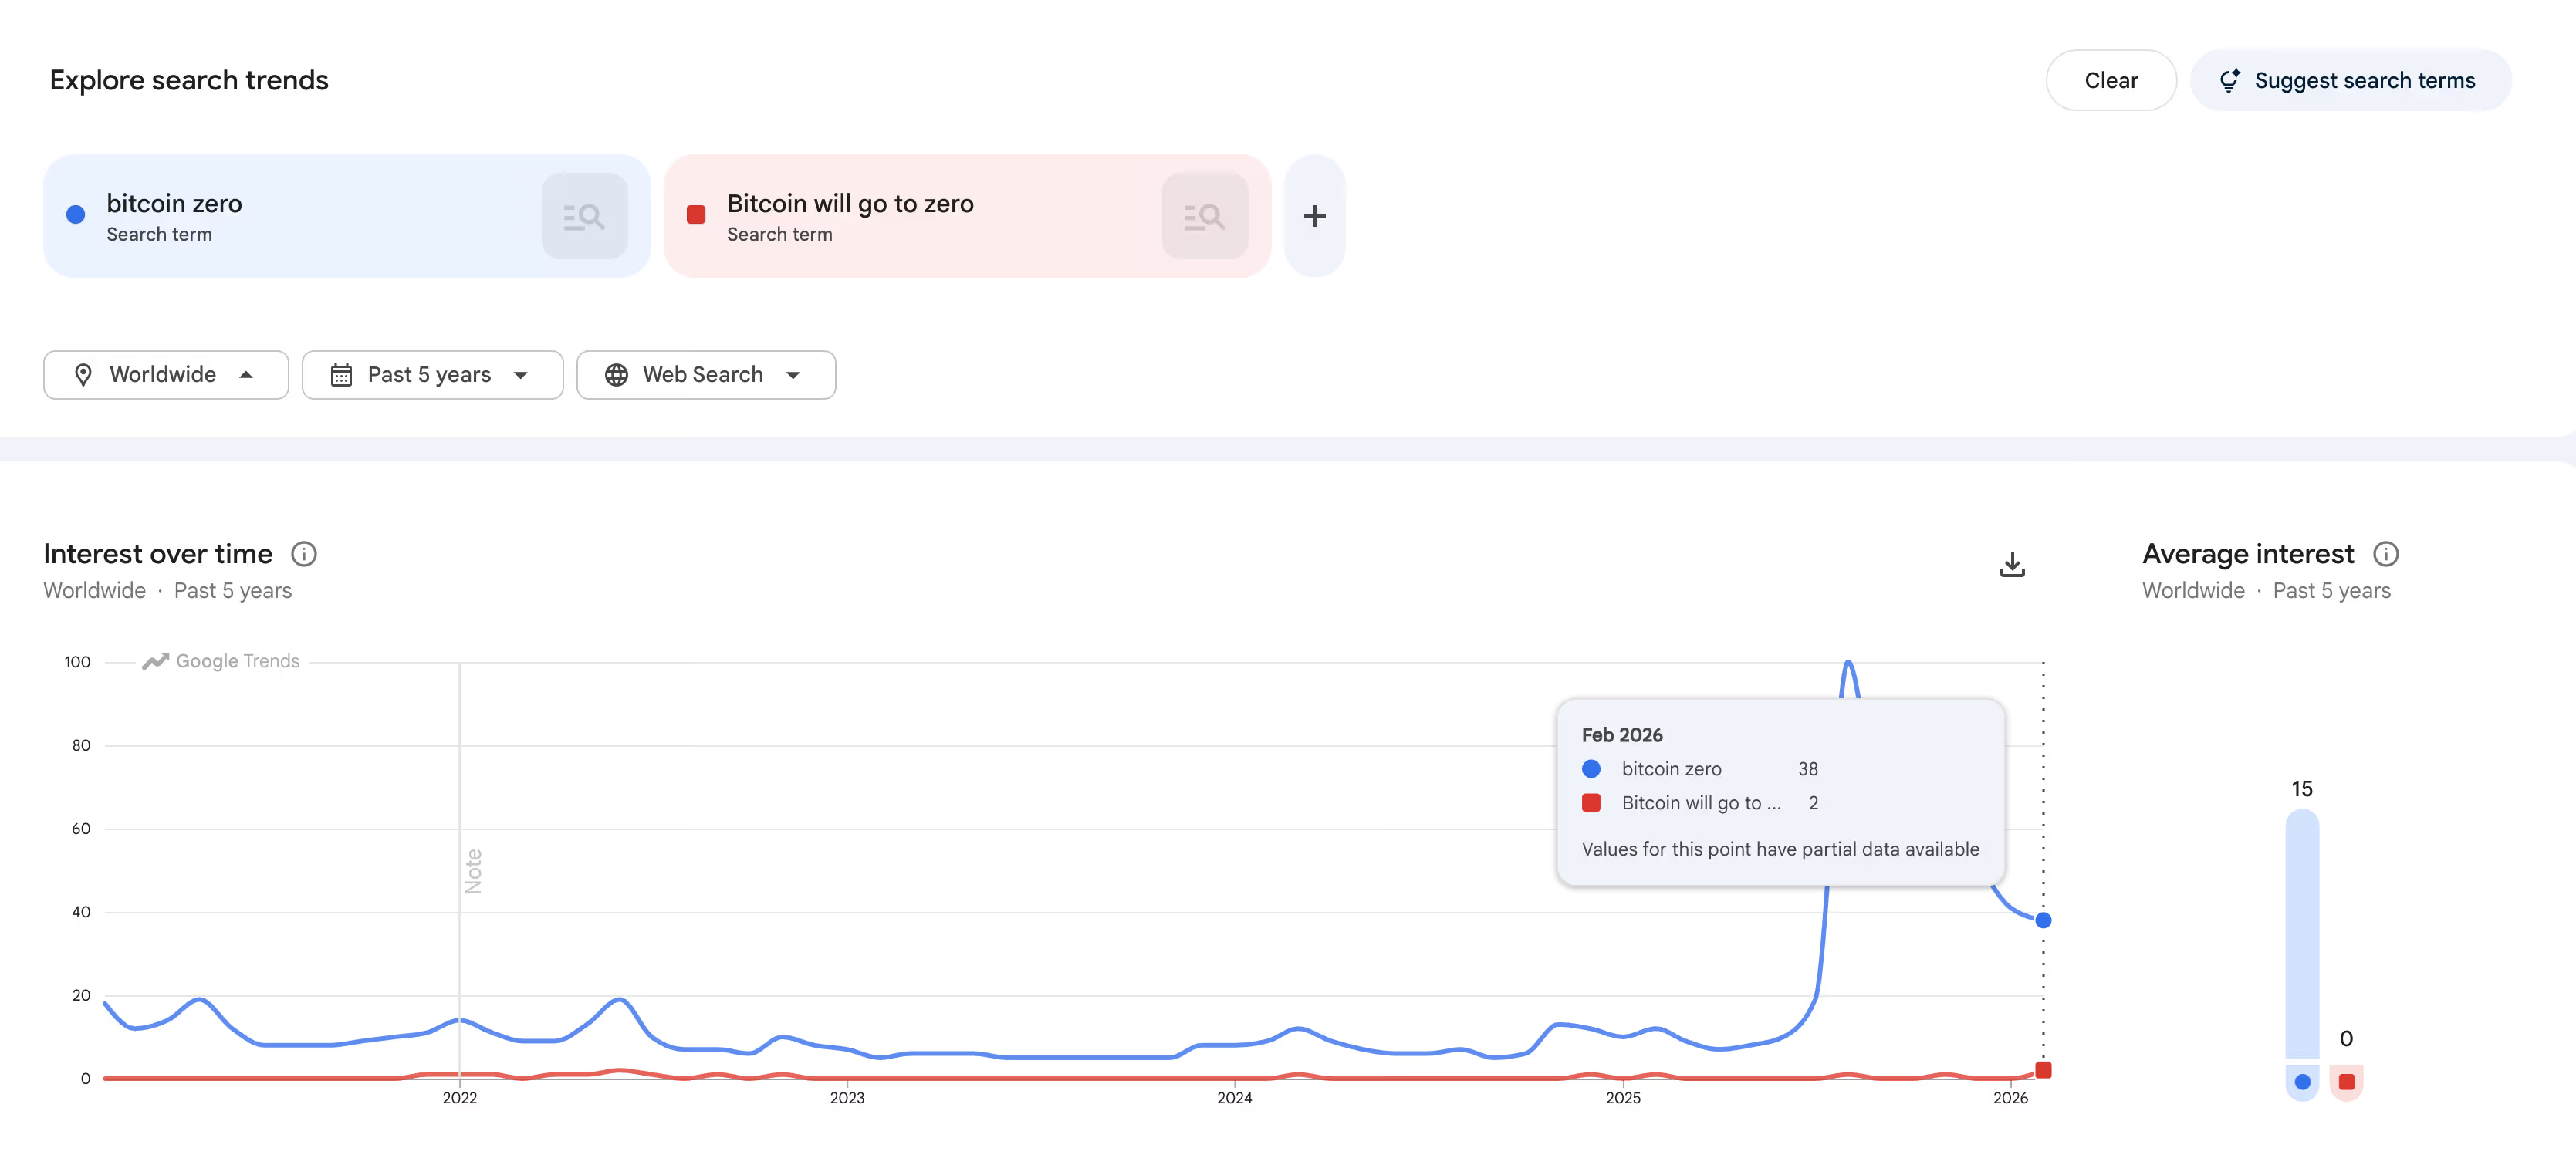
- U.S. searches for ‘bitcoin to zero’ hit a Google Trends score of 100 in February 2026, a record high.
- Global searches for the same term peaked in August 2025 and have since dropped to as low as 38 by February.
- Similar U.S. search spikes in 2021 and 2022 coincided with local Bitcoin price bottoms, but context has shifted.
- Google Trends measures relative interest, not raw volume, making the current spike harder to compare with past cycles.
‘Bitcoin to zero‘ searches in the U.S. surged to a record high in February 2026, as BTC slid toward $60,000. Google Trends data showed the term scored 100 on its relative interest scale this month.
The move followed a 50%-plus drawdown from Bitcoin’s October all-time high. Global searches for the same term, however, have been falling since peaking in August.
That split between domestic and worldwide data keeps the bottom signal mixed rather than conclusive.
U.S. Searches Hit Record Highs as Domestic Fear Builds
‘Bitcoin to zero’ searches in the U.S. reached their highest recorded level in February on Google Trends. The spike coincided directly with Bitcoin’s sharp decline toward the $60,000 price level.
U.S.-specific catalysts appear to be amplifying retail anxiety more than broader global sentiment. Tariff escalation, Iran tensions, and a domestic equity risk-off rotation have all weighed on investor mood.
Globally, the same search term peaked at a score of 100 back in August 2025. By February 2026, worldwide interest in the term had cooled to as low as 38.

That contrast between U.S. and global data points to fear that is regionally concentrated. Holders in Asia and Europe are navigating Bitcoin’s drawdown within an entirely different news environment.
Historically, similar U.S. search spikes in 2021 and 2022 aligned with local price bottoms. Traders familiar with those cycles have often treated elevated fear searches as a contrarian buy indicator.
However, the current environment differs from those earlier periods in meaningful ways. Bitcoin’s mainstream visibility and retail base have expanded considerably since then.
The global cooling trend complicates any straightforward bottom call based on U.S. searches alone. When worldwide fear is declining while domestic fear is rising, the signal lacks international confirmation.
That does not eliminate the possibility of a local reversal, but it reduces conviction. A mixed bottom signal requires more evidence before the case becomes compelling.
Methodology and Market Context Keep the Signal Inconclusive
Google Trends measures relative interest on a scale of 0 to 100, not raw search volume. A score of 100 simply means the term reached its own peak within the selected time window.
It does not confirm that more people searched the term in absolute terms compared to 2022. Against a much larger Bitcoin user base today, that distinction carries real analytical weight.
Bitcoin’s U.S. retail audience has grown substantially since the last major bear market cycle. A relative spike measured against a higher baseline does not carry the same weight as before.
Retail fear is clearly elevated, but elevated fear alone does not guarantee a trend reversal. Analysts recommend pairing this data with on-chain metrics before drawing firm conclusions.
The absence of a matching global fear spike keeps the contrarian case incomplete as of February. U.S. retail anxiety is real and measurable, but it remains a regional rather than a universal signal.
Prior cycles where searches and price bottoms aligned featured more synchronized global sentiment. That synchronization is currently missing from the data.
The ‘bitcoin to zero’ search spike does confirm that U.S. retail pressure is building. Whether that pressure marks a durable floor or simply reflects localized panic remains unclear.
Market participants continue watching for additional on-chain and global sentiment confirmation. Until those signals align, the bottom call stays mixed.


According to former Goldman Sachs executive and macro investor Raoul Pal, the answer depends less on sentiment and more on liquidity.
Raoul Pal says signals are beginning to align in a way that historically precedes explosive upside moves.
Is Bitcoin About to Reprice To $140,000 Far Sooner Than The Market Expects?
Raoul Pal argues that Bitcoin is currently trading at a “deep discount” to global liquidity conditions. In previous cycles, similar gaps between liquidity expansion and price have not been resolved gradually. They have closed violently.
“If that gap closes,” he suggests, Bitcoin does not grind higher — it snaps into a higher range.
At the center of Pal’s thesis is a potential liquidity inflection point in Q1 2026. Several macro forces are converging at once.
First, changes to bank regulations, particularly adjustments to the Enhanced Supplementary Leverage Ratio (ESLR). According to Pal, this may allow banks to absorb more government debt without constraining their balance sheets.
That effectively gives the US Treasury greater flexibility to monetize deficits, increasing system-wide liquidity.
Second, Treasury General Account (TGA) dynamics are in focus. Historically, when the TGA is drawn down, liquidity quickly flows back into markets. Pal believes that the process is likely to accelerate.
Layer on a weakening US dollar, often a signal of easier financial conditions, and expanding liquidity from China’s balance sheet, and the backdrop becomes more supportive for risk assets.
According to Pal, liquidity is already improving faster than markets are pricing in. His rough estimate? If Bitcoin were to realign with prevailing liquidity conditions, the price would be closer to $140,000.
“…[based on liquidity models, Bitcoin] should be closer to $140,000 [if historical relationships hold],” he said.
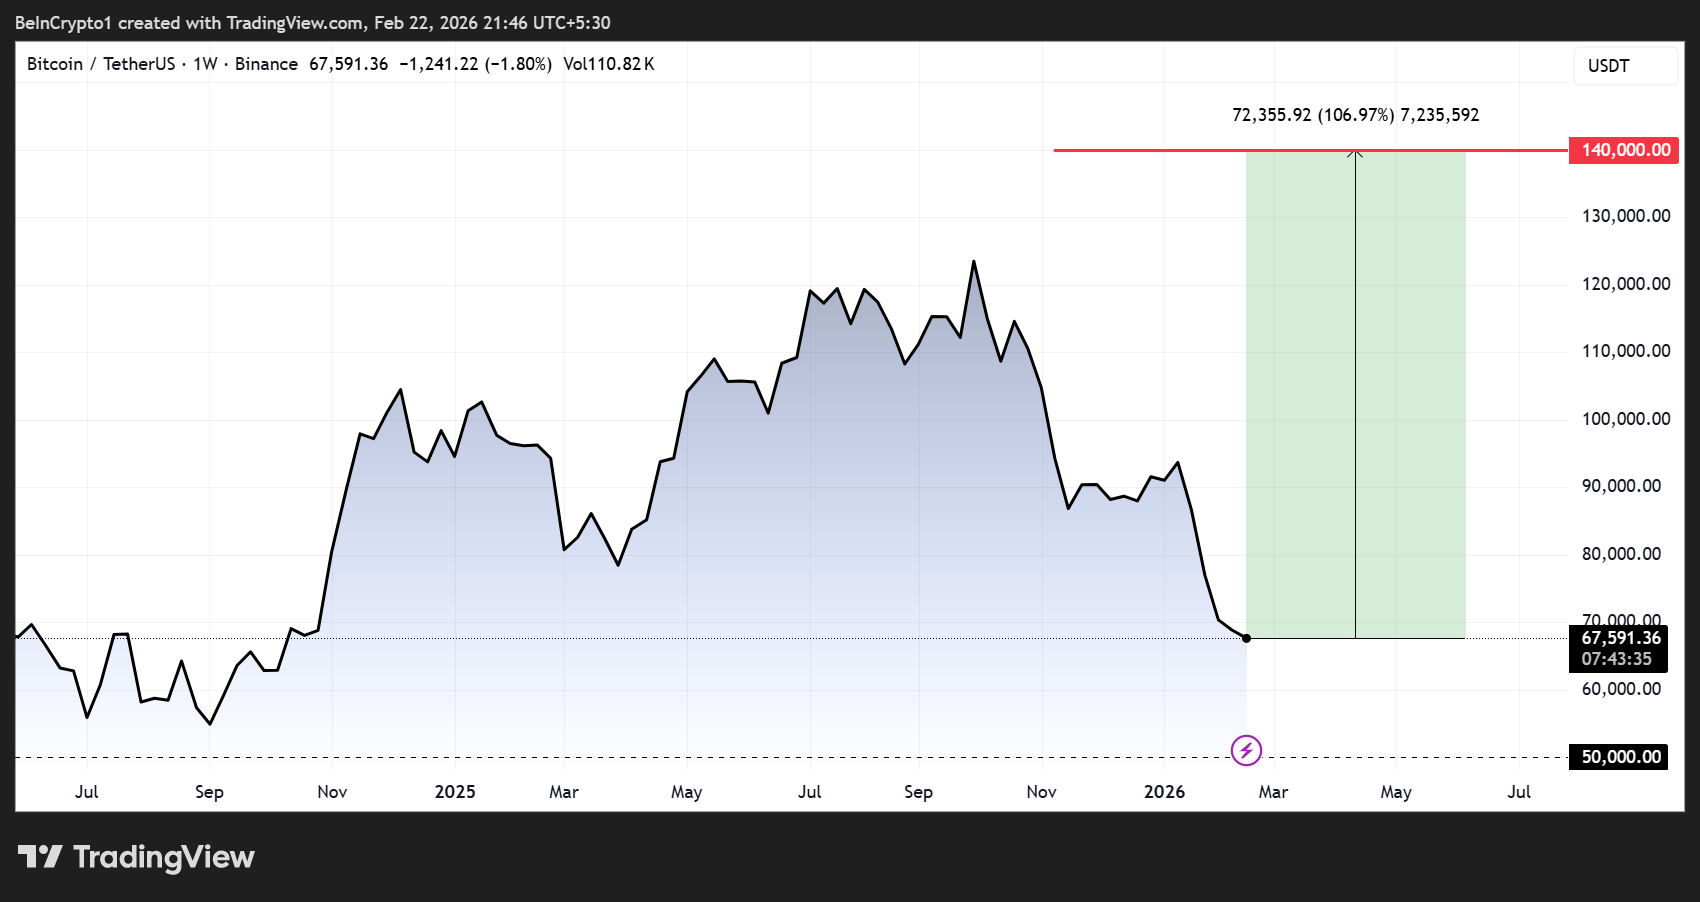
A move to $140,000 would represent a 106% increase in Bitcoin’s price from current levels.
Business Cycle Confirmation
Pal also points to forward-looking indicators tied to the business cycle, particularly the Institute for Supply Management (ISM). In his framework, financial conditions lead ISM by roughly nine months, with global liquidity following shortly after.
The data he tracks suggests ISM could strengthen meaningfully this year, signaling an improving growth environment. These data, listed below, could all contribute to rising confidence and lending activity.
- Fiscal stimulus
- Tax incentives for fixed asset investment
- Capital expenditure on data centers and energy infrastructure, and
- Potential mortgage rate relief
If growth expectations rise while liquidity expands, Bitcoin and other high-beta assets have historically outperformed.
The October 10 Overhang
Yet despite these improving conditions, Bitcoin has lagged. Pal traces that disconnect to the October 10 liquidation cascade, a structural event he believes damaged market plumbing.
Unlike traditional equity flash crashes, crypto lacks regulatory safeguards to cancel trades. During the cascade, forced deleveraging coincided with exchange API disruptions, temporarily removing market makers and liquidity providers. Prices fell further than fundamentals justified.
Pal speculates that exchanges may have stepped in to absorb forced selling, later unwinding positions algorithmically during peak liquidity hours.
Combined with widespread call-selling strategies clustered around the $100,000 strike, often tied to yield products, the result was sustained upside suppression.
However, he believes that the overhang is now fading.
The “Banana Zone” Setup
Pal refers to the final acceleration phase of a crypto cycle as the “Banana Zone” —a nonlinear repricing driven by liquidity, improving growth, and renewed capital inflows.
Before that phase begins, markets typically digest prior volatility and clear structural resistance levels. The $100,000 zone, he argues, is both psychological and structural. Once call-selling pressure eases and positioning remains cautious, the setup for an upside shock strengthens.
Liquidity, in Pal’s view, leads price. By the time consensus turns bullish, the move may already be underway.
If global refinancing pressures force further liquidity injections into the system, Bitcoin, which he describes as a “global liquidity sponge,” could respond quickly.
And if the gap between liquidity and price closes, $140,000 may not be a stretch target. It may simply be where the market was always headed.
Bitcoin (BTC) bottomed after CME futures speculators turned net bullish in April 2025. A similar positioning shift is resurfacing in 2026, raising the odds of a BTC price recovery in the coming weeks.
Key takeaways:
BTC futures, technicals hint at $85,000 price target
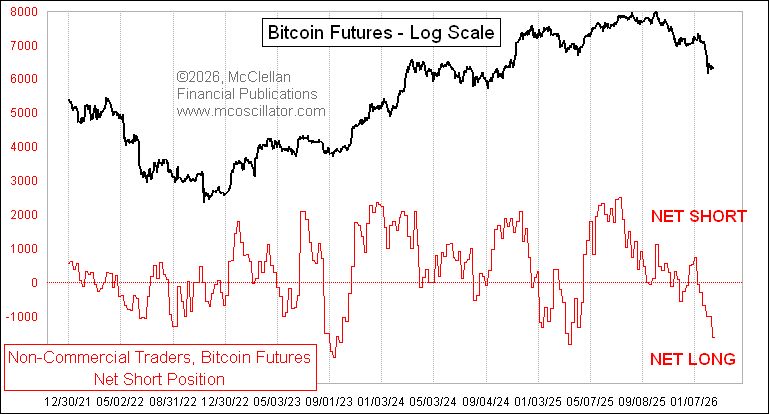
Non-commercial Bitcoin futures traders cut their net position to about -1,600 contracts from roughly +1,000 a month earlier, according to the CFTC Commitment of Traders (COT) report published last week.

In practice, this means that large speculators, including hedge funds and similar financial institutions, have shifted from net short to long, with bulls outnumbering bears on the CME.
The rapid net-short unwind implies that “smart money” added longs “with some urgency,” said analyst Tom McClellan, while pointing to two similar past swings that preceded Bitcoin price bottoms.
For instance, BTC’s price gained around 70% after a sharp dip in CME Bitcoin futures net shorts in April 2025. In 2023, BTC price rose by over 190% under similar futures market conditions.

As of February, the smart money swing is flashing once again, just as Bitcoin defends its 200-week exponential moving average (200-week EMA, the blue line), which has acted as a bear-market floor in most major drawdowns of the last decade.
On Sunday, BTC’s 200-week EMA was hovering around near $68,350.

The last time Bitcoin traded around this moving average during deep sell-offs (in 2015, 2018 and 2020), it eventually marked the end of the downtrend and the start of a new recovery phase.
Related: Bitcoin historical price metric sees $122K ‘average return’ over 10 months
Bitcoin’s weekly relative strength index (RSI) remains in oversold territory, a sign that selling pressure is nearing exhaustion.
That further raises Bitcoin’s odds of recovering in the coming weeks. A decisive rebound from the 200-week EMA could trigger a run-up toward the 100-week EMA (the purple wave) at roughly $85,000 by April.
Bitcoin bulls aren’t out of the woods yet
McClellan cautioned that the smart money shift is “a condition, not a signal,” meaning Bitcoin could still slide from its current price levels before a durable low forms.
That may trigger the 2022 scenario, wherein BTC plunged by over 40% after breaking below its 200-week EMA despite similar oversold conditions.

A repeat of that 40% plunge in 2026 could result in BTC prices falling toward $40,000, or 60% from its record high of around $126,270.
Some analysts, including Kaiko, also see BTC potentially bottoming around $40,000–$50,000 based on its “four-year cycle” framework.
This article does not contain investment advice or recommendations. Every investment and trading move involves risk, and readers should conduct their own research when making a decision. While we strive to provide accurate and timely information, Cointelegraph does not guarantee the accuracy, completeness, or reliability of any information in this article. This article may contain forward-looking statements that are subject to risks and uncertainties. Cointelegraph will not be liable for any loss or damage arising from your reliance on this information.

TLDR:
- Nakamoto Inc. purchased 5,398 BTC near Bitcoin’s $118K peak, now sitting on $270M in unrealized losses.
- The $23.6B market cap wipeout marks one of the steepest corporate Bitcoin treasury collapses in crypto history.
- A reverse takeover structure helped launch $NAKA’s Bitcoin strategy but accelerated losses as sentiment shifted fast.
- The 99% drop in 280 days is pushing institutional investors to reconsider single large Bitcoin purchases near cycle tops.
$23.6 billion in market value has been wiped from Nakamoto Inc. ($NAKA) in just 280 days. The company purchased 5,398 Bitcoin near the asset’s all-time high of $118,000.
That single decision now carries $270 million in unrealized losses. The market capitalization collapse of 99% has stunned both retail and institutional observers.
This ranks among the most damaging corporate Bitcoin treasury bets on record.
How a Bold Bitcoin Bet Became a $23.6B Collapse
The scale of the $23.6 billion market cap erasure did not happen overnight. Nakamoto Inc. built its Bitcoin reserve strategy through a reverse takeover structure.
That approach generated early momentum and brief investor enthusiasm around the stock. As Bitcoin retreated from peak levels, however, the company’s valuation followed in dramatic fashion.
Buying 5,398 BTC at approximately $118,000 per coin left the company extremely vulnerable to any price correction. There was no phased entry, no cost-averaging approach, and no visible downside buffer in place.
When prices moved against the position, the losses compounded quickly across 280 days. The result was a near-total destruction of shareholder value.
Analyst @wiseadvicesumit captured the situation plainly, writing that “conviction is powerful” but “timing is brutal.”
The post described this as what happens when “number go up forever” meets reality. That framing resonated widely across crypto communities and financial circles. Many observers pointed to the entry price as the single most critical failure in the entire strategy.
The $270M Loss That Is Reshaping Corporate Crypto Strategy
The $270 million sitting in unrealized losses represents more than a balance sheet problem for Nakamoto Inc. It signals a broader warning for any corporate treasury considering large, concentrated Bitcoin positions.
Crypto commentator @nice_investment described the collapse as “one of the most expensive timing errors in crypto history.” That assessment is difficult to argue against, given the numbers involved.
The use of a reverse takeover to establish the Bitcoin reserve drew significant attention at launch. It positioned Nakamoto Inc. as an aggressive, conviction-driven institutional player in the crypto space.
Yet the same structure that amplified early excitement also accelerated the downside when sentiment shifted. The $23.6 billion erasure now follows that story wherever it is told.
Corporate treasury teams across the industry are watching this outcome carefully. Single large purchases near market cycle peaks have historically produced poor returns across multiple Bitcoin cycles.
This case adds a striking new data point to that pattern. Going forward, phased entry strategies and defined risk thresholds are likely to gain more favor among institutions entering the Bitcoin market.


Coinbase, Binance, and BlackRock collectively hold millions of BTC, which reveals centralized power amid decentralized cryptocurrency narratives.
Bitcoin’s pseudonymous creator, Satoshi Nakamoto, remains the largest single holder of the cryptocurrency, controlling approximately 1.1 million BTC. This adds up to roughly 5.5% of the total supply. At current market prices, this stake is worth around $75 billion, dwarfing the holdings of even the largest corporate and institutional players.
Despite years of speculation about potential movement from these early-mined addresses, Nakamoto’s BTC have largely remained untouched since the asset’s inception.
Bitcoin’s Top Holders Revealed
Following Nakamoto in the rankings is the US-based exchange Coinbase, which holds 993,069 BTC on-chain, equivalent to 5% of the total supply. These funds represent a combination of client deposits and corporate reserves, including liquidity kept on hand to satisfy withdrawals. Its rival, Binance, controls 661,000 BTC under custody, which accounts for 3.15% of the total supply.
The institutional sector is also staking its claim. Arkham Intelligence data revealed that BlackRock is the largest institutional holder, with 761,801 BTC. This stash is worth around $52 billion. ETF issuers and other asset managers such as Fidelity and Grayscale also maintain significant positions, though some of their holdings are routed through omnibus custodial accounts, which makes direct attribution slightly less transparent. For example, Fidelity Custody appears to hold 448,000 BTC. Meanwhile, some of Strategy’s corporate holdings, which total 715,000 BTC, are reflected on-chain under Fidelity due to their custodial method.
Besides Strategy, other publicly traded entities, including mining firm MARA and Japanese firm Metaplanet, have also acquired meaningful stakes. Additionally, private companies round out the largest holders. Popular stablecoin issuer Tether has 96,369 BTC and SpaceX holds 8,300 BTC as of August 2025.
Nations Stockpiling Bitcoin
While entities like BlackRock and Coinbase hold vast amounts, governments like the United States, which leads the list with 328,000 BTC, aren’t far behind. Most of this came from asset seizures, including coins recovered from the Bitfinex hack, the Silk Road marketplace, and its hacker James Zhong. More recently, the US government also acquired 127,000 BTC from the LuBian Hacker address.
Next up is the United Kingdom with 61,245 BTC, largely seized by the UK Metropolitan Police from Jian Wen and Zhimin Qian in 2018. China’s authorities have also confiscated 194,775 BTC from the PlusToken Ponzi scheme in 2020, though it is unclear if the Chinese government still holds these coins or has sold them.
You may also like:
Ukraine has also seen significant Bitcoin involvement. Since the Russian-Ukrainian conflict, the country received $22.8 million in BTC donations. More than 700,000 Ukrainian public officials have declared owning Bitcoin, with some holding up to 18,000 BTC, totaling almost 46,351 BTC.
Germany seized 50,000 BTC from a movie piracy website called Movie2k in January 2024, but these coins were fully sold by July 2024.
Binance Free $600 (CryptoPotato Exclusive): Use this link to register a new account and receive $600 exclusive welcome offer on Binance (full details).
LIMITED OFFER for CryptoPotato readers at Bybit: Use this link to register and open a $500 FREE position on any coin!
Crypto World
U.S. Treasuries Go Crypto: How the $10 Billion Milestone Is Rewriting the Rules of Government Debt
TLDR:
- Tokenized U.S. Treasuries crossed $10 billion in 2026, outpacing projections and leading the $25 billion RWA market.
- SEC-approved DTCC deployment of tokenized Treasuries on Canton Network signals full regulatory backing for on-chain government debt.
- JPMorgan’s “MONY” fund connects institutional stablecoin access directly to Ethereum-based U.S. Treasury yield products.
- NYSE and LSEG are racing to launch 24/7 on-chain trading platforms built around instant atomic settlement of Treasuries.
Tokenized U.S. Treasuries have crossed the $10 billion threshold in 2026, marking a major turning point for blockchain-based government securities.
This milestone places Treasuries at the center of the broader tokenized real-world asset market, which now sits above $25 billion excluding stablecoins.
Institutions that spent years testing the technology are now committing real capital at scale. With some analysts projecting the Treasury segment alone could reach $100 billion by year-end, the pace of growth is drawing serious attention across global financial markets.
Tokenized Treasuries Are Now Leading the Entire Real-World Asset Market
U.S. Treasuries have emerged as the dominant asset class within the tokenized real-world asset space. Their government backing, liquidity, and yield profile make them a natural fit for on-chain financial products.
Institutions managing large pools of capital are using tokenized Treasuries as a stable, yield-generating base layer in digital asset portfolios.
The Depository Trust & Clearing Corporation is actively deploying tokenized Treasuries on the Canton Network with SEC approval already in place.
As @subjectiveviews noted, this move confirms that regulators are no longer holding institutions back — they are actively clearing the runway. That regulatory posture is directly encouraging more capital to flow into Treasury-backed tokenized instruments.
The $10 billion figure is not a ceiling — it reflects where the market stands today amid an accelerating adoption curve.
Exchanges like NYSE and LSEG are simultaneously building 24/7 on-chain trading infrastructure with instant settlement capabilities.
Together, these developments are creating a continuous, liquid market for tokenized government securities that did not exist two years ago.
Major Banks Are Building Products Around Tokenized Treasury Infrastructure
JPMorgan’s launch of “MONY” in late 2025 brought tokenized money market exposure to institutional clients through an Ethereum-based fund.
The product offers stablecoin-compatible access to yields backed by short-duration government instruments, including Treasuries.
That move by one of the largest U.S. banks added significant credibility to Treasury tokenization as a viable institutional product category.
BNY Mellon, Citigroup, Lloyds, and Société Générale are also issuing tokenized deposits and digital bonds that interact with government securities markets.
Their collective participation shows that Treasury tokenization is no longer isolated to fintech experiments. These are established financial institutions reallocating operational resources toward blockchain-based settlement systems.
Ant International is separately advancing tokenized cross-border payment infrastructure built on global standards, which also channels demand toward stable tokenized assets like Treasuries.
@subjectiveviews described 2026 as “the consolidation year: pilots turning live, regulations clearing the path, shifting from experiments to core infrastructure.”
Faster settlement, atomic trading, and around-the-clock liquidity are now operational realities rather than future projections.
The $10 billion Treasury milestone is, by most measures, only the opening chapter of a much larger structural shift in how government debt is issued, traded, and held globally.
TLDR:
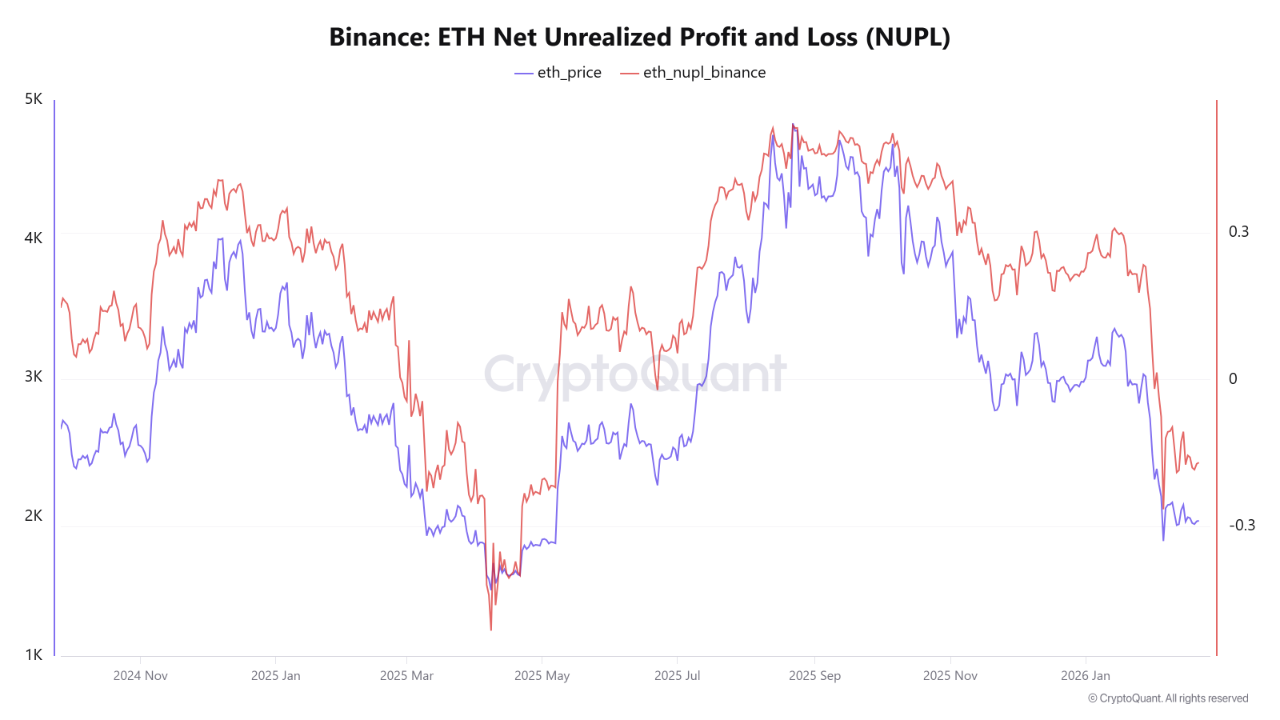
- Ethereum NUPL on Binance has fallen to -0.1689, marking its lowest recorded value in approximately nine months.
- A negative NUPL reading shows most Binance ETH reserves are currently sitting in unrealized loss territory near $1,973.
- The last comparable NUPL dip on Binance occurred around May 2024, during a sharp digital asset market correction.
- Historically, deep negative NUPL levels on Binance have been associated with reduced selling pressure and potential accumulation zones.
Ethereum NUPL on Binance has fallen to its lowest point in about nine months. The Net Unrealized Profit/Loss indicator is currently sitting near a value of -0.1689 on the exchange.
This places a considerable portion of Binance’s Ethereum reserves in unrealized loss territory. Ethereum is trading at approximately $1,973 at the time of writing.
The reading is drawing attention from market participants monitoring sentiment on the world’s most liquid crypto exchange.
What the Negative NUPL Reading Signals for Ethereum Holders on Binance
The Ethereum NUPL on Binance measures whether coins held in the exchange’s reserves sit in unrealized profit or loss.
It does not track the broader Ethereum network as a whole. Rather, it focuses solely on Binance’s reserve activity, offering exchange-specific sentiment data.
A negative reading like -0.1689 shows that most Ethereum held on Binance is currently at a loss. Historically, this type of reading tends to slow selling pressure on the market. Traders holding unrealized losses are less inclined to sell and lock those losses in.
Source: Cryptoquant
This shift matters because Binance is the world’s most liquid cryptocurrency exchange by volume. Activity on its platform carries outsized influence over broader market dynamics.
Binance processes billions in daily trading volume, making its reserve data particularly relevant. When its holders move into loss territory, the behavioral response often differs from what broader network data shows.
The NUPL chart therefore gives analysts a sharper picture of exchange-level positioning. It complements other on-chain tools by narrowing the focus to one key venue.
Analysts tracking exchange-specific data often prioritize this reading when assessing short-term market dynamics. For those watching selling pressure, the current negative reading is a notable development worth tracking.
How This Reading Compares to Historical Levels and What It Could Mean
The last time Ethereum NUPL on Binance registered similarly low values was around May 2024. That period coincided with a sharp market correction and widespread weakness in digital asset prices.
Since that point, the indicator largely recovered and traded near zero or above.
The return to negative territory today stands out against that backdrop. Over the past nine months, this represents one of the more pronounced dips recorded by the indicator.
That context adds weight to the current reading beyond just the number itself.
Some market participants historically associate these levels with potential accumulation zones. However, a negative NUPL reading alone does not confirm a price bottom has formed. It reflects current unrealized loss conditions within Binance reserves, nothing more and nothing less.
Traders and analysts continue to watch this metric as one data point among many. The current reading shows holders on Binance are underwater on their positions.
Whether that leads to accumulation or further pressure remains to be seen in the days ahead.
Investor capital is shifting from token launches into publicly listed crypto companies, a trend highlighted by DWF Labs’ research. Drawing on Memento Research data that spans hundreds of token launches across the world’s leading exchanges, the study notes that more than 80% of projects trade below their TGE price, with typical drawdowns of 50% to 70% within roughly 90 days of listing. The pattern appears to be less about ephemeral volatility and more a persistent post-listing dynamic, according to Andrei Grachev, managing partner at DWF Labs, who said most tokens punch a price peak in the first month before a downward drift takes hold.
Key takeaways
- More than eight in ten token projects fall below their TGE price, with 50%–70% declines typically occurring within about 90 days of exchange listing.
- Capital is flowing into crypto equities and regulated markets, as crypto IPOs in 2025 reach around $14.6 billion and M&A activity in the sector tops $42.5 billion.
- The shift is structural, not a temporary market move: institutional buyers prefer governance, disclosure, and the durability of equity-style exposure over pure-token plays.
- The valuation gap between listed crypto equities and token projects persists, driven by accessibility and the inclusion of public shares in indexes and ETFs.
- Investors are gravitating toward the “infrastructure” layer—custody, payments, settlement, and compliance—where an equity wrapper can enable licensing, audits, and distribution through established channels.
Sentiment: Neutral
Price impact: Negative. Tokens frequently trade below their TGE price, with 50%–70% drawdowns within ~90 days of listing, indicating immediate negative price impact for public buyers.
Trading idea (Not Financial Advice): Hold. As capital rotates toward regulated crypto equities, a cautious stance on new token launches and a tilt toward asset classes with predictable governance remains prudent.
Market context: The observed rotation toward publicly traded crypto equities mirrors broader shifts in liquidity and risk sentiment, with institutional participants seeking regulated exposure, clear reporting standards, and the potential for indexes and ETFs to dilute onboarding friction.
Why it matters
For traders and investors, the divergence between token launches and equity-backed crypto ventures signals a bifurcated market where real-world adoption and revenue generation in a project can determine value more reliably than token-only narratives. Tokens that fail to secure steady user growth, fees, transaction volume, and retention often fail to justify premium prices, whereas listed crypto companies can rely on audited financials, governance processes, and enforceable rights to attract capital.
Builders and startups in the ecosystem may now prioritize infrastructure assets—custody solutions, settlement rails, and compliance tooling—over purely token-centered incentives. The “equity wrapper” offers a path to licensing, partnerships, and distribution through traditional financial rails, potentially accelerating real-world deployment of decentralized networks.
The data imply a structural shift rather than a one-off market wobble. While tokens will persist as governance tokens and incentive mechanisms within protocols, the near-term funding environment favors assets with tangible revenue streams and clearer ownership structures.
Market participants should watch for three key indicators in the months ahead. First, the cadence of crypto IPOs and SPACs will reveal whether the interest in regulated exposure persists beyond a single cycle. Second, progress in custody, settlement, and compliance infrastructure will indicate whether traditional rails can be scaled to support broader tokenized ecosystems. Third, the timing of token unlocks and new airdrops will continue to influence near-term price action for newly listed tokens, potentially reintroducing selling pressure even as demand for regulated equity exposure grows. The convergence of these factors will shape how liquidity moves through the crypto economy in the near term.
What to watch next
- Monitoring crypto IPO and SPAC activity in the coming quarters for signs of persistent appetite in regulated markets
- Tracking custody, settlement, and compliance infrastructure progress that could enable broader institutional participation
- Watching token unlock schedules and airdrop cadence for any renewed selling pressure on launch tokens
- Observing whether major exchanges expand regulated product lines (ETFs, ETPs) that channel institutional flows into crypto equities
Sources & verification
- DWF Labs analysis referencing Memento Research data on 2025 token launches
- Comments from Andrei Grachev, managing partner at DWF Labs, on post-listing patterns
- Statements from Maksym Sakharov, co-founder of WeFi, about capital rotation toward infrastructure and equity rails
- Public data on 2025 crypto IPO fundraising (~$14.6 billion) and M&A activity (over $42.5 billion)
Market shift: capital moves toward crypto equities as token launches struggle
Investor capital is increasingly flowing into publicly listed crypto companies as token launches confront a tougher funding environment. The pattern is grounded in a body of data assembled by Memento Research, which surveyed hundreds of token launches across the world’s leading exchanges. The results point to a recurring dynamic: the bulk of projects do not sustain an initial listing premium. More than 80% of token ventures trade below their TGE price, and the typical drawdown ranges from 50% to 70% within about three months after listing. The implications extend beyond daily price moves, signaling a structural preference among large investors for assets that offer governance, transparency, and legal clarity.
Andrei Grachev, managing partner at DWF Labs, frames these findings as evidence of a persistent post-listing reality rather than mere volatility. He notes that most tokens spike in price during the first month after listing, then trend downward as selling pressure mounts from early buyers and early investors seeking to realize gains. “TGE price is the exchange-listed price set before launch. This is the price the token is expected to open at on the exchange, and it reveals how much the price actually changes due to volatility in the first few days,” Grachev explained. The takeaway is not simply about one bad week but about a structural pattern that re-emerges across numerous launches.
The analysis deliberately focused on token launches tied to projects with products or protocols—not memecoins—highlighting a distinction between listings driven by purely speculative interest and those backed by real-world product development. A separate thread in the data points toird as major pressure points for selling, further contributing to the downward price trajectory observed after token listings. In practice, this means a token’s initial post-listing performance often reflects supply dynamics and initial investor expectations more than sustained user activity.
On the other side of the ledger, capital formation in traditional markets tied to the crypto sector has intensified. 2025 saw crypto-related initial public offerings (IPOs) raise roughly $14.6 billion, a sharp increase from the previous year, while merger and acquisition activity in crypto-adjacent businesses surpassed $42.5 billion—the strongest level in five years. DWF’s Grachev stresses that this surge should be read as a rotation rather than a withdrawal of capital from the crypto space. If capital were exiting crypto altogether, the jump in IPOs and M&A would be hard to reconcile with continued token underperformance and a widening disconnect between token valuations and equity valuations.
In the report, public crypto equities such as Circle, Gemini, eToro, Bullish, and Figure are compared with tokenized projects by looking at trailing 12-month price-to-sales ratios. Public equities traded at multiples spanning roughly 7 to 40 times sales, while tokenized peers hovered in the 2 to 16 times range. The valuation gap, according to the authors, is partly a matter of accessibility: many institutional investors—pension funds and endowments among them—are limited to regulated securities markets, and public shares can be incorporated into indexes and exchange-traded funds. This dynamic creates a built-in bid for equity-like crypto exposure, independent of the performance of any single token.
Sakharov of WeFi adds nuance to the narrative, noting that the shift reflects a preference for cleaner ownership, clearer disclosure, and enforceable rights—features more readily associated with equity than with many token models. He argues that capital is moving toward infrastructure plays—custody, payments, settlement, brokerage, and compliance—where the “equity wrapper” can accelerate licensing, audits, partnerships, and distribution channels into real-world markets. The migration does not imply tokens are vanishing; rather, it signals a bifurcation: serious protocols with recognized revenue potential and governance will mature and attract capital, while a long tail of speculative launches face a tougher financing climate.
For users and investors, the divide matters because it reframes how value is assigned in crypto networks. Tokens may continue to power governance and incentive mechanisms, but the presence of audited financials, governance rights, and legal claims offers a degree of accountability that is increasingly appealing to risk-aware institutions. The shift also shapes how builders design networks. Demand for robust custody and compliant settlement systems may become the default expectation for any project seeking institutional participation or licensing opportunities, effectively pushing infrastructure improvements higher up the roadmap.
Market participants should watch for three key indicators in the months ahead. First, the cadence of crypto IPOs and SPACs will reveal whether the interest in regulated exposure persists beyond a single cycle. Second, progress in custody, settlement, and compliance infrastructure will indicate whether traditional rails can be scaled to support broader tokenized ecosystems. Third, the timing of token unlocks and new airdrops will continue to influence near-term price action for newly listed tokens, potentially reintroducing selling pressure even as demand for regulated equity exposure grows. The convergence of these factors will shape how liquidity moves through the crypto economy in the near term.
The crypto bear market seems to be taking form. Bitcoin and Ethereum remain under pressure, with Bitcoin down nearly 24% year-to-date and about 22% year-on-year, while Ethereum has fallen roughly 34% YTD and over 30% across the same period. The broader market continues to reflect weak sentiment.
Yet, BeInCrypto analysts have identified three altcoins that are still posting strong gains in the year-to-date and year-over-year periods, signaling demand and technical structures that appear disconnected from the ongoing bear market.
Bitcoin Cash (BCH)
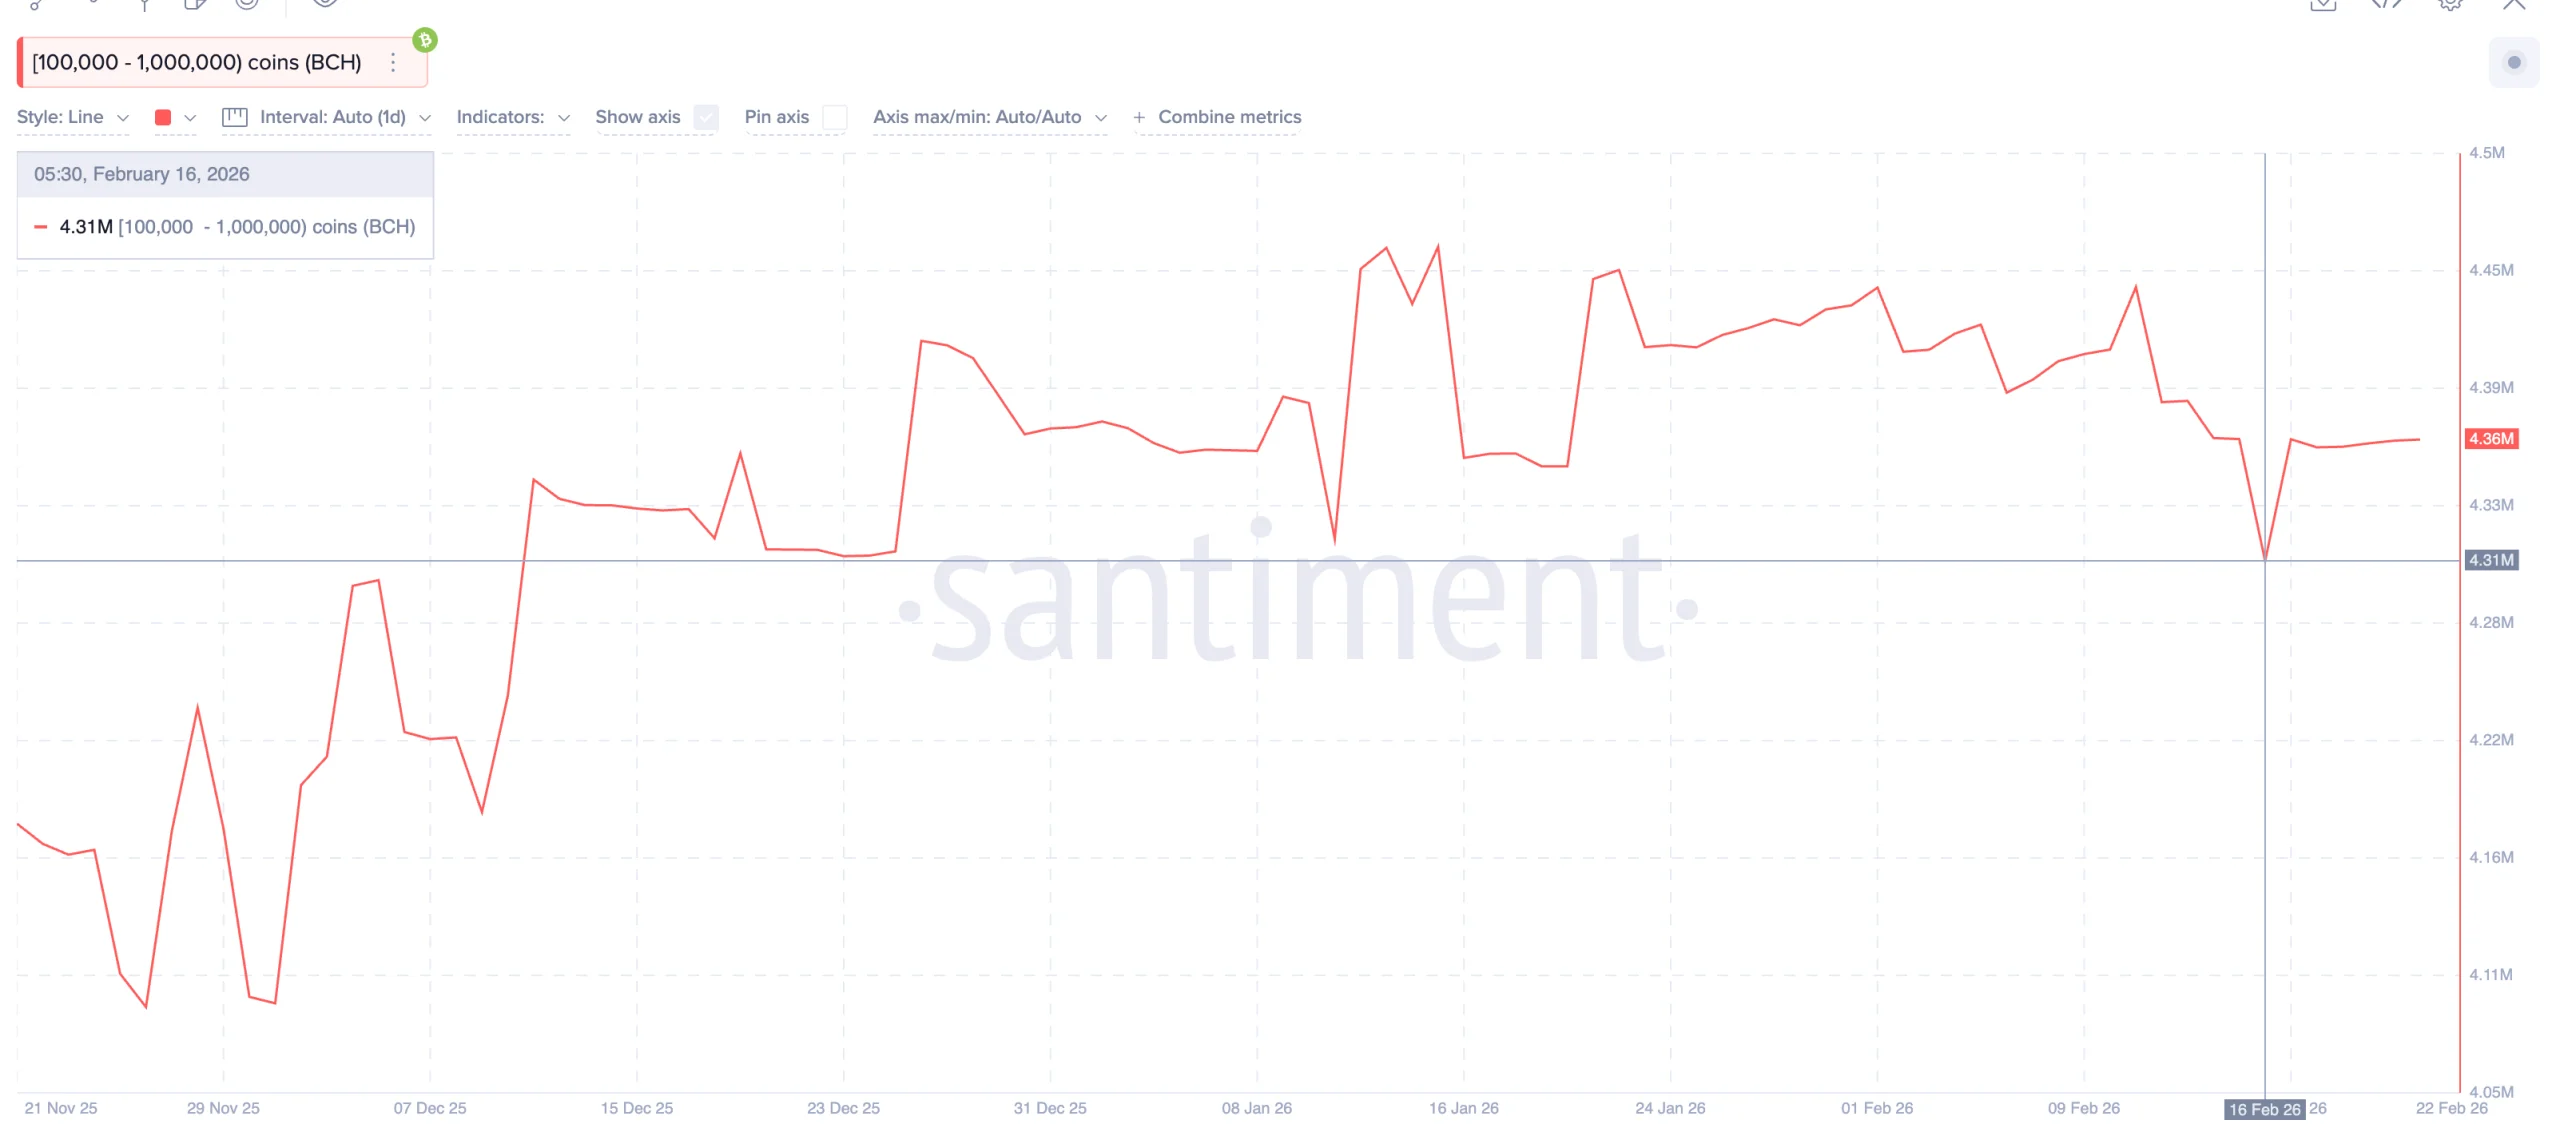
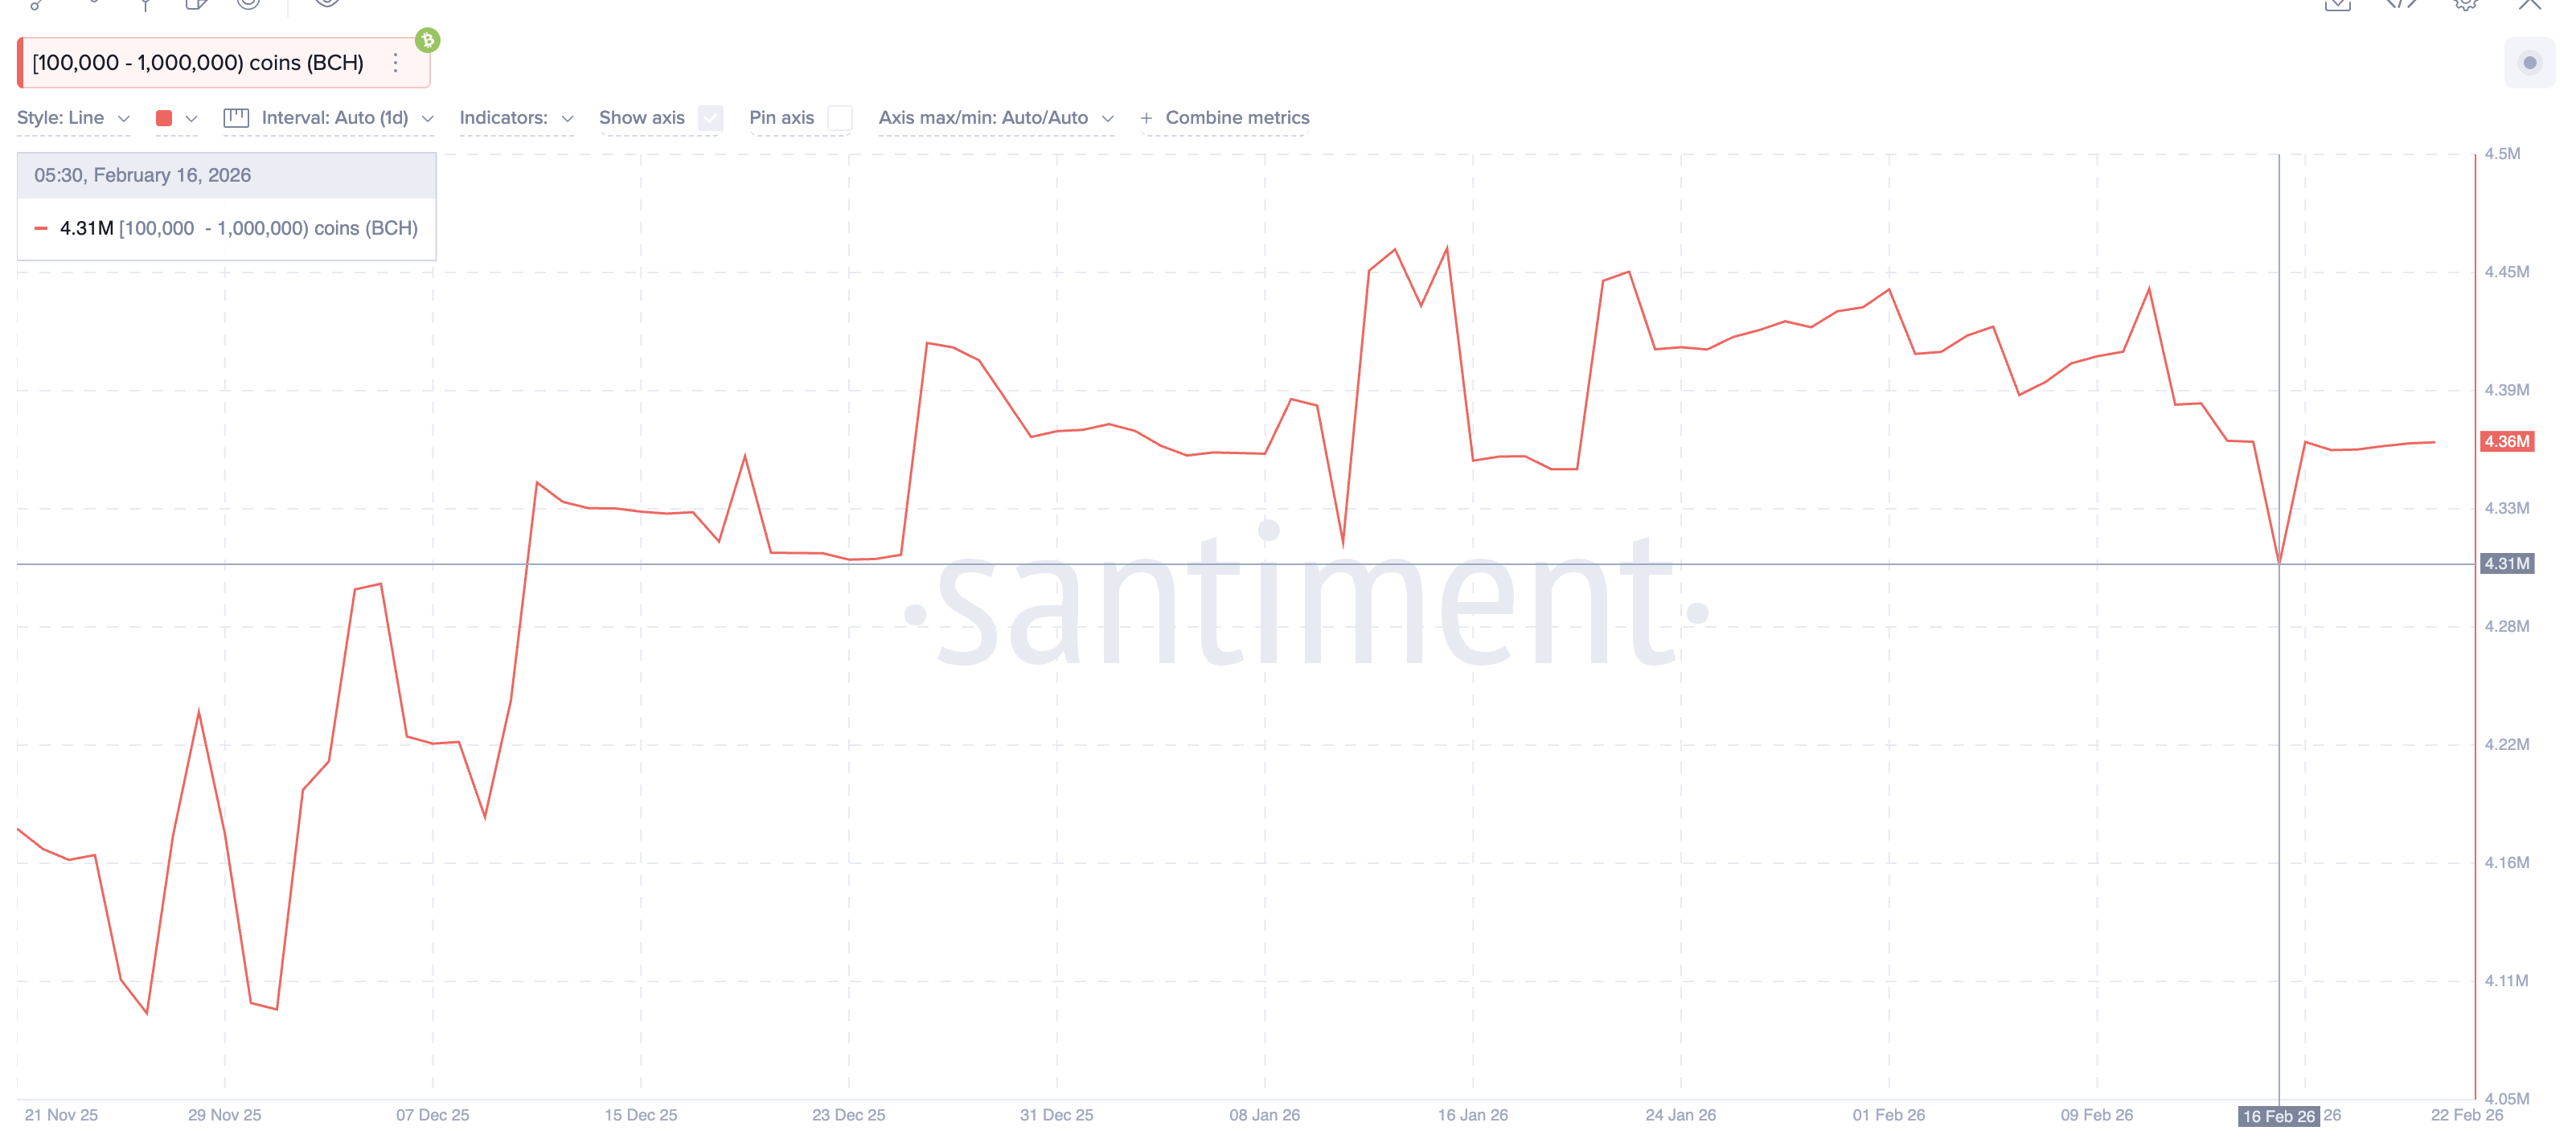
The crypto bear market has not stopped Bitcoin Cash (BCH) from showing unusual strength. While many altcoins struggle, BCH remains one of the strongest altcoins, holding large yearly gains. Bitcoin Cash is still up nearly 80% year-on-year, showing that demand has stayed intact even as the broader crypto bear market continues.
This strength is now clearly visible in whale behavior. The largest Bitcoin Cash holders, wallets holding between 100,000 and 1 million BCH, increased their holdings from 4.31 million BCH on February 16 to 4.36 million BCH recently.
This means whales added 50,000 BCH, worth about $28.5 million at the current price. Whale accumulation during a crypto bear market often signals confidence, as these investors typically buy when they expect higher prices ahead.
This optimism connects directly with Bitcoin Cash’s price chart. BCH is currently forming an inverse head-and-shoulders pattern, a bullish pattern that often precedes a breakout.
This pattern shows that selling pressure is fading and buyers are slowly gaining control. BCH attempted a breakout near $575 but faced some selling pressure. However, continued whale buying suggests this resistance may weaken over time.
A confirmed breakout requires a daily close above $575. If that happens, BCH could rally toward $793 and potentially $800, completing the pattern’s nearly 40% upside target. These levels also align with Fibonacci resistance zones, strengthening the bullish case.
However, risks still exist. The bullish structure weakens if BCH falls below $538, because that would show buyers losing control. Full invalidation happens only if the BCH price drops under $422, which would break the entire pattern.
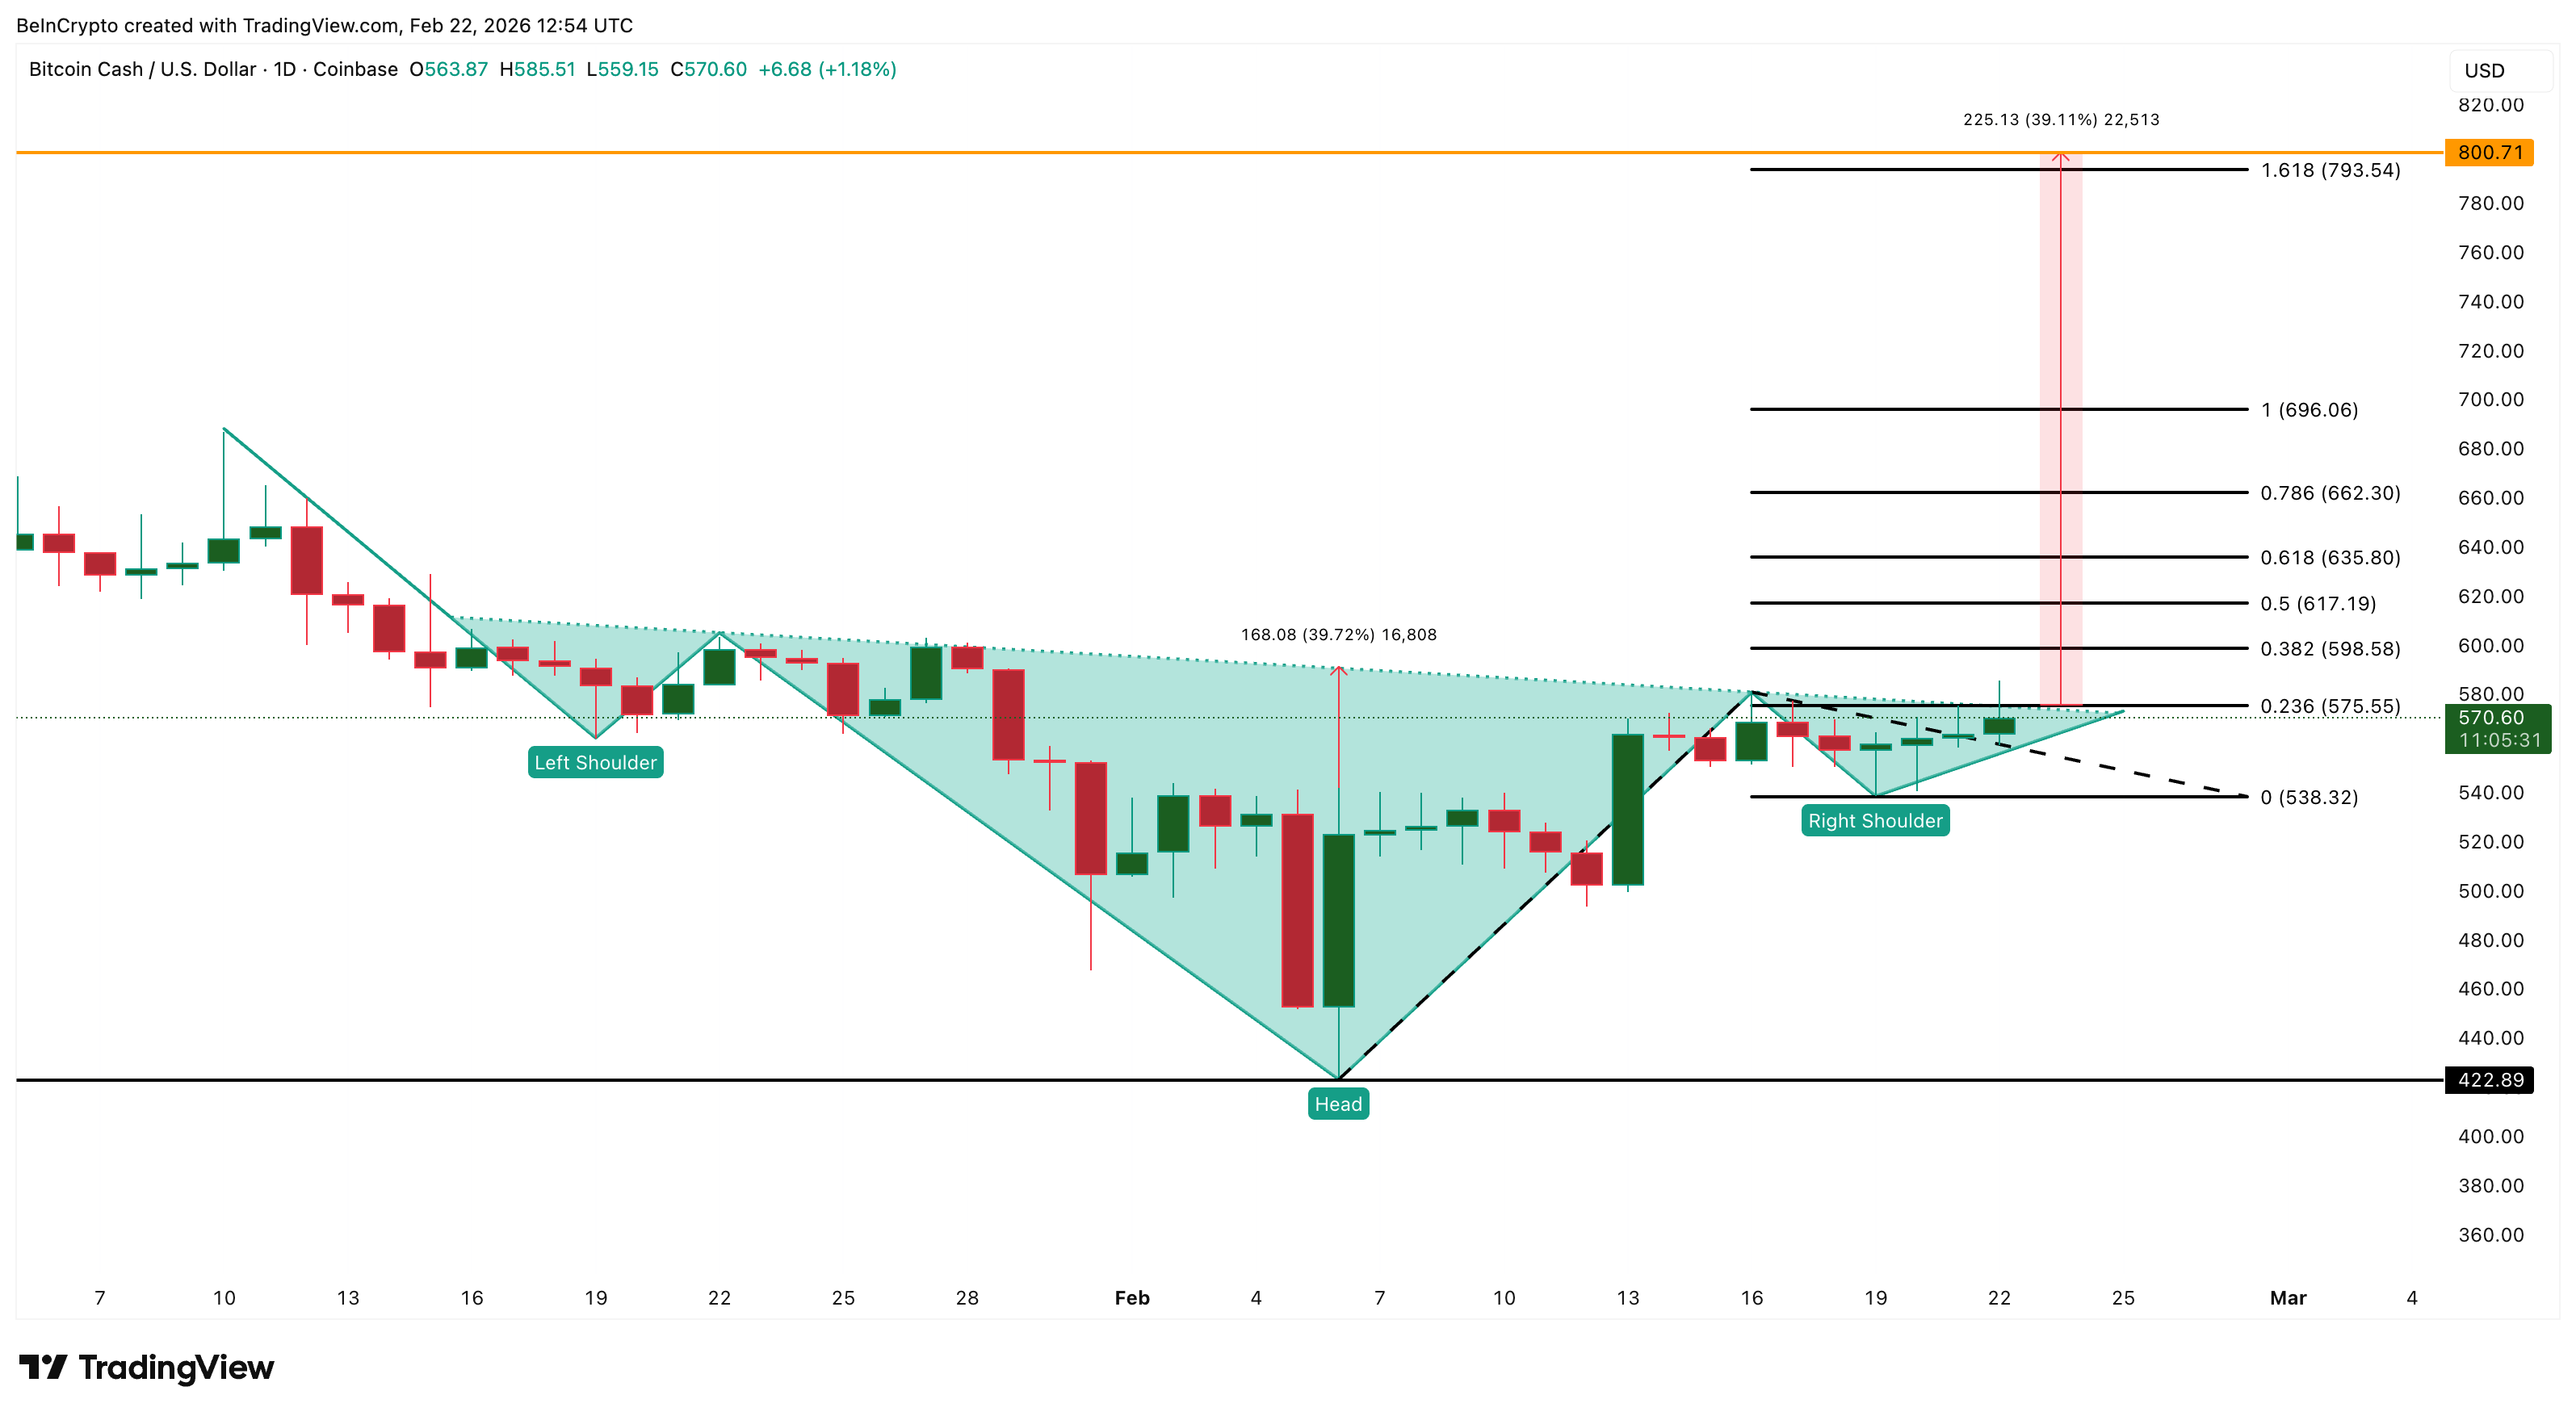
For now, Bitcoin Cash stands out as one of the rare altcoins defying the bear market, supported by both whale accumulation and a bullish technical structure.
Morpho (MORPHO)
Among the altcoins defying the bear market, Morpho stands out because of its strong fundamentals and bullish price structure.
Morpho is the governance token of a decentralized lending platform that allows users to lend and borrow crypto more efficiently. Its infrastructure, called Morpho Blue, improves capital efficiency by directly matching lenders and borrowers, offering better yields and lower borrowing costs.
This strong foundation is now attracting institutional attention. On February 13, 2026, Apollo Global Management, which oversees nearly $940 billion in assets, committed to acquiring up to 90 million MORPHO tokens, or about 9% of the total supply, over time. This creates steady buying pressure and validates Morpho’s role in institutional decentralized finance.
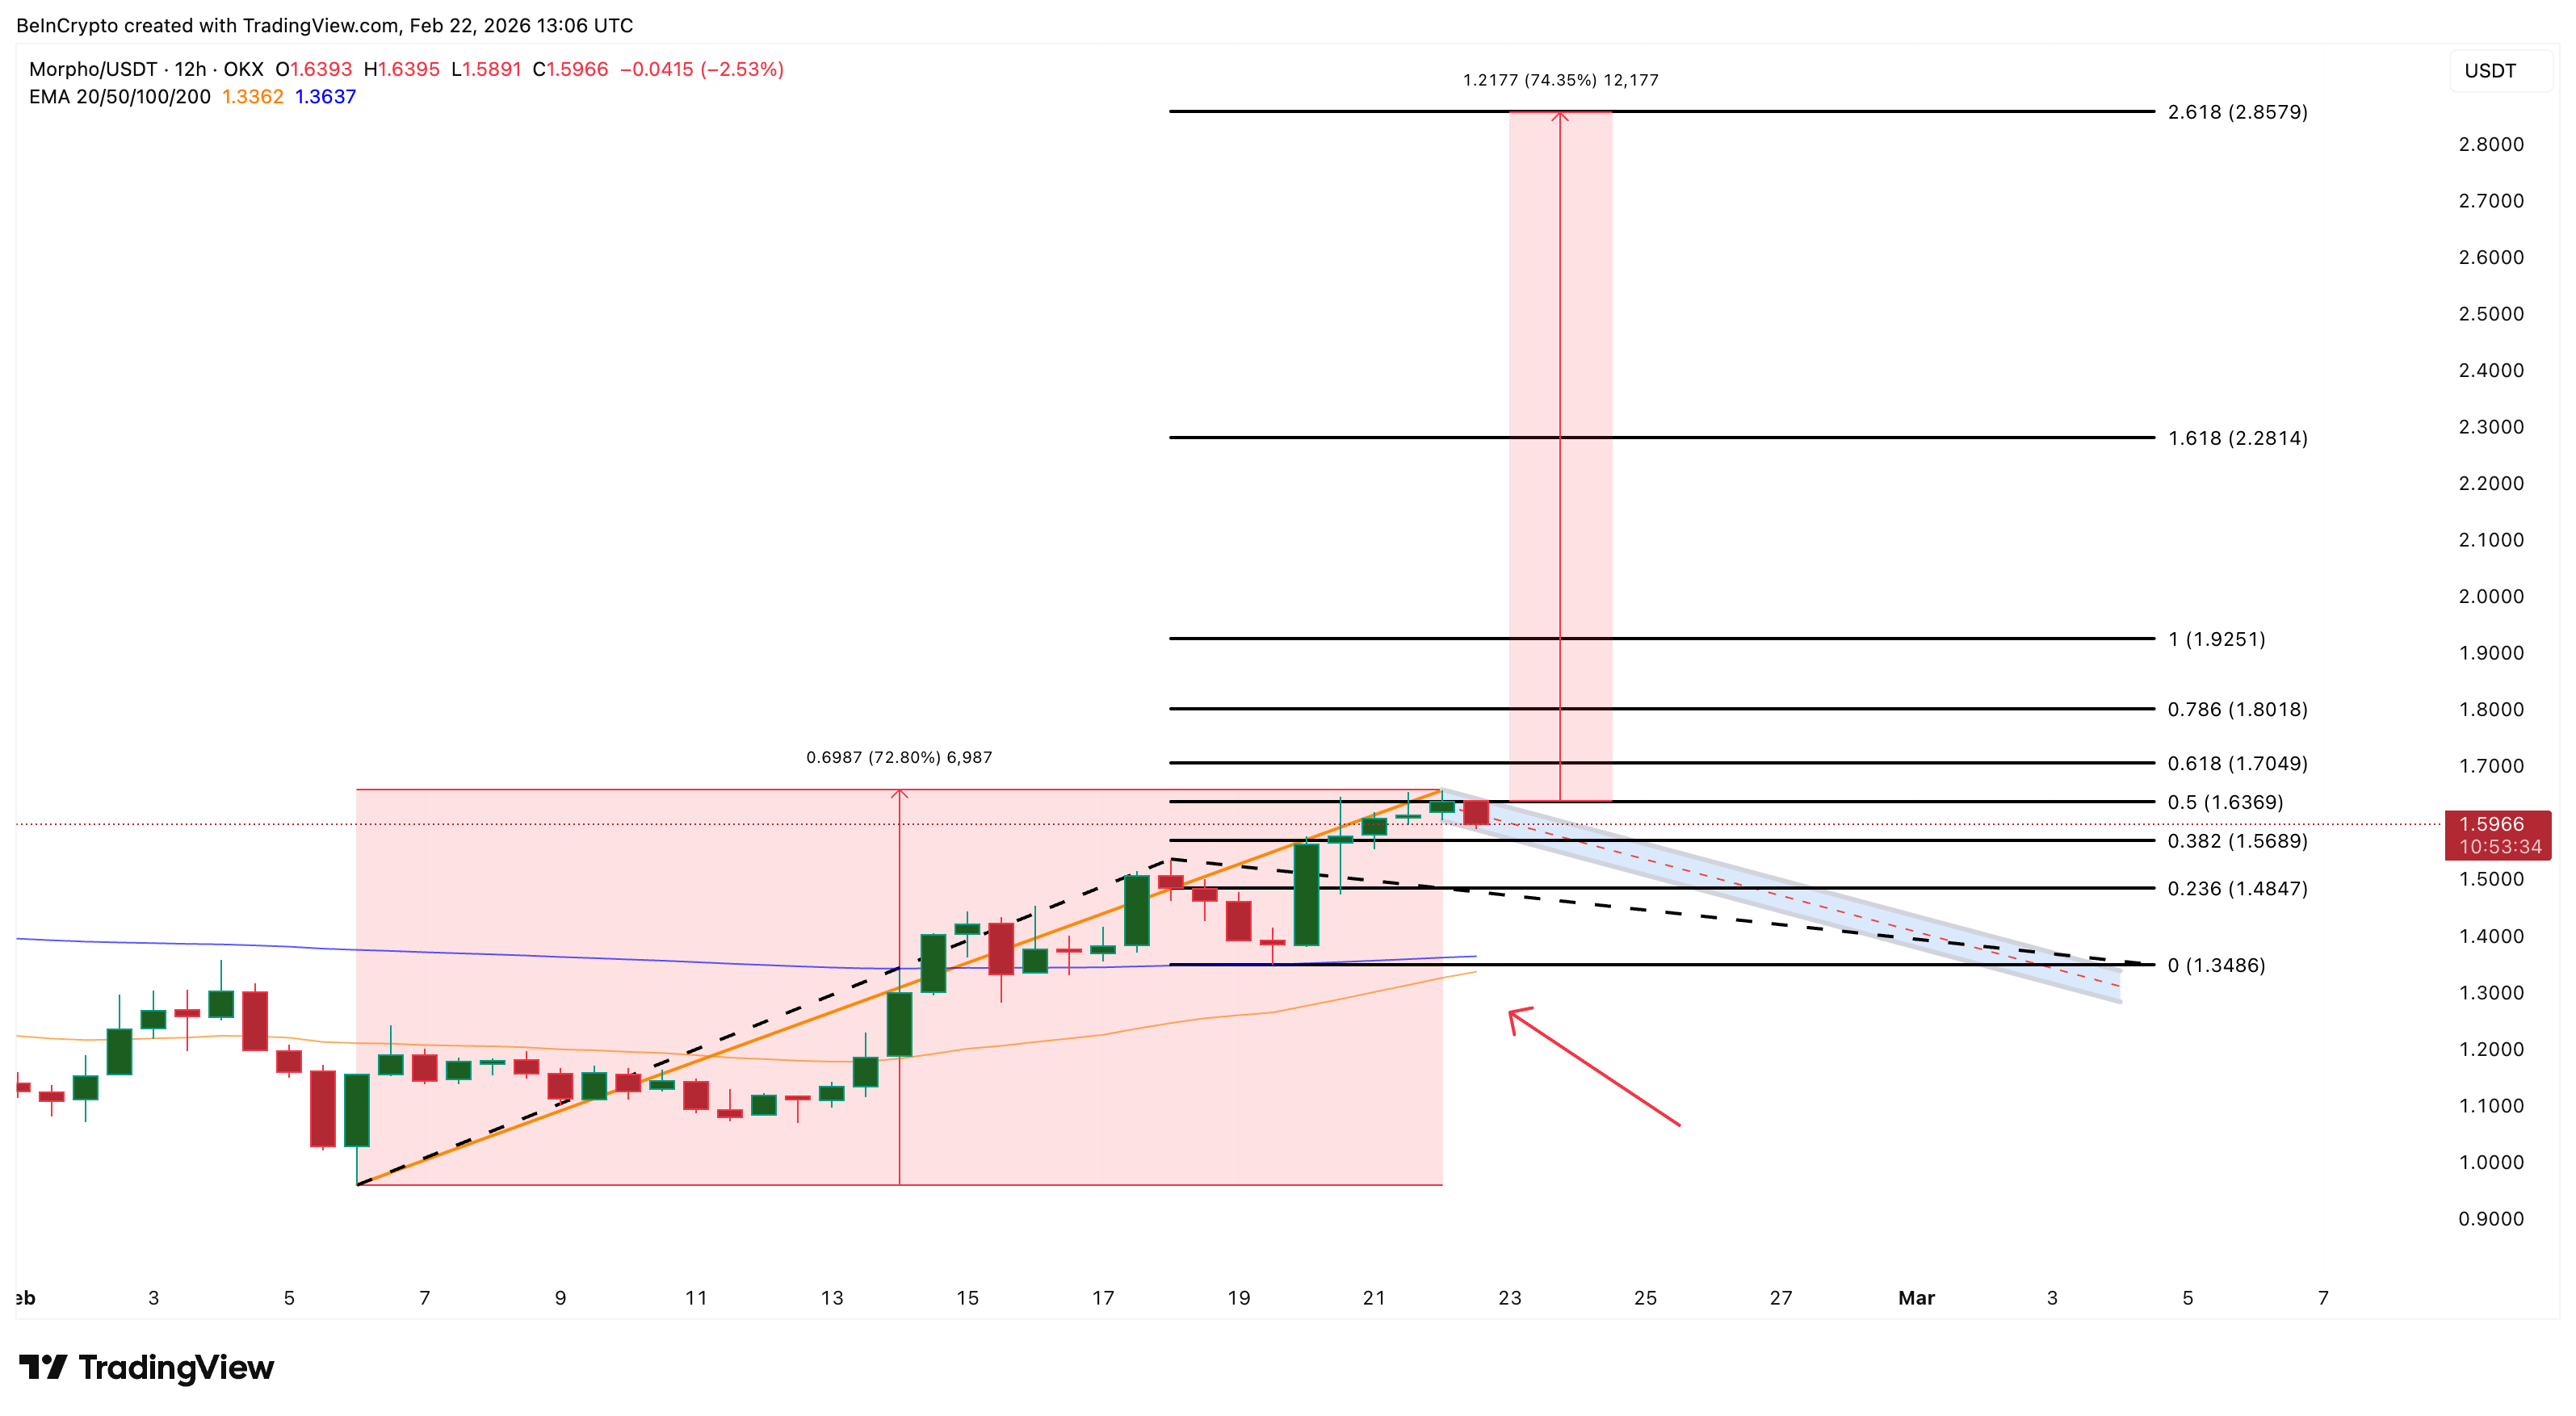
This fundamental optimism is also visible on the price chart. Since February 6, MORPHO has already rallied more than 72%, forming the pole of a classic bullish continuation pattern called a pole-and-flag.
The current consolidation could form the flag, which is a normal pause before another potential move higher.
At the same time, a golden crossover is approaching. This happens when the 50-period Exponential Moving Average (EMA), which tracks the medium-term price trend, moves above the 200-period EMA, which tracks the long-term trend. This signal often confirms the start of a sustained uptrend.
Want more token insights like this? Sign up for Editor Harsh Notariya’s Daily Crypto Newsletter here.
For now, MORPHO remains strong as long as the consolidation range holds above $1.48. However, the structure weakens below $1.34, where the 200-period EMA sits.
However, a confirmed breakout above $1.63 could trigger another 72% rally toward $2.85, reinforcing Morpho’s position among altcoins defying weakness during the crypto bear market.
Decred (DCR)
After Bitcoin Cash and Morpho, Decred has emerged as another altcoin quietly showing unusual strength. The token is up 93% year-on-year and 61% year-to-date, making it the strongest performer in this group of strong altcoins. Even in the past 24 hours, Decred has gained nearly 10%, highlighting persistent demand.
Part of this strength comes from its recent treasury upgrade, which improved how the network funds its own growth and reinforced long-term investor confidence.
However, the chart structure explains why this strength may not be over yet.
Decred is currently trading inside an ascending channel. It is a bullish structure in which the price moves between two rising parallel trendlines.
This pattern usually signals steady accumulation and controlled upward momentum. At the same time, a cup pattern is forming within this channel, creating what appears to be two bullish patterns folded into one structure.
This dual formation significantly strengthens the outlook. Based on the channel and cup projection, Decred could see nearly 37% upside. One major target sits near $39.76, while the extended target aligns near $45.33 if momentum continues.
In the short term, the structure remains healthy as long as Decred holds above $23.66. This level acts as the lower support inside the channel.
A move above $28.79 would signal growing strength and increase the chances of a breakout toward $32.98. It is a key zone that aligns with the channel’s upper trendline. Once this level breaks, the larger upside projection becomes more likely.
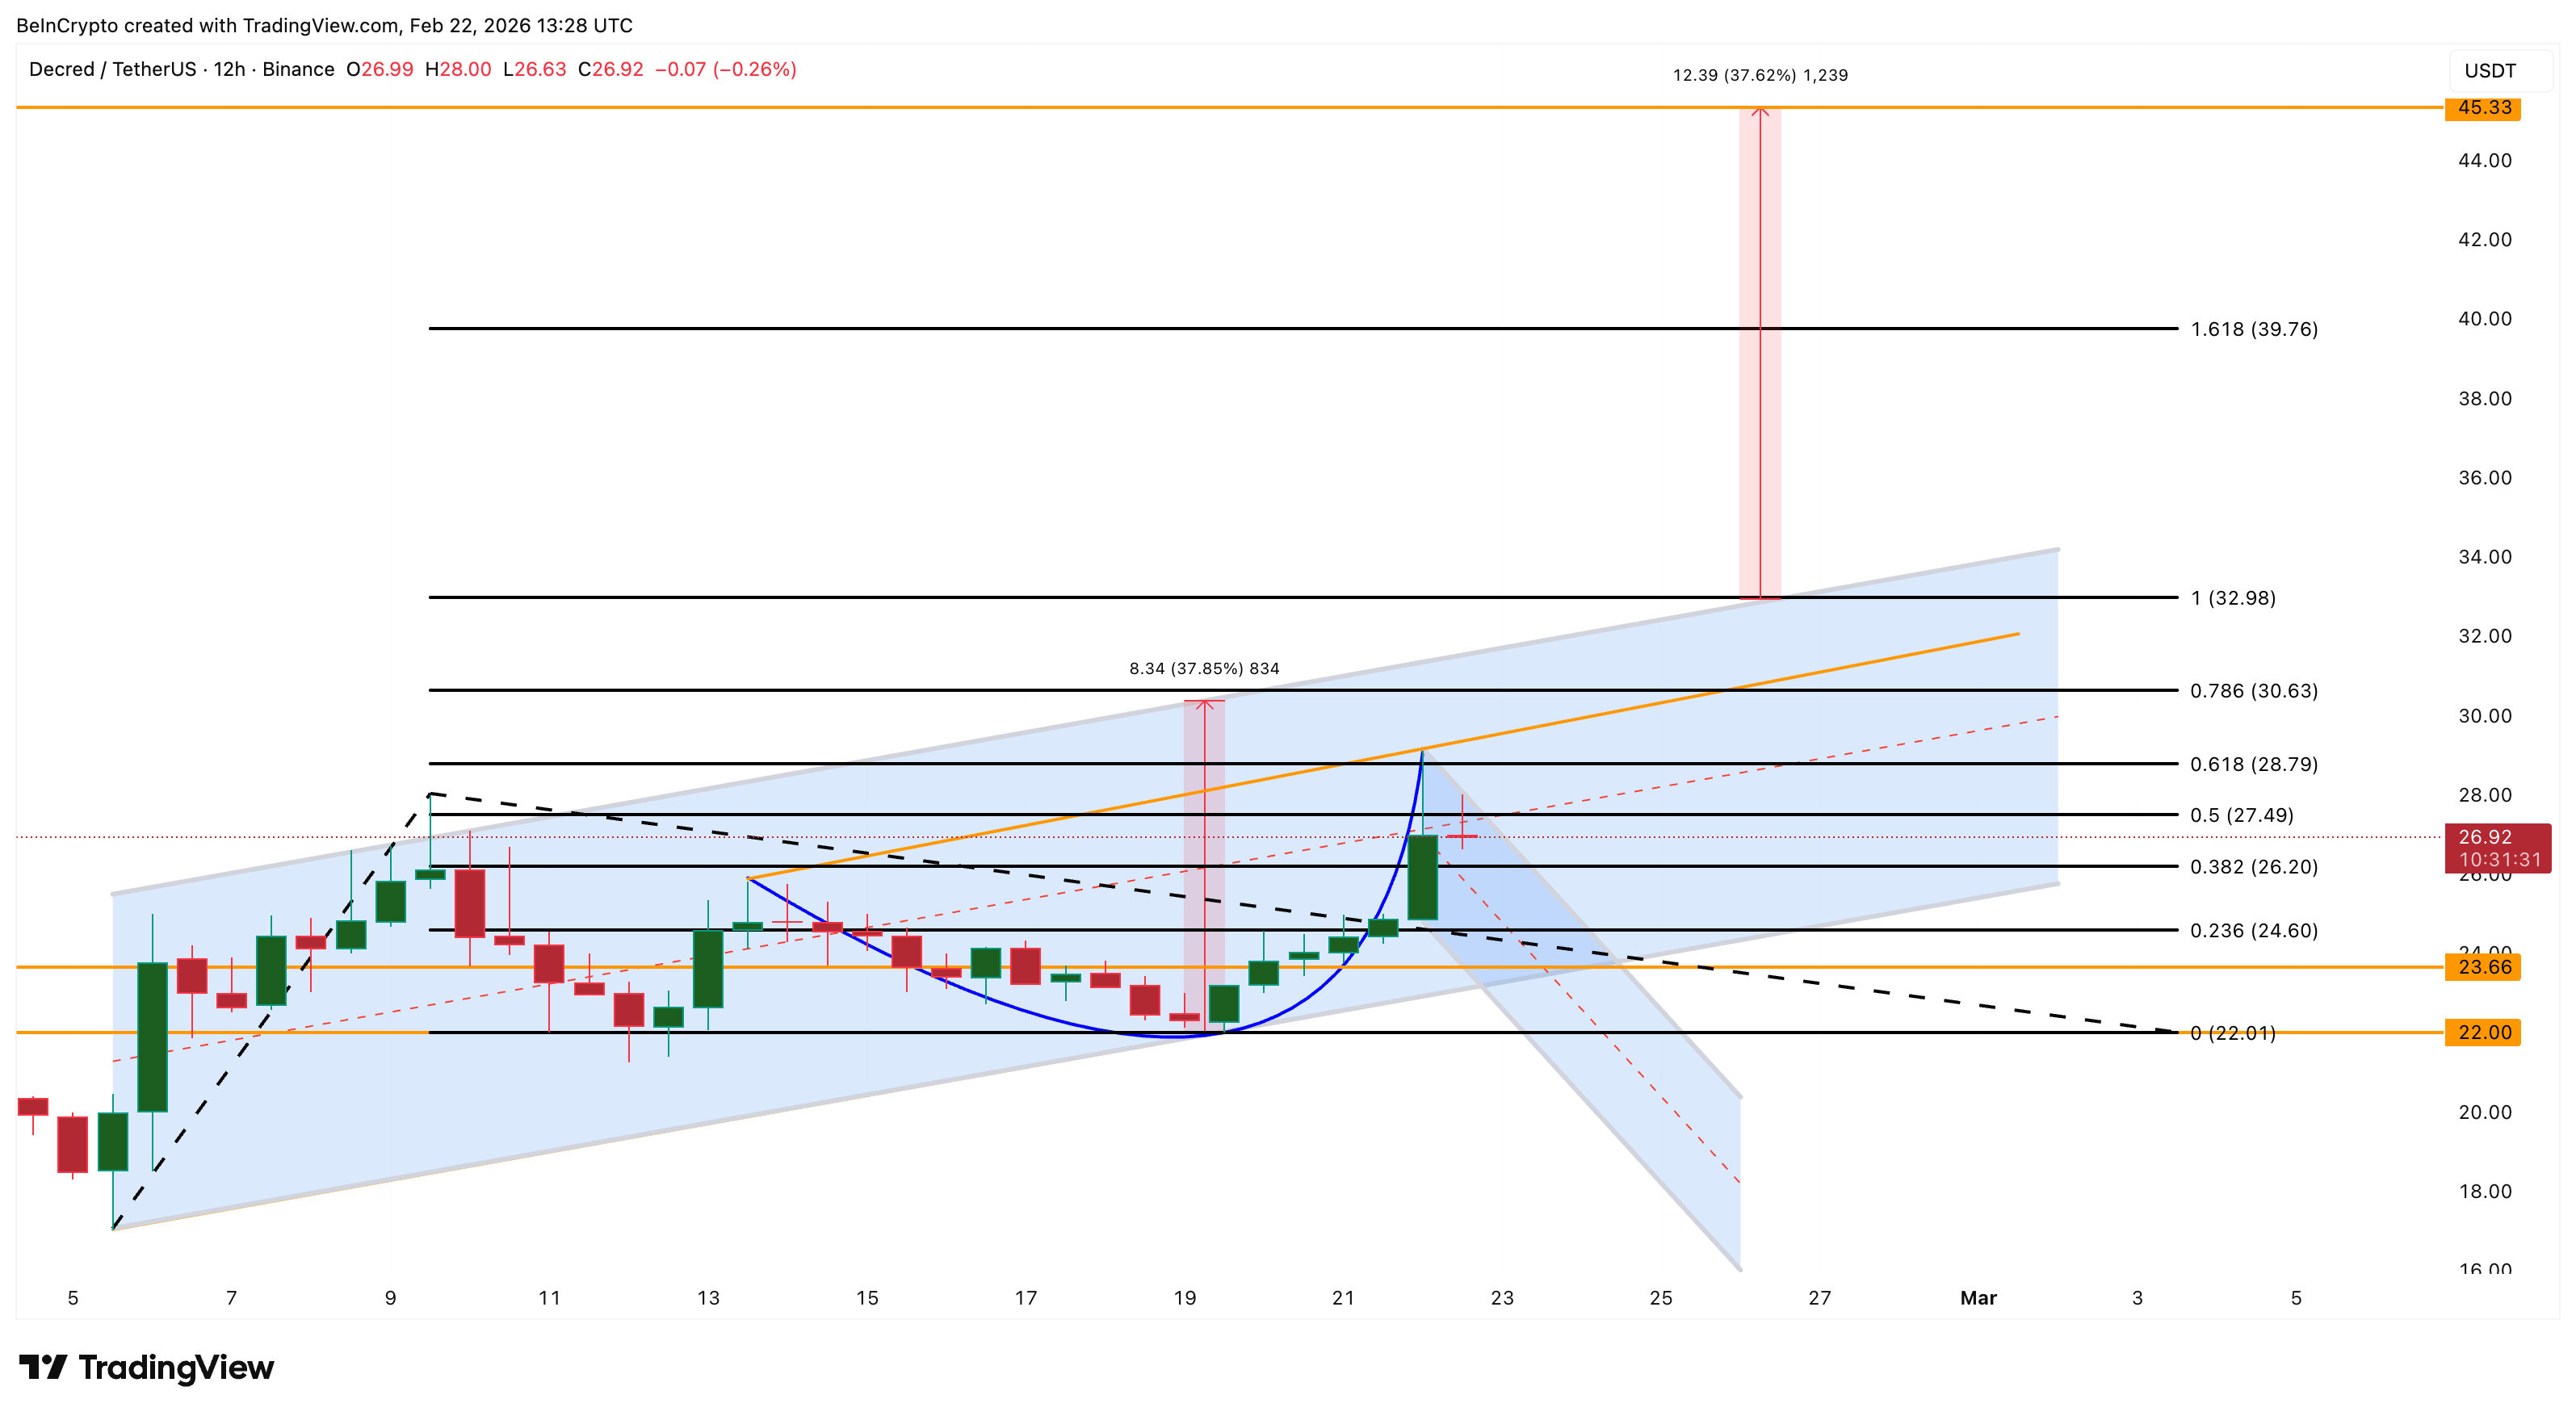
However, a drop below $22.01 would weaken the pattern and shift the structure from bullish to neutral. For now, Decred’s rare combination of strong performance and a layered bullish chart setup shows why it continues to stand out amid most altcoins’ struggles.
Crypto World
Quantum computing risk puts 7 million BTC including Satoshi Nakamoto’s 1 million at stake


In the event that quantum computers one day become capable of breaking Bitcoin’s cryptography, roughly 1 million BTC attributed to Satoshi Nakamoto, the creator of the Bitcoin network, could become vulnerable to theft.
At today’s price of about $67,600 per bitcoin, that stash alone would be worth approximately $67.6 billion.
But Satoshi’s coins are only part of the story.
Estimates circulating among analysts suggest that roughly 6.98 million bitcoin may be vulnerable in a sufficiently advanced quantum attack, Ki Young Ju, the founder of CryptoQuant, recently wrote on X. At current prices, the total amount of coins currently exposed represents roughly $440 billion.
The question that is now becoming increasingly prevalent in and outside bitcoin circles is simple and, at times, quite controversial
Why some coins are exposed
The vulnerability is not uniform. In Bitcoin’s early years, pay-to-public-key (P2PK) transactions embedded public keys directly on-chain. Modern addresses typically reveal only a hash of the key until coins are spent, but once a public key is exposed through early mining or address reuse, that exposure is permanent. In a sufficiently advanced quantum scenario, those keys could, in theory, be reversed.
Neutrality vs. intervention
For some, freezing those coins would undermine bitcoin’s foundational neutrality.
“Bitcoin’s structure treats all UTXOs equally,” said Nima Beni, founder of Bitlease. “It does not distinguish based on wallet age, identity, or perceived future threat. That neutrality is foundational to the protocol’s credibility.”
Creating exceptions, even for security reasons, alters that architecture, he said. Once authority exists to freeze coins for protection, it exists for other justifications as well.
Georgii Verbitskii, founder of crypto investor app TYMIO, raised a relevant concern: the network has no reliable way to determine which coins are lost and which are simply dormant.
“Distinguishing between coins that are truly lost and coins that are simply dormant is practically impossible,” Verbitskii said. “From a protocol perspective, there is no reliable way to tell the difference.”
For this camp, the solution lies in upgrading cryptography and enabling voluntary migration to quantum-resistant signatures, rather than rewriting ownership conditions at the protocol layer.
Let the math decide
Others argue that intervention would violate Bitcoin’s core principle: private keys control coins.
Paolo Ardoino, CEO of Tether, suggested that allowing old coins to reenter circulation, even if through quantum breakthroughs, may be preferable to altering consensus rules.
“Any bitcoin in lost wallets, including Satoshi (if not alive), will be hacked and put back in circulation,” he continued. “Any inflationary effect from lost coins returning to circulation would be temporary, the thinking goes, and the market would eventually absorb it.”
Under this view, “code is law”: if cryptography evolves, coins move.
Roya Mahboob, CEO and founder of Digital Citizen Fund, took a similar hardline stance. “No, freezing old Satoshi-era addresses would violate immutability and property rights,” she told CoinDesk. “Even coins from 2009 are protected by the same rules as coins mined today.”
If quantum systems eventually crack exposed keys, she added, “whoever solves them first should claim the coins.”
However, Mahboob said she expects upgrades driven by ongoing research among Bitcoin Core developers to strengthen the protocol before any serious threat materializes.
The case for burning
Jameson Lopp said that allowing quantum attackers to sweep vulnerable coins would amount to a massive redistribution of wealth to whoever first gains access to advanced quantum hardware.
In his essay Against Allowing Quantum Recovery of Bitcoin, Lopp rejects the term “confiscation” when describing a defensive soft fork. “I don’t think ‘confiscation’ is the most precise term to use,” Lopp wrote. “Rather, what we’re really discussing would be better described as ‘burning’ rather than placing the funds out of reach of everyone.”
Such a move would likely require a soft fork, rendering vulnerable outputs unspendable unless migrated to upgraded quantum-resistant addresses before a deadline — a change that would demand broad social consensus.
Allowing quantum recovery, he adds, would reward technological supremacy rather than productive participation in the network. “Quantum miners don’t trade anything,” Lopp wrote. “They are vampires feeding upon the system.”
How close is the threat?
While the philosophical debate intensifies, the technical timeline remains contested.
Zeynep Koruturk, managing partner at Firgun Ventures, said the quantum community was “stunned” when recent research suggested fewer physical qubits than previously assumed may be required to break widely used encryption systems like RSA-2048.
“If this can be proven in the lab and corroborated, the timeline for decrypting RSA-2048 could, in theory, be shortened to two to three years,” she said, noting that advances in large-scale fault-tolerant systems would eventually apply to elliptic curve cryptography as well.
Others urge caution.
Aerie Trouw, co-founder and CTO of XYO, believes “we’re still far enough away that there’s no practical reason to panic,”
Frederic Fosco, co-founder of OP_NET, was more direct. Even if such a machine emerged, “you upgrade the cryptography. That’s it. This isn’t a philosophical dilemma: it’s an engineering problem with a known solution.”
In the end, the question is about governance, timing and philosophy — and whether the Bitcoin community can reach consensus before quantum computing becomes a real and present threat.
Freezing vulnerable coins would challenge Bitcoin’s claim of immutability. Allowing them to be swept would challenge its commitment to fairness.

TSA PreCheck still operational after previous suspension announcement

Barcelona candidate addresses Marcus Rashford transfer as Man United get decision date

You Asked: From blinding brightness to fading OLEDs


-

 Video6 days ago
Bitcoin: We’re Entering The Most Dangerous Phase
-

 Crypto World5 days ago
Can XRP Price Successfully Register a 33% Breakout Past $2?
-

 Video3 days ago
XRP News: XRP Just Entered a New Phase (Almost Nobody Noticed)
-

 Fashion2 days ago
Weekend Open Thread: Boden – Corporette.com
-

 Sports6 days ago
GB's semi-final hopes hang by thread after loss to Switzerland
-

 Politics10 hours ago
Baftas 2026: Awards Nominations, Presenters And Performers
-
 Tech6 days ago
The Music Industry Enters Its Less-Is-More Era
-

 Business5 days ago
Infosys Limited (INFY) Discusses Tech Transitions and the Unique Aspects of the AI Era Transcript
-

 Entertainment4 days ago
Kunal Nayyar’s Secret Acts Of Kindness Sparks Online Discussion
-

 Video5 days ago
Financial Statement Analysis | Complete Chapter Revision in 10 Minutes | Class 12 Board exam 2026
-

 Tech4 days ago
Retro Rover: LT6502 Laptop Packs 8-Bit Power On The Go
-
 Sports4 days ago
Clearing the boundary, crossing into history: J&K end 67-year wait, enter maiden Ranji Trophy final | Cricket News
-

 Business5 hours ago
Mattel’s American Girl brand turns 40, dolls enter a new era
-

 Entertainment4 days ago
Dolores Catania Blasts Rob Rausch For Turning On ‘Housewives’ On ‘Traitors’
-

 Business4 days ago
Tesla avoids California suspension after ending ‘autopilot’ marketing
-

 Politics5 days ago
Eurovision Announces UK Act For 2026 Song Contest
-

 Crypto World4 days ago
WLFI Crypto Surges Toward $0.12 as Whale Buys $2.75M Before Trump-Linked Forum
-

 Politics2 hours ago
Maine has a long track record of electing moderates. Enter Graham Platner.
-

 Crypto World3 days ago
83% of Altcoins Enter Bear Trend as Liquidity Crunch Tightens Grip on Crypto Market
-

 Video4 hours ago
Bajaj Housing Finance: Good Time To Enter ?? Complete Analysis !!