

Crypto World
Price predictions 3/11: BTC, ETH, BNB, XRP, SOL, DOGE, ADA, BCH, HYPE, XMR


Bitcoin is facing resistance just above $70,000, but the bulls have kept up the pressure, increasing the possibility of a rally to $74,508.

Bitcoin ($BTC) is banging against the $70,000 door, but the surging cost of oil in the macro environment just changed the locks.
With oil prices reaching dangerously close to $100 per barrel amidst escalating geopolitical tensions, the asset’s recovery rally is stalling out as risk assets feel the heat of renewed inflation fears.
While bulls are defending the lower bounds of the range, the path to a new all-time high has suddenly become steeper.
The correlation between energy markets and crypto risk appetite is tightening, creating a standoff between spot demand and macro anxiety. But one level keeps getting in the way.
Discover: The best pre-launch crypto sales
How Oil at $100 Is Changing the Risk Equation for Bitcoin
The mechanism choking the Bitcoin price recovery is straightforward but brutal. Rising crude oil prices feed directly into consumer costs, keeping inflation sticky.
When energy costs spiked this week, they effectively tied the hands of the Federal Reserve. Markets that were pricing in rate cuts are now forced to reconsider the FOMC stance for the upcoming March meeting, sending tremors through risk-on assets.
This macro friction is palpable across trading desks. As analysts noted regarding recent inflation reports, any sign of persistent CPI pressure gives the Fed license to keep rates higher for longer, a scenario that historically drains liquidity from crypto markets.
The fear isn’t just theoretical; it’s visible in the immediate “risk-off” rotation occurring in futures markets.
Traders are reacting in real-time. Recent data shows that Hyperliquid saw a jump in activity following an oil trading surge, highlighting how crypto natives are increasingly hedging their exposure to real-world commodities.
If oil breaches the psychological $100/bbl barrier, the resulting volatility could strip away the leverage needed to push BTC through overhead BTC resistance.
On-Chain Metrics Tell a Different Story
While macro economics paint a grim picture, on-chain data suggests a supply shock is silently building.
Long-term holder supply has ticked up to 14.58 million BTC, or approximately 73% of the circulating supply.
This indicates that while feeble hands are panic-selling the oil news, veterans are digging in.
More telling is the formation of a massive support cluster: about 8% of the circulating supply, or 1.558 million BTC, was acquired between $60,000 and $70,000, creating a concrete floor that makes a deep correction less likely than in previous cycles.
Institutional flows further complicate the bear case. Even as oil jitters rattled the S&P 500, Bitcoin has outperformed gold and stocks since the US/Iran war, signalling a potential decoupling where BTC is viewed as a distinct hedge rather than just a high-beta tech stock.
This aligns with Arthur Hayes’ strategy on net liquidity, suggesting that savvy capital is looking past the immediate volatility toward the inevitable monetary expansion that follows supply shocks.
The sell-side pressure is also thinning. Exchange reserves have hit multi-year lows, meaning there are fewer coins available for dumping if panic sets in. The weak hands have largely exited; what remains constitutes the conviction trade.
Discover: The very best meme coins
Bitcoin Price Prediction: Can BTC Break $71,600 With Oil This High?
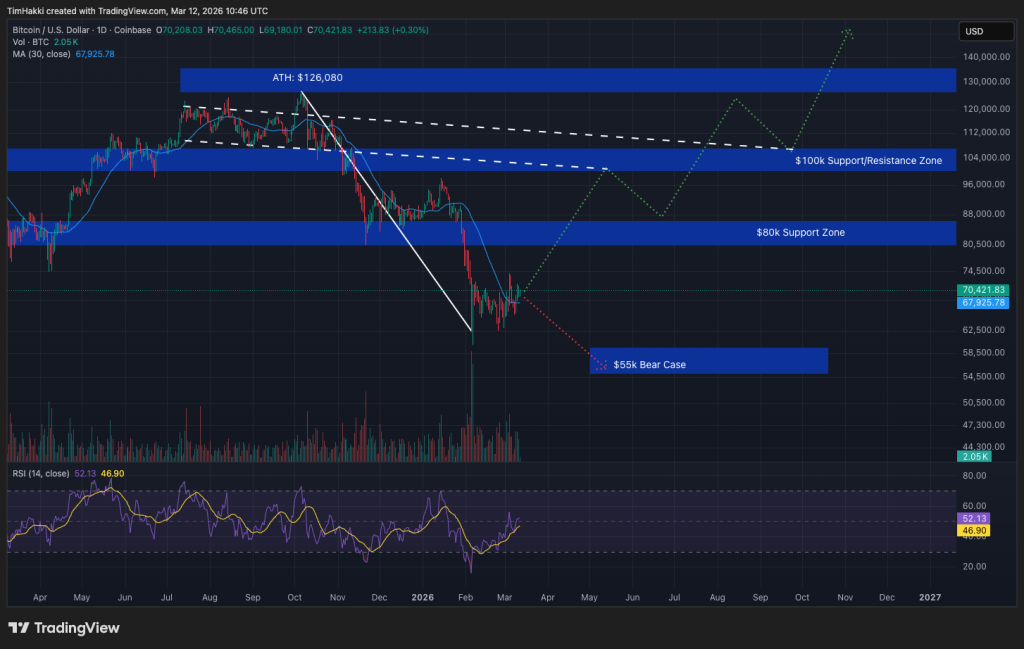
The chart structure for Bitcoin is currently a battle of attrition within a tightening range. BTC is oscillating around the $70,000 psychological level, but the real line in the sand is slightly higher.

Bull Scenario: The key BTC resistance to watch is $71,600. If bulls can force a daily close above this level, it invalidates the short-term bearish divergence caused by the oil shock.
Bear Scenario: Conversely, if the macro headwinds prove too strong, failure to hold the $68,500 local support could be disastrous.
Losing this level would likely trigger a cascade of long liquidations, dragging the price down to $60,000 and seriously challenging the final local frontier for immediate support.
The post Oil Surges Near $100 Stalling Bitcoin Breakout appeared first on Cryptonews.
Market analysts say Bitcoin (BTC) is in a relief rally after its 17% recovery from multi-year lows below $60,000, but the $78,000 level is key to reversing the broader downtrend.
Key takeaways:
-
Bitcoin price is up 17% from sub-$60,000 lows as onchain data shows signs of returning demand.
-
BTC price resistance around $78,000 must be broken to end the downtrend.
Bitcoin buyers are returning
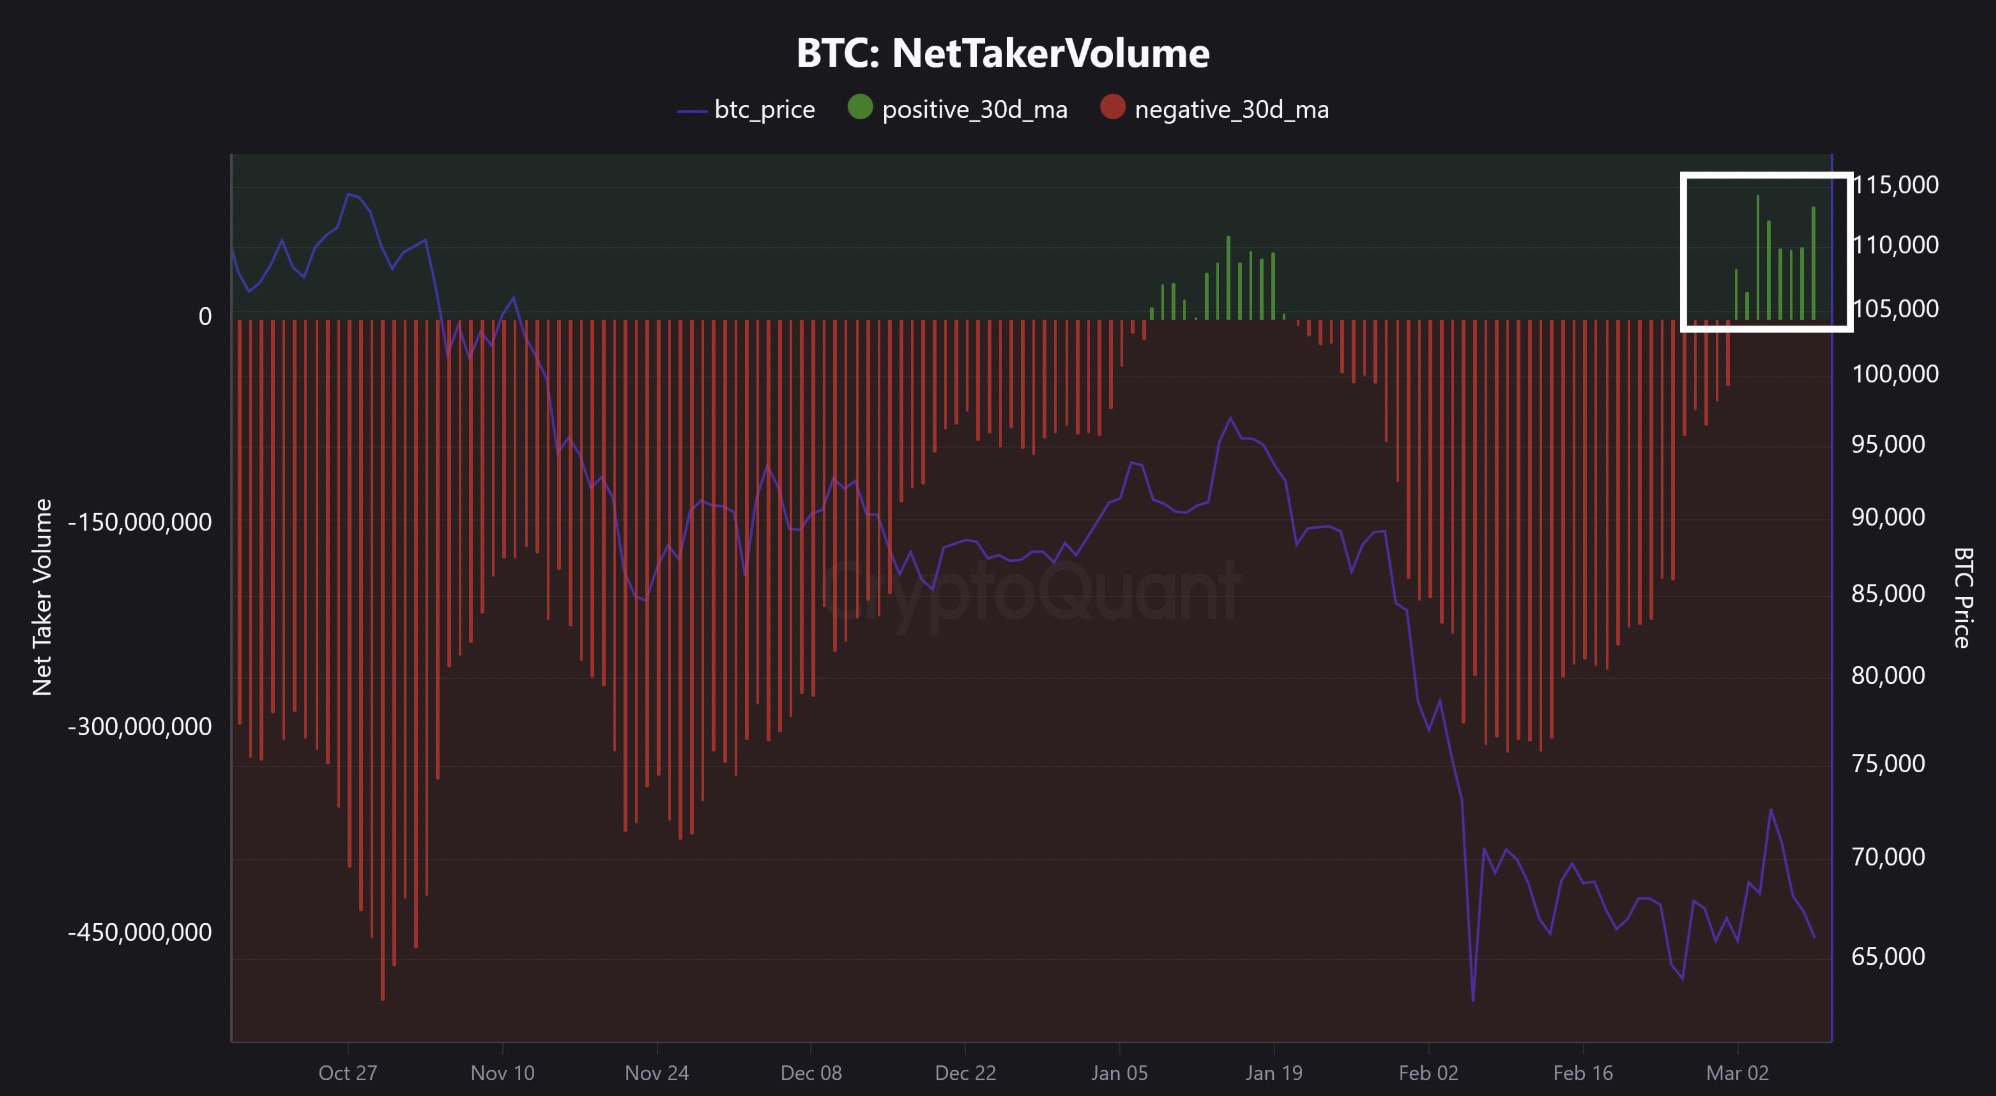
Bitcoin’s net taker volume suggests buyers are stepping in as demand for BTC derivatives returned, data from CryptoQuant shows.
Net taker volume, a metric that measures the imbalance between aggressive buyers and sellers in derivatives markets, has remained positive since the US and Israel-Iran war began.
Related: Three Bitcoin Binance charts reveal the setup behind the next big move
“Since the conflict broke out, net taker volume as measured by the 30-day moving average has been positive,” CEO at Coinbureau Nic Puckrin said in an X post on Wednesday.
This positive regime coincided with the recent BTC price recovery to $74,000, indicating that demand has returned across derivatives markets.
“This shows taker buy volume has outpaced sell volume,” Puckrin said, adding:
“Bitcoin buyers are in control.”

The bull score index, a metric that measures Bitcoin’s overall market health using a combination of fundamental and technical metrics, further reinforces this picture.
The metric has increased to 30 from 10 on March 6, the highest since late October 2025.
The bull score index phase has “switched from ‘extra bearish’ to ‘bearish,’” said CryptoQuant head of research Julio Moreno, adding:
“We are still in a bear market, but in a relief rally.”

Meanwhile, demand for spot Bitcoin exchange-traded funds (ETFs) continues, with these investment products recording three straight days of inflows, totalling $529.2 million.

BTC price must break $78,000 to end downtrend
Data from TradingView shows that Bitcoin has spent more than four weeks consolidating within a $62,000–$72,000 range, with multiple failed attempts to sustain a strong footing above $70,000.
Zooming out, the price remains sandwiched between the realized price (average acquisition cost of all circulating supply) at $54,400 and true market mean (the cost basis of actively transacted coins) at $78,000, Glassnode said in its latest Week On-chain newsletter, adding:
“In the absence of broader macro headwinds, this range could plausibly support a bear market relief rally capped by the true market mean.”

The chart above shows that the BTC price was within these two cost-basis levels for most of 2023, with relief rallies being repeatedly rejected at the true market mean. Ultimately, the price broke out in October 2023, with the announcement of US spot Bitcoin ETF approvals as the main catalyst.
Trader and analyst Titan of Crypto said a break above $78,000-$80,000 could signal a long-term trend change.

Yesterday, Cointelegraph reported that Bitcoin’s upside could be capped at $78,000, with derivatives traders pricing low odds for a BTC price breakout past this level in the near term.
In the meantime, Glassnode said repeated failures to hold above $70,000 “tilts the mid-term return distribution toward the downside,” with the realized price at $54,000 serving as the primary support level to watch.
Other areas of interest include the 200-week exponential moving average at $68,300, the $60,000-65,500 demand zone and the 200-week simple moving average at $58,800, which has historically provided the last line of defense in macro drawdowns.
This article does not contain investment advice or recommendations. Every investment and trading move involves risk, and readers should conduct their own research when making a decision. While we strive to provide accurate and timely information, Cointelegraph does not guarantee the accuracy, completeness, or reliability of any information in this article. This article may contain forward-looking statements that are subject to risks and uncertainties. Cointelegraph will not be liable for any loss or damage arising from your reliance on this information.

The state of Utah is moving to shut down prediction market platforms like Kalshi and Polymarket as part of a broader clash over how this evolving sector should be regulated. The legislative push, marked by HB243 (Gambling Revisions), would redefine “proposition betting” as gambling, aiming to bar platforms that host event-based bets—whether framed as prediction markets or sportsbooks—from operating in the state. The Utah House cleared the bill on February 10, followed by Senate approval on February 27, setting the stage for a gubernatorial signature. Governor Spencer Cox signaled his support, framing the move as a shield against what he described as risky, youth-targeting gaming products. The episode adds to a growing patchwork of state actions that intersect with federal authority over derivatives and fintech platforms.
Key takeaways
- Utah advances HB243, redefining proposition betting as gambling and barring platforms offering prediction-like services within the state.
- Kalshi has filed suit against Utah, contending its event contracts are federally regulated derivatives under the Commodity Exchange Act, not gambling.
- The Commodity Futures Trading Commission maintains that it has exclusive authority over prediction markets, framing them as potential conduits for information discovery, and indicating readiness to defend this stance in court.
- Similar clashes are unfolding in other states, including Iowa, and a series of federal court cases in Ohio have shaped the legal landscape around enforcement and jurisdiction.
- The regulatory tension highlights how crypto-adjacent markets—where prediction and derivatives intersect—could be affected by evolving governance and enforcement priorities.
Tickers mentioned:
Sentiment: Neutral
Market context: Regulatory scrutiny of prediction markets sits at the intersection of consumer protection, gambling law, and financial-market oversight, with federal authorities signaling a willingness to assert jurisdiction while states pursue their own legislative fixes.
Why it matters
Utah’s move crystallizes a broader narrative about how governments will treat platforms that blend prediction, gambling-style mechanics, and financial exposure. While proponents view prediction markets as tools for aggregating information—potentially offering more transparent signals than traditional polls—the regulatory approach in Utah treats these markets as gambling products subject to state-law restrictions. The dispute foregrounds a central question for the crypto and blockchain-adjacent economy: who should police event-based contracts that rely on real-money wagers and futures-style pricing? The CFTC’s stance that it retains exclusive federal oversight over such markets adds a layer of complexity for operators seeking a national framework that could preempt state bans or carveouts.
Kalshi’s legal strategy underscores the federal-versus-state tension at the heart of this debate. By insisting that its event contracts fall under federal derivatives regulation rather than gambling restrictions, the company is leveraging the Commodity Exchange Act to push back against Utah’s restrictions. That position aligns with prior CFTC positions that see these markets as subject to federal oversight, rather than states’ patchwork prohibitions. The unfolding cases, including Kalshi’s actions in Iowa and Ohio, illustrate how a chain of judicial decisions could shape not only the fate of prediction-market platforms but also broader efforts to innovate within the crypto and fintech ecosystems.
Beyond this particular dispute, observers are watching the implications for similar products—especially those that seek to tokenize or automate event-based bets with digital infrastructure. If courts uphold federal preemption for these contracts, it could unlock a more uniform regulatory path for platforms exploring cross-border and cross-state operations. Conversely, if states prevail, a mosaic of prohibitions could emerge, potentially dampening investment in related technologies and complicating compliance for operators seeking to scale. The debate is not just about Utah or Kalshi; it concerns the regulatory architecture that will govern the next wave of financial experimentation in the digital era.
In public remarks at a Florida industry conference, CFTC Chairman Michael Selig reminded attendees that the agency regards prediction markets as instruments with potential informational value, even calling them “truth machines” when priced and funded by participants who put real stake behind their views. He stressed that the CFTC would defend its authority in court if challenged, signaling that attempts to clamp down on such markets at the state level may be met with federal countermeasures. This framing dovetails with ongoing debates about how to regulate innovative financial products without stifling legitimate experimentation. The tone from Washington, D.C., and state capitals alike suggests a transitional period as policymakers weigh consumer protection, market integrity, and the demand for novel market signals.
What to watch next
- Governor Cox’s formal signature on HB243 and any subsequent regulatory guidance from Utah authorities.
- Federal court developments in Kalshi’s Utah and Iowa lawsuits, including any rulings on whether the CFTC’s authority can foreclose state bans.
- The Ohio federal court ruling on Kalshi’s attempt to block enforcement—whether it sets a precedent for other states’ actions against similar platforms.
- Additional state-level proposals targeting prediction markets or similar event-based contracts, and how courts interpret their scope vis-à-vis federal law.
- Responses from other market participants and lawmakers that could chart a broader regulatory framework for crypto-adjacent prediction markets.
Sources & verification
- Utah HB243 (Gambling Revisions) text and legislative history: https://le.utah.gov/~2026/bills/static/HB0243.html
- Associated Press report on Cox’s stance and the signing intent: https://apnews.com/article/utah-kalshi-polymarket-spencer-cox-mormon-gambling-c3fecd3e120b4d5be103bc9e1f4a5587
- Kalshi v. Utah: Kalshi’s lawsuit filing (Utah News Dispatch PDF): https://utahnewsdispatch.com/wp-content/uploads/2026/02/Kalshi_V_Utah.pdf
- Kalshi’s Iowa action (report reference): https://cointelegraph.com/news/kalshi-preemptively-sues-iowa-claiming-risk-of-enforcement-action
- Ohio court action on Kalshi’s sports-betting case: https://cointelegraph.com/news/kalshi-court-ohio-sports-betting-lawsuit
- CFTC Chair comments on prediction markets and enforcement stance: https://x.com/ChairmanSelig/status/2023744651216240966?s=20
- Related coverage on Kalshi’s Ohio case and broader regulatory actions: https://cointelegraph.com/news/kalshi-sued-khamenei-trade-carveout
Regulatory clash reshapes the landscape for prediction markets
Utah’s HB243 embodies a strategic attempt by a state to reframe the legal perimeter around prediction-based platforms, extending beyond traditional sports betting to what officials view as speculative markets that could attract vulnerable users. The bill would reclassify proposition betting—where wagers hinge on individual events within a game, rather than the final outcome—as gambling. In practical terms, that shift empowers Utah’s regulators to block operators from offering those services in the state, regardless of how the platforms label themselves. The legislature’s passage through both chambers, followed by the governor’s stated intent to sign, signals a strong intent to create a production-ready barrier against these services at the state level.
Kalshi’s legal response underscores a core proposition: federal law governs the structure and operation of event contracts. By contending that these are derivatives within the CFTC’s purview under the Commodity Exchange Act, Kalshi argues that Utah cannot selectively ban the contracts simply because they are framed as prediction markets. This argument hinges on questions of preemption and the reach of federal securities and commodities law into digital and financial-innovation spaces. The case mirrors a broader pattern in which states test the limits of their regulatory reach while federal agencies assert a uniform framework intended to maintain market integrity and protect participants.
As the federal regulator’s position gains resonance, Kalshi has pursued multi-front litigation. The company’s Utah suit targets the state’s enforcement actions, while an accompanying Iowa filing signals a broader strategy to secure a federal preemption shield. Meanwhile, a separate Ohio decision denying Kalshi’s bid to halt state enforcement actions demonstrates how courts are weighing the balance between state consumer protections and federal authority. Taken together, these movements sketch a regulatory arc: a fight over jurisdiction that could determine how prediction markets, crypto-linked or otherwise, can operate across the United States.
For market participants and observers, the outcome could influence investment, product development, and international competitiveness. If federal oversight becomes the default, operators may gain the ability to launch across multiple states with a consistent, preemptive framework. If, on the other hand, state restrictions proliferate, founders may face a fragmented landscape characterized by varying compliance costs and heightened legal risk. The CFTC’s characterization of prediction markets as “truth machines”—contingent on active participation and risk-bearing—adds a qualitative element to the regulatory debate: markets that are price-discovered and transparent can offer valuable signals, but only if designed and governed with appropriate safeguards.
What to watch next
- Fiscal and regulatory status of HB243 after gubernatorial action, including any rulemaking or enforcement guidelines from Utah’s gambling regulators.
- Upcoming court decisions in Kalshi’s Utah and Iowa cases that could clarify federal preemption in the context of state gambling prohibitions.
- Rulings in Ohio and other jurisdictions that could set precedent for how prediction-market operators navigate enforcement actions.
- Public statements from the CFTC and related federal agencies about the regulatory approach to crypto-adjacent prediction markets and their potential scope beyond traditional derivatives.
Crypto World
Intel (INTC) Stock Climbs 2.57% Following Panther Lake Announcement and Processor Launches

Key Takeaways
- Shares of Intel (INTC) climbed 2.57% to reach $47.98 on March 11, extending a three-session winning streak.
- The rally followed announcements regarding Panther Lake chip deployment and confirmation that Core Ultra 7 270K Plus and Core Ultra 5 250K Plus will ship on March 26.
- Industry sources indicate Intel is approaching “full capacity” as AI infrastructure requirements drive server processor demand.
- Wall Street maintains a “Reduce” consensus rating with a $45.74 average price target, though certain analysts have upgraded their outlook.
- Intel delivered stronger performance than NVIDIA, Broadcom, and Qualcomm during a session where broader indices declined.
Intel (INTC) finished Wednesday’s session at $47.98, posting a 2.57% advance while major benchmarks struggled. The S&P 500 dipped 0.08% and the Dow Jones Industrial Average declined 0.61%, highlighting Intel’s relative strength.
The chipmaker extended its winning streak to three trading days. Volume registered at 71.6 million shares, noticeably lighter than the 50-day average of 108.2 million, indicating the advance occurred without heavy participation from new market entrants.
Shares peaked at $48.83 during intraday trading before settling at the $47.98 close. The stock’s 52-week peak of $54.60 was established on January 22.
The upward movement partially stemmed from developments surrounding Intel’s Panther Lake processor roadmap. Chief Executive Lip-Bu Tan disclosed that external foundry clients are actively participating as the company advances its manufacturing-as-a-service initiative.
The company also verified shipping dates for its Core Ultra 7 270K Plus and Core Ultra 5 250K Plus processors, scheduled for March 26 availability. Suggested pricing is positioned at $299 and $199 respectively.
Earlier this week, the Arrow Lake Refresh unveiling and Core Series 2/Core Ultra product family introduction had already sparked investor enthusiasm. Market reactions included double-digit intraday price movements, demonstrating heightened attention to Intel’s processor portfolio.
Artificial Intelligence Infrastructure and Manufacturing Capacity
Industry reports indicate Intel is operating at approximately “full capacity” as artificial intelligence infrastructure customers increase server chip procurement. Limited supply availability in this segment can strengthen pricing dynamics for manufacturers capable of meeting delivery commitments.
Acer recently unveiled new TravelMate Copilot+ notebook computers powered by Intel Core Ultra Series 3 processors, demonstrating original equipment manufacturer adoption of Intel’s newest mobile AI silicon. Additionally, Intel and Infosys broadened a strategic artificial intelligence infrastructure collaboration, potentially channeling additional enterprise computing workloads to Intel-based systems.
Intel disclosed fourth quarter results on January 22, delivering earnings per share of $0.15, surpassing the $0.08 consensus forecast. Revenue totaled $13.67 billion, exceeding the $13.37 billion analyst projection, despite representing a 4.2% year-over-year decline.
The company’s first quarter 2026 EPS guidance stands at $0.00, while Wall Street analysts project an average of -$0.11 EPS for the complete fiscal year.
Wall Street Perspective
Analyst opinion remains divided. Tigress Financial maintains a “buy” recommendation with a $66 price objective. UBS projects a $51 target. Northland Securities established a $54 forecast. Conversely, Rosenblatt carries a “sell” rating with a $30 target, while Citi has highlighted macroeconomic and competitive headwinds.
In aggregate, 5 analysts recommend buying INTC, 26 suggest holding, and 6 advise selling. The overall consensus stands at “Reduce” with a mean price target of $45.74 — trailing Wednesday’s closing level.
Intel ranks among the most heavily shorted Dow components, introducing additional volatility dynamics to the current uptrend.
Regarding insider activity, Executive Vice President David Zinsner acquired 5,882 shares at $42.50 in late January. Executive Vice President April Miller divested 20,000 shares at $49.05 in early February.
Intel’s 50-day moving average stands at $45.84. The 200-day moving average is positioned at $38.55. Institutional ownership represents 64.53% of outstanding shares.

Hyperliquid price rallied over 8% on Thursday as demand for oil futures on the platform continued to hold steady on the platform.
Summary
- Hyperliquid price rallied to a four-week high of $37.3 on Thursday, led by a surge in oil perps trading activity on the derivatives platform.
- HYPE has also confirmed a bullish reversal pattern on the 4-hour chart.
According to data from crypto.news, Hyperliquid (HYPE) price shot up 8% to a four-week high of $37.3 on Thursday, March 12. At this price, the token is up 45% from its February low and 81% higher than its lowest point this year.
HYPE price jump came along with a jump in trading volume, which rose 42% over the past 24 hours to around $437 million. Its market cap was settled at $8.86 billion.
CoinGlass data shows that its open interest has risen by 10%, suggesting that the major catalyst for its recent gains has come from the derivatives market, with traders opening more positions on the futures market.
A large share of this surge has been driven by activity in energy markets, especially the WTI perpetual, which tracks West Texas Intermediate crude oil. Oil prices have recently surged to four-year highs amid geopolitical tensions in the Middle East involving the U.S., Israel, and Iran.
Reports indicate that Iran has threatened to block the Strait of Hormuz, a key maritime chokepoint. Iranian officials have noted that they would shift from reciprocal responses to continuous pressure as they attempt to push oil prices to as high as $200.
Investors are concerned about rising inflation as a result of surging oil prices. However, derivative traders were quick to capitalize on the volatility. Notably, WTI oil futures have become the most active HIP 3 contract on the platform, surpassing even precious metals like gold and silver, which had earlier dominated activity.
Open interest in the oil-linked contract has also grown significantly in the period. At the same time, the HIP 3 permissionless perpetuals market on Hyperliquid has recorded more than $1.2 billion in total open interest.
Besides the energy sector, Hyperliquid price also seems to have received a boost from traders turning to the platform as a 24/7 venue to speculate on geopolitical developments, particularly when traditional exchanges such as the CME and ICE are closed for the weekend or after hours.
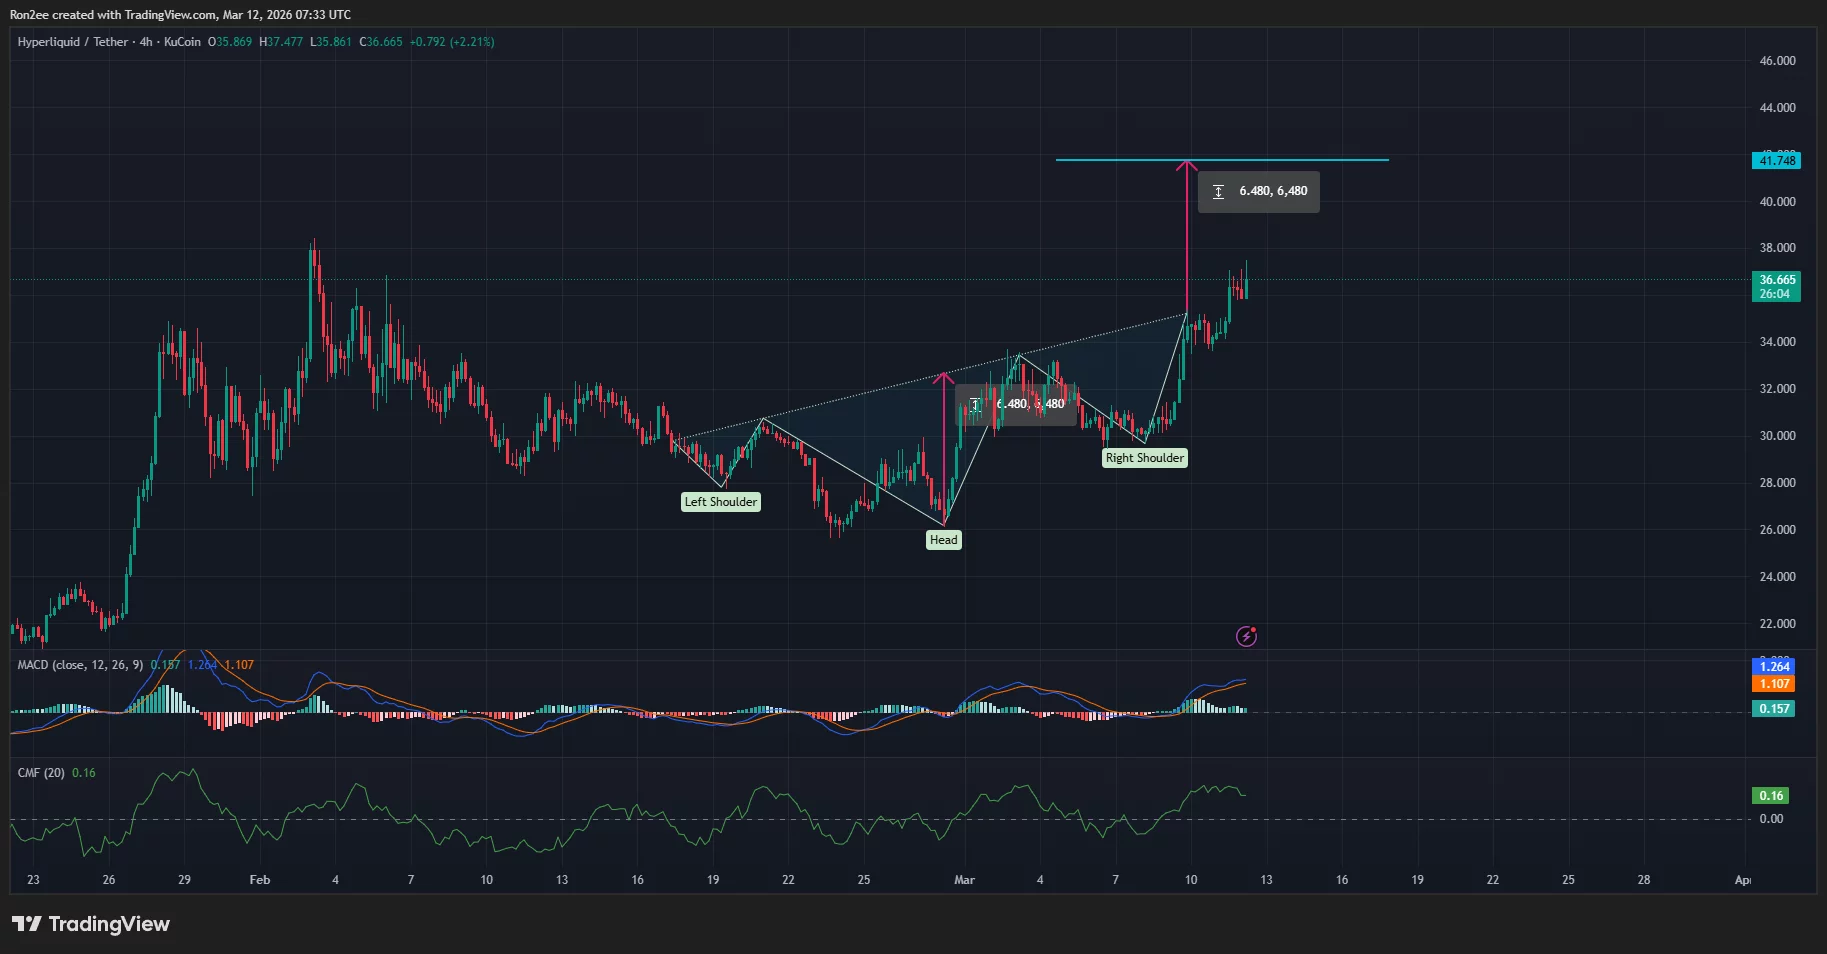
On the 4-hour chart, Hyperliquid price has confirmed a breakout from an inverse head and shoulders pattern that had been forming since mid-February this year. When such a pattern is confirmed, it typically tends to signal a bullish reversal. In the case of Hyperliquid, it seems to have further strengthened the uptrend.

As such, HYPE is likely to continue its uptrend past the $40 psychological resistance level to $41.7, a target calculated by adding the height of the inverse head and shoulders formed to the price point at which the pattern was confirmed.
The MACD indicator suggested that bulls were still in control of the market with the MACD lines trending upwards and above the zero line. At the same time, the Chaikin Money Flow index showed a positive 0.16 reading, a sign that capital was flowing into the market, helping sustain the ongoing bullish momentum.
Disclosure: This article does not represent investment advice. The content and materials featured on this page are for educational purposes only.
JPMorgan is facing a lawsuit for allegedly enabling a $328 million crypto Ponzi scheme run by now-defunct Goliath Ventures.
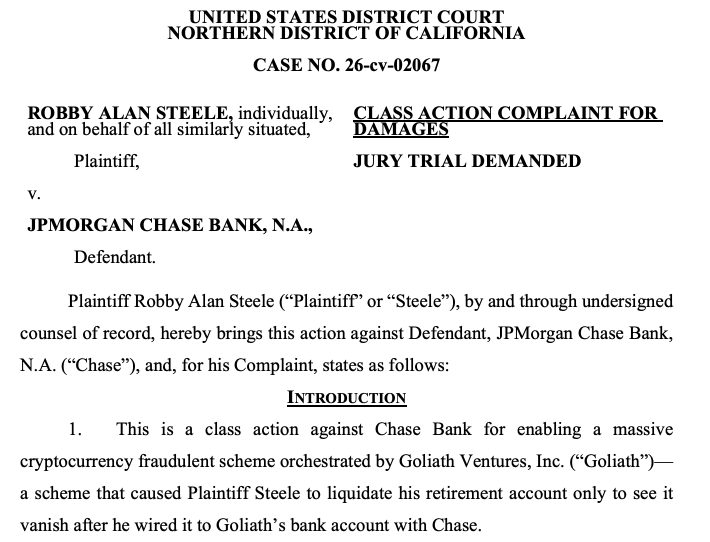
Investors on Tuesday filed a proposed class action in the US District Court for the Northern District of California, accusing JPMorgan of ignoring suspicious transactions and allowing Goliath to use its infrastructure to collect investor funds.
The lawsuit notes that despite JPMorgan CEO Jamie Dimon’s repeated criticism of Bitcoin (BTC), the bank allegedly failed to prevent crypto scammers from carrying out fraudulent wire transactions.
“Chase, by virtue of its Know Your Customer actually knew that Goliath was acting as a ‘private equity’ cryptocurrency pool operator investing money for investors, without being licensed at all to sell these investments,” the complaint states.
Complaint focuses on JPMorgan account flows
The US Attorney’s Office for the Middle District of Florida announced the arrest of Goliath CEO Christopher Delgado on Feb. 24. He faces a maximum penalty of 30 years in federal prison if convicted on all counts.
Prosecutors said Goliath Ventures, formerly known as Gen-Z Venture Firm, operated the scheme from January 2023 through January 2026.
The lawsuit claims JPMorgan was the sole banking institution for Goliath from January 2023 to May or June 2025. “Goliath obtained at least $328 million from what are believed to be over 2,000 investors,” the complaint notes.

The complaint also describes money moved from a JPMorgan account to Goliath wallets held at Coinbase.
It alleges that from January 2023 through June 2025, about $253 million was deposited into the bank’s 0305 account, which is nearly two-thirds of the $328 million investors reportedly provided. Of that total, roughly $123 million was transferred to Goliath’s wallets maintained by Coinbase.
US complaint also names Bank of America account
A separate criminal complaint filed by the US government said Goliath also held business accounts at Bank of America.
“Delgado was a co-signatory on the BOA 9136 account in the name of Goliath,” the Feb. 20 complaint states, adding that Goliath directors told at least one investor that Delgado controlled the account.

The complaint further detailed that funds sent by investors were primarily deposited into JPMorgan’s 0305 account or the BOA 9136 account or transferred directly to Goliath’s wallets at Coinbase.
The government said Delgado was the sole signatory on Goliath’s Coinbase wallets.
More complaints are coming as the team is still identifying victims
The complaint was filed by a team of attorneys from Shaw Lewenz, Sonn Law Group and Schwartzbaum. The first named plaintiff, Robby Alan Steele, said he invested a total of $650,000, including retirement funds.
Related: Ex-CFO sentenced to two years for $35M crypto fraud scheme
Shaw Lewenz’ Jordan Shaw said there would be more complaints to come, as the team is still identifying individuals and entities they believe to be complicit.
“We are being purposeful and precise in who we file against, to be complementary to the receiver and his efforts,” Shaw said, adding: “The goal is not to duplicate efforts, but instead to maximize recovery.”
Magazine: Would Bitcoin really be at $200K if not for Jane Street? Trade Secrets
Crypto World
MSTR’s STRC buys an estimated 7,000 BTC this week, but Two Prime CEO warns ‘no free lunch’


Around 7,000 bitcoin are estimated to have been purchased this week through Strategy’s (MSTR) perpetual preferred stock Stretch (STRC), underscoring how quickly the high yield instrument has become a key engine behind the company’s bitcoin accumulation.
But the structure carries risks, according to Alexander Blume, chief executive officer of Two Prime, an SEC registered investment adviser focused on institutional bitcoin yield strategies and bitcoin backed lending.
“There’s no free lunch,” Blume said. “A product that pays more than 6% over Treasuries must come with additional risk.”
Demand for the preferred shares has surged as investors search for higher returns. STRC currently yields at 11.5% and pays monthly cash distributions. Strategy has described the instrument as resembling a short duration, high yield savings instrument, with the dividend rate adjusted to help keep shares trading near their $100 par value while limiting price volatility.
The structure has helped accelerate Strategy’s bitcoin purchases. Market estimates suggest the company has bought more than 11,000 BTC over the past two weeks, bringing total accumulation through the product to roughly 34,000 BTC since it went live, according to STRC.live.
Corporate interest is also beginning to emerge. Asset manager Strive (ASST) recently disclosed a $50 million allocation to STRC, while digital credit firm Apyx said it recently purchased an additional 200,000 STRC shares, bringing its total holdings to 255,000 shares.
Blume said STRC was a major focus at the recent Strategy World conference, highlighting how central the product has become to the company’s capital strategy.
“We have seen a smattering of companies buy STRC,” Blume said, adding that some of the activity appears symbolic or partnership driven for now.
Blume also pointed to early efforts to build decentralized finance products on top of STRC, sometimes marketing them as savings like instruments despite volatility in the underlying asset.
STRC is designed to trade close to its $100 par value, but Blume said that is not guaranteed. A loss of confidence in the company, bitcoin or the preferred shares themselves could push the price below par and cause significant damage, he said.
STRC has on several occasions traded below its $100 par value, prompting the company to raise the dividend to help push the shares back toward par.
Blume added that strong momentum, available funding for interest payments and demand for high yield mean the structure is unlikely to face immediate problems.

The Ethereum price is showing signs of stabilization as large investors accumulate significant amounts of ETH from major cryptocurrency exchanges.
Summary
- Whale wallets withdrew over 74,000 ETH ($155M) from Binance and Kraken.
- Ethereum price is consolidating near $2,050 after February’s sharp correction.
- A breakout above $2,200 resistance could signal the next bullish move for ETH.
According to blockchain analytics shared by Lookonchain, a newly created wallet withdrew 11,629 Ethereum (ETH) worth about $23.7 million from Binance over the past two days.
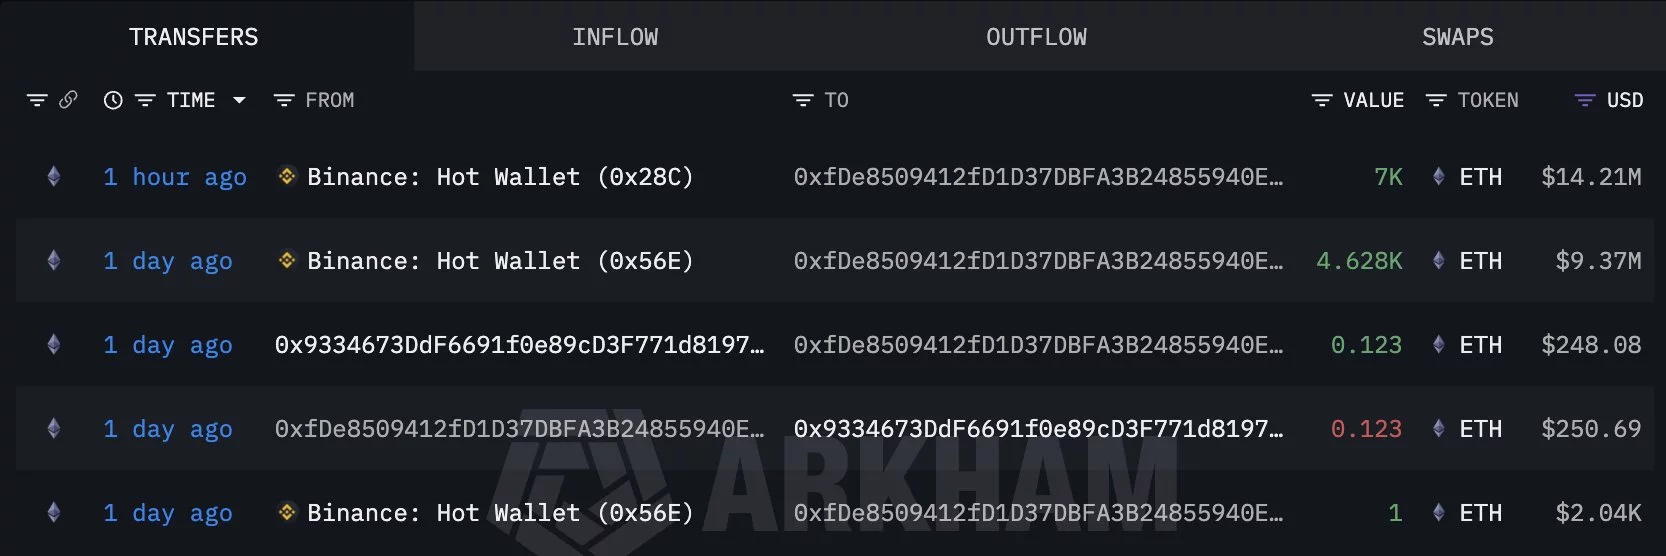
In a separate transaction, another whale wallet identified as 0x8E34 removed 63,324 ETH valued at roughly $131.2 million from Kraken during the same period.
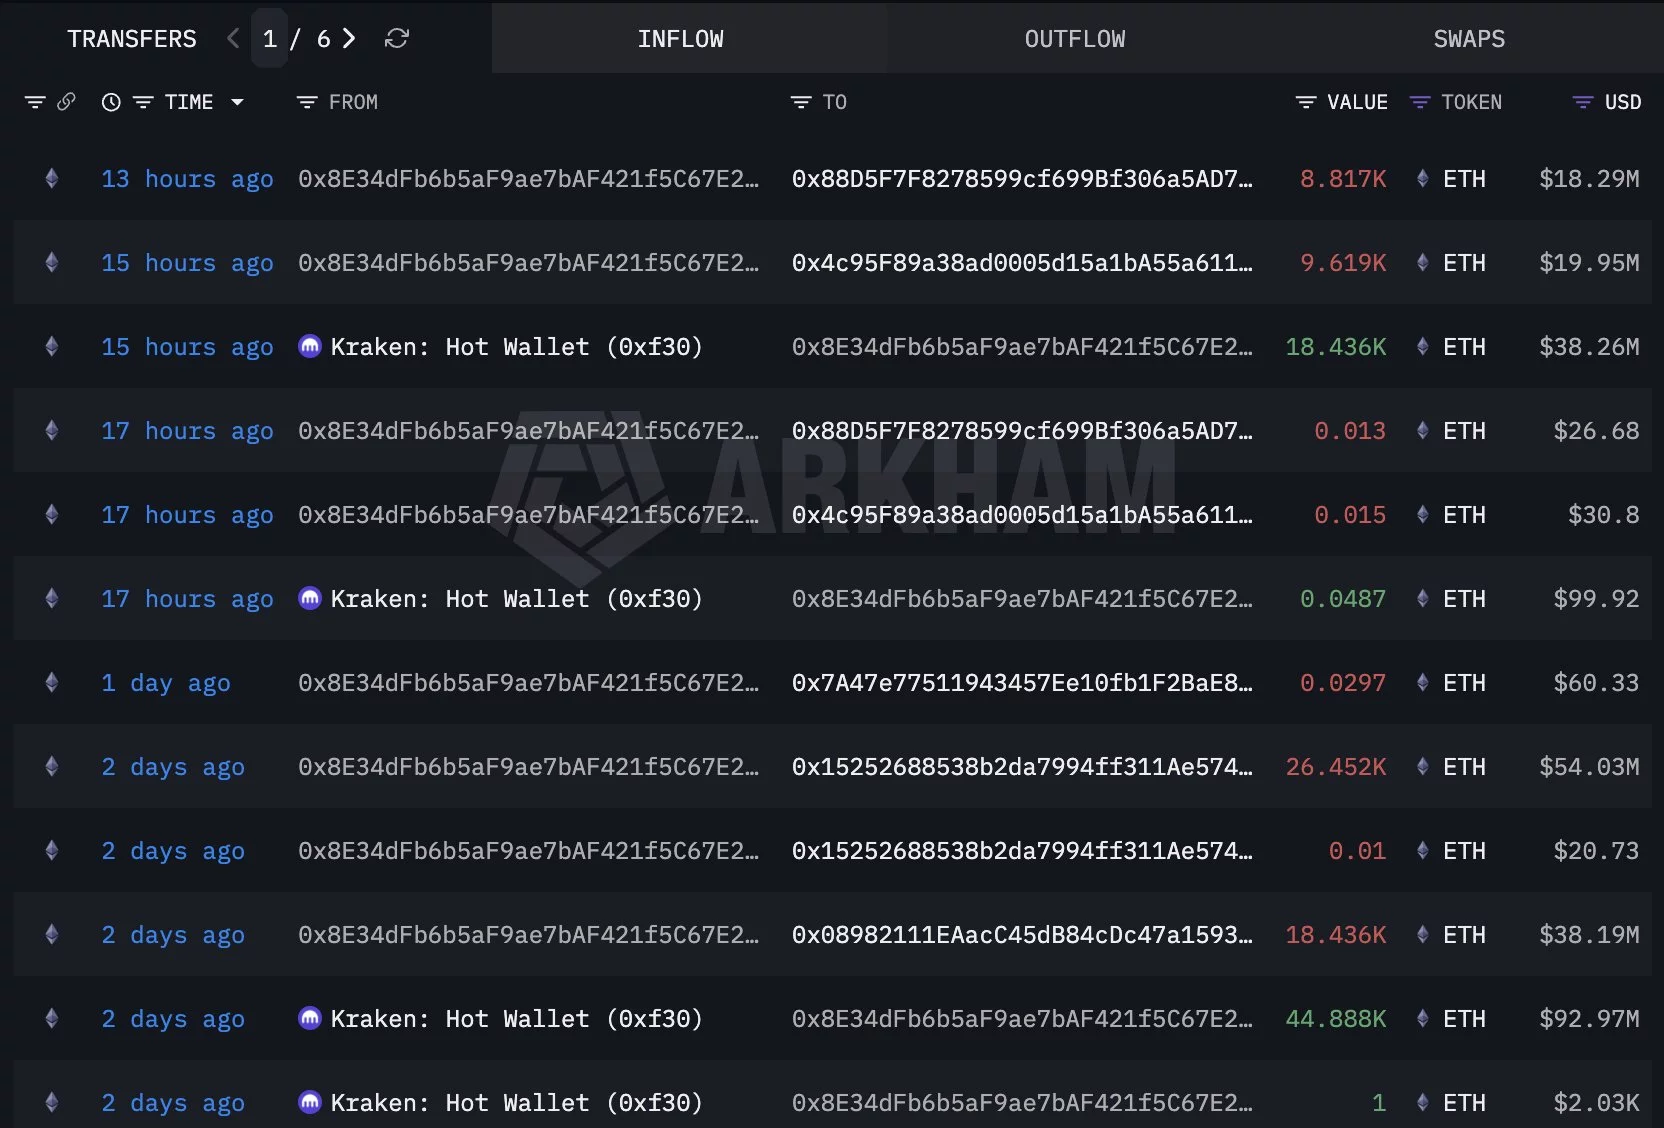
Large withdrawals from exchanges are often interpreted as a bullish signal because investors typically move assets to private wallets for long-term holding rather than immediate selling.
The combined withdrawals total more than 74,000 ETH, suggesting that institutional or high-net-worth investors may be positioning ahead of a potential price move.
Ethereum price analysis
Based on the ETH/USDT daily chart, Ethereum is currently trading around $2,050, remaining largely range-bound after a sharp correction earlier in February.
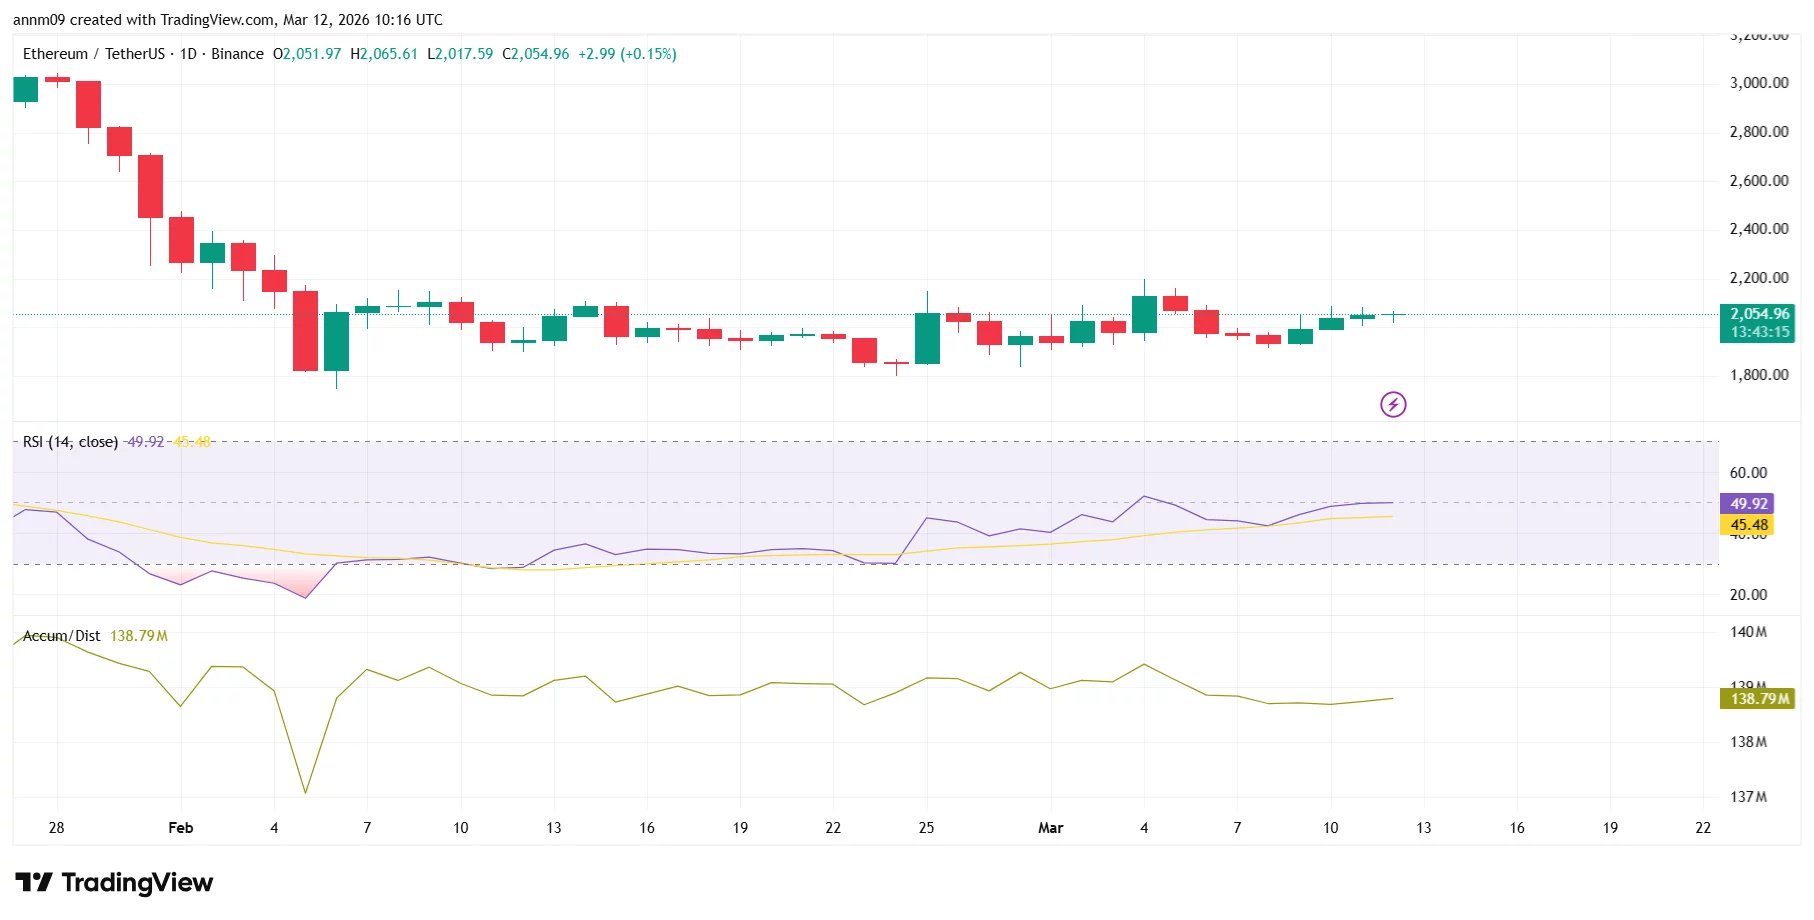
The chart shows that ETH has been consolidating between $1,950 and $2,150 for several weeks, forming a sideways structure after rebounding from lows near $1,800.
The immediate resistance level sits around $2,150–$2,200. A decisive breakout above this zone could trigger momentum toward the $2,400 level, where the previous sell-off accelerated.
On the downside, strong support appears near $1,950, with deeper structural support around $1,800, which marked the February bottom.
The Relative Strength Index (RSI) is currently near 50, reflecting neutral momentum and suggesting the asset is neither overbought nor oversold. This reading typically occurs during consolidation phases before a larger directional move.
Meanwhile, the Accumulation/Distribution indicator is stabilizing after a sharp drop earlier in the month, hinting that buying pressure may be gradually returning.
The recent whale withdrawals could tighten exchange supply if the coins remain off trading platforms. When combined with Ethereum’s current consolidation pattern, such accumulation phases often precede stronger price movements.
However, traders will likely watch for a break above $2,200 to confirm a bullish continuation. Until then, Ethereum may remain trapped within its current range as the market waits for a decisive catalyst.


- TRUMP meme coin slides to $2.86 amid selling pressure.
- The team has moved 5 million tokens to Binance, sparking fears of a sell-off.
- The key support sits at $2.80 with $2.50 as the next downside level.
The price of Official Trump (TRUMP) memecoin has fallen sharply as selling pressure continues to dominate the market.
The politically themed meme coin is trading around $2.86 after losing more ground over the past 24 hours.

This drop extends a deeper slide that has pushed the token down more than 16% over the last week.
The continued decline has left the asset hovering near its lowest levels since its explosive debut rally.
Analysts now believe the current move reflects a broader loss of momentum rather than a brief pullback.
Sentiment around the token has also cooled significantly as the excitement that once fueled its rapid rise fades.
Official Trump team moves $5 million tokens to Binance
The situation intensified after reports emerged that wallets connected to the project moved roughly five million TRUMP tokens to the exchange Binance.
The transfer was valued at more than $17 million at the time it occurred.
Large movements of tokens to exchanges often raise concerns that insiders may be preparing to sell, and such activity can quickly trigger anxiety among traders who fear additional supply entering the market.
That fear alone can be enough to push prices lower as investors rush to exit positions.
In this case, the timing of the transfer has added to the already bearish mood surrounding the token.
The market had already been showing signs of weakness before the transaction became public.
Selling pressure has remained steady for several weeks, preventing any meaningful recovery attempts.
Even brief rebounds have struggled to gain traction as traders continue to reduce exposure.
Lower trading volume in recent sessions also suggests that buying interest has faded.
When demand weakens during a downtrend, sellers often dictate the market’s direction.
This pattern has been clearly visible in the recent price action.
Other micro and macro factors affecting TRUMP meme coin
Bitcoin (BTC) has slipped slightly during the same period, adding to a risk-off environment for digital assets.
Although the wider market declined modestly, meme coins tend to respond more aggressively to shifts in sentiment.
Assets driven largely by hype and narrative often struggle when traders become more cautious.
The TRUMP token is particularly sensitive to sentiment because its appeal is closely tied to the public perception of Donald Trump.
As political narratives shift, investor enthusiasm for the coin can change just as quickly.
This connection between politics and price action has made the token one of the most sentiment-driven assets in the crypto space.
Recent developments suggest that the speculative energy surrounding the project is waning.
Without fresh catalysts or renewed social media hype, the token has struggled to attract new buyers.
That lack of momentum has left the coin vulnerable to extended corrections.
The sharp drop from its peak earlier in the year highlights how quickly meme-driven rallies can reverse.
What once looked like unstoppable momentum has turned into a steady downtrend.
For now, traders appear to be waiting for clearer signals before committing to new positions.
TRUMP price forecast
From a technical standpoint, the most important support level is near $2.80.
Holding above this level could allow the token to stabilise and enter a consolidation phase.
Such a period of sideways movement would indicate that selling pressure is beginning to slow.
However, a decisive break below $2.80 could open the door to another wave of losses, with the next key level traders should watch around $2.50.
A move toward that area would continue the current bearish trend.
On the upside, the first sign of strength would be a recovery back above the $3.00 mark.
Reclaiming that level could signal that the recent downtrend is losing momentum.
Until that happens, the overall market bias remains cautious.
Traders should also pay close attention to Bitcoin’s direction, which often sets the tone for the broader crypto market.
A stronger push from BTC could help restore confidence across altcoins and meme tokens.
If that occurs while the TRUMP meme coin holds key support levels, the chances of a recovery rally would improve.
However, for now, the market remains fragile, with sentiment still leaning bearish.

Key Highlights
- Shares of Nebius Group surged 16.14% Wednesday following Nvidia’s announcement of a $2 billion strategic investment.
- The partnership aims to deliver more than 5 gigawatts of AI computing power before 2031.
- The agreement grants Nebius priority access to Nvidia’s cutting-edge computing platforms and involves joint development of massive AI facilities.
- The AI cloud provider has secured $20.4 billion in commitments from tech giants Microsoft and Meta, targeting $7B–$9B in annual recurring revenue by year’s end.
- Competing neocloud providers CoreWeave (CRWV) and IREN saw gains of 9.4% and 10% respectively following the announcement.
Shares of Nebius Group rallied 16% during Wednesday’s trading session after chip giant Nvidia disclosed a $2 billion investment in the Amsterdam-headquartered AI cloud infrastructure provider. The capital infusion is tied to a strategic alliance focused on scaling AI computing capabilities globally.
Nvidia characterized the investment as a testament to Nebius’s technical expertise and execution capabilities. Under the agreement, both organizations will collaborate on architecting and rolling out next-generation AI data center facilities, with Nebius receiving preferential access to Nvidia’s emerging computing platforms.
The strategic alliance extends to joint development of software infrastructure and management systems designed to operate massive AI computing environments. According to Nebius, this partnership will accelerate the expansion of computing resources across its worldwide network.
Unlike traditional hyperscale cloud providers, Nebius operates as a neocloud—a cloud infrastructure company engineered from the ground up exclusively for artificial intelligence applications. This specialized, efficiency-focused approach has proven attractive to enterprise customers with substantial AI requirements.
Microsoft has committed to procuring $17.4 billion worth of computing capacity from Nebius across a five-year timeframe. Social media giant Meta subsequently signed a separate $3 billion agreement. These contract values indicate serious enterprise adoption.
The company projects it will bring between 800 megawatts and one gigawatt of connected computing power online by late 2026. Power agreements already in place exceed three gigawatts of contracted capacity.
Management forecasts annual recurring revenue will reach the $7 billion to $9 billion range by the conclusion of this year. For an organization that remains relatively unknown to many investors, this represents a dramatic scaling trajectory.
Earlier in the month, Nebius obtained regulatory clearance to construct a 1.2-gigawatt data center complex in Independence, Missouri. The facility is anticipated to generate approximately 1,200 construction positions and 130 full-time operational roles.
The Missouri development also incorporates over $650 million in tax incentive payments distributed across two decades. This structure signals long-term commitment from both the company and local government.
Nvidia CEO Jensen Huang characterized Nebius as constructing an AI cloud infrastructure purpose-built for the agentic intelligence era, with complete integration spanning from chip architecture to application software. Such public validation from Huang carries significant influence within the AI infrastructure ecosystem.
Broader Market Impact
The Nvidia-Nebius partnership triggered gains beyond NBIS shares alone. CoreWeave (CRWV) advanced 9.4% Wednesday in a sympathy move. Nvidia maintains a substantial ownership position in CoreWeave and announced an additional $2 billion investment in January.
Smaller competitor IREN appreciated 10% during the session. Market participants interpreted the Nebius transaction as validation for the entire neocloud business model.
This marks Nvidia’s third $2 billion infrastructure commitment in recent weeks. In the preceding week, the semiconductor manufacturer announced matching $2 billion investments in both Lumentum and Coherent to advance optical networking technologies critical for AI data center operations.
Nvidia’s Infrastructure Push
The Nebius investment announcement arrives concurrent with Oracle revealing it has locked in more than 10 gigawatts of power capacity and corresponding data center infrastructure scheduled to come online within the next 36 months.
Oracle’s infrastructure expansion supports an approximately $300 billion cloud services agreement with OpenAI. Nvidia has separately invested $30 billion directly in OpenAI.
Nebius carried a market capitalization slightly above $24 billion based on Tuesday’s closing price. Nvidia’s $2 billion commitment equals approximately 8% of that valuation.
Strictly professionals enjoy double ‘date night’ amid shake-up claims

Inspired Homes, founder Vasko Spaseski fined over defects

Oil Surges Near $100 Stalling Bitcoin Breakout


-
Business6 days ago
Form 8K Entergy Mississippi LLC For: 6 March
-

 News Videos3 days ago
10th Algebra | Financial Planning | Question Bank Solution | Board Exam 2026
-

 Fashion6 days ago
Weekend Open Thread: Ann Taylor
-

 Crypto World3 days ago
Paradigm, a16z, Winklevoss Capital, Balaji Srinivasan among investors in ZODL
-
 Tech1 day ago
A 1,300-Pound NASA Spacecraft To Re-Enter Earth’s Atmosphere
-
 Sports7 days ago
499 runs and 34 sixes later, India beat England to enter T20 World Cup final | Cricket News
-

 Politics6 days ago
Top Mamdani aide takes progressive project to the UK
-

 Business2 days ago
ExxonMobil seeks to move corporate registration from New Jersey to Texas
-

 Sports4 days ago
Braveheart Lakshya downs Lai in epic battle to enter All England Open final | Other Sports News
-

 Sports5 days ago
Three share 2-shot lead entering final round in Hong Kong
-

 NewsBeat17 hours ago
Residents reaction as Shildon murder probe enters second day
-

 Tech2 days ago
ChatGPT will now generate interactive visuals to help you with math and science concepts
-

 NewsBeat7 days ago
Piccadilly Circus just unveiled ‘London’s newest tourist attraction’ and it only costs 80p to enter
-

 Entertainment5 days ago
Hailey Bieber Poses For Sexy Selfies In New Luscious Lip Thirst Traps
-

 Business4 days ago
Search for Nancy Guthrie Enters 37th Day as FBI Probes Wi-Fi Jammer Theory
-

 Business1 day ago
Search Enters Sixth Week With New Leads in Tucson Abduction Case
-
 NewsBeat2 days ago
Pagazzi Lighting enters administration as 70 jobs lost and 11 stores close across Scotland
-

 Tech3 days ago
Despite challenges, Ireland sixth in EU for board gender diversity
-

 Business3 days ago
Search Enters 39th Day with FBI Tip Line Developments and No Major Breakthroughs
-

 NewsBeat21 hours ago
I Entered The Manosphere. Nothing Could Prepare Me For What I Found.