
Crypto World
Ripple Price Analysis: Has XRP’s Prolonged Bear Market Started Already?

Ripple’s native token remains under strong bearish pressure, with the price continuing to respect a well-defined descending structure. The recent sell-off has pushed it into a major higher-timeframe demand zone, while momentum and structure still favor sellers. Nevertheless, the asset is likely to enter a consolidations tage for the short-term.
Ripple Price Analysis: The Daily Chart
On the daily timeframe, XRP has cleanly broken below multiple structural supports, confirming a bearish continuation scenario. The price has been forming lower lows and lower highs, indicating a notable sell-off. The asset has now reached a significant support at the $1.5 range, which represents the last meaningful buyers’ base before a potential deeper drawdown.
Nevertheless, previous daily demand zones have now flipped into strong supply, capping upside attempts. As long as the price remains below the $2.00–$2.20 reclaimed supply region, any bounce should be treated as corrective.
This daily structure suggests XRP is in a distribution markdown phase, with buyers currently reacting defensively rather than aggressively accumulating.
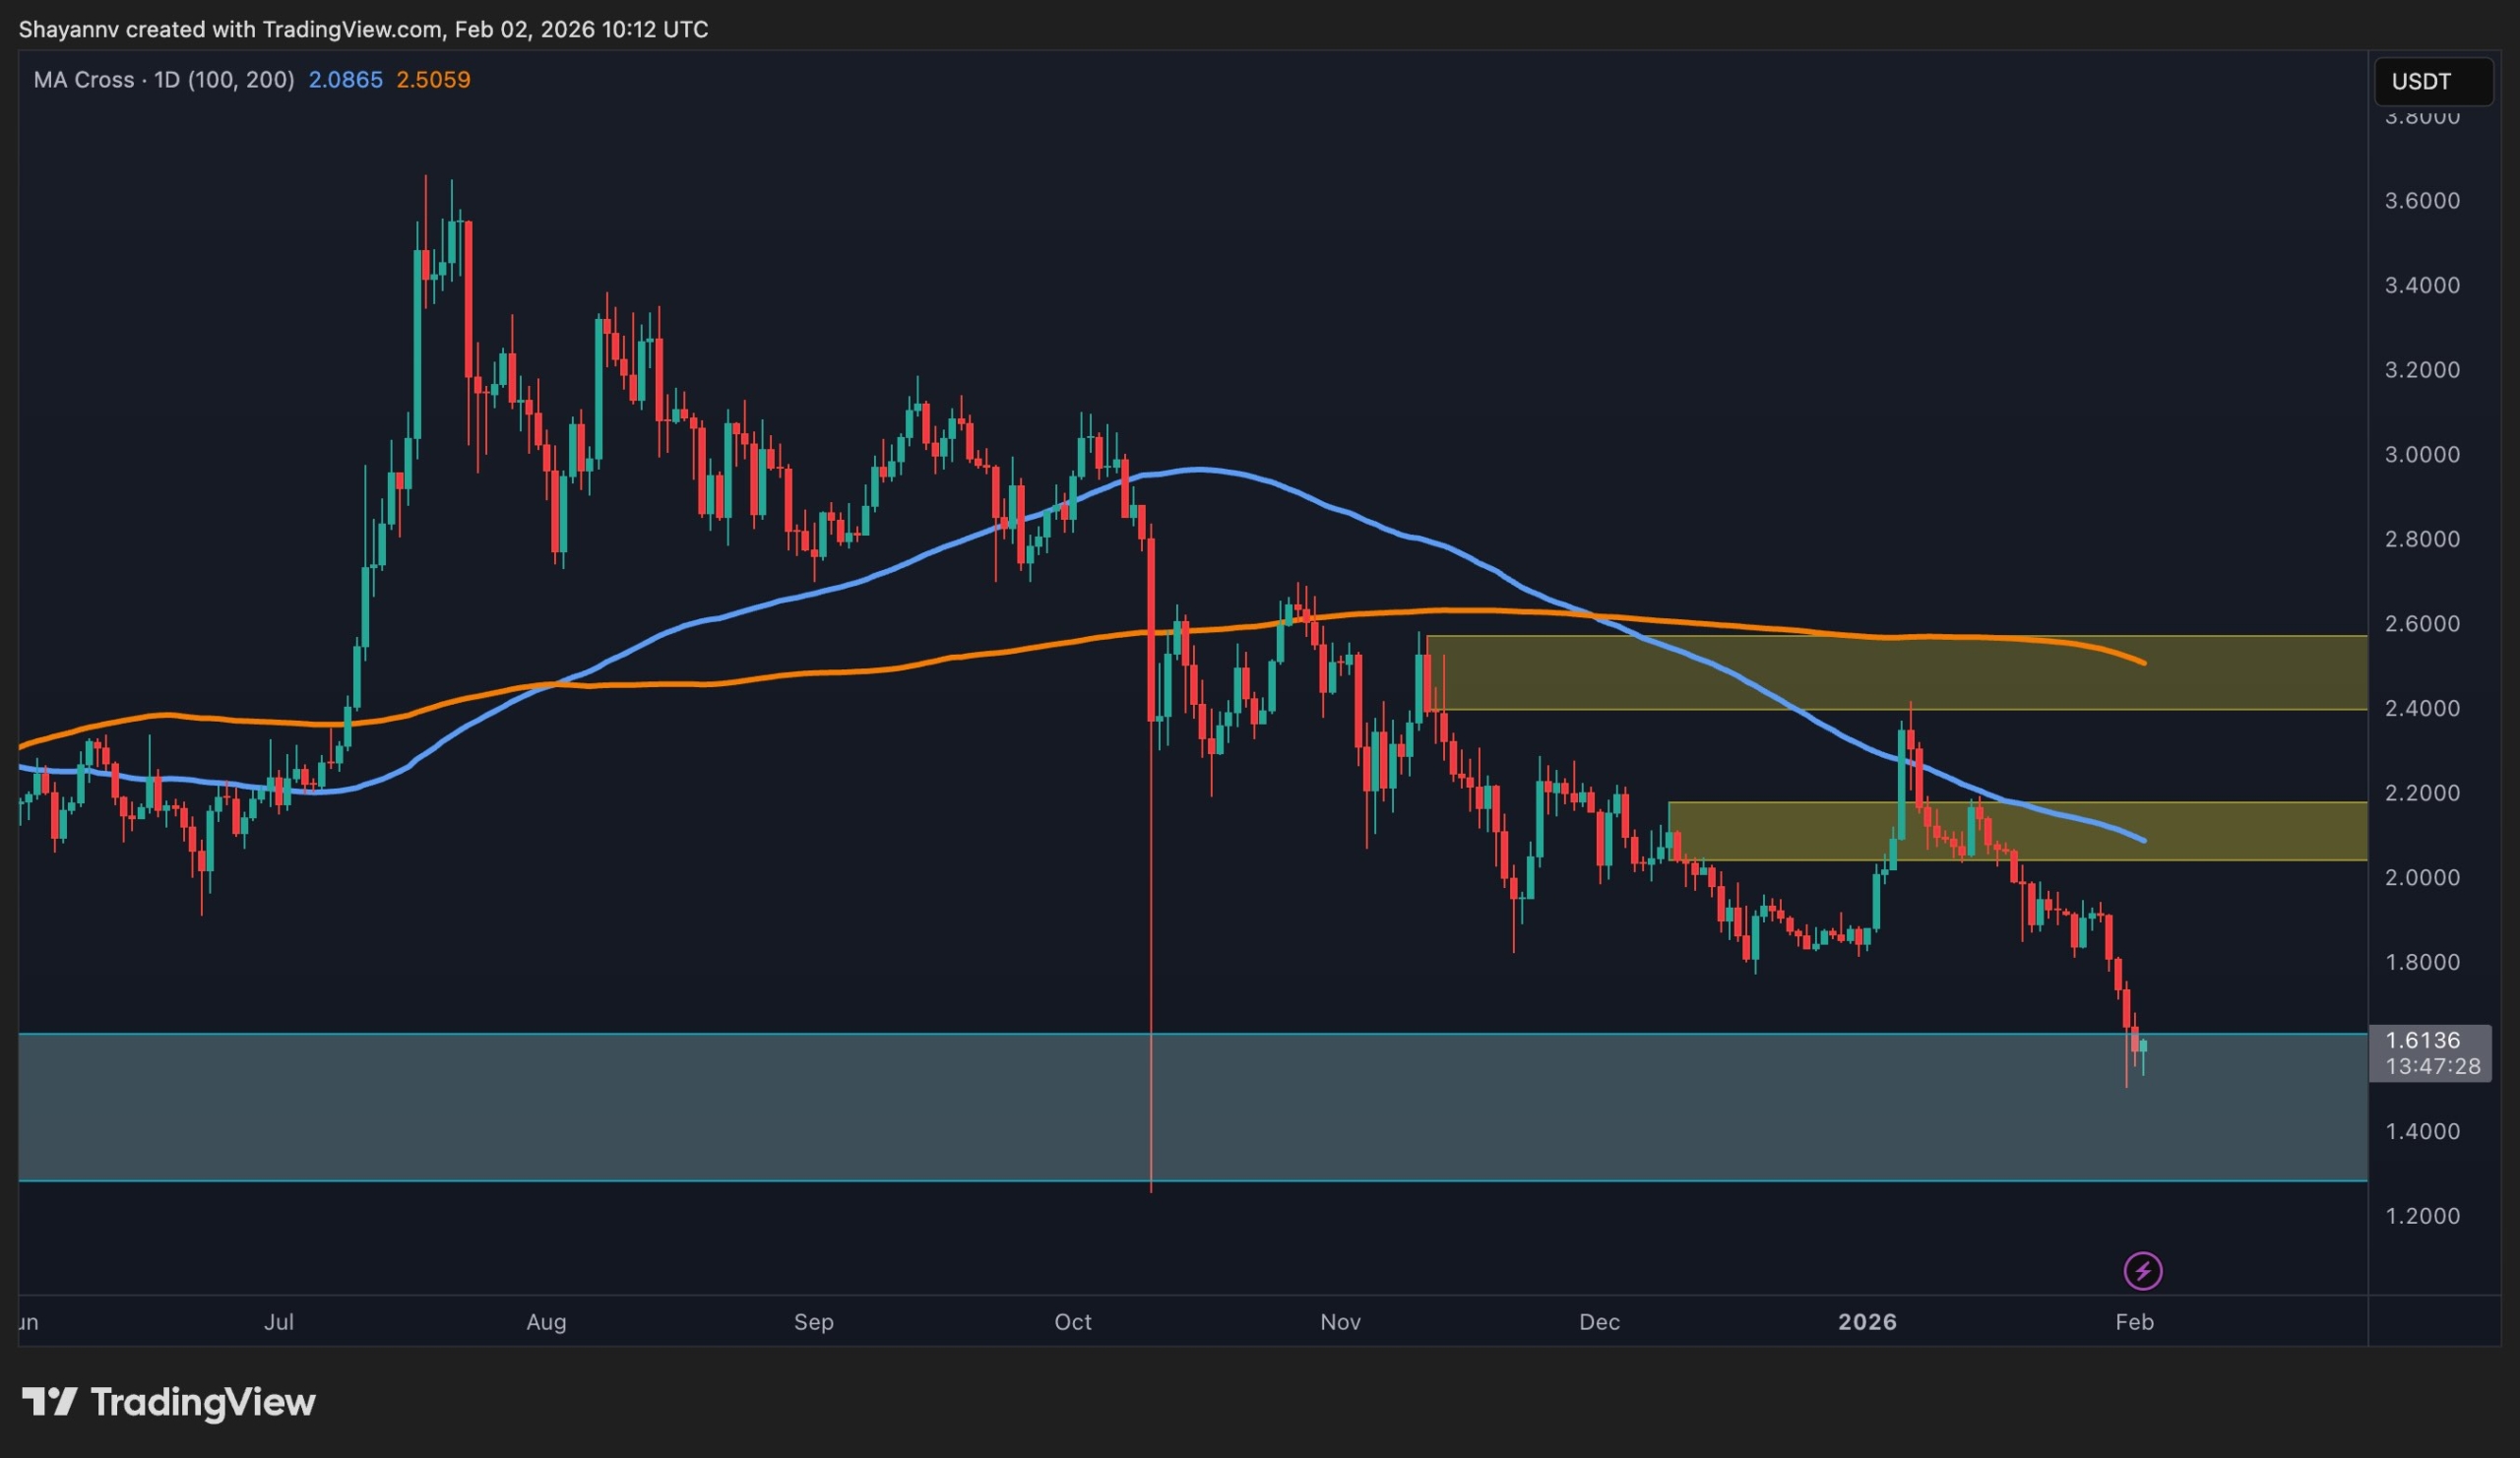
XRP/USDT 4-Hour Chart
On the 4-hour timeframe, price action clearly shows trend continuation within a descending channel. After failing to hold the $1.85–$1.90 support band, XRP accelerated lower, breaking structure and expanding downside momentum. The most recent push lower also invalidated any short-term higher-low attempts.
The broken $1.85–$1.90 zone is now acting as a near-term supply. Any relief bounce into this area would likely be a pullback opportunity, not a reversal signal.
On the other hand, the descending trendline continues to guide price lower, keeping bearish structure intact. Failure to hold the current demand zone increases the probability of a deeper sweep toward the lower HTF demand region around the $1.30–$1.40 area.

The post Ripple Price Analysis: Has XRP’s Prolonged Bear Market Started Already? appeared first on CryptoPotato.


Iran is demanding cryptocurrency payments from tankers transiting the Strait of Hormuz. Hamid Hosseini, spokesperson for Iran’s Oil, Gas and Petrochemical Products Exporters’ Union, specifically named Bitcoin (BTC) in a recent statement.
However, Chainalysis suggests that stablecoins could be the instrument of choice, consistent with how the Islamic Revolutionary Guard Corps (IRGC) has historically moved money.
Stablecoins Fit Iran’s Playbook
Chainalysis argues that stablecoins, not BTC, will likely serve as the IRGC’s toll collection instrument. The firm pointed to the regime’s well-documented preference for dollar-pegged tokens across years of illicit trade.
The reasoning is straightforward. Dollar-pegged stablecoins preserve value in ways BTC cannot. Iran’s rial has lost substantial value against the dollar, making price stability essential for large-scale commercial revenue.
Bitcoin’s regular volatility would expose toll proceeds to unpredictable losses between collection and conversion.
“The regime has leveraged stablecoins because their backing by the US dollar guarantees preservation of value and provides the liquidity necessary for use at scale,” the report read. “Bitcoin, by contrast, experiences regular price volatility.”
Chainalysis noted that the IRGC has historically relied on stablecoins across oil sales, weapons procurement, and proxy financing. Bitcoin, by contrast, has served a different function within Iran’s crypto operations.
The report primarily linked it to Iranian cyber actors running ransomware campaigns and other malicious operations. That is a fundamentally different use case from high-volume, commerce-oriented toll collection.
Follow us on X to get the latest news as it happens
Billions Already on Chain
The scale of the IRGC’s existing crypto operations reinforces why stablecoins may be the likely choice. Chainalysis estimated that IRGC-associated wallet addresses received over $2 billion in 2024.
That figure spiked above $3 billion in 2025, representing roughly half of Iran’s total crypto ecosystem by the fourth quarter.
Those numbers are considered lower-bound estimates. They include only addresses identified through OFAC designations and Israel’s National Bureau for Counter Terror Financing seizure lists. The full network of shell companies and intermediary wallets remains larger.
Before the closure, the Strait of Hormuz handled around 20 million barrels of oil per day, roughly 20% of the global seaborne oil trade. At $1 per barrel, even partial toll collection on current volumes could generate billions annually. Stablecoins offer the throughput and liquidity that kind of scale demands.
“These oil shipments could generate sorely needed revenue for the regime during the most severe threat to the Islamic Republic in decades,” Chainalysis added.
However, stablecoins carry their own risk for Tehran. Unlike BTC, stablecoin issuers can freeze assets held in designated wallets. Chainalysis flagged this as a key intervention point for regulators and law enforcement if the stablecoin toll program materializes.
Subscribe to our YouTube channel to watch leaders and journalists provide expert insights
The post Iran’s Hormuz Toll Could be In Stablecoins, Not Bitcoin appeared first on BeInCrypto.
Key Takeaways
- The WLFI token plunged 12% to reach an all-time low since its 2025 debut
- The project leveraged its native WLFI tokens as collateral for stablecoin loans on the Dolomite platform
- This borrowing activity exhausted Dolomite’s USD1 liquidity pool, preventing other users from accessing withdrawals
- Tron’s Justin Sun saw his locked WLFI position decline by more than $11 million within 24 hours
- Treasury repurchase operations are currently underwater by approximately 48%
The World Liberty Financial token experienced a sharp 12% decline over a 24-hour period, reaching its lowest valuation since its 2025 introduction. The digital asset traded around $0.0818, compounding weekly declines of 15% and monthly losses totaling 17%.

The dramatic price movement followed a CoinDesk investigation revealing that WLFI had pledged billions of its proprietary governance tokens as collateral within the Dolomite lending infrastructure. Using this collateral base, the initiative secured substantial stablecoin loans, including USDC and its proprietary USD1 token, totaling tens of millions of dollars.
Blockchain intelligence from Arykham verified that a project-controlled wallet deposited 5 billion WLFI tokens as collateral on Dolomite, facilitating approximately $75 million in stablecoin borrowings. Subsequently, more than $40 million of these borrowed assets were moved to Coinbase Prime.
This substantial borrowing activity maxed out Dolomite’s available lending capacity, creating a liquidity crisis that temporarily prevented other protocol participants from accessing their deposited capital.
Project Team Addresses Growing Concerns
World Liberty Financial published a detailed response thread on X, characterizing the criticism as baseless fearmongering. The organization emphasized that liquidation risks remain minimal.
“In the event of significant market volatility against our position, we maintain the capability to supply additional collateral,” the team explained. However, skeptics noted that pledging more WLFI tokens to support existing WLFI-backed positions—particularly on a platform where a WLFI advisor holds leadership—compounds circular risk rather than mitigating it.
Adding to the controversy, Dolomite co-founder Corey Caplan simultaneously serves in an advisory capacity for World Liberty Financial, intensifying questions about potential conflicts of interest among industry observers.
According to project disclosures, WLFI allocated $65.58 million toward repurchasing 435.3 million tokens across six months, achieving an average acquisition price of $0.1507. With current market prices hovering near $0.078, these buyback initiatives represent unrealized losses of roughly 48%.
Significant Losses for Justin Sun
Justin Sun, the founder of Tron, witnessed his immobilized WLFI holdings depreciate by over $11 million in a single trading session. Sun initially committed $30 million to World Liberty Financial during late 2024, subsequently expanding his stake to approximately $75 million.
Following the movement of roughly $9 million in WLFI from Sun’s wallet last year, World Liberty Financial blacklisted his address, effectively freezing his token holdings. According to blockchain analytics provider Bubblemaps, Sun currently possesses approximately 545 million frozen WLFI tokens valued at roughly $45 million—representing a decline exceeding $80 million from previous valuations.
An additional 3 billion WLFI tokens remain in an intermediary wallet following treasury operations conducted on April 2 and April 7, presently valued at approximately $234 million.
Technical indicators show the Relative Strength Index approaching 30, nearing oversold conditions, while the MACD reflects persistent bearish momentum. Immediate support is positioned at $0.079, with potential downside objectives at $0.075 and $0.070 should selling intensity persist.

WLFI, the native token of World Liberty Financial—the Donald Trump–backed platform—took a deeper slide over the weekend as new on-chain disclosures raised questions about the project’s use of its own tokens as loan collateral. Trading near $0.078, WLFI marked an all-time low after sinking roughly 83% from its September peak around $0.46, according to data tracked by CoinMarketCap. The fresh selloff followed revelations that wallets tied to World Liberty Financial deposited substantial WLFI holdings on Dolomite, a DeFi lending protocol co-founded by the project’s chief technology officer, Corey Caplan, and then used those tokens as collateral to borrow USD1 and USDC stablecoins. The proceeds were partly moved to Coinbase Prime, fueling concerns about liquidity and risk in a relatively obscure DeFi niche.
On-chain analytics from Arkham show a wallet associated with World Liberty Financial placing a colossal 5 billion WLFI tokens on Dolomite. The same wallet subsequently borrowed about $75 million in USD1 and USDC and transferred more than $40 million to Coinbase Prime. The size of the position ignited debate among DeFi observers about whether WLFI’s price could withstand a material move in liquidation risk should the token’s liquidity prove insufficient to cover a rapid margin call.
Key takeaways
- WLFI traded around $0.078 after hitting an all-time low near $0.077, marking an 83% decline from its September high of about $0.46 (CoinMarketCap).
- On-chain data from Arkham indicates a wallet linked to World Liberty Financial deposited roughly 5 billion WLFI on Dolomite and used the collateral to borrow around $75 million in USD1 and USDC, with more than $40 million moved to Coinbase Prime.
- Dolomite’s footprint remains modest within DeFi, ranking about 19th by total value locked (TVL) among lending protocols, per DefiLlama.
- World Liberty acknowledges its lending activity, asserting that its positions sit well above liquidation thresholds and characterizes itself as an “anchor borrower” intended to generate yield for users amid low traditional-market activity.
- A governance proposal is planned to implement a phased unlock schedule for WLFI held by early retail buyers, replacing immediate access with a long-term vesting plan subject to community vote.
On-chain activity and the liquidity question
The core concern centers on the scale of WLFI used as collateral and what a price move could trigger for lenders on Dolomite. Analysts have warned that a 5% or larger forced sale of WLFI from such a large collateral position could compress liquidity quickly, given WLFI’s market depth and the token’s relatively modest liquidity profile. While World Liberty’s public communications emphasize that the loan book remains well above liquidation thresholds, observers note that a sudden price shock or a cascade of liquidations could expose both the Dolomite pool and other users who rely on its lending markets.
Dolomite’s standing in the DeFi universe is notable but not outsized. It sits far below leaders by TVL, a reality that can complicate risk management for lenders that rely on single-asset collateral with limited trading liquidity. This backdrop amplifies the importance of robust risk controls and transparent governance, especially when a token possesses a high narrative premium but limited natural liquidity.
World Liberty’s stance and the governance plan ahead
World Liberty Financial responded to the disclosures through social channels, arguing that the firm’s positions are prudent and that the strategy serves as a mechanism to provide outsized stablecoin yields in an environment where traditional assets often yield little. The project described itself as an “anchor borrower,” a role intended to stabilize the WLFI ecosystem while delivering yield to everyday users who participate in the platform’s offerings.
In a move to address investor concerns about token dynamics, World Liberty said on X that it would soon submit a governance proposal aimed at altering token unlock mechanics. The plan would replace the immediate access enjoyed by early retail WLFI holders with a phased unlock schedule, implemented through a community-driven vote. If approved, the long-term vesting framework could help reduce the likelihood of abrupt, large-scale WLFI selling pressure tied to token distribution, potentially easing some market anxiety in the near term.
Broader implications for WLFI holders and DeFi markets
The episode underscores several recurring themes in crypto markets: the tension between tokenomics and practical liquidity, the risk of using a highly concentrated or illiquid token as the backbone for large-margin loans, and the sensitivity of retail holders to governance decisions that affect token accessibility.
For investors and traders, the development highlights a few practical considerations. First, even seemingly large, high-profile projects can face liquidity strains when a significant portion of the supply is deployed as collateral on a single DeFi venue. Second, governance proposals—especially those that affect vesting and unlock schedules—can materially shape perceived risk and price dynamics. Third, the ongoing move to clarify and formalize unlock mechanics signals a maturation process in a sector where tokenized projects have historically offered broad access with less emphasis on long-term holder alignment.
From a market structure perspective, the Dolomite exposure calls into question the risk budgeting of smaller DeFi lending platforms that might rely on a handful of large positions. While Dolomite remains a relatively small player by TVL, the event illustrates how collateral quality and token liquidity can become systemic concerns when a project is positioned as a solar-anchored yield generator for a broad user base.
In the context of broader regulatory and market developments, observers will be watching for how governance shifts are implemented and whether additional disclosures accompany on-chain activity into future quarters. The balance between encouraging user-friendly yields and maintaining robust risk controls will likely shape both WLFI’s trajectory and the wider DeFi lending landscape as platforms evaluate collateral standards and liquidity risk frameworks.
As WLFI navigates this period of scrutiny, investors should monitor price action, liquidity cues, and the outcomes of forthcoming governance discussions. The unfolding narrative will help determine whether the project can restore confidence in its tokenomics, or whether tighter risk management and more transparent capital practices will become the baseline expectation for participants in WLFI’s ecosystem.
Source notes: WLFI’s price data tracked by CoinMarketCap; on-chain activity and collateral details drawn from Arkham analytics; the project’s DeFi footprint cited via DefiLlama; official responses and governance plans referenced through World Liberty Financial’s public statements.


Grayscale has updated its list of digital assets under consideration for future investment products.
Summary
- Grayscale named HYPE, TON, TRX and ENA among digital assets under consideration this quarter today.
- The asset manager also filed with the SEC to launch a spot HYPE ETF.
- Zcash surged over 30% after reports linked Grayscale activity to renewed demand in markets.
The latest Q2 2026 list includes several large and emerging tokens, while a separate filing tied to Hyperliquid’s HYPE token has added more attention to the asset manager’s next product moves.
Grayscale said its latest Q2 2026 review covers digital assets it may include in future investment products. The company grouped the list under its crypto sector framework and said it plans to refresh the list as often as 15 days after each quarter ends.
The new watchlist includes CC, CELO, MNT, MON, TON, TRX, ENA, HYPE, JUP, KMNO, SYRUP, MORPHO and PENDLE. It also names other assets such as ROBO, FLOCK, GRASS, KAITO, KITE, VVV, VIRTUAL, WLD, GEOD, HNT, JTO, ZRO and W.
Grayscale said the list includes assets not yet held in its current product suite. It added that the list remains subject to change during the quarter as multi-asset funds reconstitute and as new single-asset products launch.
The company also named MegaETH, Nous Research and Poseidon with an asterisk. That suggests those projects remain under review but may not yet trade as standard liquid tokens in the same way as others on the list.
HYPE ETF filing adds new focus
Attention around the Grayscale update increased after reports said the firm filed with the US Securities and Exchange Commission for a spot HYPE ETF in March. The proposed fund would track Hyperliquid’s native token if regulators approve the product.
That filing places HYPE in two active discussions at the same time. It appears on Grayscale’s Q2 assets under consideration list, and it is also linked to a separate exchange-traded fund proposal.
Bitwise is signaling the imminent launch of a US exchange-traded fund (ETF) tied to the decentralized trading network Hyperliquid.
In an amended registration statement filed with the SEC, the digital asset index fund manager disclosed critical operational details for the proposed product.
BHYP Ticker For Bitwise’s Hyperliquid ETF
Bitwise’s filing says the trust’s primary objective is to provide exposure to the value of Hyperliquid held by the vehicle. The fund’s secondary objective is to earn staking rewards.
“In connection with its investment objective of seeking to derive additional Hyperliquid through staking, the Trust will stake some or all of the Hyperliquid held in the Trust Hyperliquid Accounts,” the filing stated.
Meanwhile, the new filing introduces the ticker symbol BHYP and establishes a sponsor fee of 67 basis points.
Industry experts noted that these inclusions represent one of the final procedural hurdles before a fund goes live on national exchanges.
If approved by securities regulators, the Hyperliquid fund will integrate into a rapidly expanding suite of Bitwise investment vehicles.
Over the past year, the asset manager has aggressively expanded its product lineup beyond legacy assets such as Bitcoin and Ethereum. The firm has been providing regulated exposure for alternative layer-one networks and protocols, including Solana, Chainlink, and XRP.
Meanwhile, the push for a US spot product follows closely on the heels of Bitwise’s international expansion.
On April 9, the firm listed the Bitwise Hyperliquid Staking physically backed product on the Deutsche Börse Xetra. That instrument tracks the Kaiko HYPE Reference Rate LDNLF index.
The fund automatically captures on-chain staking yields, sparing institutional allocators the operational friction of managing private keys and self-custody infrastructure.
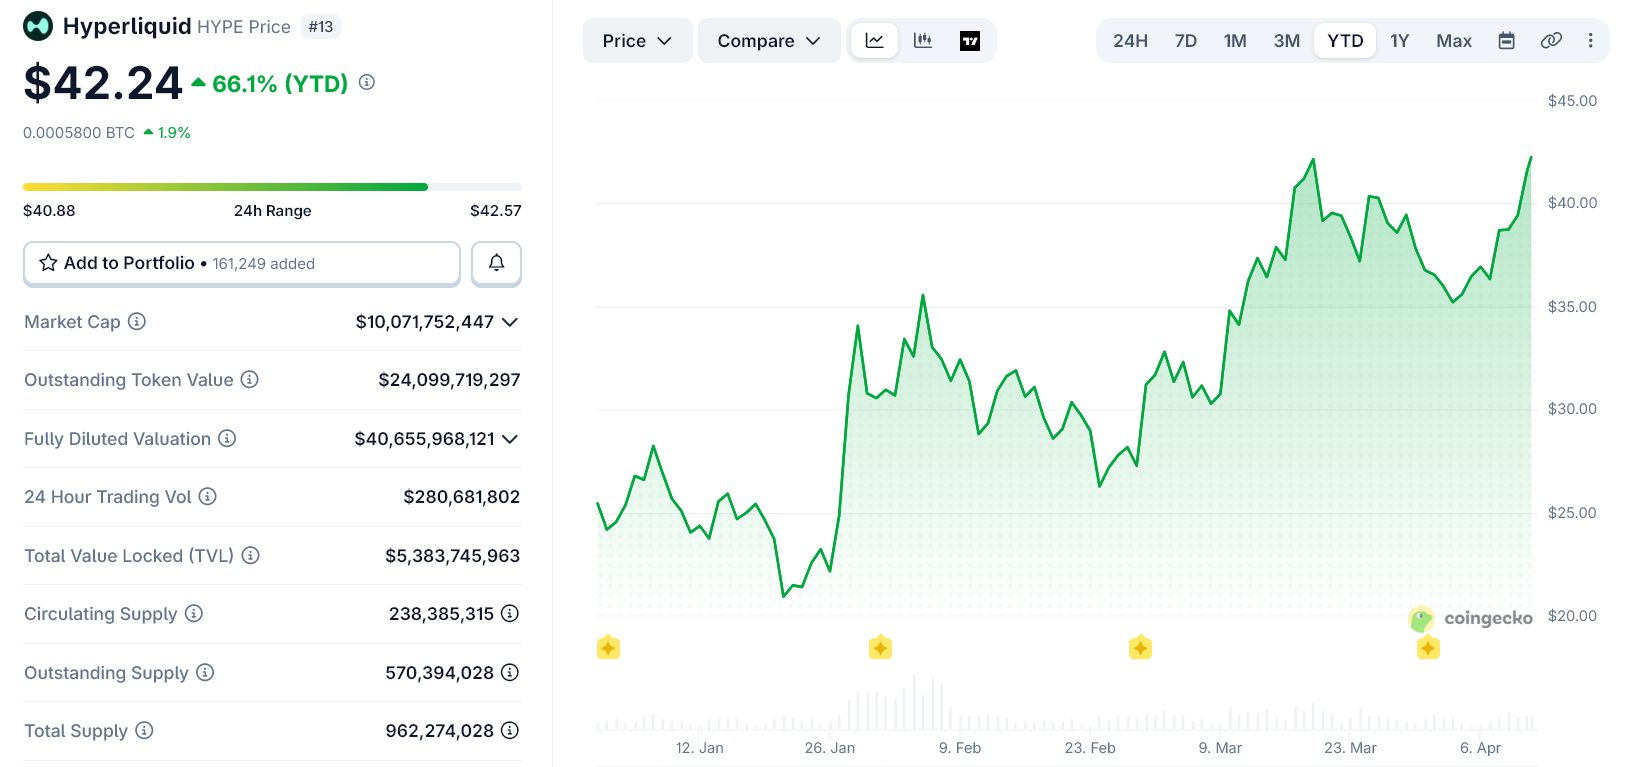
HYPE Outperforms Crypto Bear Market
Since the beginning of the year, Hyperliquid’s HYPE has emerged as one of the best-performing digital assets.
The altcoin has surged 66% since the beginning of 2026. This demonstrates distinct relative strength against a broader digital asset market that has struggled to find its footing early in the year.

A significant catalyst for Hyperliquid’s recent outperformance is its underlying utility during periods of acute macroeconomic stress. As military hostilities flared in the Middle East involving the US, Israel, and Iran, traditional financial markets were shuttered for the weekend.
During that liquidity gap, institutional and retail participants aggressively rotated into Hyperliquid’s blockchain-based infrastructure.
The decentralized platform became a critical venue for traders seeking to hedge geopolitical risks. They used synthetic perpetual futures contracts to gain exposure to global benchmarks such as Brent crude and gold before the recent Pakistan-brokered ceasefire took effect.
The post Bitwise Is Launching Its Hyperliquid ETF Soon appeared first on BeInCrypto.
Crypto World
Monad Crypto Whales Just Hit a 90-Day Accumulation Peak: Is MON About to Break Its All-Time High?
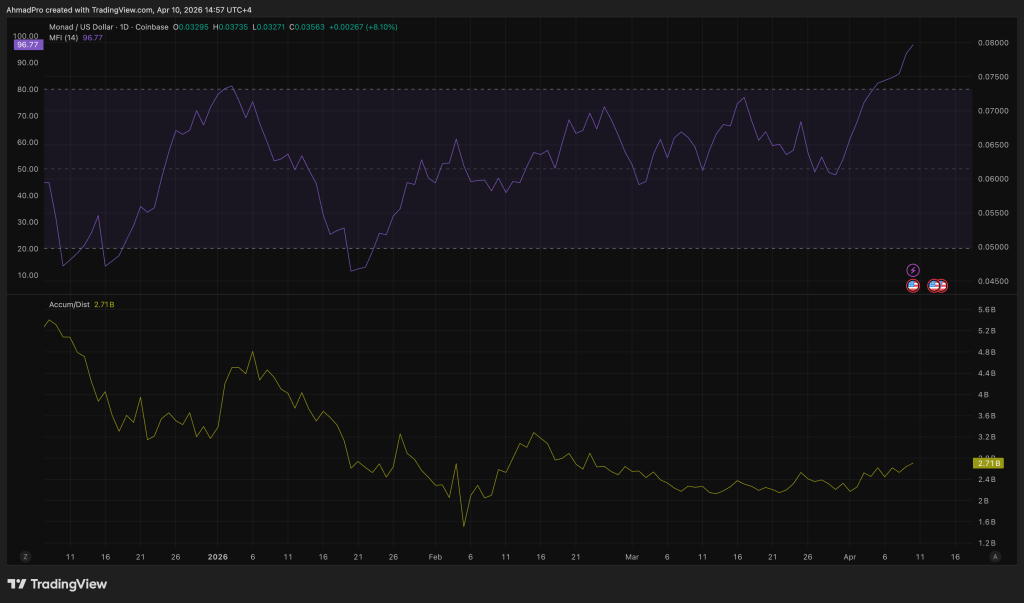
Monad Crypto (MON) is trading near $0.035 after a 18% surge in 24 hours, with large holder netflow on-chain data registering its highest reading in 90 days – a level not seen since the token’s initial post-launch run.
Exchange outflows have spiked alongside that number, indicating cold storage accumulation rather than positioning for a near-term exit.
The complicating factor is immediate: MON price is pressing into the $0.035–$0.040 resistance block that capped its last local peak, and the all-time high of $0.049 sits another 15% above that ceiling. Is this whale accumulation the real setup, or is the market running ahead of confirmation?
The Accumulation/Distribution indicator is trending higher in tandem with price, a structurally bullish read.

Trading volume exceeded $2.69 billion in the past day, and the Money Flow Index is holding slightly above 80, suggesting capital is still entering rather than rotating out. What the on-chain data doesn’t yet confirm is whether this print translates into a clean breakout or a high-volume rejection at resistance.
Discover: The best pre-launch token sales
Can Monad Crypto Clear $0.040 Resistance or Does the Overbought Signal Force a Reset for MON Crypto?
The price analysis starts at the 200-day EMA, currently clustered near $0.0345. MON is trading just above that level, which means the immediate battle is confirming it as support rather than ceiling.
A hold here with successive closes above $0.035 starts building the structure needed for a run at $0.040.
If MON clears $0.040 on volume comparable to today’s session, the path to the all-time high near $0.049 opens without a major structural obstacle in between.
If $0.035 fails to hold as support after the current push, the $0.0293 liquidity cluster becomes the next relevant floor, and below that the $0.023–$0.025 zone enters the picture.
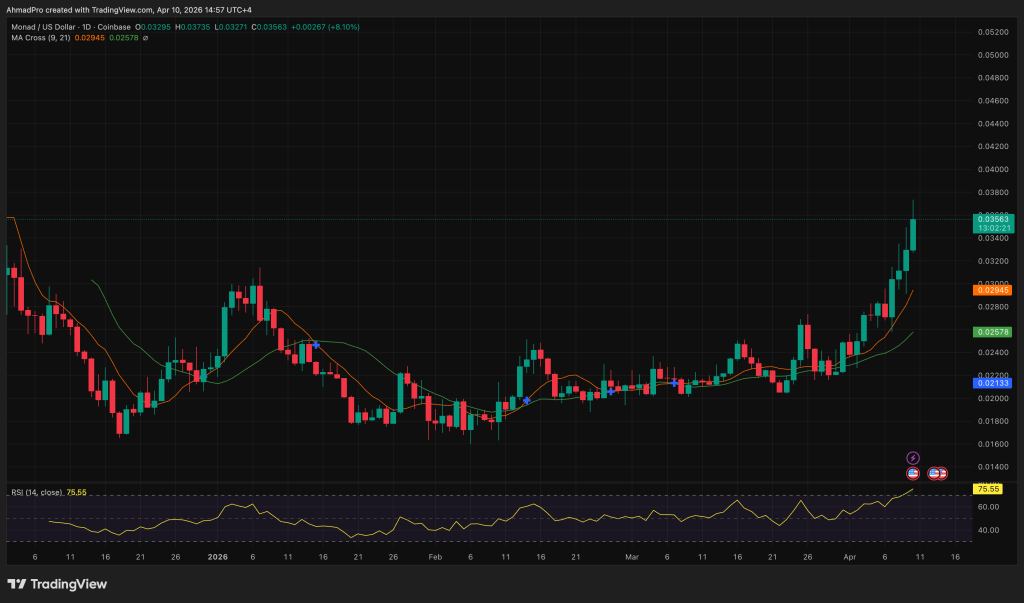
The Bollinger Bands are the counterweight here. MON has entered the overbought region – price is pressing the upper band – which historically signals either a short consolidation or an outright pullback before the next leg.
The band position doesn’t invalidate the bull case; it narrows the path. For us, the invalidation is a daily close back below $0.0293 on elevated volume. That would suggest distribution, not accumulation, is driving the flows.
The Monad crypto ecosystem is adding weight to the technical setup. Neverland, the flagship DeFi protocol on the network, is approaching $40 million in Total Value Locked, and TVL across integrated protocols has grown roughly 15% this week.
That’s utility keeping pace with speculation – a healthier signal than price momentum running on narrative alone.
Discover: The best crypto to diversify your portfolio with
Missed Monad Crypto? Liquid Chain Raises $700,000 Heading Into The First Week
Liquid Chain built a Unified Liquidity Layer that aggregates capital across multiple Layer-2 networks using Chainlink’s Cross-Chain Interoperability Protocol (CCIP) as the messaging backbone.
The core problem it solves is real and expensive – assets stranded on individual L2s require manual bridging, creating slippage, delay, and trust assumptions that institutional allocators won’t accept.
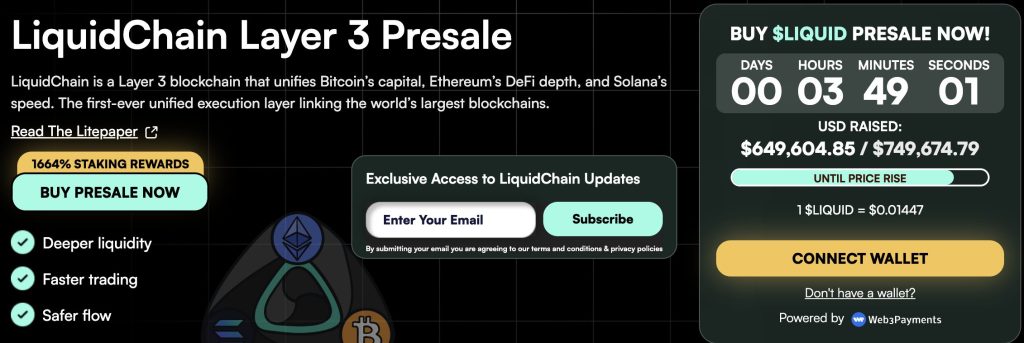
Liquid Chain’s architecture lets users move assets seamlessly across chains without manual bridge interactions, with CCIP handling the verification and message-passing layer beneath the surface.
The project has been pitching its Layer-3 DeFi buildout as a credible answer to the fragmentation problem, and the Convergence judges agreed.
The Order grows. The Order evolves. ⟁ — LiquidChain (@getliquidchain) April 8, 2026
 https://t.co/vqvBcdSQYC pic.twitter.com/stB6CDGAVD
Other notable hackathon submissions concentrated on Real-World Asset tokenization and DeFi automation – a consistent signal that Chainlink’s developer community is orienting toward institutional-grade infrastructure rather than consumer speculation. The CCIP adoption rate implied by the hackathon submissions validates Chainlink’s cross-chain positioning at exactly the moment demand for tamper-proof oracle settlement is breaking records on Polymarket.
Explore the LiquidChain presale and current allocation terms here.
The post Monad Crypto Whales Just Hit a 90-Day Accumulation Peak: Is MON About to Break Its All-Time High? appeared first on Cryptonews.

TLDR:
- Attackers socially engineered OVHcloud support to remove hardware 2FA, enabling full account access within an hour.
- The phishing site used an Inferno Drainer kit and ran live for roughly four hours on March 30, 2026.
- ICANN’s five-day domain transfer lock gave Steakhouse Financial time to cancel an outbound transfer filed by the attacker.
- Steakhouse vaults on Morpho operated independently throughout; no depositor funds were at risk at any point.
A social engineering attack briefly redirected Steakhouse Financial’s website to a phishing page on March 30, 2026.
Attackers manipulated the domain registrar’s support team to strip account security protections. The phishing site ran for roughly four hours before the team reclaimed control. No user funds were lost, and no onchain contracts were touched.
How Attackers Broke Into Steakhouse Financial’s Domain Registrar
The attacker called OVHcloud, the domain registrar used by Steakhouse Financial, and posed as the account owner. They provided enough personal information to pass OVH’s phone-based identity check.
An OVH support agent then removed the hardware-based two-factor authentication on the account.
Within seconds of logging in, the attacker ran automated scripts. These deleted every second-factor device on the account and enrolled their own. The speed pointed to a pre-planned operation.
The attacker then redirected the domain’s nameservers to servers under their control.
They pointed the site’s A records to a cloned version of the Steakhouse website hosted on Hostinger. That cloned site carried a wallet drainer linked to Inferno Drainer, a known drainer-as-a-service operation.
Let’s Encrypt TLS certificates were obtained within minutes. This made the phishing site appear legitimate to standard browsers. Wallet extensions from Phantom, MetaMask, and Rabby flagged the site as malicious independently and quickly.
Steakhouse Financial Regained Control Within Hours, Funds Remained Safe
Steakhouse Financial’s team spotted the unauthorized email-change notification at 08:47 UTC and contacted OVH immediately. The phishing site went live around 09:59 UTC.
The team posted a public warning on X at 10:34 UTC, under 30 minutes after the site became operational.
The Security Alliance (SEAL) was brought in at 11:25 UTC while the attack was still active. The team worked across multiple parallel tracks. These included account recovery, DNS forensics, and transfer cancellation.
The attacker had filed an outbound domain transfer. ICANN’s five-day transfer timelock gave the team time to cancel it.
The team contacted Hostinger directly to reject the transfer on the receiving end. Hostinger later confirmed the offending account was frozen and closed.
By 12:56 UTC, the team had reclaimed the OVH account. DNS was fully restored by approximately 13:55 UTC. Steakhouse Financial confirmed all domains were safe to use by April 1.
The company has since migrated to a registrar supporting hardware-key MFA and registrar-level locks. A continuous DNS monitoring system now watches all Steakhouse domains in real time. According to the post-mortem published by Steakhouse Financial on X, a full vendor security review process is now being established across all supply-chain vendors.
Adrian Cachinero Vasiljevic, the partner responsible for operations at Steakhouse Financial, issued a personal apology. He stated that identifying this attack vector was his responsibility and committed to driving the security hardening work going forward.

WLFI (WLFI) fell to a new all-time low on Saturday after onchain data showed wallets linked to World Liberty Financial used large token holdings to borrow stablecoins.
Summary
- WLFI fell to a record low after a self-backed loan raised fresh market risk questions.
- Onchain data showed linked wallets used 5 billion WLFI tokens to borrow stablecoins on Dolomite.
- World Liberty said its positions remain safe and framed the lending move as yield strategy.
The move added pressure to the Trump-linked project as traders weighed the risk tied to using its own token as collateral.
WLFI dropped to about $0.077, its lowest level on record, before trading near $0.079. The token is now down 76% from its peak of $0.33 reached in September, based on CoinGecko data.
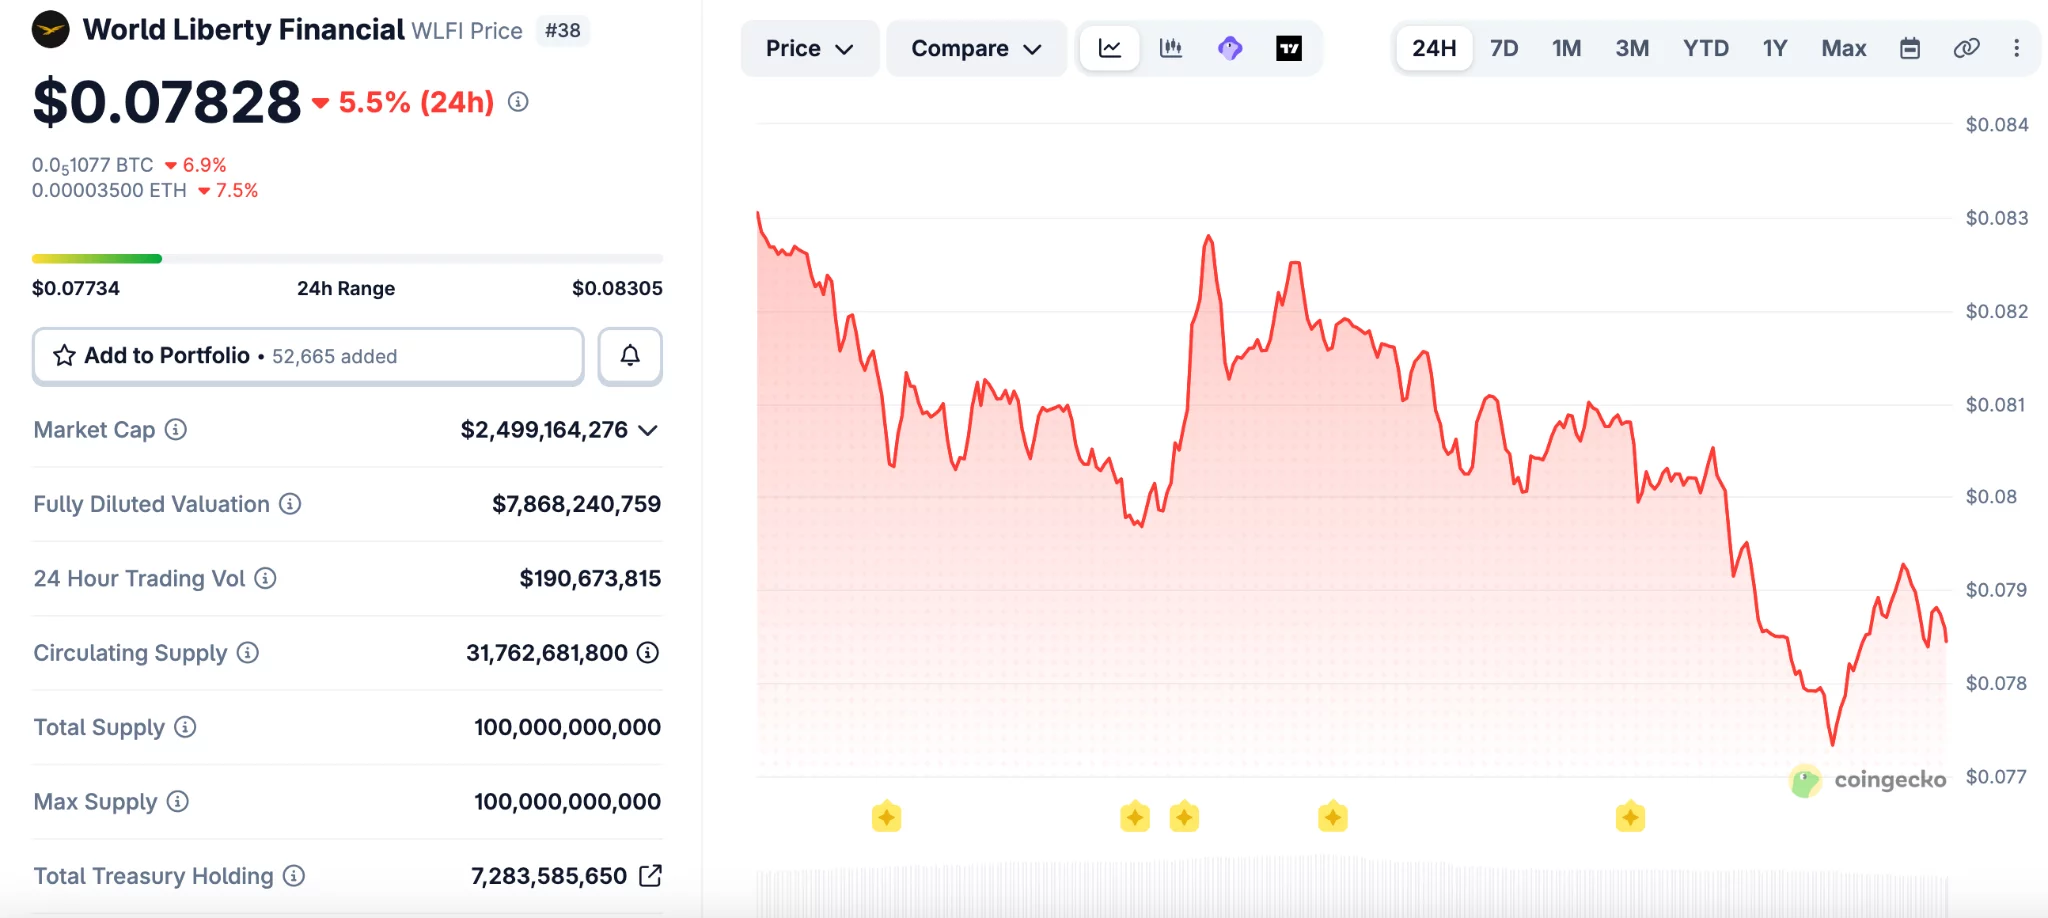
The decline followed reports that wallets tied to World Liberty Financial deposited about 5 billion WLFI tokens on Dolomite. The same position was then used to borrow $75 million in USD1 and USDC.\
Arkham data showed that more than $40 million of the borrowed funds later moved to Coinbase Prime. That transfer drew more attention to the project’s financing activity and the size of its exposure.
The market reaction was swift because WLFI is not viewed as a deeply liquid asset. A large collateral position tied to price swings can increase pressure if the token falls further.
DeFi users on X said the structure could create risk for lenders if WLFI moves closer to liquidation levels. Some pointed to the token’s high fully diluted valuation and limited trading depth as a weak point.
“WLFI has almost a $10 billion FDV, but it is not an extremely liquid asset,” wrote one user. “So imagine what would happen if 5% of WLFI’s total supply would suddenly need to be sold to liquidate the position.”
Another user compared the setup to borrowing cash against self-created value. The user said,
“It’s the financial equivalent of printing casino chips, borrowing cash against them, and telling everyone else not to panic because the house still believes in the chips.”
Dolomite remains a smaller player in DeFi lending. DefiLlama ranks it 19th among lending platforms by total value locked, which added more focus to the size of the WLFI-linked position.
World Liberty defends the strategy
World Liberty Financial responded on social media and said its positions remain well above liquidation thresholds. The project described itself as an “anchor borrower” and said the strategy supports yield generation.
The team wrote,
“Everyday users are earning outsized stablecoin yields right now — at a time when traditional markets are offering very little.” It added, “That’s the whole point.”
The project also said it plans to introduce a governance proposal for early retail holders. The proposal would replace immediate token access with a phased vesting schedule, subject to a community vote.
Disclosure: This article does not represent investment advice. The content and materials featured on this page are for educational purposes only.
WLFI (WLFI) fell to a new all-time low on Saturday after onchain data showed wallets linked to World Liberty Financial used large token holdings to borrow stablecoins.
Summary
- WLFI fell to a record low after a self-backed loan raised fresh market risk questions.
- Onchain data showed linked wallets used 5 billion WLFI tokens to borrow stablecoins on Dolomite.
- World Liberty said its positions remain safe and framed the lending move as yield strategy.
The move added pressure to the Trump-linked project as traders weighed the risk tied to using its own token as collateral.
WLFI dropped to about $0.077, its lowest level on record, before trading near $0.079. The token is now down 76% from its peak of $0.33 reached in September, based on CoinGecko data.
The decline followed reports that wallets tied to World Liberty Financial deposited about 5 billion WLFI tokens on Dolomite. The same position was then used to borrow $75 million in USD1 and USDC.\
Arkham data showed that more than $40 million of the borrowed funds later moved to Coinbase Prime. That transfer drew more attention to the project’s financing activity and the size of its exposure.
The market reaction was swift because WLFI is not viewed as a deeply liquid asset. A large collateral position tied to price swings can increase pressure if the token falls further.
DeFi users on X said the structure could create risk for lenders if WLFI moves closer to liquidation levels. Some pointed to the token’s high fully diluted valuation and limited trading depth as a weak point.
“WLFI has almost a $10 billion FDV, but it is not an extremely liquid asset,” wrote one user. “So imagine what would happen if 5% of WLFI’s total supply would suddenly need to be sold to liquidate the position.”
Another user compared the setup to borrowing cash against self-created value. The user said,
“It’s the financial equivalent of printing casino chips, borrowing cash against them, and telling everyone else not to panic because the house still believes in the chips.”
Dolomite remains a smaller player in DeFi lending. DefiLlama ranks it 19th among lending platforms by total value locked, which added more focus to the size of the WLFI-linked position.
World Liberty defends the strategy
World Liberty Financial responded on social media and said its positions remain well above liquidation thresholds. The project described itself as an “anchor borrower” and said the strategy supports yield generation.
The team wrote,
“Everyday users are earning outsized stablecoin yields right now — at a time when traditional markets are offering very little.” It added, “That’s the whole point.”
The project also said it plans to introduce a governance proposal for early retail holders. The proposal would replace immediate token access with a phased vesting schedule, subject to a community vote.
Disclosure: This article does not represent investment advice. The content and materials featured on this page are for educational purposes only.


Aethir said it remains fully operational after containing an attack on its ATH bridge contracts.
Summary
- Aethir said it contained the ATH bridge exploit quickly and kept total user losses below $90,000.
- The company said Ethereum ATH supply stayed intact while affected contracts were disconnected to stop losses.
- PeckShield first estimated higher losses, while Aethir said compensation details will arrive next week soon.
The company said the exploit did not affect the main ATH supply on Ethereum, while user losses stayed below $90,000.
Aethir said it detected a malicious attack targeting ATH bridge contracts that connect Ethereum with other chains. The company said it disconnected all affected contracts soon after finding the issue and stopped further damage.
The team added that the ETH-ARB bridge on Squid was not affected during the incident. It also said the main ATH supply on Ethereum remains intact, which helped prevent wider disruption across the network.
Aethir said it will share a full compensation plan next week. The company also said it is working with authorities and exchange partners to trace the attacker and block related funds.
“A full attacker wallet list will be posted in Discord as we monitor the funds,” Aethir said, in its update.
It added that a detailed memo will explain what happened, which users were affected, and how compensation will work.
Aethir credited several exchanges for acting quickly after the exploit. The company named Binance, Upbit, Bithumb, and HTX among the platforms that blacklisted identified wallets tied to the incident.
The project also thanked ZeroShadow for helping with analysis during the response. Aethir said that early action from partners helped limit the scope of the losses and support the ongoing investigation.
PeckShield had flagged the exploit a day earlier and initially estimated losses at about $400,000. The blockchain security firm also said the attacker moved funds from BNB Chain to Tron through several addresses.
That early estimate differed from Aethir’s latest figure of under $90,000 in user losses. The gap places more attention on fund tracing and the final accounting of the incident.
Crypto attacks continue to pressure the market
The Aethir case comes as crypto security breaches keep hitting the market. PeckShield recently said losses from 20 security incidents reached about $52 million in March, nearly double the February total.
The firm also pointed to a growing pattern where one exploit can spread stress across linked DeFi platforms. Those events can weaken liquidity, create bad debt, and strain lending markets beyond the first target.
PeckShield cited ResolvLabs and Venus Protocol as recent examples of wider fallout after exploits. It also noted targeted attacks on individuals, including a multimillion-dollar theft tied to social engineering on Kraken. The trend has carried into April as other platforms deal with new attacks.

Iran’s Hormuz Toll Could be In Stablecoins, Not Bitcoin

Sharks eager to snap skid in home finale vs. Canucks

Former Tableau product chief launches Golden Analytics, using AI to challenge the BI old guard

Why Israel is blocking foreign journalists from entering

Bitcoin: We’re Entering The Most Dangerous Phase

Alan Cumming Brands Baftas Ceremony A ‘Triggering S**tshow’

Btc prediction | Bitcoin price prediction in Hindi #india #btc #crypto #bitcoin

Dale makes money by selling bee stings.#foryou #comedy #shortvideo #shorts #shortvideos

BITCOIN, CRYPTO: PREPARATI A UNA SETTIMANA DI CAOS (-72 ORE…)
-

 Business5 days ago
Three Gulf funds agree to back Paramount’s $81 billion takeover of Warner, WSJ reports
-

 Sports7 days ago
India men’s 4x400m and mixed 4x100m relay teams register big progress | Other Sports News
-

 Politics17 hours ago
US brings back mandatory military draft registration
-

 Fashion18 hours ago
Weekend Open Thread: Veronica Beard
-

 Tech4 days ago
How Long Can You Drive With Expired Registration? What Florida Law Says
-

 Business6 days ago
No Jackpot Winner, Prize to Climb to $231 Million
-

 Fashion5 days ago
Massimo Dutti Offers Inspiration for Your Summer Mood Board
-
 Sports18 hours ago
Man United discover Nico Schlotterbeck transfer fee as defender reaches Dortmund agreement
-

 Fashion4 days ago
Let’s Discuss: DEI in 2026
-

 Crypto World3 days ago
Bitcoin recovers as US and Iran Agree a Ceasefire Deal
-

 Crypto World2 days ago
Canary Capital Files SEC Registration for PEPE ETF
-

 Business15 hours ago
Tesla Model Y Tops China Auto Sales in March 2026 With 39,827 Registrations, Beating Cheaper EVs and Gas Cars
-

 Business7 days ago
Akebia Therapeutics, Inc. (AKBA) Discusses Pipeline Progress and Strategic Focus on Kidney Disease Treatments at R&D Day – Slideshow
-

 Business23 hours ago
OpenAI Halts Stargate UK Data Centre Project Over Energy Costs and Copyright Row
-

 Tech5 days ago
Gamer Restores the Original PlayStation Portal From Two Decades Ago
-

 Tech5 days ago
Haier is betting big that your next TV purchase will be one of these
-

 Tech5 days ago
The Xiaomi 17 Ultra has some impressive add-ons that make snapping photos really fun
-

 Tech5 days ago
Samsung just gave up on its own Messages app
-

 Tech5 days ago
Save $130 on the Samsung Galaxy Watch 8 Classic: rotating bezel, sleep coaching, and running coach for $369
-

 Tech5 days ago
Italian court says Netflix must refund customers up to $576 over price hikes
You must be logged in to post a comment Login