Crypto World
Ripple Price Analysis: How Low Can XRP Go if It Loses $1 Support This Weekend?

XRP remains under sustained selling pressure against both USDT and BTC, with the higher time frame structure continuing to favor the bears. The latest breakdown below the key horizontal support reinforces the prevailing downtrend and leaves the market vulnerable to another leg lower unless buyers quickly reclaim the lost levels.
Ripple Price Analysis: The USDT Pair
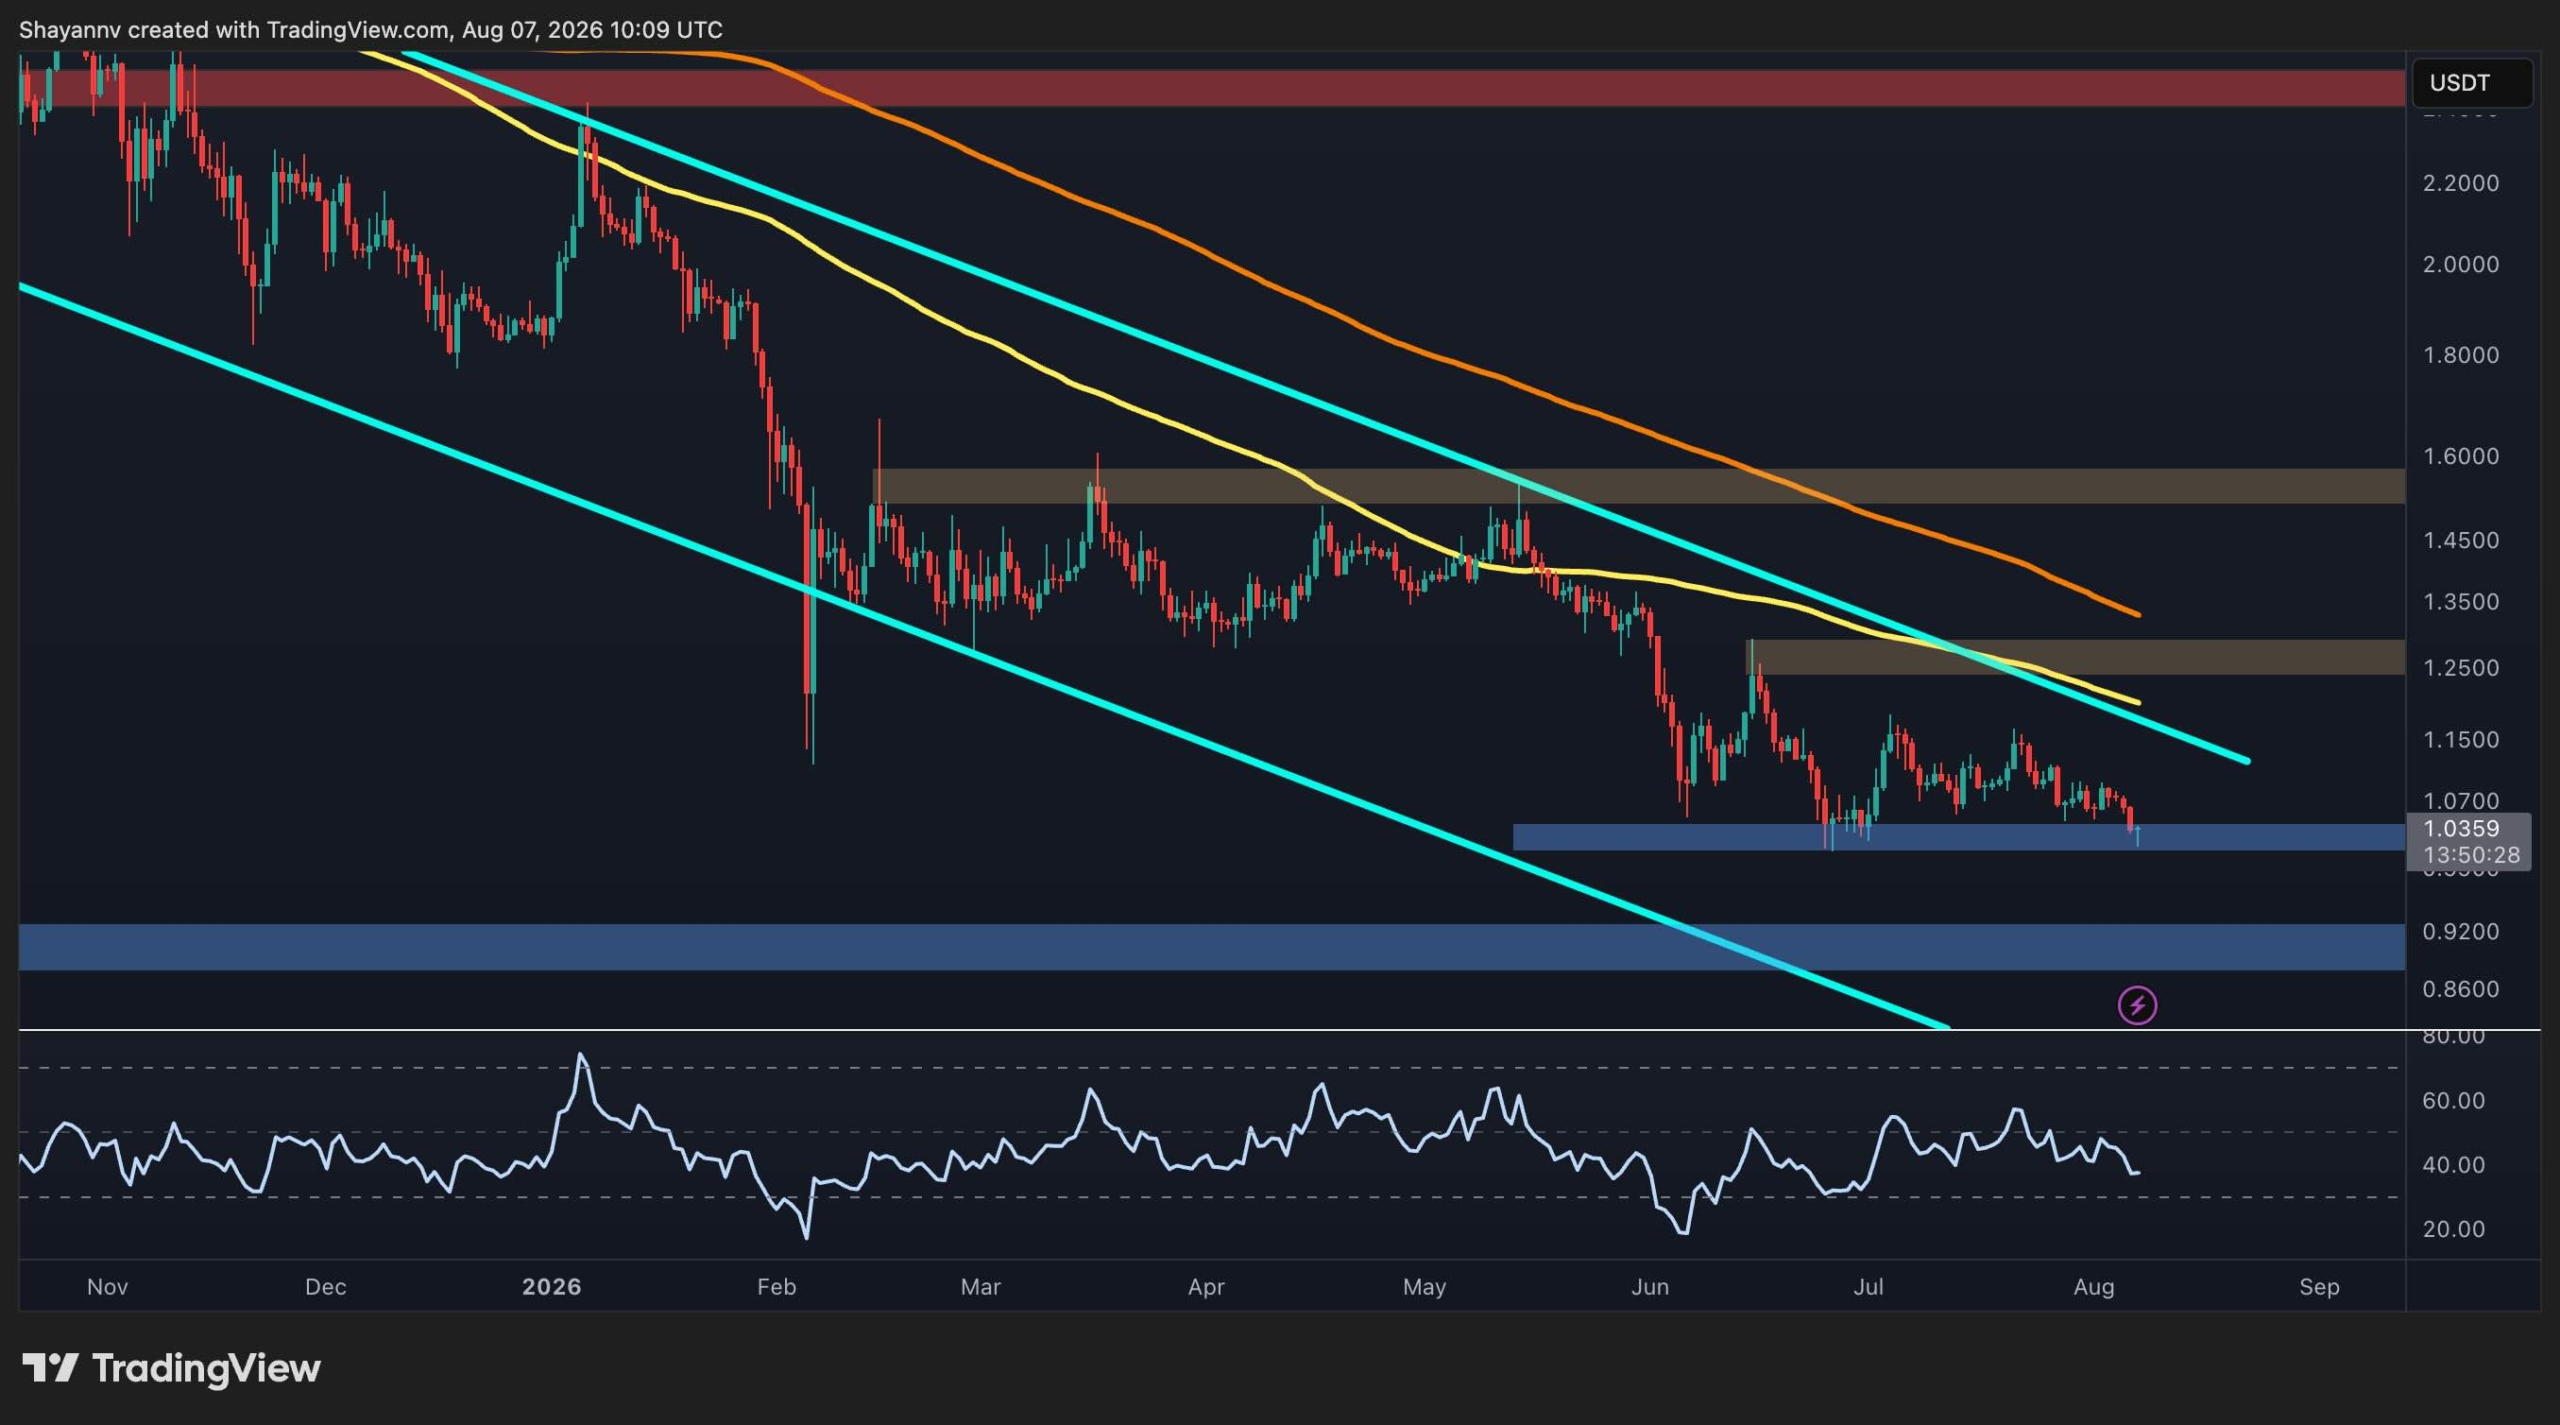
On the XRP/USDT chart, the price continues to trade inside a well-defined descending channel while remaining below the 100-day and 200-day moving averages. The 100-day MA has acted as a close dynamic resistance throughout the decline, while the 200-day MA continues to trend lower well above the current price, highlighting the weakness in the broader trend.
A potential breakdown of the $1-$1.05 support zone marks an important bearish development. This area has repeatedly attracted buyers over the past several weeks, but a breakdown would suggest demand is fading. If XRP breaks below this level, sellers will be in even more control.
The next major support sits around the $0.90 region, which should be defended at all costs. On the upside, the first resistance is the $1.25 zone, which is located between the key moving averages and just above the descending channel’s upper boundary. The broader resistance remains around $1.50, where previous distribution occurred.
Meanwhile, momentum also favors the sellers. The RSI has dropped toward the lower portion of its range without yet showing a convincing bullish divergence, suggesting downside momentum remains dominant despite approaching oversold territory.
The BTC Pair
The XRP/BTC pair paints an even weaker picture. The price has broken below the critical horizontal support around 1,700 sats, confirming a continuation of the prevailing downtrend after several weeks of sideways consolidation. The failed attempts to reclaim this level indicate that previous support has now turned into resistance.
The pair also remains below all major moving averages, with the 100-day average trading beneath the longer-term one, reinforcing the bearish market structure. Meanwhile, the asset continues to respect the descending channel that has guided the decline for several months.
The next area of interest is the lower support zone around 1,500 sats, which also coincides with the lower boundary of the descending channel. This region could attract buying interest, but a failure to hold it would be disastrous and further aggravate the bear market.
On the other hand, to improve the technical outlook, XRP would first need to reclaim the 1,700 sats level before challenging the 1,850 sats resistance zone. A stronger trend reversal would only become more likely if buyers also break above the descending channel resistance and push beyond the cluster of moving averages, which currently remain well overhead.
Overall, both XRP/USDT and XRP/BTC continue to display bearish market structures. While the price is approaching notable support areas that could trigger a short-term relief bounce, the broader trend remains negative until XRP begins reclaiming key horizontal levels and breaks above its long-term descending resistance.

The post Ripple Price Analysis: How Low Can XRP Go if It Loses $1 Support This Weekend? appeared first on CryptoPotato.
You must be logged in to post a comment Login