
Crypto World
Ripple (XRP) Price Predictions for This Week
Let’s have a look at some numbers and try to understand where is the XRP price headed this week.
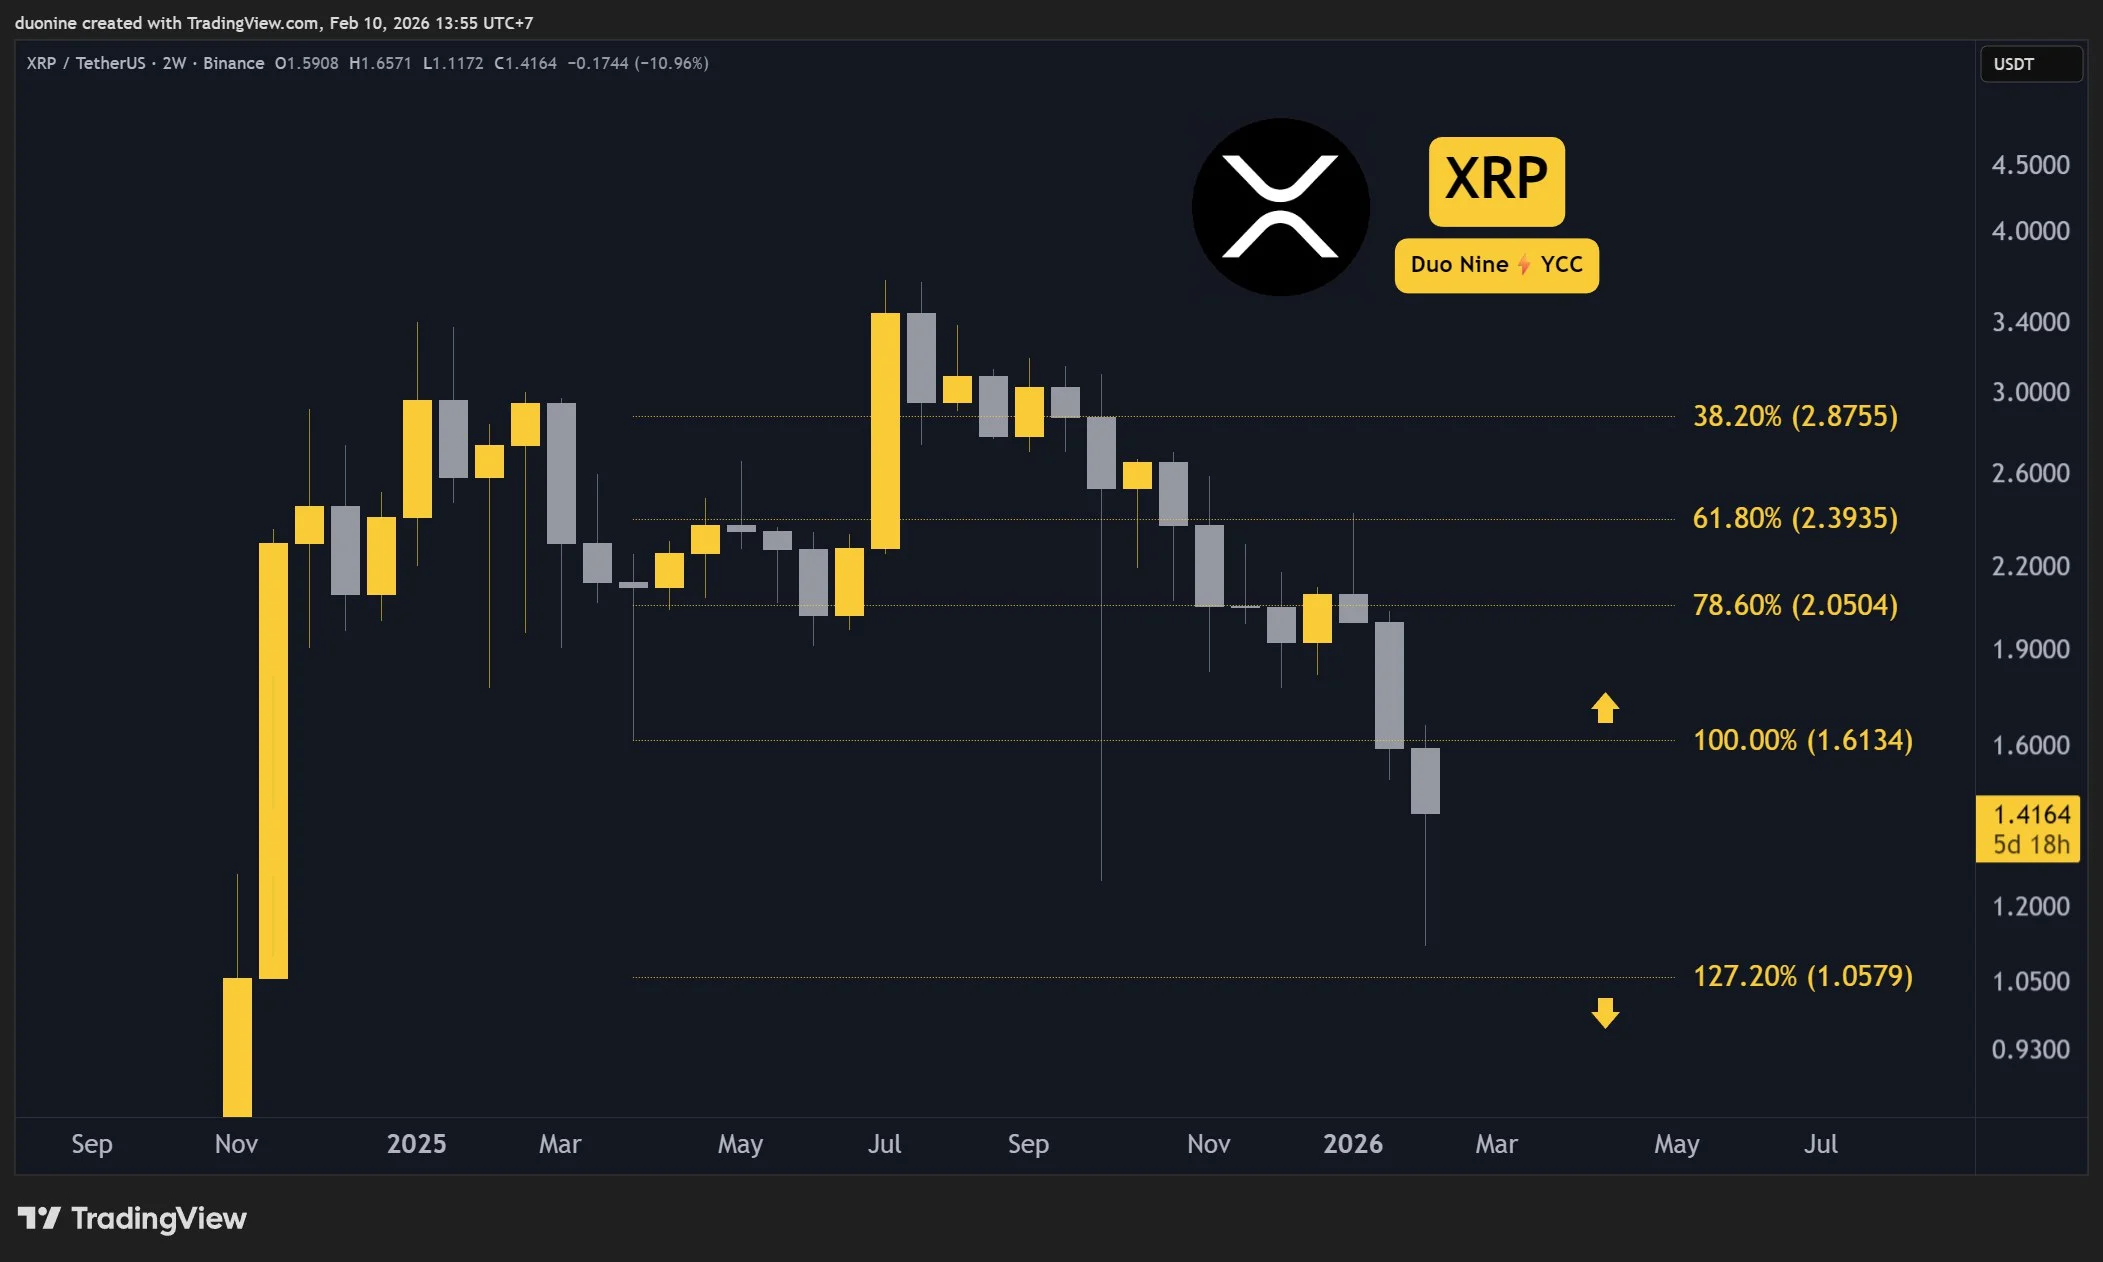
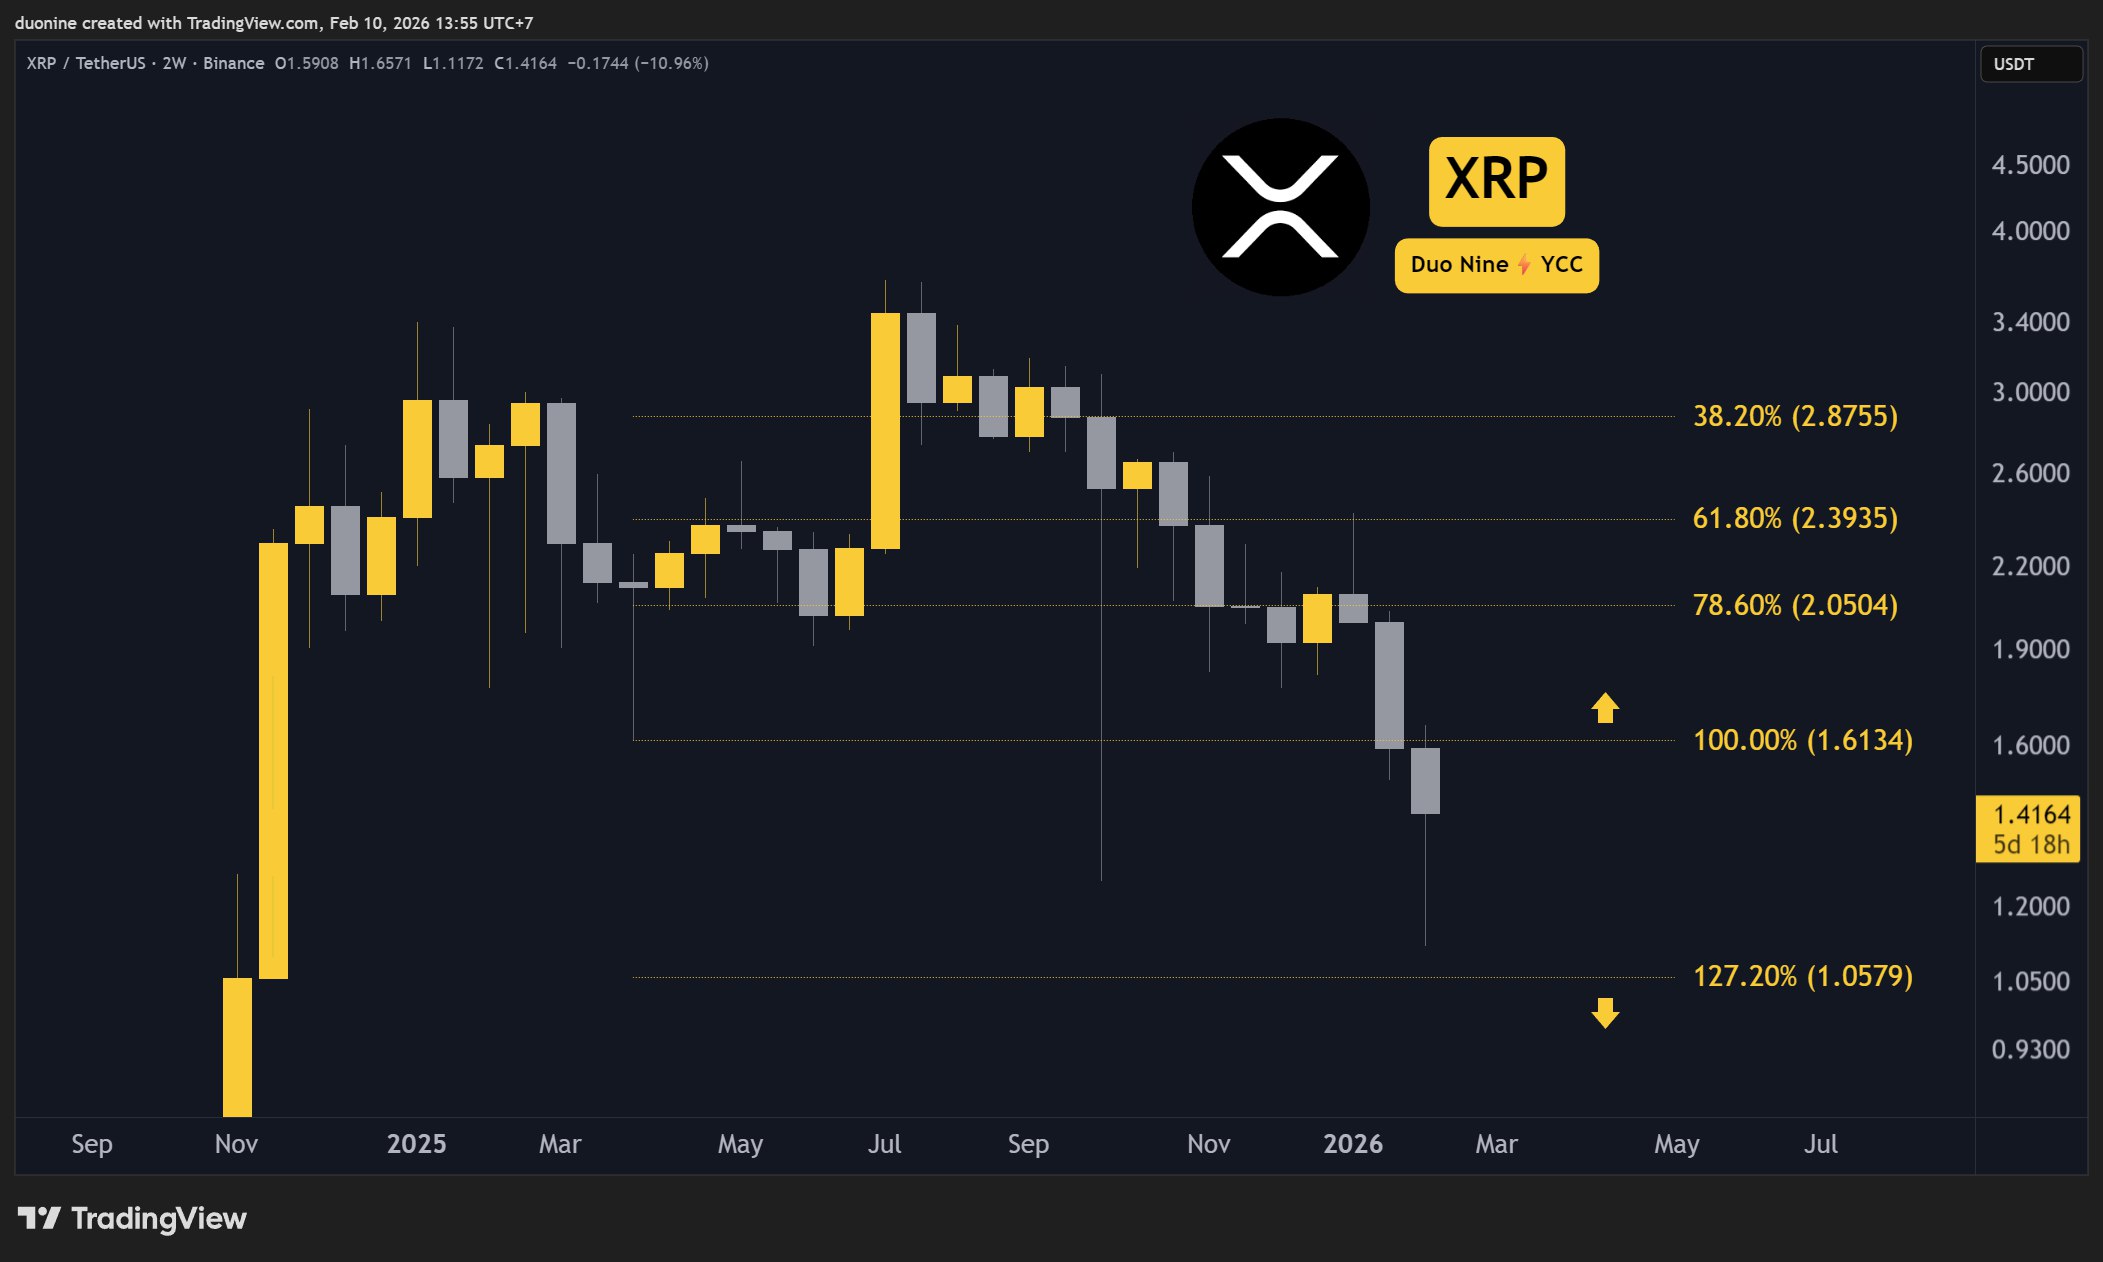
XRP returns above $1.4, but can it hold there?
Ripple (XRP) Price Predictions: Analysis
Key support levels: $1.4, $1
Key resistance levels: $1.6
XRP Price Reclaims $1.4
After the massive drop last Thursday, XRP recovered somewhat and returned above the support at $1.4. If this key level holds, buyers could retest the $1.6 resistance level in the future. Any failure there could see the price resume its downtrend.
Sellers Dominate
A review of the volume shows that sellers have been dominating since late December on the weekly chart. Worst, the selling volume has accelerated in early February, showing no signs of a change. However, increased sales volume could be the first step towards finding a bottom.
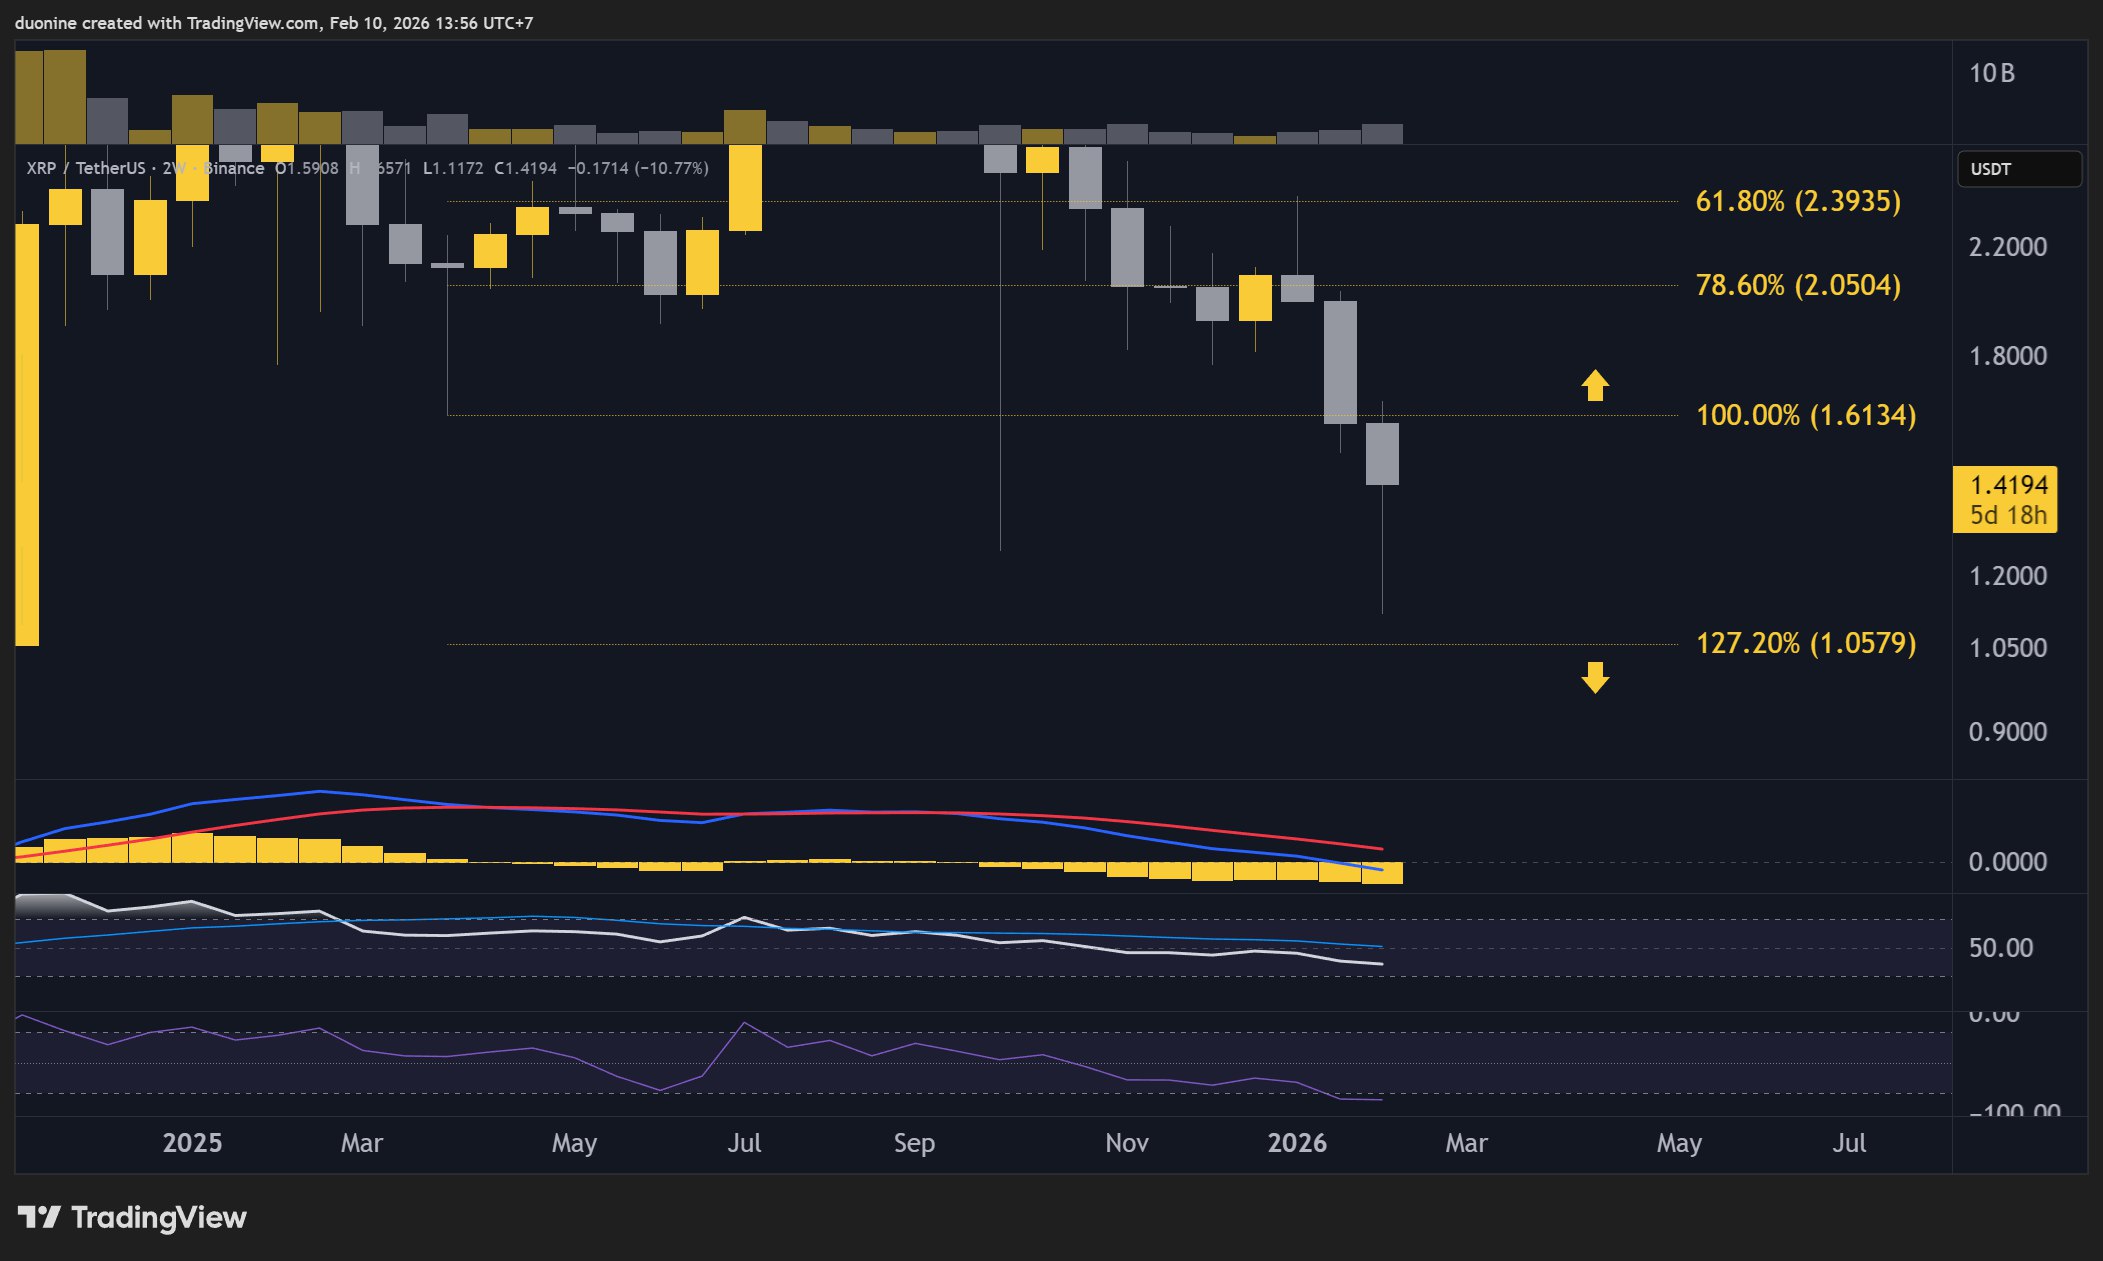
Daily RSI Bounces from Oversold Area
During the crash last week, the daily RSI reached 17 points, falling deep into the oversold area. Since then, this indicator snapped back above 30. As long as the daily RSI is under 50, the bias leans bearish.

SECRET PARTNERSHIP BONUS for CryptoPotato readers: Use this link to register and unlock $1,500 in exclusive BingX Exchange rewards (limited time offer).
Disclaimer: Information found on CryptoPotato is those of writers quoted. It does not represent the opinions of CryptoPotato on whether to buy, sell, or hold any investments. You are advised to conduct your own research before making any investment decisions. Use provided information at your own risk. See Disclaimer for more information.


- Solana (SOL) price consolidates near $80 support amid strong fundamentals.
- Institutional staking and brokerage access boost Solana adoption.
- Key resistance at $87.65, and a breakout could target $97–$107.
Solana’s native token, SOL, has been showing signs of consolidation as it struggles to break through key resistance levels.
Despite a slight bounce today, the price remains confined below the $88 range.
At the same time, traders should closely monitor the altcoin which is currently hovering near the critical support at around $80, which has acted as a short-term floor for buyers.
On the surface, Solana’s technical structure appears cautious, with short-term momentum indicators showing weak buying pressure, but underneath this, Solana’s ecosystem is growing at a remarkable pace.
Solana’s fundamental strength fuels long-term confidence
One of the most compelling aspects of Solana’s recent performance is the surge in institutional and real-world adoption.
The network now hosts more than $2 billion in tokenized real-world assets according to rwa.xyz.
This milestone underscores Solana’s role not just as a blockchain for decentralized applications, but as a platform capable of handling complex financial instruments.
Institutional interest has also taken a significant step forward.
Staking products offering competitive yields have been launched, allowing both retail and institutional investors to earn returns on their SOL holdings.
These developments provide additional utility and financial incentives for participants, reinforcing Solana’s position as more than a speculative asset.
Adding to this, several traditional brokerage platforms including Galaxy now offer custody and trading services for SOL.
This integration reduces barriers for institutional investors and opens the door for mainstream adoption.
With access to regulated platforms, capital inflows could increase steadily, strengthening the network’s financial layer and liquidity.
On-chain activity remains robust as well, and the blockchain continues to see high transaction throughput, and its dominance in tokenized equity markets demonstrates that adoption is moving beyond hype-driven speculation.
Taken together, these factors highlight a token with real-world utility and strong growth potential.
Technical resistance holds back SOL’s price
Short-term market sentiment remains cautious, with recent outflows from Solana-focused ETFs reflecting institutional hesitancy despite the network’s improvements.
While the fundamentals are building, the price is still confined by technical hurdles.
SOL has found immediate resistance near $87.65, with historical data suggesting further caps at $97.56 and $106.95.

On the downside, the support zone at $75.85–$80.00 is critical for near-term stability.
A daily close below these zones could trigger a sharper decline toward $63.72, which has historically acted as a longer-term support.
Solana price outlook
Overall, Solana (SOL) is at a pivotal point where its fundamentals are strong, but the market has yet to fully recognize them.
Price action will likely depend on whether buyers defend support and whether institutional capital begins flowing into the network.
In the short term, traders should closely watch the near-term support zone between $80 and $77.32, since holding this level is crucial to prevent further selling pressure.
In case of a rebound, the immediate resistance is at $87.65, which if cleared could open the door to a rally towards higher targets at $97.56 and $106.95.
Built by Tezos R&D hub Trilitech, the new web app brings tokenized rare earth metals on-chain alongside gold and uranium as AI-driven industrial demand intensifies.
Dr. Ben Goertzel, CEO of the Artificial Superintelligence (ASI) Alliance, told BeInCrypto his team can recreate the quantum attack circuits that Google Quantum AI built but refused to publish. He warned that if his organization can do it, nation-states already can too.
Google’s March 30 whitepaper showed that two working circuits implementing Shor’s algorithm to break 256-bit elliptic curve cryptography could be built with fewer than 500,000 physical qubits. The team chose not to release the code and instead published a zero-knowledge proof. Goertzel told BeInCrypto that decision changes nothing.
“Keeping Capabilities Secret Buys You at Most a Very Short Window”
Google framed its decision to withhold the circuits as responsible disclosure. The blog post called it a deliberate departure from the team’s historical practice of full transparency, motivated by the potential for misuse.
The crypto industry largely debated whether this aligned with its founding principle of “don’t trust, verify.”
Goertzel did not share the concern. He told BeInCrypto the secrecy is functionally irrelevant.
We are confident that we could regenerate the ‘secret circuit’ Google found using our own expertise and reasonable compute, and if we can do it, the Chinese government and other well-resourced actors certainly can too. Keeping capabilities secret buys you at most a very short window.
He added that the ASI Alliance has not withheld any of its own code for safety reasons, though the team has discussed it internally. His default position is openness.
The security benefits of decentralized scrutiny, he argued, outweigh the marginal risk reduction of secrecy when parallel discovery is the norm.
He did leave room for exceptions. If something posed a specific, acute, short-term danger, the team would hold it back.
But Google’s circuit, in his view, does not meet that bar because the knowledge to build it is already widely accessible to capable actors.
The 41% Problem
The Google whitepaper models what it calls an “on-spend attack.” A quantum computer could prepare part of the calculation in advance, then crack a Bitcoin (BTC) transaction in about nine minutes once the public key is exposed.
Since Bitcoin’s average block confirmation takes 10 minutes, the attacker has a roughly 41% probability of finishing first.
The paper also estimates that roughly 6.9 million BTC are already held in wallets whose public keys have been exposed in some form.
That includes about 1.7 million coins from the network’s earliest years, as well as additional funds affected by address reuse and Bitcoin’s Taproot upgrade, which makes public keys visible by default.
Goertzel told BeInCrypto that a 41% attack rate is not a borderline risk. It is a structural failure.
Any attack success rate above single digits is deeply problematic for a store-of-value chain. Once rational actors believe there is a meaningful probability that a transaction can be reversed or an address drained during the confirmation window, the game-theoretic assurances that underpin Bitcoin’s security model collapse. At 41%, you are well past the threshold.
He noted that the hardware to execute such an attack does not yet exist. But the mathematical proof is complete, and Google has set a 2029 deadline for the industry to migrate to post-quantum cryptography (PQC).
Bitcoin currently has no coordinated upgrade roadmap to meet that deadline.
ASI Alliance Says It Was Built for This
While much of the industry debated the implications, Goertzel told BeInCrypto his team saw this coming years ago.
He has previously predicted that human-level artificial general intelligence (AGI) could arrive around 2027 or 2028.
Google’s quantum timeline puts both breakthroughs on a collision course, and Goertzel said the ASI Alliance designed its infrastructure for exactly that convergence.
The convergence of AGI and quantum computing is very real, but framing it as purely a ‘threat’ misses the other half of the picture. At the ASI Alliance we have been designing ASI:Chain from the ground up to be quantum-oriented–not just quantum-resistant but quantum-leveraging…So for us, quantum computing arriving alongside AGI is a feature, not a bug.
ASI:Chain, the layer-1 blockchain under development by the Alliance, uses MeTTa as its smart contract language instead of Solidity.
According to Goertzel, MeTTa includes quantum-type systems, and the team has developed quantum versions of core Hyperon AGI algorithms covering attention allocation, probabilistic logic, and evolutionary learning.
The encryption layer is modular. Quantum-safe cryptographic primitives, including lattice-based and hash-based schemes, can be plugged in without redesigning the chain or requiring a hard fork.
The cost is computational overhead, which Goertzel called a real engineering challenge but not an architectural one.
The Artificial Superintelligence Alliance (FET) was formed through a token merger of SingularityNET, Fetch.ai, Ocean Protocol, and CUDOS.
Ocean Protocol later exited the merger, a move that later triggered legal action amid token theft allegations.
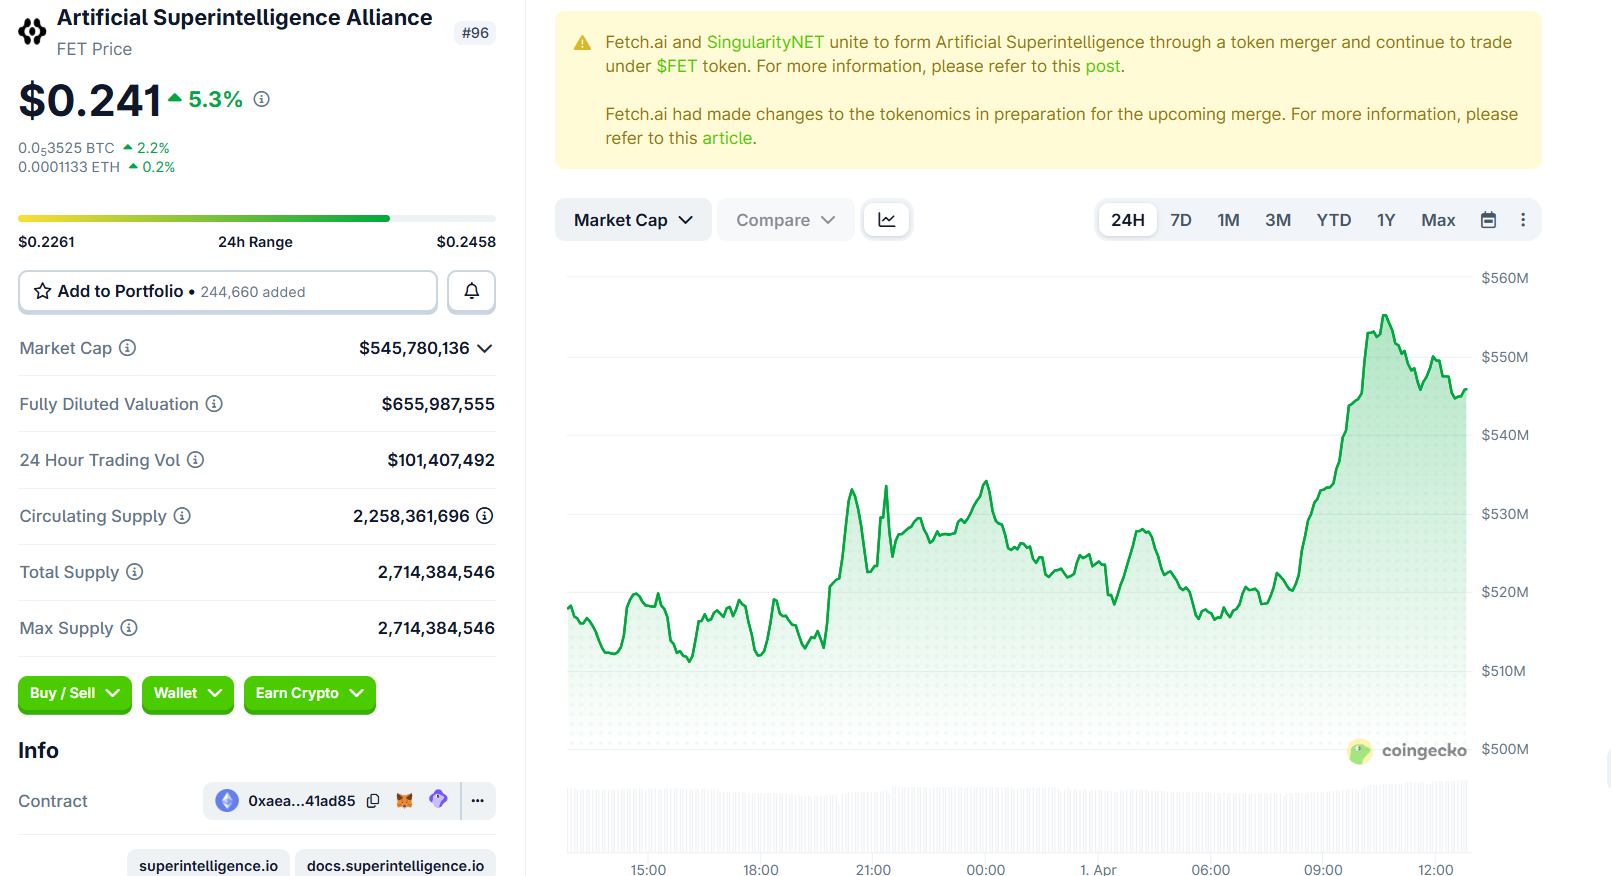
Its token, FET, currently trades at roughly $0.241, up by over 5% in the last 24 hours.
“A Catastrophic Precedent for Digital Property Rights”
Google’s whitepaper flagged roughly 1.7 million BTC in Satoshi-era Pay-to-Public-Key (P2PK) wallets that permanently expose their public keys.
These coins cannot be migrated. Their owners are either gone or unreachable. The paper proposed a “digital salvage” framework that could give governments legal authority to quantum-crack dormant coins.
Goertzel rejected the premise.
On principle, no–giving governments a legal pathway to crack private wallets sets a catastrophic precedent for digital property rights. The entire value proposition of crypto rests on the idea that your keys are your coins. Once you establish that a sufficiently powerful actor can legally seize coins whose owners are absent, you have undermined the foundation.
He acknowledged that those coins will eventually be cracked by someone. The question is whether a legal framework governs the process or it becomes a free-for-all. He leans toward leaving dormant coins untouched as a matter of principle, with the ecosystem pricing in their eventual vulnerability.
Binance co-founder Changpeng Zhao (CZ) offered a different view, suggesting that if Satoshi’s coins do not move within a certain period, the community might consider locking or burning those addresses before hackers can reach them.
He added that identifying all of Satoshi’s addresses without confusing them with early holders would itself be a challenge.
The Race Is Already On
Venture capitalist Chamath Palihapitiya called Google’s paper “quite reasonable” and urged the crypto community to organize a quantum-resistance roadmap within the next few years.
CZ said crypto would survive the quantum era but warned that coordinating upgrades across decentralized networks would spark debates, forks, and potentially new security bugs.
Goertzel’s position is blunter. He told BeInCrypto the projects that survive will be the ones that started engineering for quantum years ago. The ones that start after the first coins get cracked will not make it.
Against this backdrop, his advice for retail holders is practical. Move holdings to addresses using the most recent key formats available.
For Bitcoin, that means native SegWit (bech32) addresses where the public key stays hidden until spending. Avoid reusing addresses. For Ethereum (ETH), the vulnerability is more structural, and individual-level options remain limited.
When asked whether the quantum threat kills the decentralization thesis entirely, Goertzel told BeInCrypto that it does not.
But it raises the stakes enormously. If a centralized actor cracks dormant Bitcoin and captures hundreds of billions in assets, that becomes a massive centralizing force. The thesis, however, was never premised on legacy cryptography lasting forever.
The decentralization thesis survives if decentralized projects out-engineer centralized ones on the quantum transition. That is exactly what we intend to do.
Google’s paper, combined with a separate Caltech and Oratomic study showing Shor’s algorithm can execute at cryptographic scale with 10,000 qubits, suggests the preparation window is shorter than most assumed.
Goertzel claims his team is already on the other side of that window. The rest of the industry is now racing to catch up.
The post ASI Alliance Can Rebuild Google’s Secret Quantum Circuit, CEO Ben Goertzel Says appeared first on BeInCrypto.
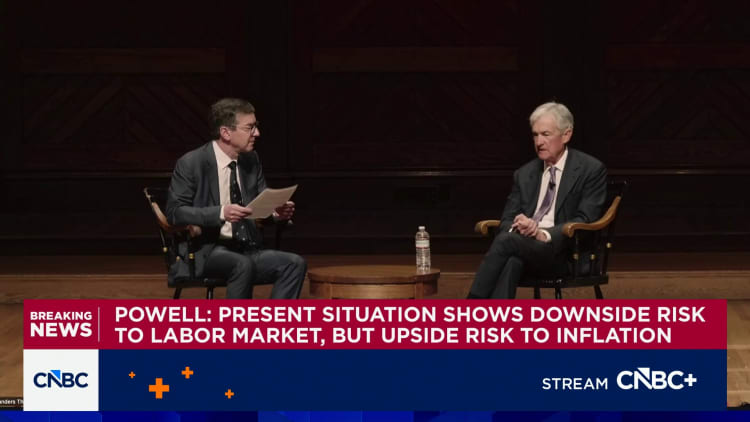

Federal Reserve Chair Jerome Powell, in a wide-ranging talk at Harvard University, said Monday that he sees inflation expectations as grounded despite rising energy prices so the central bank doesn’t need to respond with higher interest rates.
As his term leading the central bank nears an end, Powell avoided questions about the longer-term direction of interest rates or inclinations his designated successor has espoused.
In the near term, he said the proper move is to look beyond the short-term gyrations of the energy market and focus on the Fed’s goals of stable prices and low unemployment.
“Inflation expectations do appear to be well anchored beyond the short term, but nonetheless, it’s something we will eventually maybe face the question of what to do here,” he said during a question-and-answer question with a moderator and students. “We’re not really facing it yet, because we don’t know what the economic effects will be, but we’ll certainly be mindful of that broader context when we make that decision.”
As he has in the past, Powell said he believes the current rate target, in a range between 3.5%-3.75%, is “a good place” for the Fed to sit as it observes events currently playing out, including the Iran war and the impact tariffs are having on prices.
Jerome Powell, chairman of the US Federal Reserve, during a moderated conversation at Harvard University in Cambridge, Massachusetts, US, on Monday, March 30, 2026.
Mel Musto | Bloomberg | Getty Images
The comments appeared to register in financial markets, with traders no longer pricing in a significant chance of a rate hike this year. As recently as Friday morning, markets were looking at a better than 50% probability of a quarter percentage point increase amid expectations the Fed would react to the surge in energy costs. However, odds of a hike by December fell to 2.2% after Powell’s appearance.
Powell said raising rates now could have negative effects on the economy later. He noted that Fed rate moves have a lagged impact on the economy, so tightening here wouldn’t help the inflationary impact of the Iran war.
“By the time the effects of a tightening in monetary policy take effect, the oil price shock is probably long gone, and you’re weighing on the economy at a time when it’s not appropriate. So the tendency is to look through any kind of a supply shock,” he added.
Market-based measures such as breakeven rates in Treasury yields indicate few fears of an inflation spike. Breakevens measure the difference between Treasurys and inflation-indexed securities. The five-year breakeven rate most recently was around 2.56% and trending lower over the past 10 days.
Powell’s term ends in mid-May, and President Donald Trump has nominated former Governor Kevin Warsh as the next chair. However, Warsh’s nomination is being held up in the Senate Banking Committee as U.S. Attorney Jeanine Pirro continues her investigation into renovations at Fed headquarters.
Though a judge threw out a subpoena Pirro’s office issued to Powell, she has appealed the decision. While the case is being adjudicated, Sen. Thom Tillis, R-N.C., has vowed to prevent the nomination from going through.
For his part, Warsh has stated a preference for lower interest rates than the current level. Asked to comment on his successor’s plans, Powell said, “I’m not going to swing at that pitch.”
Regarding private credit, Powell noted rising defaults, investor withdrawals and concerns about wider issues in the $3 trillion sector.
“I’m reluctant to say anything that suggests that we’re dismissive of the risk, but we’re looking for connections to the banking system and things that might result in contagion. We don’t see those right now,” he said. “What we see is a correction going on, and certainly there’ll be people losing money and things like that. But it doesn’t seem to have the makings of a broader systemic event.”
Crypto World
Crypto edges higher as oil dips, but futures market shows hesitation: Crypto Markets Today


Crypto markets rallied on Wednesday as oil momentarily slipped below $100 per barrel after U.S. President Donald Trump said the war in Iran will end in “two to three weeks.”
Bitcoin trades at $68,500 having risen by 0.4% since midnight UTC and 3.1% over the past 24 hours, while ether (ETH) is back at $2,130 after a brief stint below $2,000 last week.
The broader crypto market remains in a downtrend dating back to October, although sentiment has shifted slightly following a period of consolidation between $62,500 and $75,000 since early February.
A selection of altcoins have performed particularly well, notably algorand (ALGO), which is up by 22% in the past 24 hours as it bounces back from oversold territory.
Derivatives positioning
- The crypto futures market appears to be churning rather than building clear directional positions, as trading volumes have risen 23% to $210 million over the past 24 hours, while open interest has remained broadly stable at around $106 billion.
- Open interest in major USD- and USDT-denominated futures has clearly diverged from BTC’s recovery from the weekend low of around $65,000. This suggests the rebound is not being driven by a meaningful buildup in leveraged positions, but rather by spot demand or short covering, pointing to a lack of strong conviction behind the move.
- Ether’s OI has risen slightly alongside its spot price, signaling participation from leveraged traders.
- ETH and ZEC stand out as major coins with positive OI-adjusted CVD and funding rate. This combination points to aggressive bidding in the futures market, with traders actively opening long positions and paying a premium to maintain them.
- The market for ADA, XMR, BCH and SHIB suggests otherwise.
- Bitcoin and Ether implied volatility indices continue to present a picture of calm.
- On Deribit, risk reversals continue to show a bias for BTC and ETH put options, which offer protection against price slides. Bearishness is slightly more pronounced in BTC options.
Token talk
- The CoinDesk Computing Select Index (CPUS) was the best performing benchmark on Wednesday, rising by 2.7% since midnight UTC while the CoinDesk Smart Contract Platform Select Capped Index (SCPXC) and the DeFi Select Index (DFX) are up by 1.5% apiece.
- The bitcoin and major-dominant CoinDesk 5 (CD5) and CoinDesk 20 (CD20) have increased by 0.35% and 0.69% respectively, indicating underperformance against the wider altcoin market.
- Algorand (ALGO) led the market gains on Wednesday but it was closely followed by decentralized finance (DeFi) tokens MORPHO and JUP, which posted double digit gains.
- A disproportionate rise in open interest for assets like ETH and ZEC suggests the recent move has been backed by leverage as opposed to spot buying, which could unwind in news to the contrary of Trump’s statement is released this week.
The US dollar is retreating from recent highs, moving into a moderate correction after a prolonged period of gains. Pressure on the currency is building amid weaker-than-expected macroeconomic data, while market participants adopt a wait-and-see approach ahead of key labour market releases, including the ADP report.
The current dynamics reflect a gradual cooling in expectations regarding the resilience of the US economy. Recently published indicators point to a slowdown in business activity and easing labour market tightness, reducing support for the dollar after it reached local highs. At the same time, upcoming releases remain a key factor that could either reinforce the corrective move or restore demand for the US currency.
Among the published figures, investors focused on mixed US macro data. The Chicago PMI fell to 52.8 versus expectations of 54.8, signalling a slowdown in the manufacturing sector. In addition, JOLTS job openings came in below forecasts (6.882 million vs 7.240 million), indicating a gradual cooling in the labour market. Further pressure came from regional business activity indices, including data from the Dallas Fed, which reinforced doubts about the sustainability of the current economic momentum.
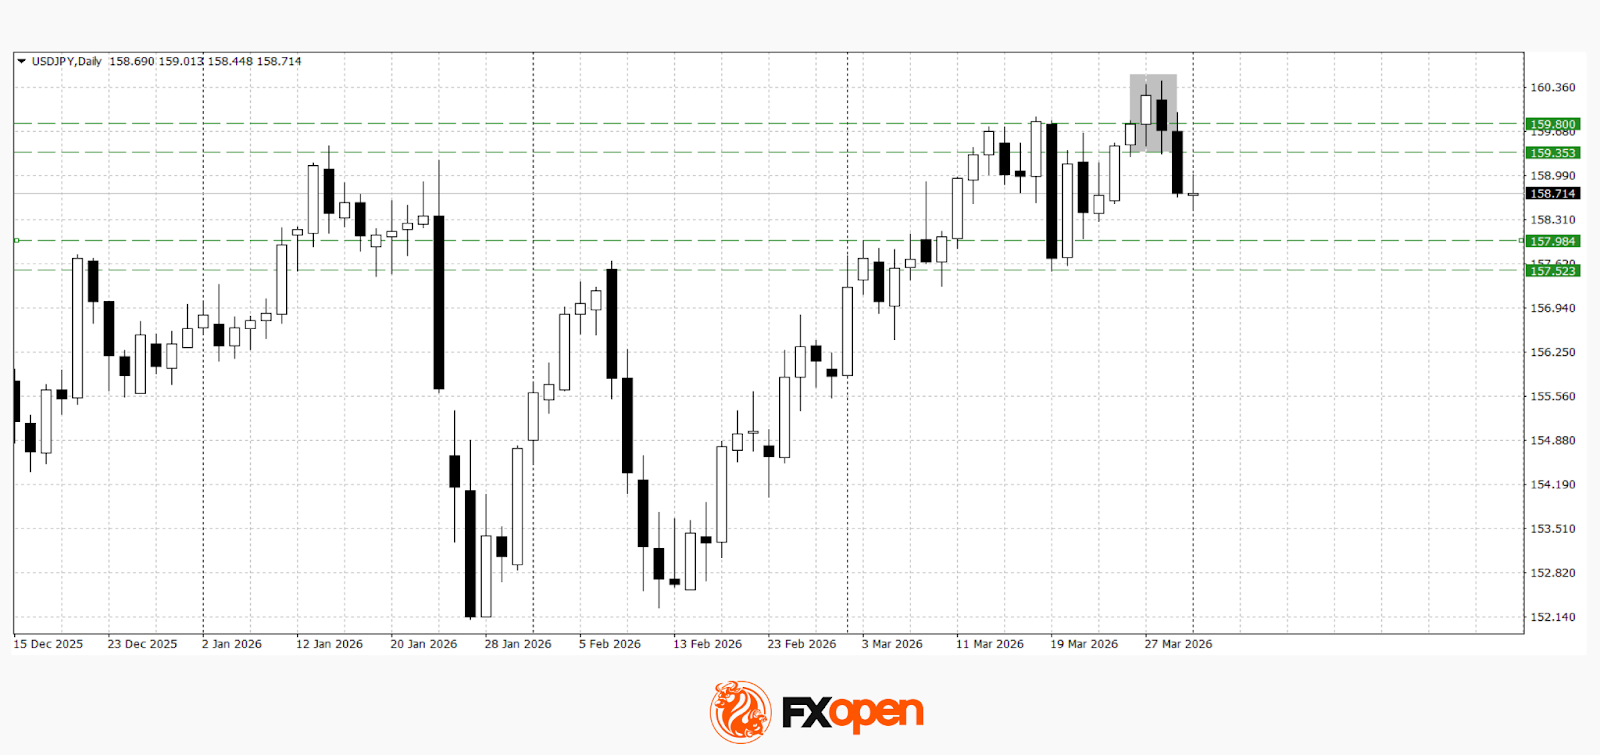
USD/JPY
After reaching fresh yearly highs and testing the psychological 160.00 level, USD/JPY has moved lower, forming a corrective pullback. Technical analysis suggests a potential decline towards the 157.50–158.00 area, as a dark cloud cover pattern has formed on the daily timeframe.
If the price consolidates above the 159.40–159.80 range, the bearish correction scenario may be invalidated.
Key events for USD/JPY:
- today at 15:15 (GMT+3): US ADP non-farm employment change
- today at 15:30 (GMT+3): US core retail sales
- today at 16:45 (GMT+3): US manufacturing PMI

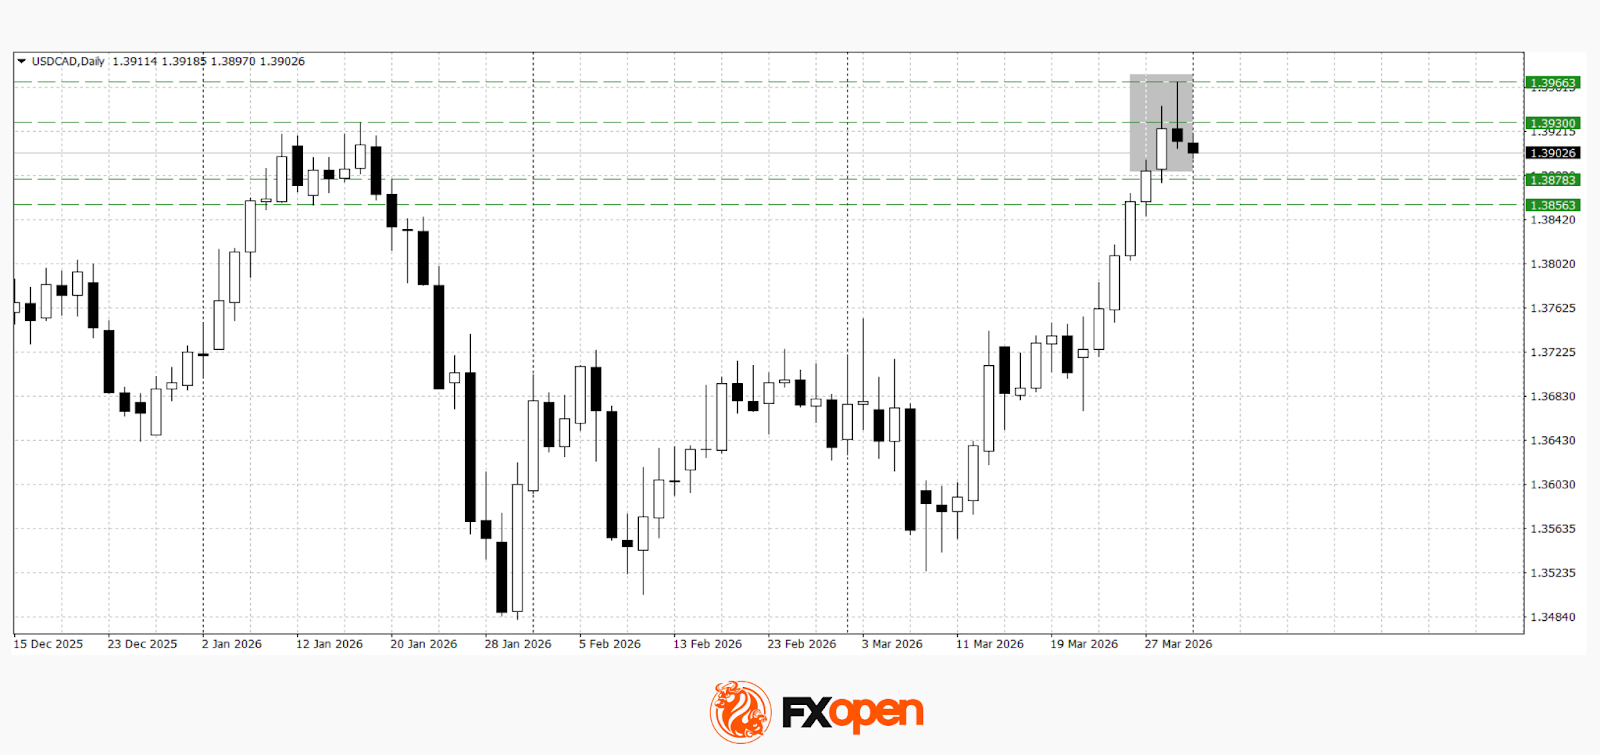
USD/CAD
USD/CAD is also showing a pullback from local highs following a strong rally. The formation of an Evening Star pattern near the 1.3930 level indicates a slowdown in bullish momentum and the potential for a correction towards 1.3860–1.3880.
At the same time, a move above 1.3970 could support a resumption of the uptrend and the formation of a new bullish impulse.
Key events for USD/CAD:
- today at 16:30 (GMT+3): Canada manufacturing PMI
- today at 17:30 (GMT+3): US crude oil inventories
- today at 18:30 (GMT+3): Atlanta Fed GDPNow indicator
Trade over 50 forex markets 24 hours a day with FXOpen. Take advantage of low commissions, deep liquidity, and spreads from 0.0 pips (additional fees may apply). Open your FXOpen account now or learn more about trading forex with FXOpen.
This article represents the opinion of the Companies operating under the FXOpen brand only. It is not to be construed as an offer, solicitation, or recommendation with respect to products and services provided by the Companies operating under the FXOpen brand, nor is it to be considered financial advice.
Key Takeaways
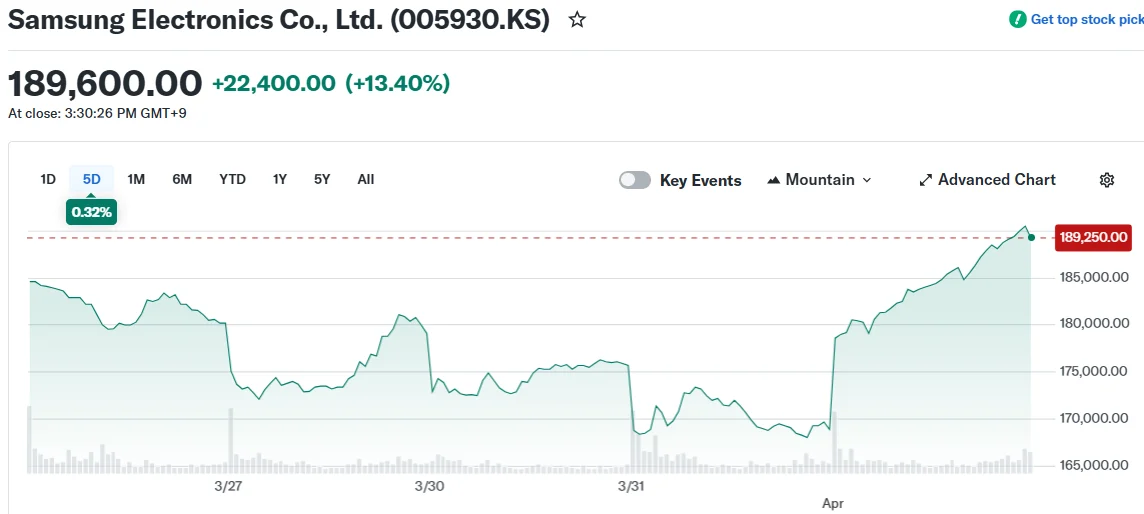
- Samsung and SK Hynix shares surged 10–13% Wednesday following significant March declines
- South Korea’s KOSPI index rallied more than 8%, bouncing back from a 19%+ monthly decline
- Optimism around a potential Middle East conflict resolution improved market sentiment
- The semiconductor giants had plunged 23–24% in March amid geopolitical concerns and AI memory chip demand uncertainty
- Overnight gains on Wall Street, spurred by President Trump’s Iran statements, provided momentum
Shares of Samsung Electronics surged 13% to reach 189,600 won during Wednesday’s trading session, while SK Hynix climbed approximately 11% to 893,000 won. The dramatic recovery followed a punishing March for both semiconductor manufacturers.

South Korea’s benchmark KOSPI index jumped 8.4% to close at 5,478.70, with the semiconductor sector rebound providing substantial support. The index had tumbled more than 19% during March.
The two technology giants each lost approximately 23–24% of their value last month. Investor anxiety centered on the escalating Middle East situation, which threatened to increase manufacturing expenses and disrupt global supply networks.
Additional pressure emerged from questions surrounding sustained demand for memory semiconductors utilized in artificial intelligence applications. Google‘s introduction of an algorithm reportedly capable of reducing AI memory needs added to sector headwinds.
Speculation intensified that memory chip pricing could weaken after OpenAI implemented cost-cutting measures. The artificial intelligence company discontinued its video generation platform, Sora, as part of broader budget reductions.
Strategic OpenAI Partnership Under Spotlight
Toward the end of 2025, OpenAI entered into an agreement with Samsung and SK Hynix for the procurement of 900,000 DRAM wafers from the Korean manufacturers. This partnership had previously fueled investor enthusiasm for both companies.
Both semiconductor producers had enjoyed rising memory chip valuations throughout late 2025, supported by expectations that AI-driven demand would exceed available supply. March’s correction erased portions of those earlier advances.
Kiwoom Securities analyst Han Ji-young attributed Wednesday’s rally to value-oriented purchasing, noting that blue-chip stocks had declined sufficiently to entice investors back into the market.
“The stock market is highly likely to enter a recovery phase rather than experience further decline,” Han stated in client communications.
Peace Prospects in Middle East Boost Market Confidence
Market sentiment strengthened following President Trump’s Tuesday statement indicating the United States would withdraw from Iran within a two to three-week timeframe. The President delivered these remarks during a White House press availability.
Iranian President Masoud Pezeshkian indicated Tehran’s willingness to conclude hostilities, though he requested certain unspecified assurances.
These diplomatic developments triggered an overnight rally across U.S. markets, with the positive momentum extending into Asian trading sessions Wednesday.
Samsung shares concluded trading at 189,600 won, approximately $125.83 in U.S. dollar terms. SK Hynix finished at 893,000 won.
The KOSPI index settled at 5,478.70, representing an 8.4% single-day advance.
Despite Wednesday’s gains, both Samsung and SK Hynix continue trading substantially below their pre-March levels.

Crypto World
Uniswap Foundation Reports $85.8M in Total Assets for FY2025, Runway Extends to January 2027

TLDR:
- The Uniswap Foundation held $49.9M in cash and stablecoins alongside 15.1M UNI tokens at year-end 2025.
- A total of $106.2M was allocated toward grants and incentives, covering both new and prior commitments.
- The Foundation committed $26M in new grants throughout FY2025 and disbursed $11M from prior commitments.
- The UNIfication governance proposal, approved December 26, 2025, will reshape financial projections in Q1 2026.
The Uniswap Foundation published its unaudited financial summary for fiscal year 2025 on March 31. The report covers the organization’s financial position through December 31, 2025.
It projects an operational runway through January 2027. Total assets stood at $85.8 million at year-end market prices.
This includes $49.9 million in cash and stablecoins, 15.1 million UNI tokens, and 240 ETH. The report also precedes structural changes tied to the UNIfication governance proposal, approved on December 26, 2025.
Asset Holdings and Fund Allocation
The Foundation held three categories of assets as of year-end 2025. Cash and stablecoins totaled $49.9 million, while 15.1 million UNI tokens and 240 ETH were also on hand. Together, these assets represented $85.8 million in total market value at closing rates.
Of the total earmarked funds, $106.2 million was allocated toward grants and incentives. This breaks down into $87.5 million for new grant commitments in the future. An additional $18.7 million was reserved for previously committed grants still awaiting disbursement.
Beyond grants, $26.3 million was set aside for operating expenses and employee token awards. These two budget lines cover the Foundation’s staffing, administration, and token compensation. They reflect planned spending across its core operational functions.
The fiat and stablecoin reserves were designated primarily for grantmaking and day-to-day operations. UNI token reserves, however, were held to support future runway needs. This approach allowed the Uniswap Foundation to retain upside exposure to UNI’s market performance over time.
The projected spend figures are set to be updated in the Q1 2026 financial report. That update will reflect changes following the UNification proposal’s approval on December 26, 2025. Organizational shifts post-passage are expected to revise the foundation’s financial outlook going forward.
FY2025 Grant Activity and Ecosystem Milestones
Throughout FY2025, the Uniswap Foundation committed $26 million in new grants to ecosystem projects. It also disbursed $11 million from previously committed grants across the year. In Q4 2025 alone, $5.8 million in new grants were committed.
Q4 2025 disbursements reached $2.1 million from prior commitments. These funds went toward builders and developers operating across the broader ecosystem. Grant activity remained steady throughout all four quarters of the year.
On the operational side, the Foundation accrued $9.7 million in operating expenses for FY2025. Employee token awards of 0.45 million UNI were excluded from that figure. Interest revenue on fiat holdings contributed an additional $1.7 million to the organization’s income.
The Foundation also received 20.3 million UNI tokens from the Uniswap Treasury via the Uniswap Unleashed Proposal. At year-end prices, this transfer equaled approximately $114 million in market value. This inflow added materially to the Foundation’s overall reserve position during 2025.
Key milestones in 2025 included the launch of Uniswap v4 and Unichain. More than 1,500 builders onboarded to v4 during the calendar year.
These developments supported the organization’s ongoing commitment to expanding decentralized finance infrastructure.
Crypto is pseudonymous – a halfway house between anonymous and public.
While you don’t need to expose your identity to open a crypto wallet, public blockchains leave a visible record of your activity for all to see.
A single withdrawal from a KYC exchange can link your real name to a wallet, and once that wallet is tied to your identity, anyone can trace the rest of your on-chain activity.
This is why, as on-chain analysis tools become more widely used, many users are paying closer attention to what financial privacy actually means in crypto.
Mixero was built around this issue. The platform focuses on helping users protect their transaction history while remaining in a decentralized environment.
Public Blockchains Make Wallet Activity Easy to Follow
At the center of Mixero’s service is CoinJoin, a method used to combine transactions in a way which makes blockchain analysis far more difficult.
Rather than sending funds through a direct and easily traceable path, CoinJoin helps obscure the relationship between sender and recipient. This is Mixero’s core solution for Bitcoin users who want stronger privacy without stepping outside the asset itself.
The company argues that privacy has become an important part of using crypto in a mature way. On public ledgers, transaction histories can reveal far more than a single payment. They can expose balances, spending patterns, wallet links, and long-term activity. This can become a serious concern for users who value financial discretion.
Mixero’s platform is designed to keep the process simple. Users can enter one or several destination BTC addresses, adjust settings, receive a signed Letter of Guarantee, and track the order through a status page.
The service is also available through Tor, while Mixero says it keeps no logs of user activity.
Advanced Mode Uses Monero for Deeper Privacy
For users who want a higher level of protection, Mixero offers Advanced Mode. This feature routes transactions through Monero before returning them to Bitcoin. The process works through an XMR bridge and automatically generated wallets, giving users access to the strongest privacy option Mixero offers.
Monero uses built-in privacy technologies such as stealth addresses, ring signatures, and RingCT to conceal transaction details. These tools are designed to hide the sender, receiver, and amount involved in a transfer, which makes Monero one of the most privacy-focused networks in the market.
By routing Bitcoin through Monero and back again, Mixero gives users a way to get stronger privacy without leaving BTC behind at the end. It is aimed at people who want more cover than
About Mixero
Mixero is a privacy-focused crypto service built for users who want stronger transaction privacy on public blockchains. The platform offers CoinJoin-based Bitcoin mixing, Tor access, signed Letters of Guarantee, and an Advanced Mode which routes transactions through Monero for deeper anonymity. Designed for users who value discretion in an increasingly transparent on-chain environment, Mixero aims to make privacy tools more accessible without sacrificing ease of use. Its service is focused on helping users reduce the visibility of their transaction history while staying within the crypto ecosystem.
The post Mixero Pushes for Real Privacy on Public Blockchains appeared first on BeInCrypto.

Solana is holding its breath, trading at the $84 price level, it is barely moving with just 1% gain in the last 24 hours, as opposed to BTC 2.4% gain and ETH 4.5%, even with bullish catalysts that bring a good prediction. Institutional heavyweights Interactive Brokers and Galaxy Digital signal a deepening commitment to the network, and could force a directional move soon.
— Solana Daily (@solana_daily) March 31, 2026
 Interactive Brokers (@IBKR), one of the world's largest brokers, launches crypto trading for 450M people across Europe, including $SOL. pic.twitter.com/mOvB1kVSxd
Institutional pressure is building on both sides of the trade. Galaxy’s continued positioning in SOL infrastructure and Interactive Brokers’ expanded support for the asset add credibility to the bull thesis, even as the broader market sits in near-extreme fear.
The macro headwinds are real. But so is the on-chain growth underpinning SOL’s longer-term case. ETF inflows into Solana products remain a live catalyst that institutional desks are watching closely.
Discover: The best crypto to diversify your portfolio with
Solana Price Prediction: $95 or $75 Next?
SOL has been compressing in a tightening range under $90, a setup that can resolved with a sharp move in either direction. At $84 with a 1.5% single-day decline, the immediate picture looks defensive, but RSI sits at 46, a technical buy signal that suggests sellers haven’t fully taken control yet.
Resistance is stacked. Immediate ceiling at $88, then the $90.50–$91 zone, with $95 acting as the breakout trigger that unlocks the bull case. Above that level, we can safely target $115–$125.
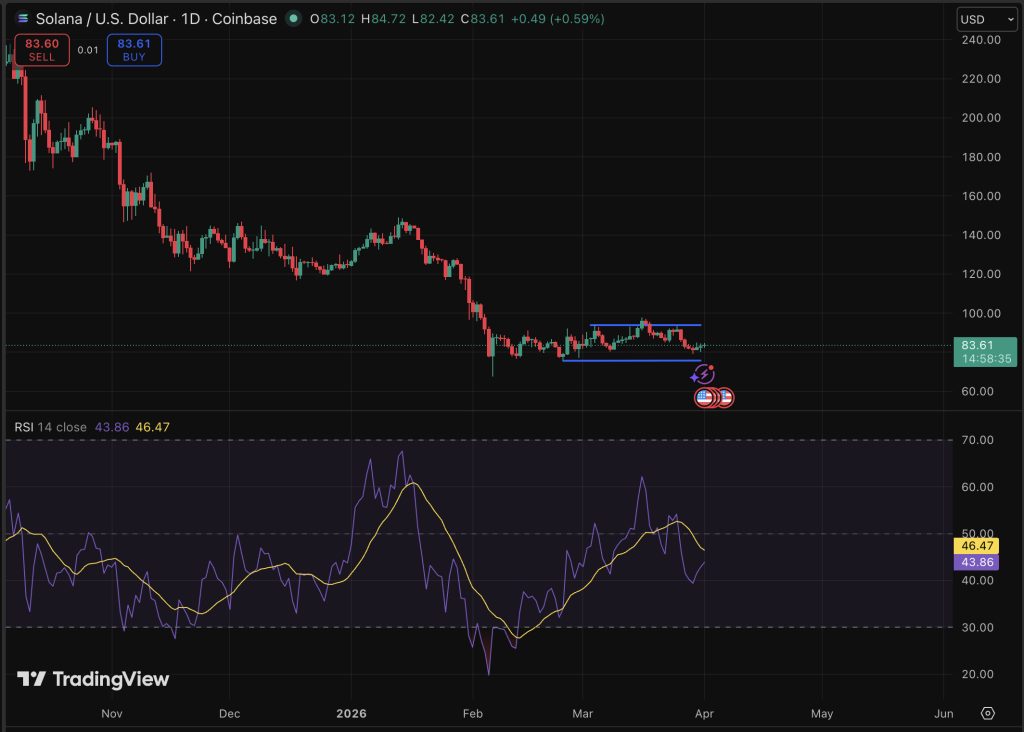
But a breakdown below the $75 support zone opens the door to deeper downside. The setup is binary. Position sizing accordingly.
Discover: The best pre-launch token sales
Maxi Doge Targets Early Mover Upside as Solana Tests Key Levels
SOL at $84 with a $95 breakout requirement means most of the easy money on this trade has already been made. For traders calculating risk-reward on a market-cap-weighted basis, the upside from here demands patience and assumes macro conditions cooperate. That’s where early-stage positioning starts looking different on a spreadsheet.
Maxi Doge ($MAXI) is an Ethereum-based meme token built around a 240-lb canine juggernaut and a 1000x leverage trading mentality, genuinely unhinged energy, deliberately so.
The project has raised more than $4,7 million at a current price of $0.00028, with 66% staking APY bonus available for holders. Features include holder-only trading competitions with leaderboard rewards, a Maxi Fund treasury for liquidity and partnerships, and meme-first marketing built on viral gym-bro humor.
Research Maxi Doge and join the army.
This article is for informational purposes only and does not constitute financial advice. Crypto assets are highly volatile. Always do your own research before investing.
The post Solana Price Prediction: Interactive Brokers Supports SOL, Galaxy Doubles Down appeared first on Cryptonews.

SOL price stalls below key resistance even as Solana’s fundamentals surge

How Paramount Buying Warner Bros. Will Save Star Trek From Itself

Kaia Gerber Shows Off Her Moves in Repetto


-

 News Videos6 days ago
Parliament publishes latest register of MPs’ financial interests
-
 Tech6 days ago
Intercom’s new post-trained Fin Apex 1.0 beats GPT-5.4 and Claude Sonnet 4.6 at customer service resolutions
-

 Business6 days ago
Instagram, YouTube Found Responsible for Teen’s Mental Health Struggle in Historic Ruling
-
 NewsBeat7 days ago
Tesco is selling new Cadbury Dairy Milk bar and people can’t wait to try it
-

 NewsBeat5 days ago
The Story hosts event on Durham’s historic registers
-

 Sports5 days ago
Sweet Sixteen Game Thread: Tide vs Michigan
-
Entertainment2 days ago
Fans slam 'heartbreaking' Barbie Dream Fest convention debacle with 'cardboard cutout' experience
-
 Entertainment4 days ago
Lana Del Rey Celebrates Her Husband’s 51st Birthday In New Post
-
Crypto World24 hours ago
Dems press CFTC, ethics board on prediction-market insider trades
-

 Sports19 hours ago
Tallest college basketball player ever, standing at 7-foot-9, entering transfer portal
-
 Fashion7 days ago
How to Style Spring Like WeWoreWhat: Easy Outfit Ideas for 2026
-

 Tech2 days ago
The Pixel 10a doesn’t have a camera bump, and it’s great
-

 Entertainment6 days ago
HBO’s Harry Potter Series Will Definitely Fail For One Big Reason, And It’s Not J.K. Rowling Or Snape
-

 Fashion6 days ago
En Vogue in Brown Leather and Tailored Neutrals by Atelier Savoir, Styled by J Bolin
-

 Crypto World2 days ago
U.S. rule change may open trillions in 401(k) funds to crypto
-

 Fashion6 days ago
What Are Your Favorite T-Shirts for the Weekend?
-

 Politics2 days ago
Should Trump Be Scared Strait?
-

 Fashion5 days ago
Weekly News Update, 3.27.26 – Corporette.com
-

 Sports2 days ago
Women’s hockey camp eyes fitness boost, tactics ahead of WC 2026 campaign | Other Sports News
-

 Tech1 day ago
How to back up your iPhone & iPad to your Mac before something goes wrong
You must be logged in to post a comment Login