
Crypto World
Roubini Predicts a ‘Crypto Apocalypse’ Amidst Bitcoin’s Plunge Under Trump-Era Policies


Roubini said that Bitcoin behaves like a leveraged bet, rising and falling alongside high-risk equities rather than hedging uncertainty.
Economist Nouriel Roubini, who is known for his anti-crypto rhetoric, predicted a looming “crypto apocalypse.” He explained that the future of money and payments will evolve gradually rather than undergo the revolutionary transformation promised by cryptocurrency advocates.
In a recent post, Roubini said Bitcoin and other cryptocurrencies’ latest price plunge demonstrates the extreme volatility of what he calls a “pseudo-asset class,” and expressed hope that policymakers recognize the risks before further damage occurs.
He recalled that one year earlier, Donald Trump had returned to the US presidency after courting retail crypto investors and receiving significant backing from crypto industry figures. This led several evangelists to predict that Bitcoin would reach at least $200,000 by the end of 2025 and become “digital gold.”
Roubini: Bitcoin Isn’t a Hedge
According to Roubini, Trump followed through by dismantling most crypto regulations, signing the Guiding and Establishing National Innovation for US Stable Coins (GENIUS) Act, pushing the Digital Asset Market Clarity (CLARITY) Act, profiting from domestic and foreign crypto deals, promoting a meme coin bearing his name, pardoning crypto criminals allegedly linked to terrorist organizations, and hosting private White House dinners for crypto insiders.
Roubini noted that crypto was also expected to benefit from macroeconomic and geopolitical risks, including rising public debt, fiat currency debasement, trade wars, and increased tensions involving the US, Iran, and China, factors that coincided with gold rising more than 60% in 2025.
Bitcoin, however, fell 6% that year and, as of the time of writing, was down 42% from its October peak and below its level at Trump’s election, while the TRUMP and MELANIA meme coins had dropped 95%. Roubini said Bitcoin repeatedly declined during periods when gold rallied, and argued that it behaves as a leveraged risk asset correlated with speculative stocks rather than a hedge.
He reiterated his long-standing view that crypto does not function as a currency, as it is neither a unit of account, a scalable payment system, nor a stable store of value, while citing El Salvador’s experience, where Bitcoin accounts for less than 5% of transactions. He further argued that crypto is not a true asset because it lacks income streams or real-world utility.
You may also like:
On Stablecoins and Regulations
Roubini said the only widely adopted crypto application after 17 years is the stablecoin, which he described as a digital form of fiat money already replicated by traditional finance, and maintained that most blockchain-based systems are centralized, permissioned, and privately controlled. He asserted that fully decentralized finance will never scale because governments will not permit anonymous transactions, and that AML and KYC requirements undermine claims of lower costs.
While speaking about regulation, Roubini warned the GENIUS Act risks recreating the instability of 19th-century free banking, as stablecoins lack narrow bank regulation, lender-of-last-resort access, or deposit insurance, making them vulnerable to runs. He also criticized proposals allowing stablecoins to pay interest, and claimed that this could destabilize fractional reserve banking unless payments and credit creation are structurally separated.
Roubini’s comments come as Bitcoin continues its downward trajectory, falling a fresh 6% on Thursday and trading below $71,600 at the time of writing. The latest decline has added to broader market unease, and analysts are warning that continued weakness in BTC could have wider implications. Market experts have increasingly raised concerns that firms holding large BTC reserves may face massive balance-sheet stress and systemic risk if prices continue to slide.
SECRET PARTNERSHIP BONUS for CryptoPotato readers: Use this link to register and unlock $1,500 in exclusive BingX Exchange rewards (limited time offer).

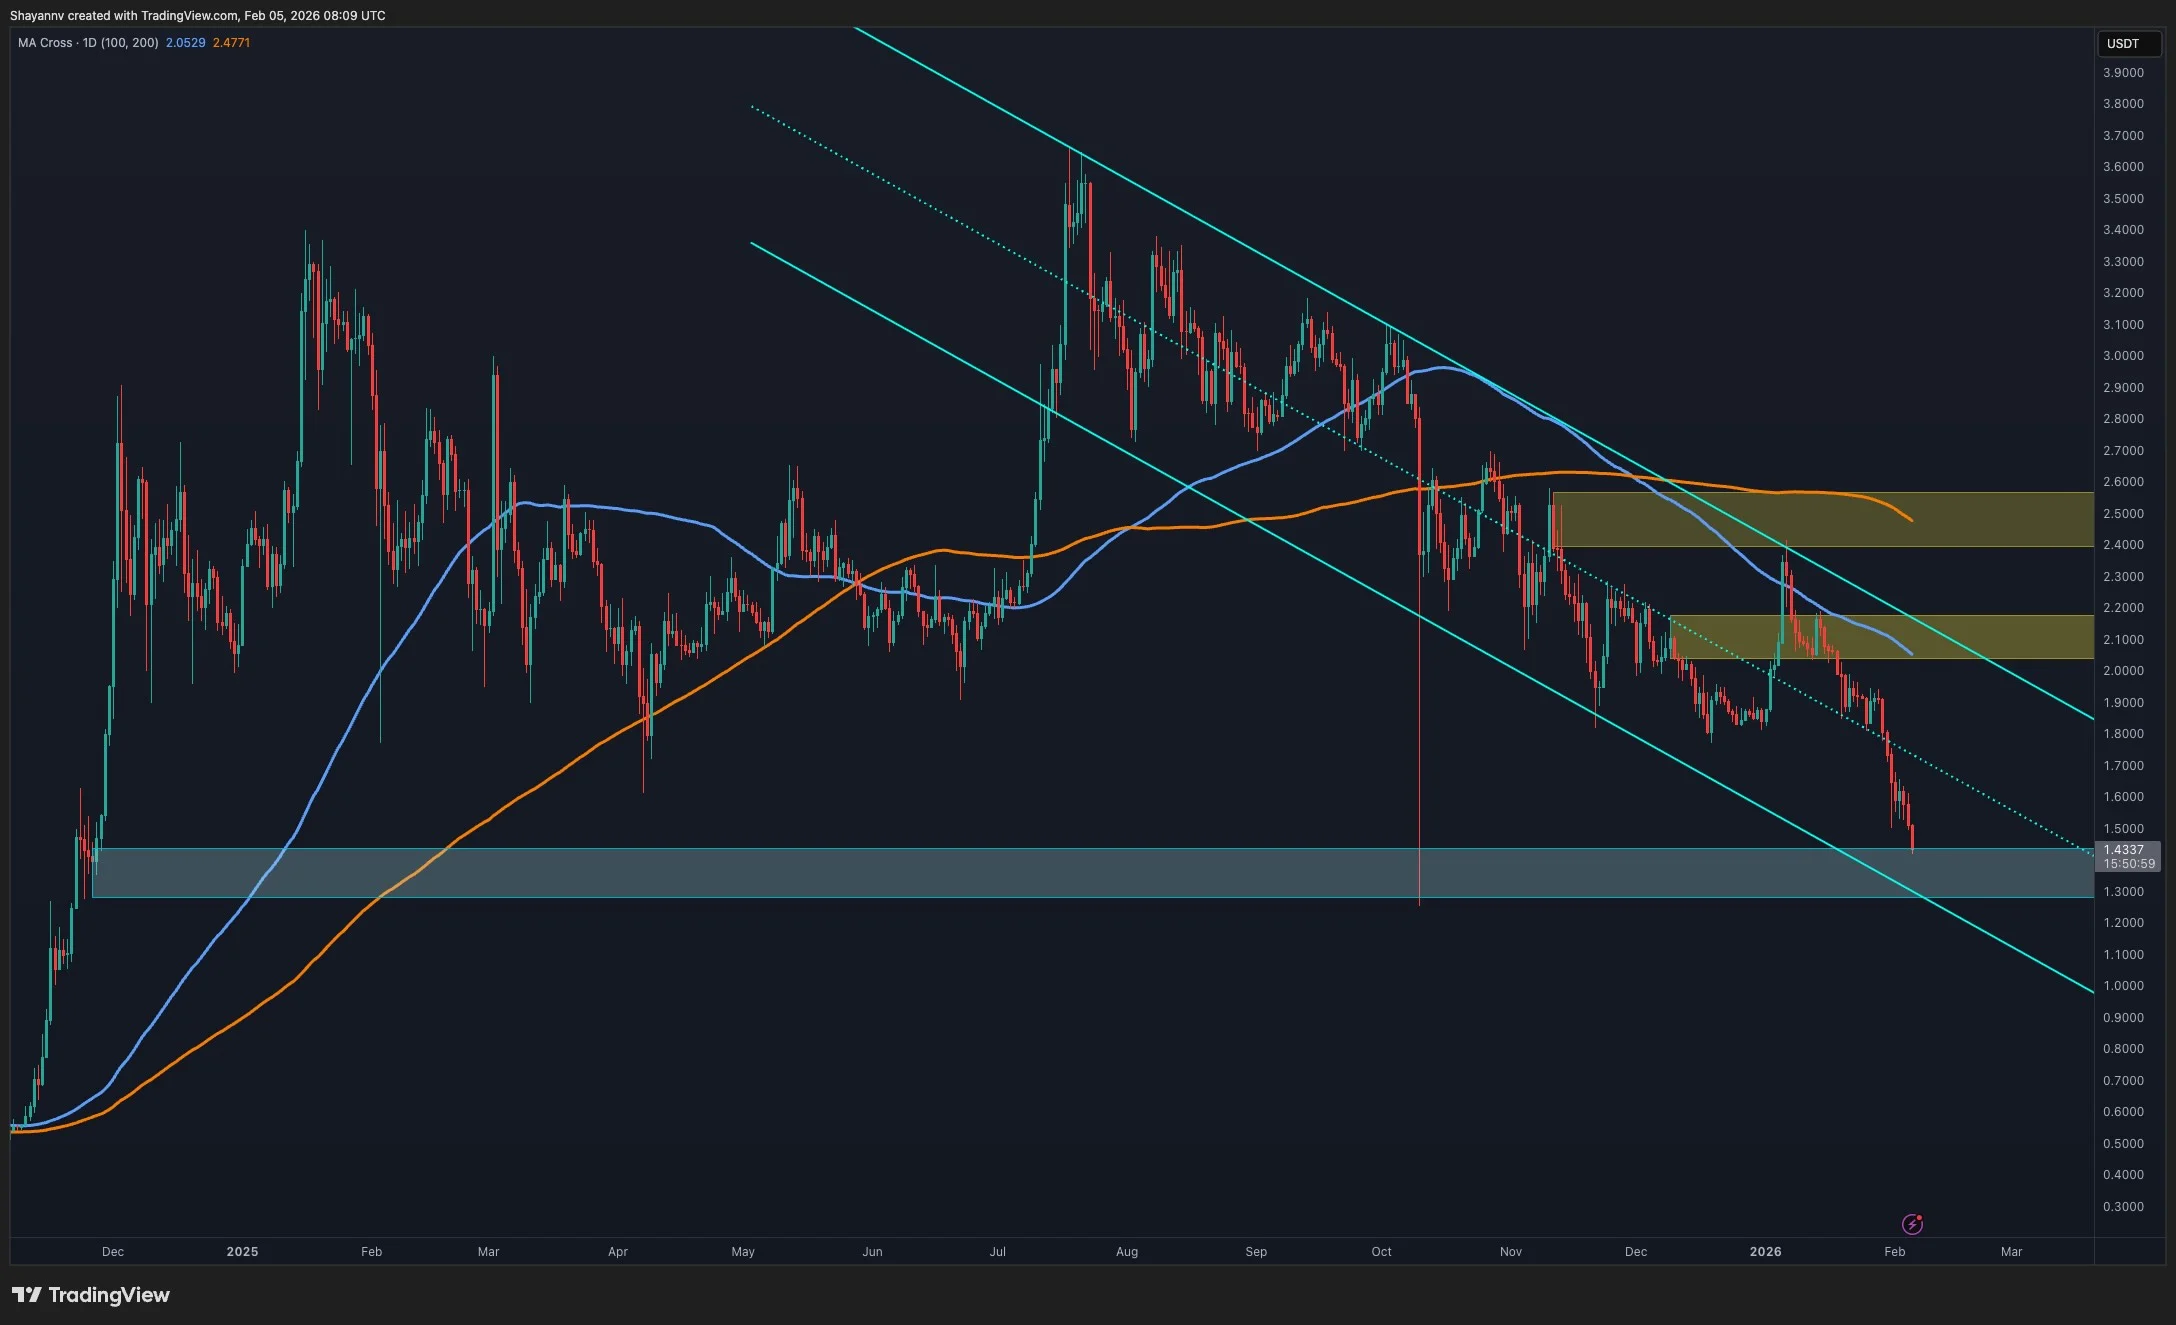
Ripple’s XRP remains under sustained bearish pressure, with the price continuing to print lower lows and failing to reclaim key supply zones. The broader structure still reflects a dominant downtrend, and the recent price action suggests sellers remain in control as the market approaches a critical demand area that could define the next directional move.
Ripple Price Analysis: The Daily Chart
On the daily timeframe, XRP is trading deep within a bearish market structure, having lost multiple former support levels that have now flipped into resistance. The price is currently pressing into a well-defined demand zone at the $1.3 range highlighted on the chart, an area that previously acted as a base before the last impulsive upside move. This zone represents the first meaningful area where buyers may attempt to slow the decline.
However, the broader daily trend remains decisively bearish. Each corrective bounce over the past months has been capped by lower supply zones, and the asset has consistently respected these areas before continuing lower. As long as XRP remains below the channel’s mid-trendline of $1.6, any bounce from the current demand should be treated as corrective rather than trend-reversing.
Nevertheless, a failure to hold this demand zone would significantly weaken the structure and open the door for a deeper continuation toward lower, untested liquidity levels. Conversely, a strong daily reaction from this area would be required to signal short-term relief, but not yet a confirmed trend shift.
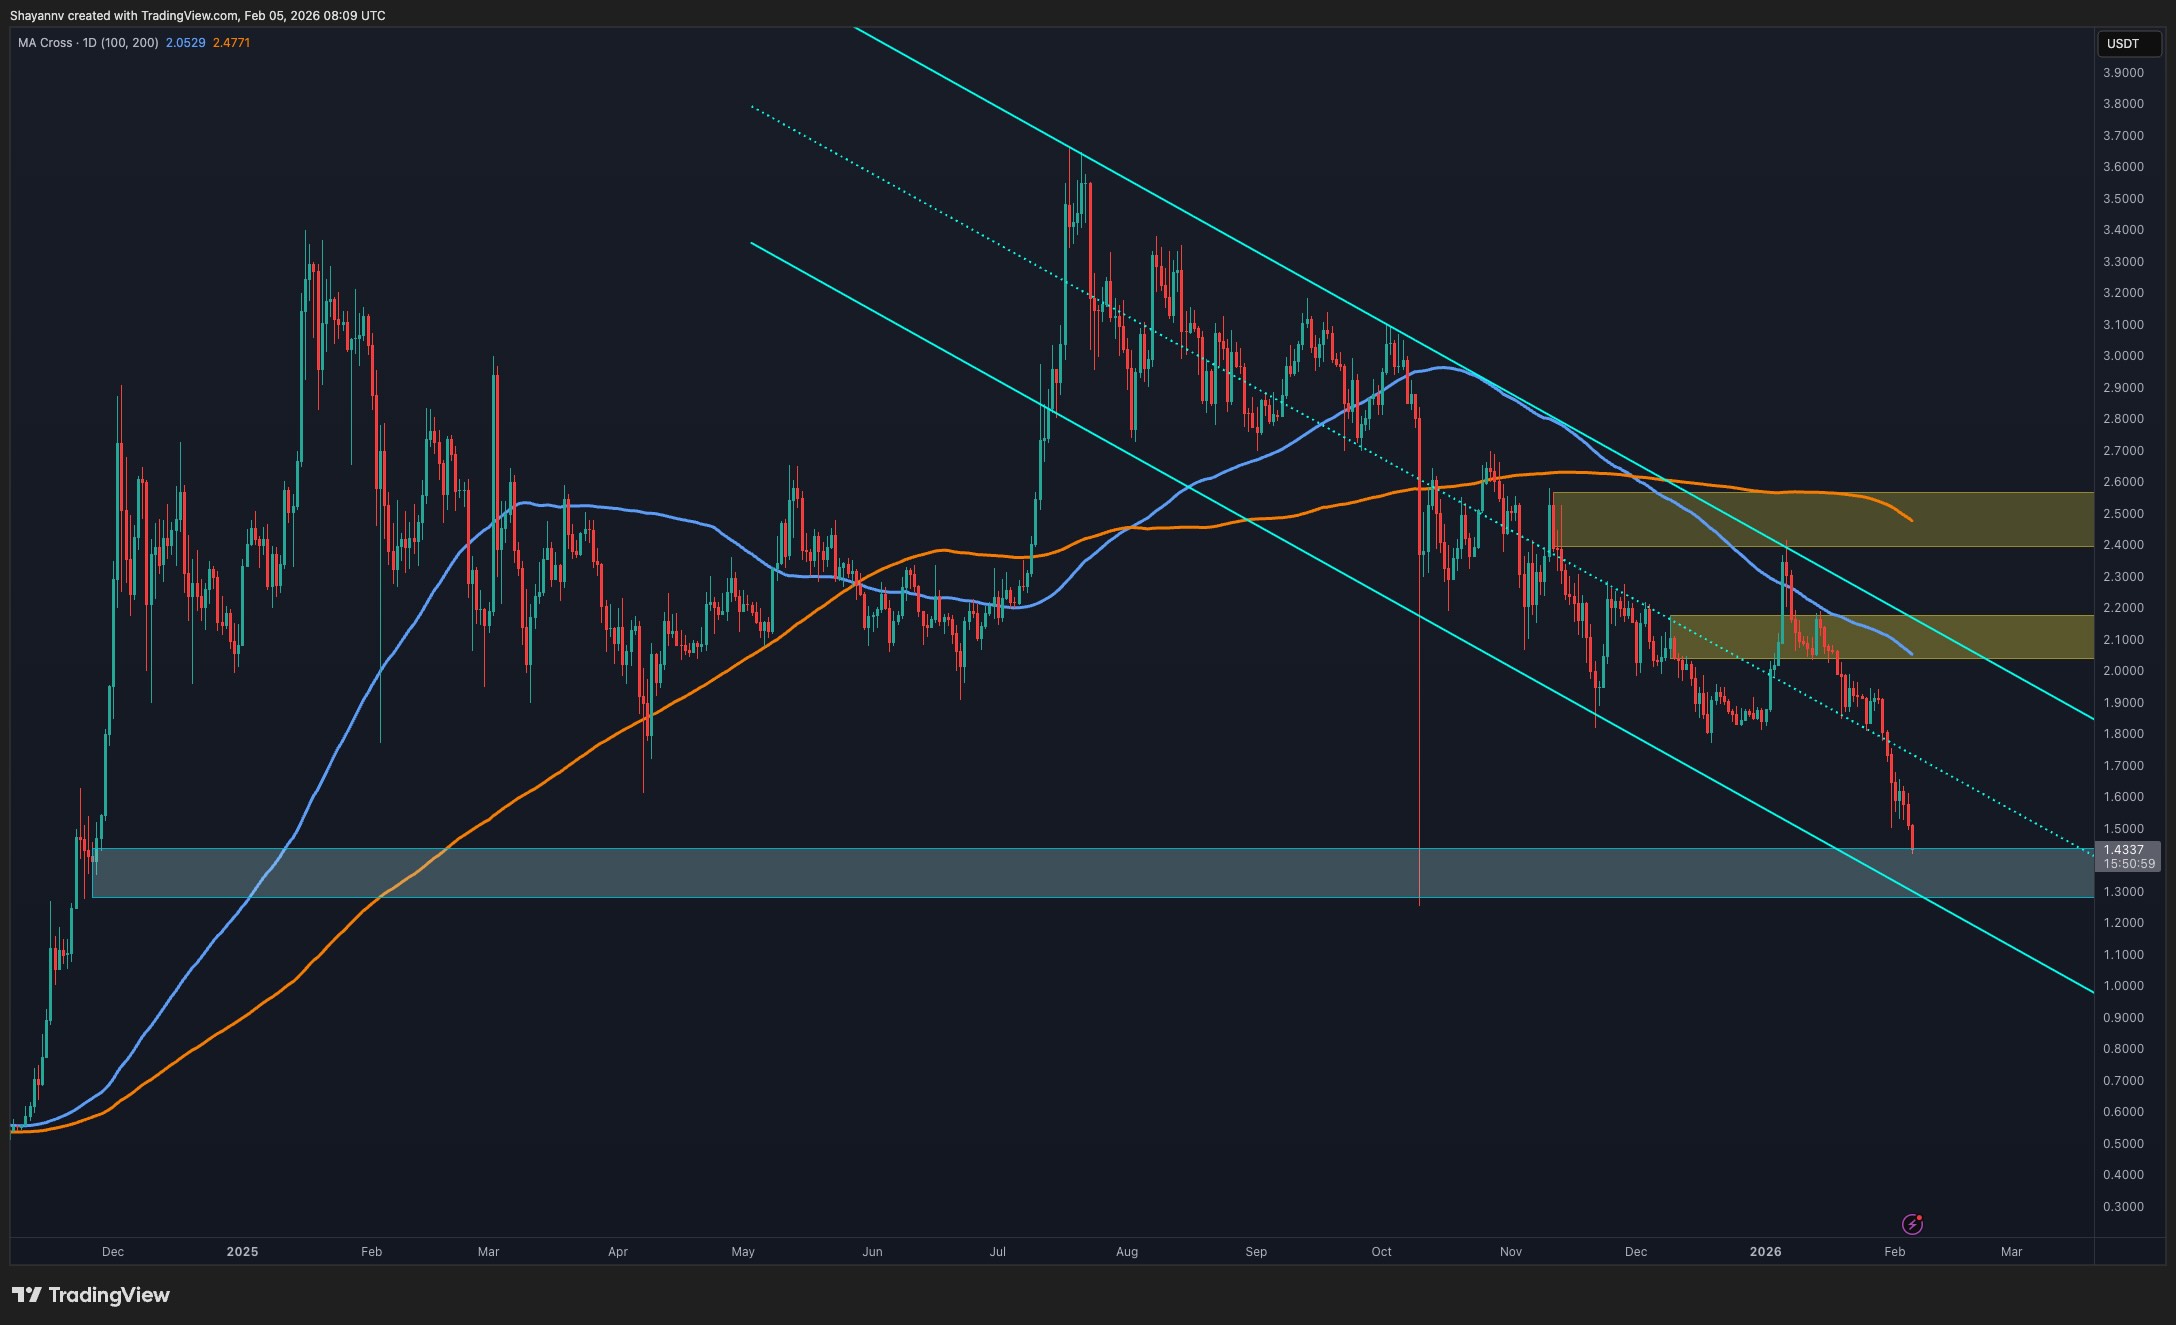
XRP/USDT 4-Hour Chart
The 4-hour chart provides additional clarity on the internal structure of the downtrend. Recent price action shows a sharp rejection from successive supply zones, confirming that sellers are aggressively defending these levels.
Following the latest rejection, the asset accelerated lower and is now approaching the $1.3 critical support, which also aligns with the broader demand zone visible on the daily timeframe. This confluence increases the probability of at least a short-term reaction, as short sellers may begin to take profits and reactive buyers step in.
That said, the presence of multiple stacked supply zones above the current price at $1.6 and $2 significantly limits upside potential in the near term. Any rebound toward these levels would likely face renewed selling pressure, unless accompanied by a clear break in structure and acceptance above the channel. Until such confirmation appears, the 4-hour trend remains firmly bearish, with rallies best viewed as pullbacks within a broader downtrend.

SECRET PARTNERSHIP BONUS for CryptoPotato readers: Use this link to register and unlock $1,500 in exclusive BingX Exchange rewards (limited time offer).
Disclaimer: Information found on CryptoPotato is those of writers quoted. It does not represent the opinions of CryptoPotato on whether to buy, sell, or hold any investments. You are advised to conduct your own research before making any investment decisions. Use provided information at your own risk. See Disclaimer for more information.


Meanwhile, XRP continues to be the poorest performing altcoin today.
Bitcoin has officially wiped out all gains registered after the reelection of Donald Trump to step back in the White House at the end of 2024. The cryptocurrency plummeted to just over $65,000 minutes ago, which actually puts it in a minor loss since the presidential elections.
Moreover, this means that it has lost almost $25,000 since last Wednesday. It has also shed nearly 50% of its value since the all-time high marked in early October 2025.
Naturally, investors tend to ask themselves what the most probable reason is behind this crash. As with all previous declines from the past several weeks, it doesn’t seem to be aligned with problematic fundamentals within the BTC ecosystem as a whole.
Analysts from the Kobeissi Letter indicated that the actual reason behind the consecutive price dumps is “emotional” selling. Riskier assets, such as BTC, tend to move frequently due to investor sentiment, and the current bearish trend appears to be driven by a mass exodus without any fundamental basis.
BREAKING: Bitcoin falls below $66,000 for the first time since October 2024, now down -$11,000 this week alone.
This is beginning to feel like “emotional” selling. pic.twitter.com/SMUczlcNzo
— The Kobeissi Letter (@KobeissiLetter) February 5, 2026
Doctor Profit, an analyst known for their rather bearish calls who has been predicting a substantial crash for months, noted that they have placed “big buy” orders at around $57,000-$60,000, which could be the current trend’s bottom.
The analyst added that they plan to hold for 2-3 months, and they are not interested in buying higher than that.
You may also like:
“I consider $57k-$60k as a great entry to make money for the short term and gain some serious % before we continue going down.”
On the other hand, MMCrypto said he believes BTC is indeed in a bear market, but it’s almost over time-wise.
I think this Bitcoin Bear Market is almost over (time wise).
We are in the last capitulation move, which may continue for a bit. Once we have MAX PAIN, it’s over, soon!
I am getting ready NOW already.
MONEY MAKING TIME IS APPROACHING! 🚀
— MMCrypto (@MMCrypto) February 4, 2026
Elsewhere, the altcoins are getting obliterated as well, and XRP is the poorest performer for some reason. The token has plummeted by almost 20% in just 24 hours and now struggles below $1.25.
SECRET PARTNERSHIP BONUS for CryptoPotato readers: Use this link to register and unlock $1,500 in exclusive BingX Exchange rewards (limited time offer).


The question now is whether a price dump below $1.00 is inevitable at this point.
The past 24 hours, just like several other such periods in the past few weeks, will go down in the history books as highly volatile and violent for the entire cryptocurrency market.
Although BTC and most altcoins are deep in the red, XRP has emerged as the worst-performing coin from the top 100 digital assets, which is somewhat strange and unexpected since it’s the third-largest altcoin.
The token has plunged by almost 22% in a day, a pattern more commonly seen in small caps. However, XRP’s demise is spectacular on different timeframes, not just daily.
For instance, it has plunged by 32% in the past week. Furthermore, it traded at $2.40 on January 6, meaning that its current dump to $1.20 came after a 50% monthly decline. On a more macro scale, the cross-border token has erased 67% of its value since its all-time high of $3.65 registered in mid-July 2025.
At the time of this writing, it’s not clear why XRP has crashed so much harder than most other larger-cap cryptocurrencies. After all, the company behind it continues to expand and make major announcements. However, ETH, BNB, and BTC are down by more modest 10-11%.
Nevertheless, some members of the XRP Army remain unfazed by the ongoing crash. ERGAG CRYPTO, who is among the most vocal supporters of Ripple’s token, admitted that the asset’s breakdown has been confirmed.
Still, they told their 92,000+ followers on X that they “pulled the trigger after 3 years” by buying XRP at $1.28 as a swing trade. On the plus side, they plan to hold that position until the price bounces to $2.20 if it reclaims $1.85. If the $1.28 suppor cracks decisively, they are comfortable holding the tokens as it’s a small allocation.
You may also like:
#XRP – Sweep & Bounce or Breakdown (Update):
The breakdown is now confirmed.
I pulled the trigger after 3 years: I bought #XRP $1.28 as a swing trade.
My plan:
▫️ If price reclaims $1.85, I’ll hold for a move toward $2.20
▫️ A confirmed close above $2.50 → reassess the… pic.twitter.com/2O5inqQlSo— EGRAG CRYPTO (@egragcrypto) February 5, 2026
SECRET PARTNERSHIP BONUS for CryptoPotato readers: Use this link to register and unlock $1,500 in exclusive BingX Exchange rewards (limited time offer).
Bitcoin plunged under $66,000 while most altcoins cratered.
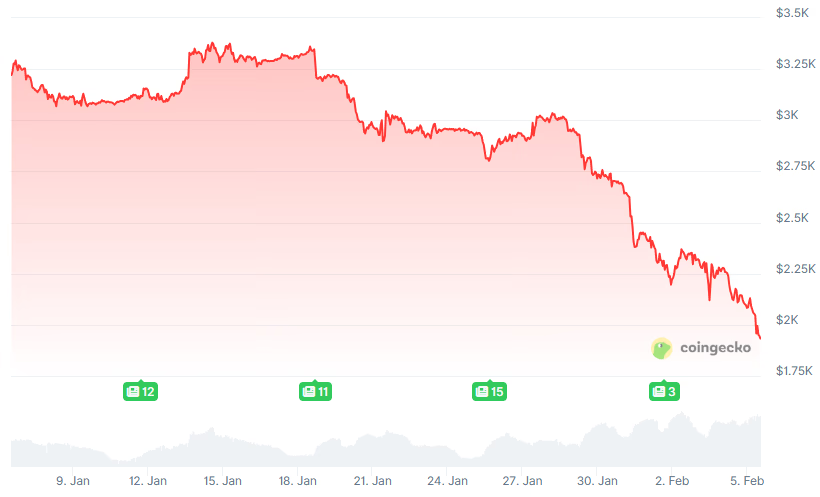
Ethereum (ETH) traded under $2,000 on Thursday, Feb. 5, for the first time since May 2025, amid a broader sell-off across crypto markets.
ETH fell about 10% over the past 24 hours to trade near $1,925, extending its weekly losses to 30%. Paul Howard, senior director at Wincent, said Ethereum’s move lower was driven by a broader shift away from risk in global markets, rather than a crypto-specific event.

“The defining characteristic of the sell-off was a synchronised de-risking across asset classes, marked by forced unwinds and elevated volatility even in assets typically viewed as hedges, including precious metals,” he said.
Howard also explained that the shift’s catalyst was the markets “rapidly repricing the outlook for monetary policy” following the nomination of Kevin Warsh as Federal Reserve chair.
Meanwhile, data from Lookonchain showed that Ethereum co-founder Vitalik Buterin has sold 2,961.5 ETH (around $6.6 million) at an average price of $2,228 over the past three days.
Bitcoin and Altcoins
Bitcoin (BTC) dropped roughly 10% on the day to around $65,700, extending its seven-day losses to nearly 21%. Among other major tokens, BNB slid 9% to $646, while XRP plunged nearly 20% to about $1.24. Solana (SOL) fell 12% on the day to trade near $82.
“Bitcoin is now testing key technical support between $60,000 and $70,000, the base of the pre-election rally. A sustained break below this range would increase the risk of a more protracted move lower, while stabilization here would point to a corrective reset rather than a structural shift,” Diana Pires, VP at sFOX, told The Defiant.
Total cryptocurrency market capitalization declined to approximately $2.33 trillion, down about 10% over the past 24 hours. Trading activity during the same period totaled roughly $259.5 billion.
A small number of tokens traded higher despite the broader downturn. Rain (RAIN) rose about 7% over the past 24 hours, while MYX Finance (MYX) gained 5.4%. MemeCore (M) added 1.6%.
On the downside, XRP fell more than 16%, while Zcash (ZEC) dropped 15.4%. Monero (XMR) slid nearly 14%.
Liquidations and ETF flows
More than $1.44 billion in leveraged positions were liquidated over the past 24 hours, according to CoinGlass, with long positions accounting for roughly $1.23 billion of that total.
Bitcoin recorded the largest liquidations at about $738 million, followed by Ethereum at $338 million. Solana posted liquidations of around $77 million. In total, more than 304,000 traders were liquidated on the day.
Spot Bitcoin ETFs recorded $544.9 million in net outflows on Feb. 4, while Ethereum ETFs saw $79.5 million in net outflows. Spot Solana ETFs recorded $6.7 million in net outflows. By contrast, spot XRP ETFs posted $4.8 million in net inflows.
Tech Selloff Continues
Elsewhere, political developments are also weighing on digital assets, driven by uncertainty in Washington as lawmakers continue to negotiate key budget and immigration measures.
Weakness in U.S. tech stocks has also placed pressure on the situation, contributing to a broader pullback across global markets.
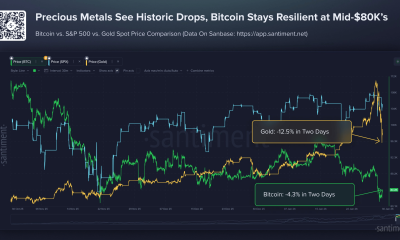
Meanwhile, gold prices have fallen 1.3% on the day, while silver dropped more than 9%, after hitting all-time highs recently.
The Trump family’s DeFi protocol was forced to sell $5 million of BTC today to cover an Aave loan.
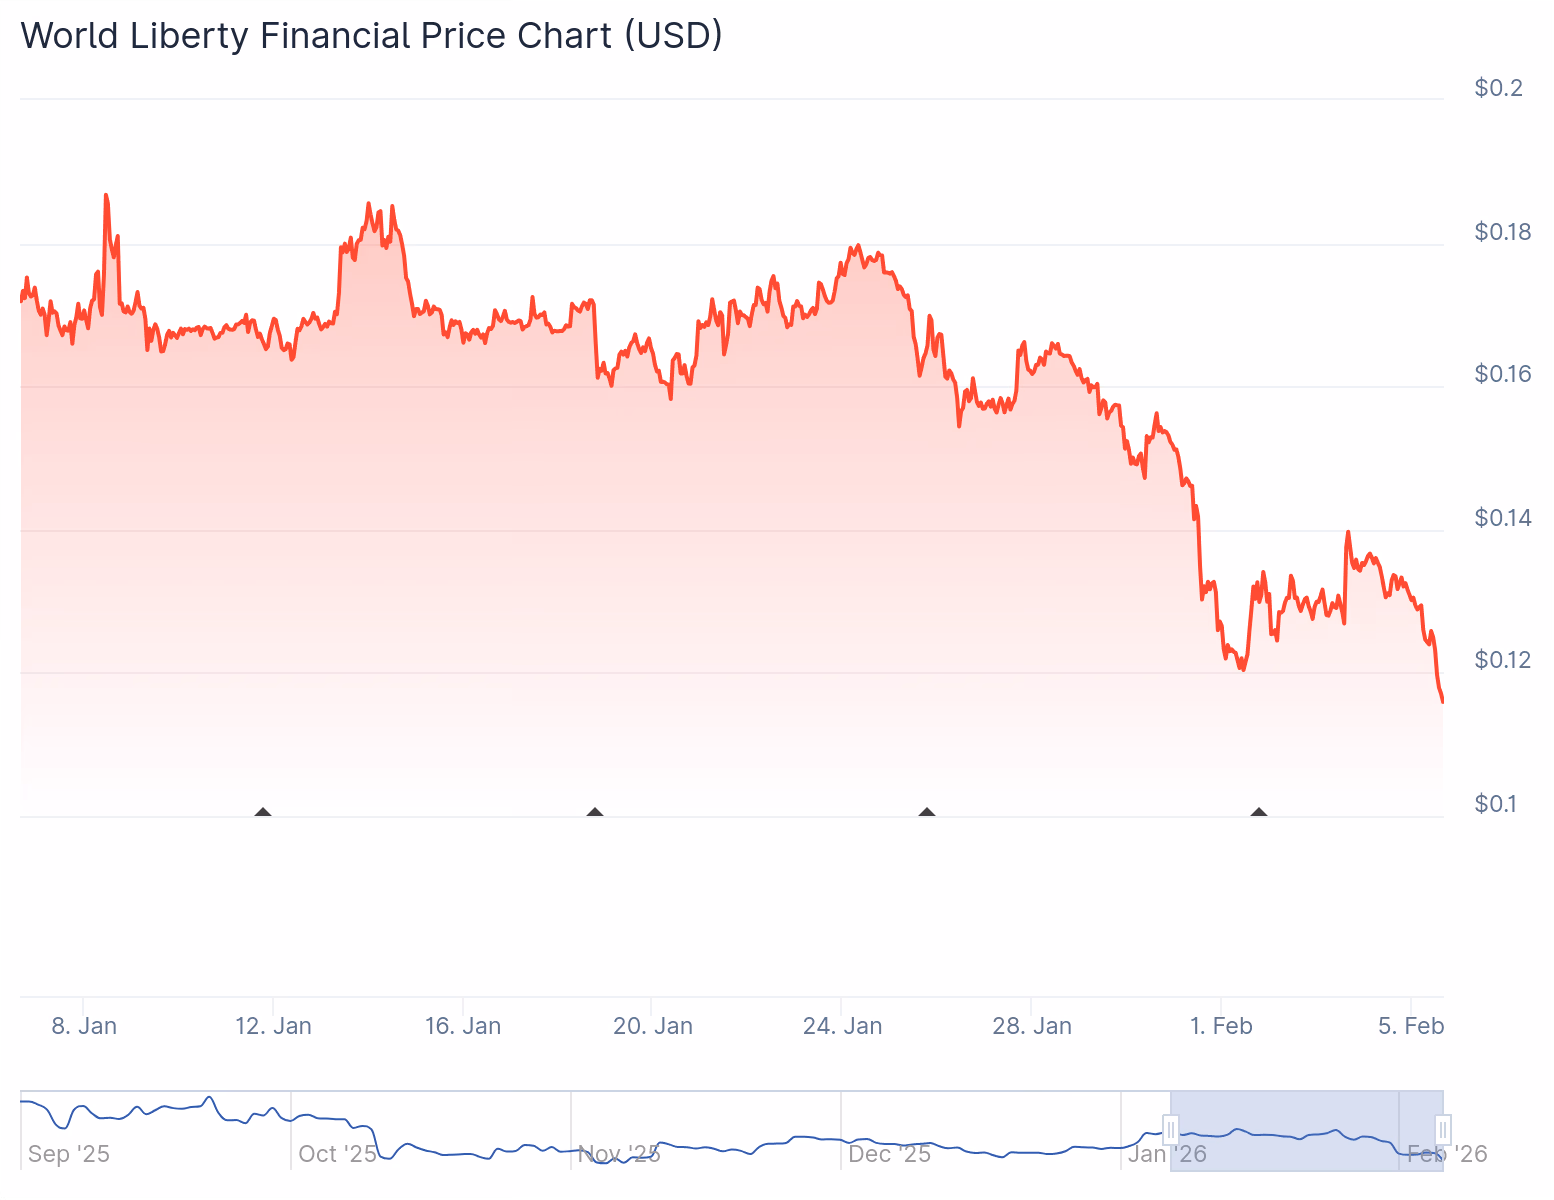
World Liberty Financial (WLFI), the decentralized finance (DeFi) protocol affiliated with President Trump’s sons, was forced to sell some Bitcoin at roughly $67,000 today to avoid liquidation on Aave.
According to Arkham Intelligence, the WLFI wallet was forced to liquidate more than 170 BTC, worth roughly $11 million, to repay its loans on Aave.
Meanwhile, the WLFI token is down 14% today, slightly underperforming BTC and ETH, which are both down 13%.

WLFI has been in a consistent downtrend since its token launch in September. The token started trading on Sept. 1 at $0.23, or a $6.6 billion market capitalization, and now trades 65% lower at $0.115.
In addition to the protocol’s financial woes, Trump’s political opponents continue to call for probes and investigations into the DeFi protocol.
Today, U.S. Representative Ro Khanna announced that he has launched an investigation into a $500 million investment in WLFI from the United Arab Emirates. Back in November, Senators Elizabeth Warren and Jack Reed claimed that the protocol is tied to malicious actors from North Korea and Russia; however, it remains unclear if there has been any progress on this probe.
Warren, in particular, is no fan of cryptocurrency, broadly referring to DeFi users as “scammers” and labeling the GENIUS bill as a “grift.”
Bitcoin touched new lows under $64,000 as market selling reached a historic level, and analysts warn that the bottom is not in. Does data support analysts’ sub-$60,000 prediction?
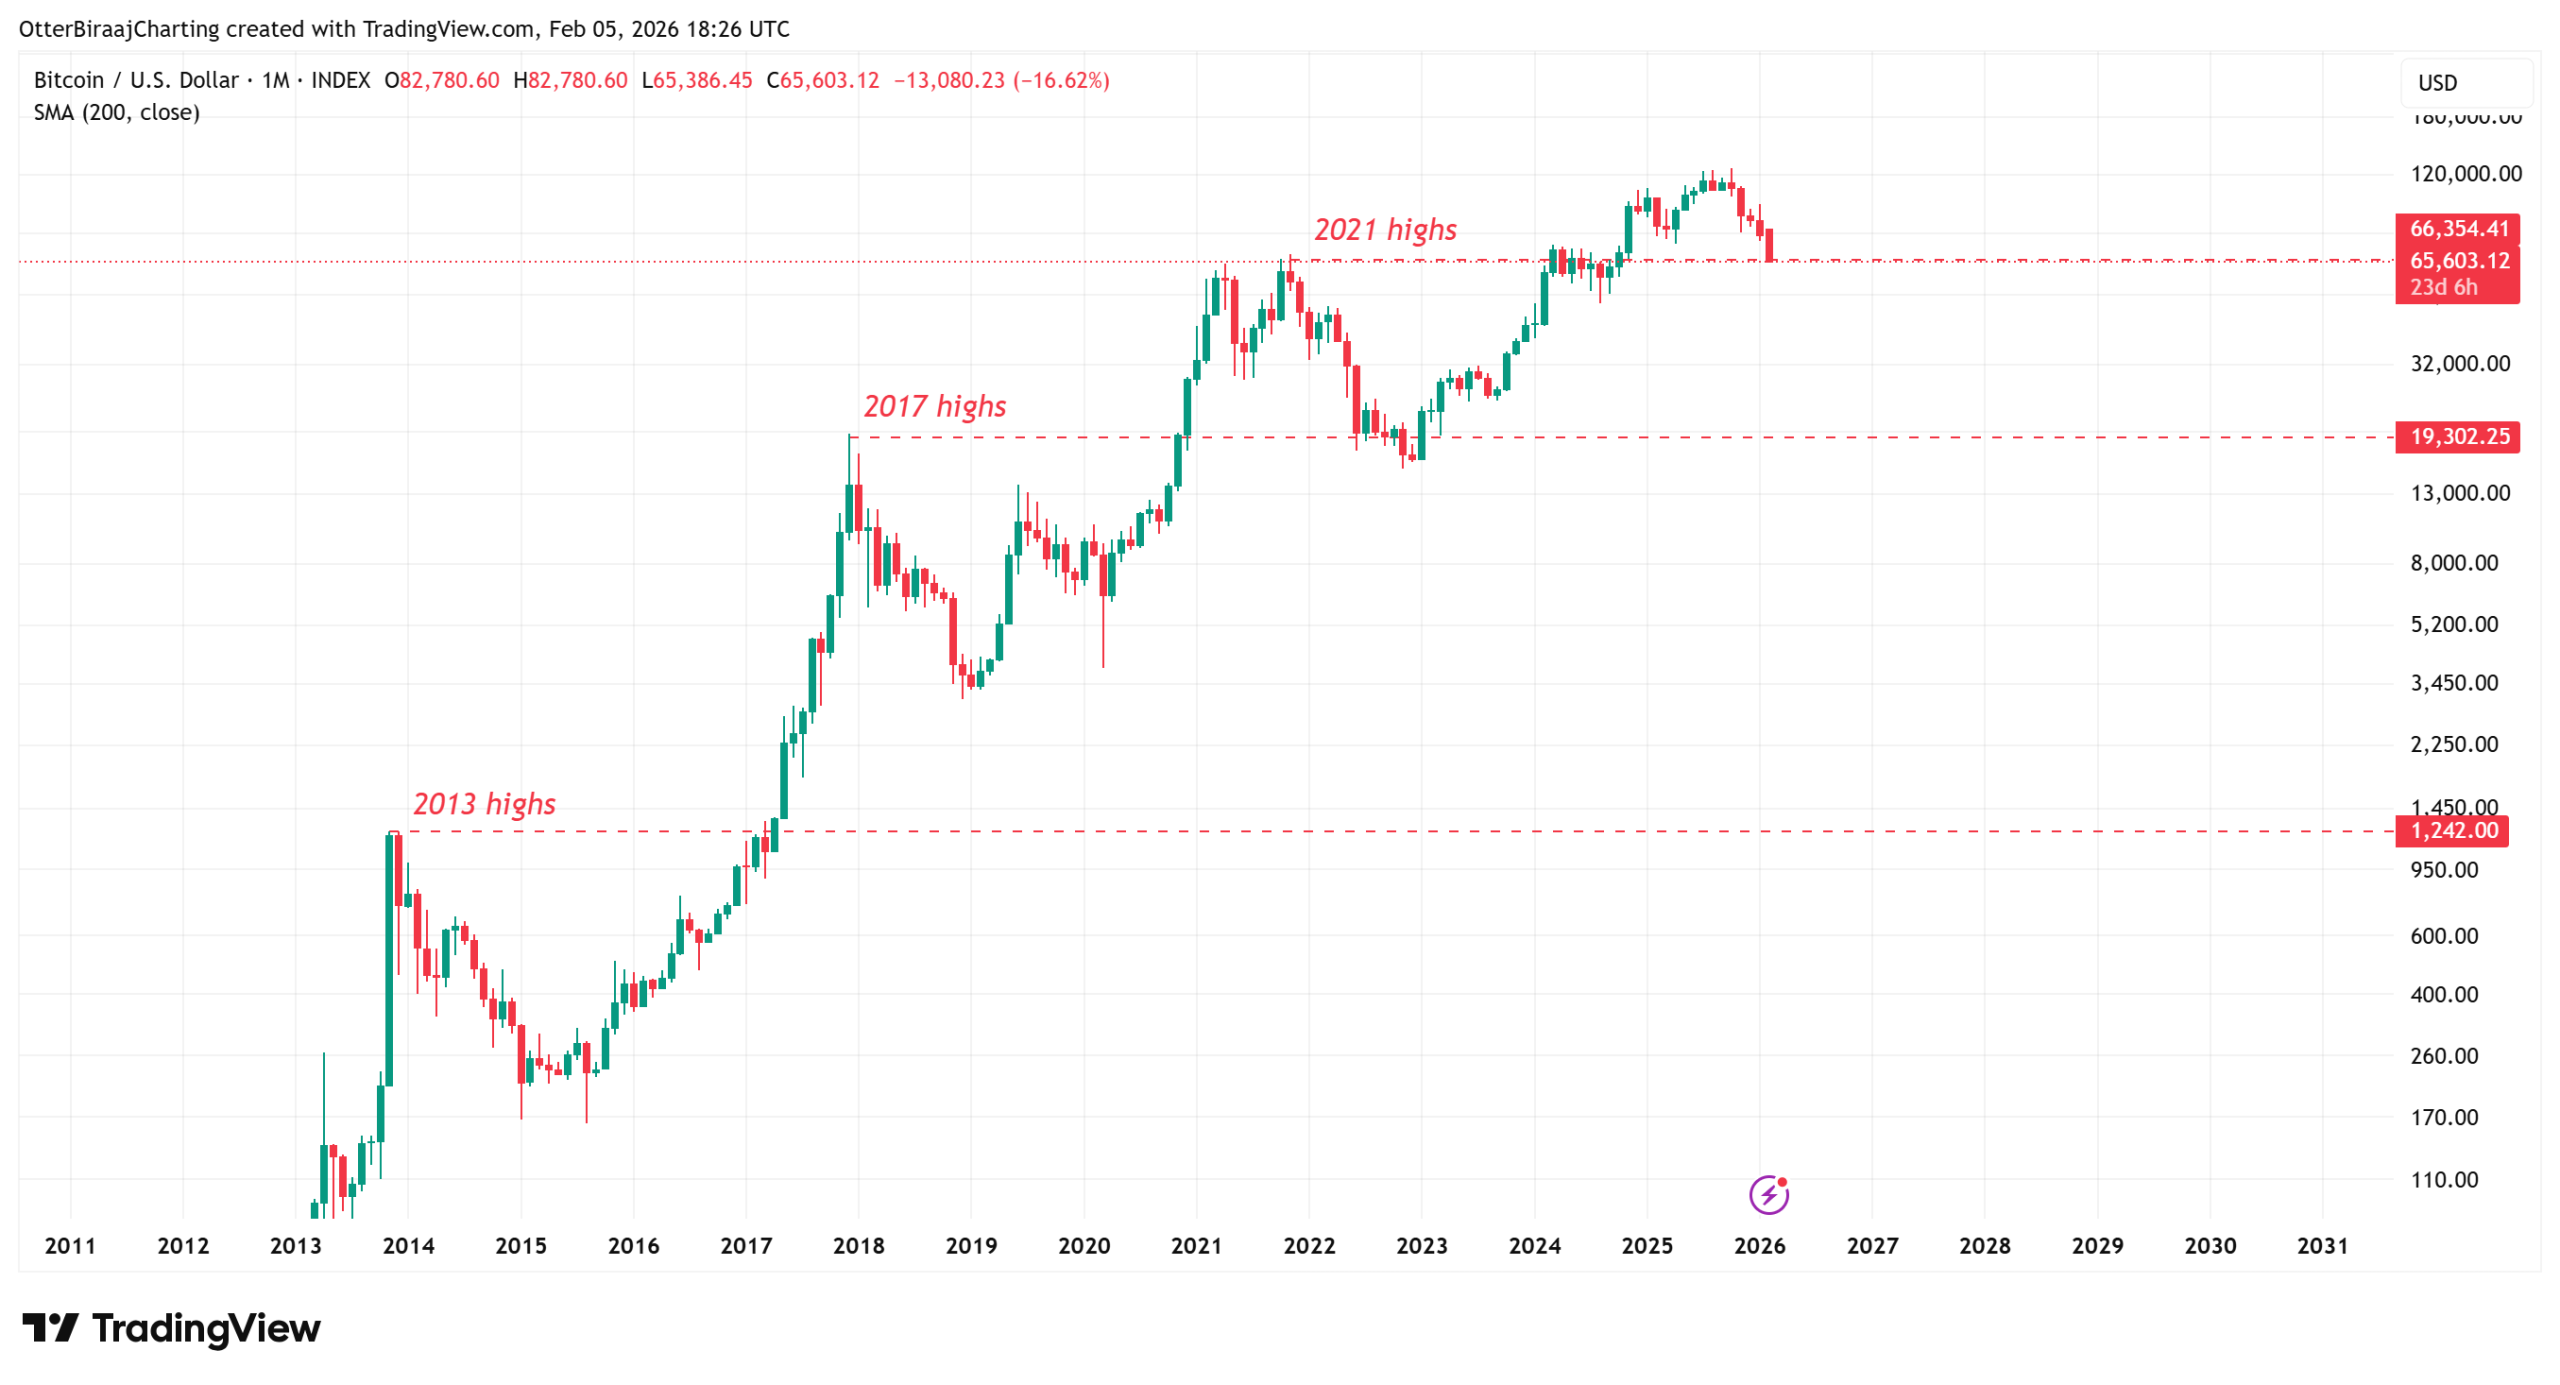
Bitcoin (BTC) has fallen 13% over the past four days, sliding to $63,844 from $79,300. It is currently trading below $69,000, which is the 2021 bull market high, a level many see as a support level.
The drop was matched by a sharp decline in futures activity, with BTC’s open interest falling by more than $10 billion over the past seven days.
Analysts are now focusing on the long-term technical zones and onchain indicators that may signal a major turning point for BTC.
Key takeaways:
-
Bitcoin has dropped 13% in four days, slipping below the 2021 cycle high near $69,000 after a sharp leverage reset.
-
A key Bitcoin demand zone from $58,000 to $69,000 is supported by heavy transaction volume and the 200-week moving average.
-
Oversold technical and sentiment indicators suggest downside pressure may be peaking for BTC, even if a relief rally fails to manifest.
Why the $69,000 level matters for Bitcoin
The $69,000 level represents the peak of the 2021 bull market. Prior cycle tops have historically acted as support during bear markets. In the last cycle, Bitcoin bottomed near the 2017 high of $19,600 before briefly dipping lower to about $16,000 in November 2022.

The current drop below $69,000 may follow this pattern. However, past cycles also show that prices can fall below prior highs before forming a final bottom. This keeps downside risk open for BTC.
Bitwise European Head of Research André Dragosch noted that a large share of recent transactions occurred between $58,000 and $69,000. This range also aligns with the 200-weekly moving average near $58,000, reinforcing it as a key demand zone.

Meanwhile, crypto analyst exitpump highlighted that large BTC bids are visible on order books between $68,000 and $65,000, suggesting buyer interest on dips.
Related: Bitcoin price may drop below $64K as veteran raises ‘campaign selling’ alarm
BTC flashes record oversold signals
Market analyst Subu Trade said that Bitcoin’s weekly relative strength index (RSI) has fallen below 30. Bitcoin has reached this level only four times, and in each case, the price rallied by an average of 16% over the next four days.

Crypto analyst MorenoDV also noted that the adjusted net unrealized profit/loss (aNUPL) has also turned negative for the first time since 2023. This means the average holder is now at a loss. Similar conditions in 2018–2019, 2020 and 2022–2023 all led to price recoveries for BTC.
While a relief rally might not take shape immediately, Moreno pointed out that the current “speed of sentiment deterioration” is much faster than the previous cycles. The analyst added,
“This rapid transition suggests an acute sentiment reset rather than a gradual decline, potentially shortening the capitulation phase.”

Related: Three signs that Bitcoin price could be near ‘full capitulation’
This article does not contain investment advice or recommendations. Every investment and trading move involves risk, and readers should conduct their own research when making a decision. While we strive to provide accurate and timely information, Cointelegraph does not guarantee the accuracy, completeness, or reliability of any information in this article. This article may contain forward-looking statements that are subject to risks and uncertainties. Cointelegraph will not be liable for any loss or damage arising from your reliance on this information.

ETHZilla plans to tokenize the loan portfolio into a cash-flow-generating manufactured home loan token.
ETHZilla has announced its acquisition of a portfolio comprising 95 manufactured and modular home loans valued at approximately $4.7 million, with plans to tokenize these assets on Ethereum Layer 2. This strategic move is aimed at enhancing transparency and accessibility in real estate finance.
The tokenization initiative will be executed through the Liquidity.io ecosystem, with the launch expected in late February or early March.
“Manufactured housing loans offer predictable cash flows and strong underlying collateral, which we believe makes them well suited for tokenization within a regulated, transparent structure,” said McAndrew Rudisill, CEO of ETHZilla.
ETHZilla’s strategy is designed to meet institutional compliance and reporting standards, crucial for the integration of real-world assets into blockchain systems.
The manufactured housing market is projected to grow significantly, from $45.82 billion in 2024 to $75.1 billion by 2035, driven by affordability and sustainability.
This article was generated with the assistance of AI workflows.
Crypto exchange Gemini announced its exit from the United Kingdom, European Union and Australia markets on Thursday, as the company slashed its workforce by 25%.
Gemini cited artificial intelligence automating labor and making engineers “100x” more efficient, and a more challenging business environment in the UK, EU and Australia, as reasons for the exit, according to Thursday’s announcement:
“These foreign markets have proven hard to win in for various reasons, and we find ourselves stretched thin with a level of organizational and operational complexity that drives our cost structure up and slows us down.
“We don’t have the demand in these regions to justify them. The reality is that America has the world’s greatest capital markets,” the announcement said.
The company will instead focus its resources on developing its prediction market platform, Gemini Predictions, which launched in December 2025, and building its business in the US.
The news comes at a challenging time for the crypto industry, as digital asset prices continue to bleed amid a broad market downturn that began with a flash crash in October and the stalling of the CLARITY Act, a widely anticipated US crypto market structure bill.
Related: SEC dismisses civil action against Gemini with prejudice
Gemini shifts focus to prediction markets as the sector grows
Gemini’s announcement highlighted the growing role of prediction markets in its strategy, which it says will be “more front-and-center” on its platform.
“Our thesis is that prediction markets will be as big or bigger than today’s capital markets,” the announcement said.
The company said it has recorded over 10,000 users on Gemini Predictions and $24 millon in trading volume since launch.
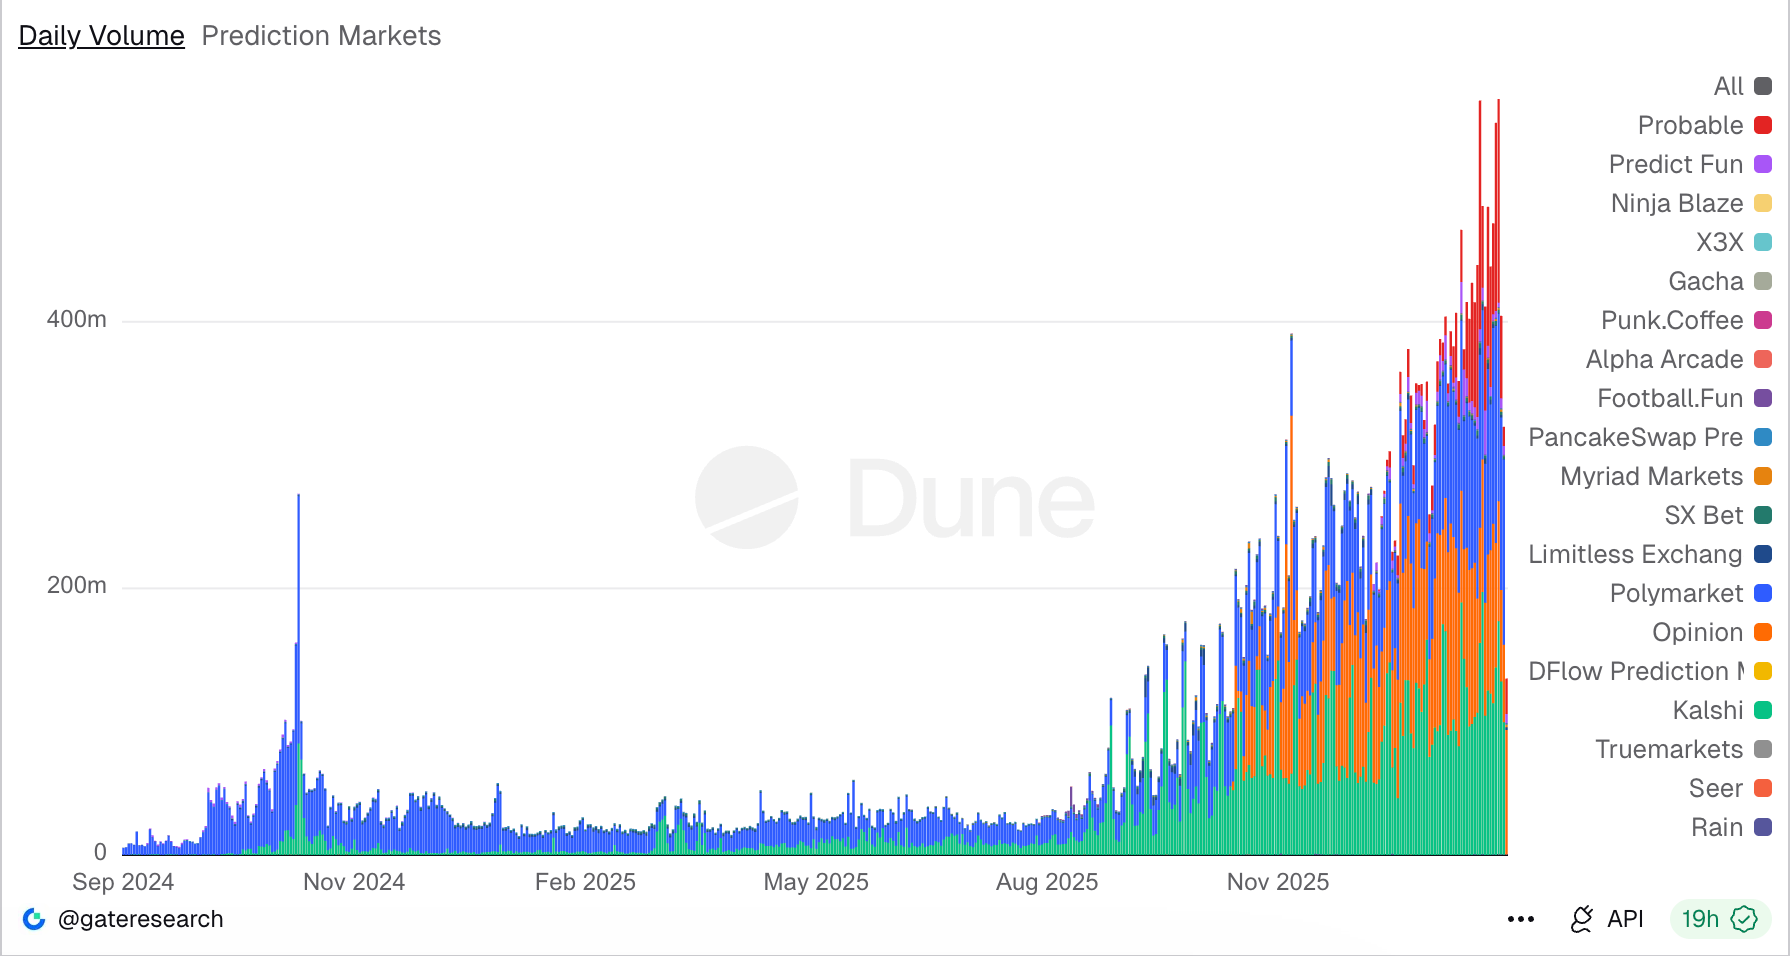
Prediction market trading volume surged in the third quarter of 2024 during the US presidential election, with a 565.4% quarter-on-quarter increase in total trading volume, reaching about $3.1 billion.

In January 2026, daily prediction market trading volume ranged from about $277 million to about $550 million, according to data from Dune.
The market remains dominated by Polymarket and Kalshi, with Polymarket accounting for over 37% of total prediction market 24-hour trading volume and Kalshi commanding over 26%, according to Dune.
Magazine: One metric shows crypto is now in a bear market: Carl ‘The Moon’
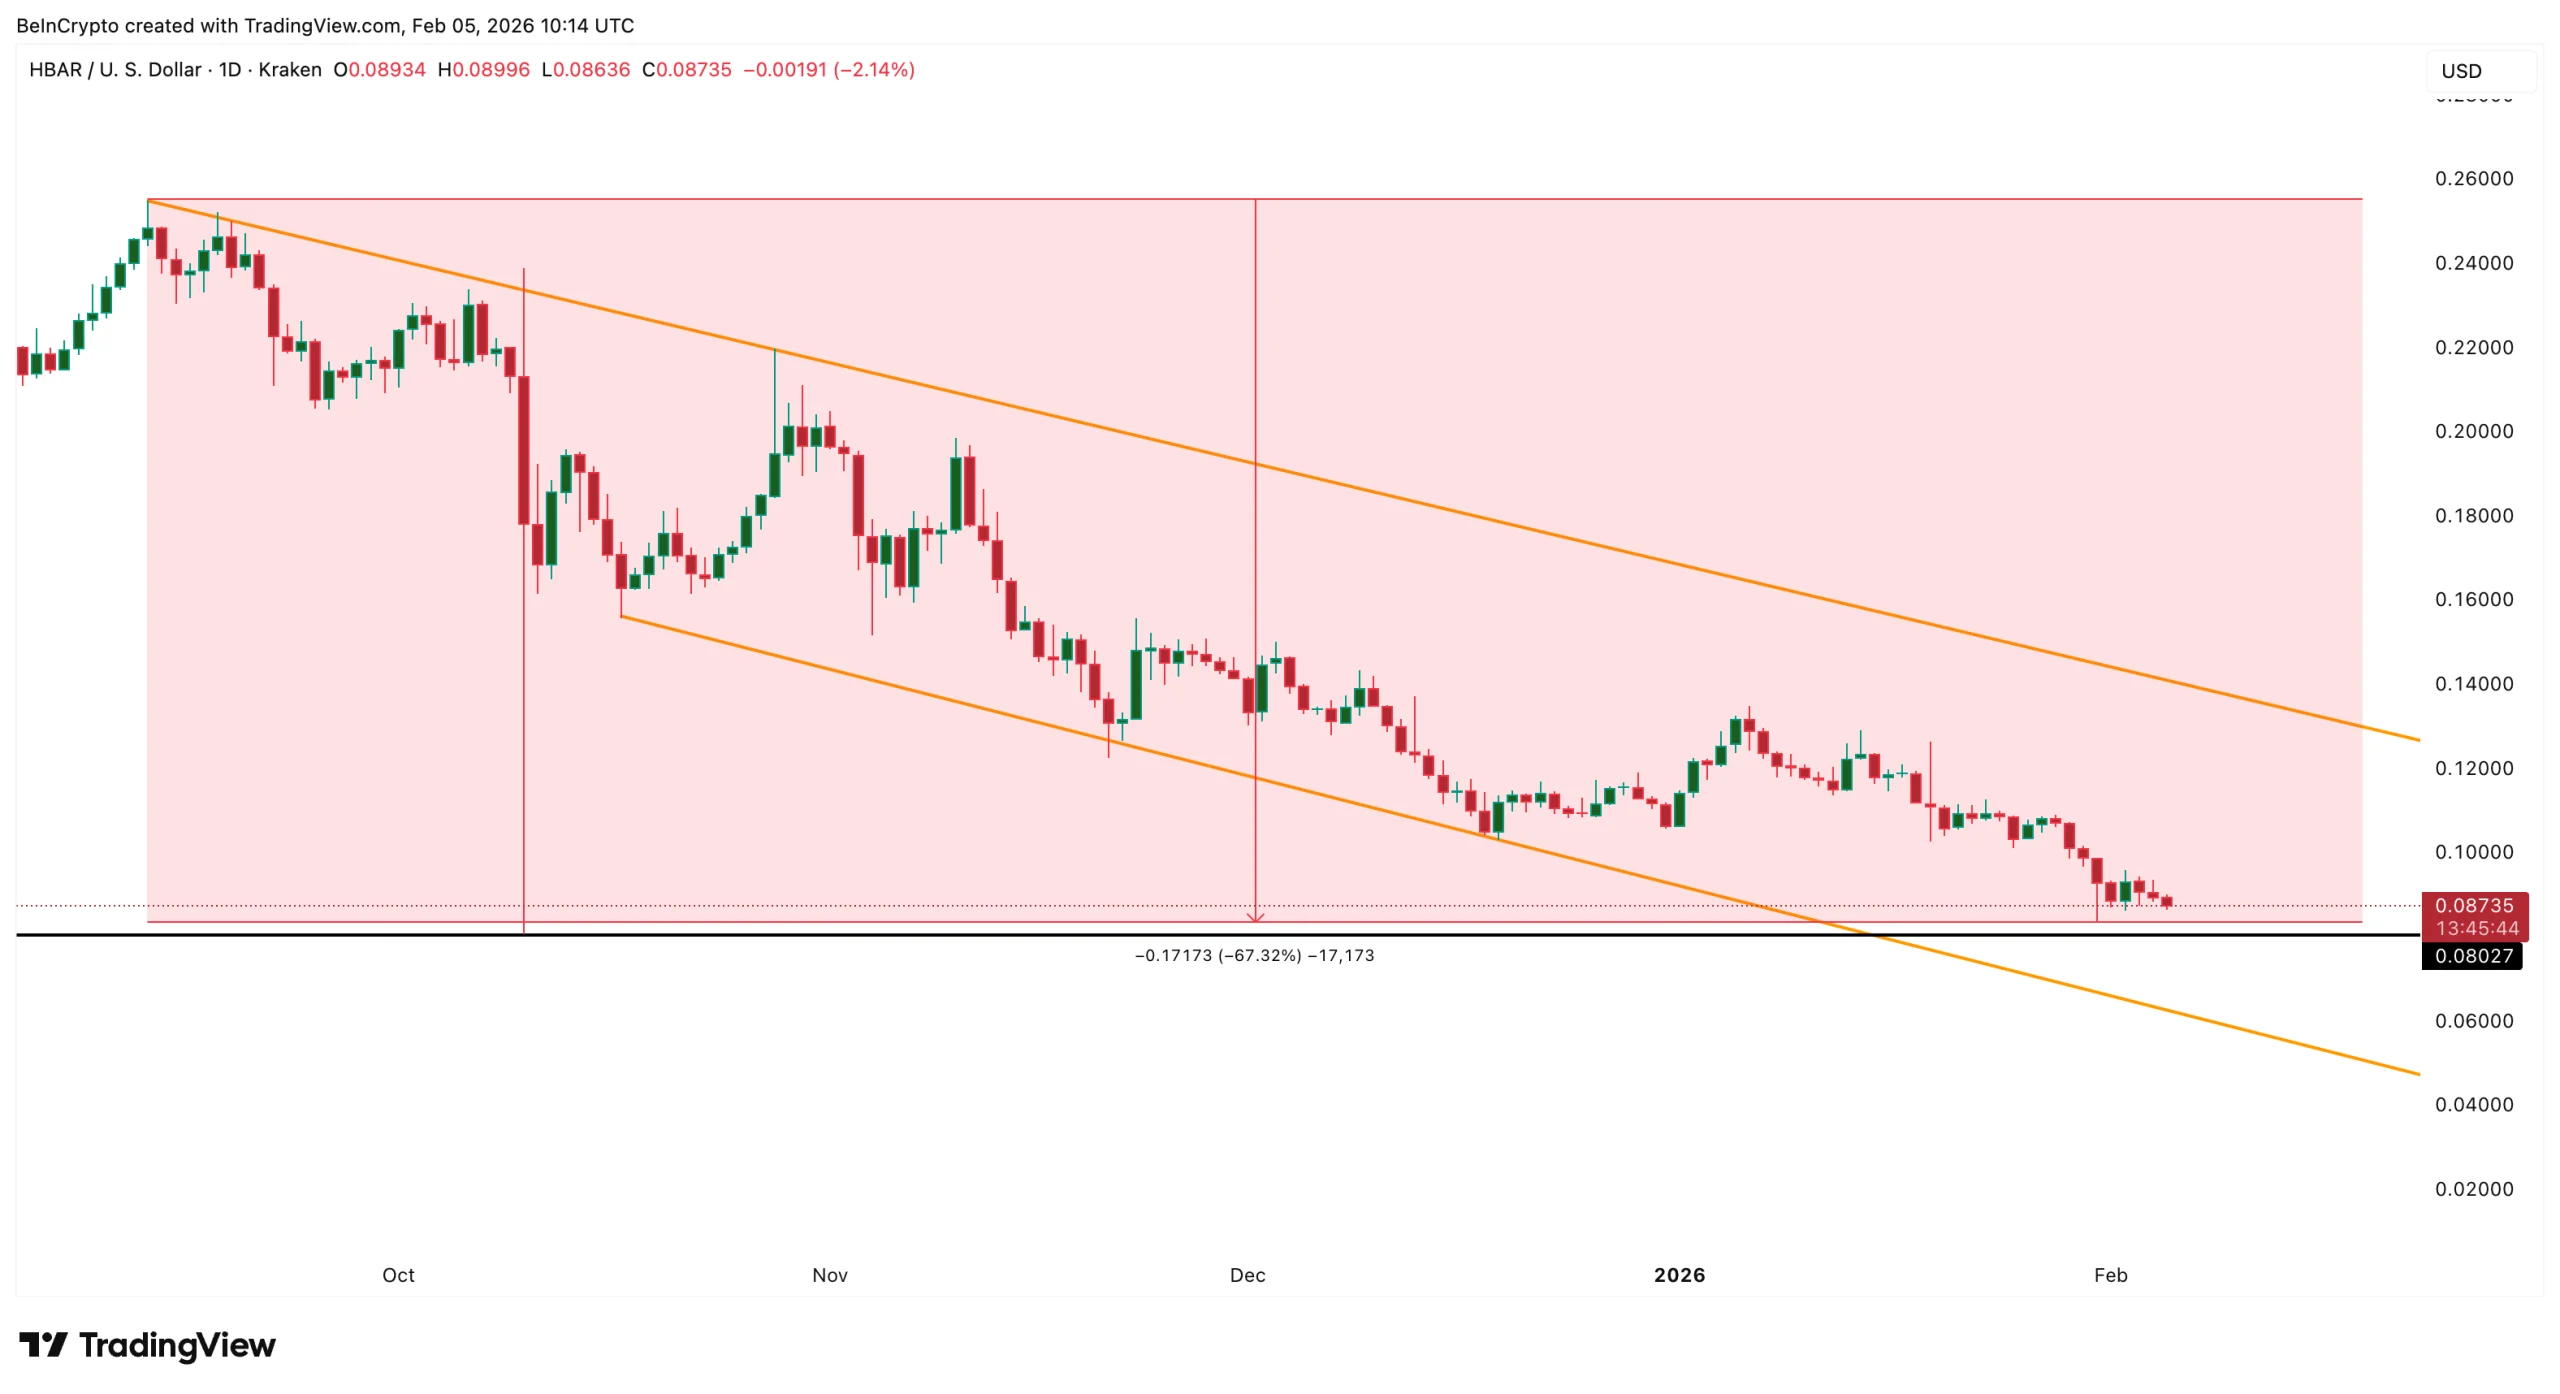
HBAR price remains under heavy pressure as the broader crypto market stays weak. The token is down nearly 47% over the past three months and has slipped another 6% in the past 24 hours, tracking Bitcoin’s latest decline. More importantly, this is not just a short-term sell-off. Hedera’s price has been falling steadily since September, losing almost 67% from its highs.
Behind this move is a deeper problem: shrinking network liquidity, weak institutional demand, and fading retail participation. As TVL continues to fall and ETF inflows remain absent, charts now suggest that HBAR could face another major downside leg. Here is what the data is showing.
Hedera’s TVL Collapse Shows Liquidity Has Been Leaving for Months
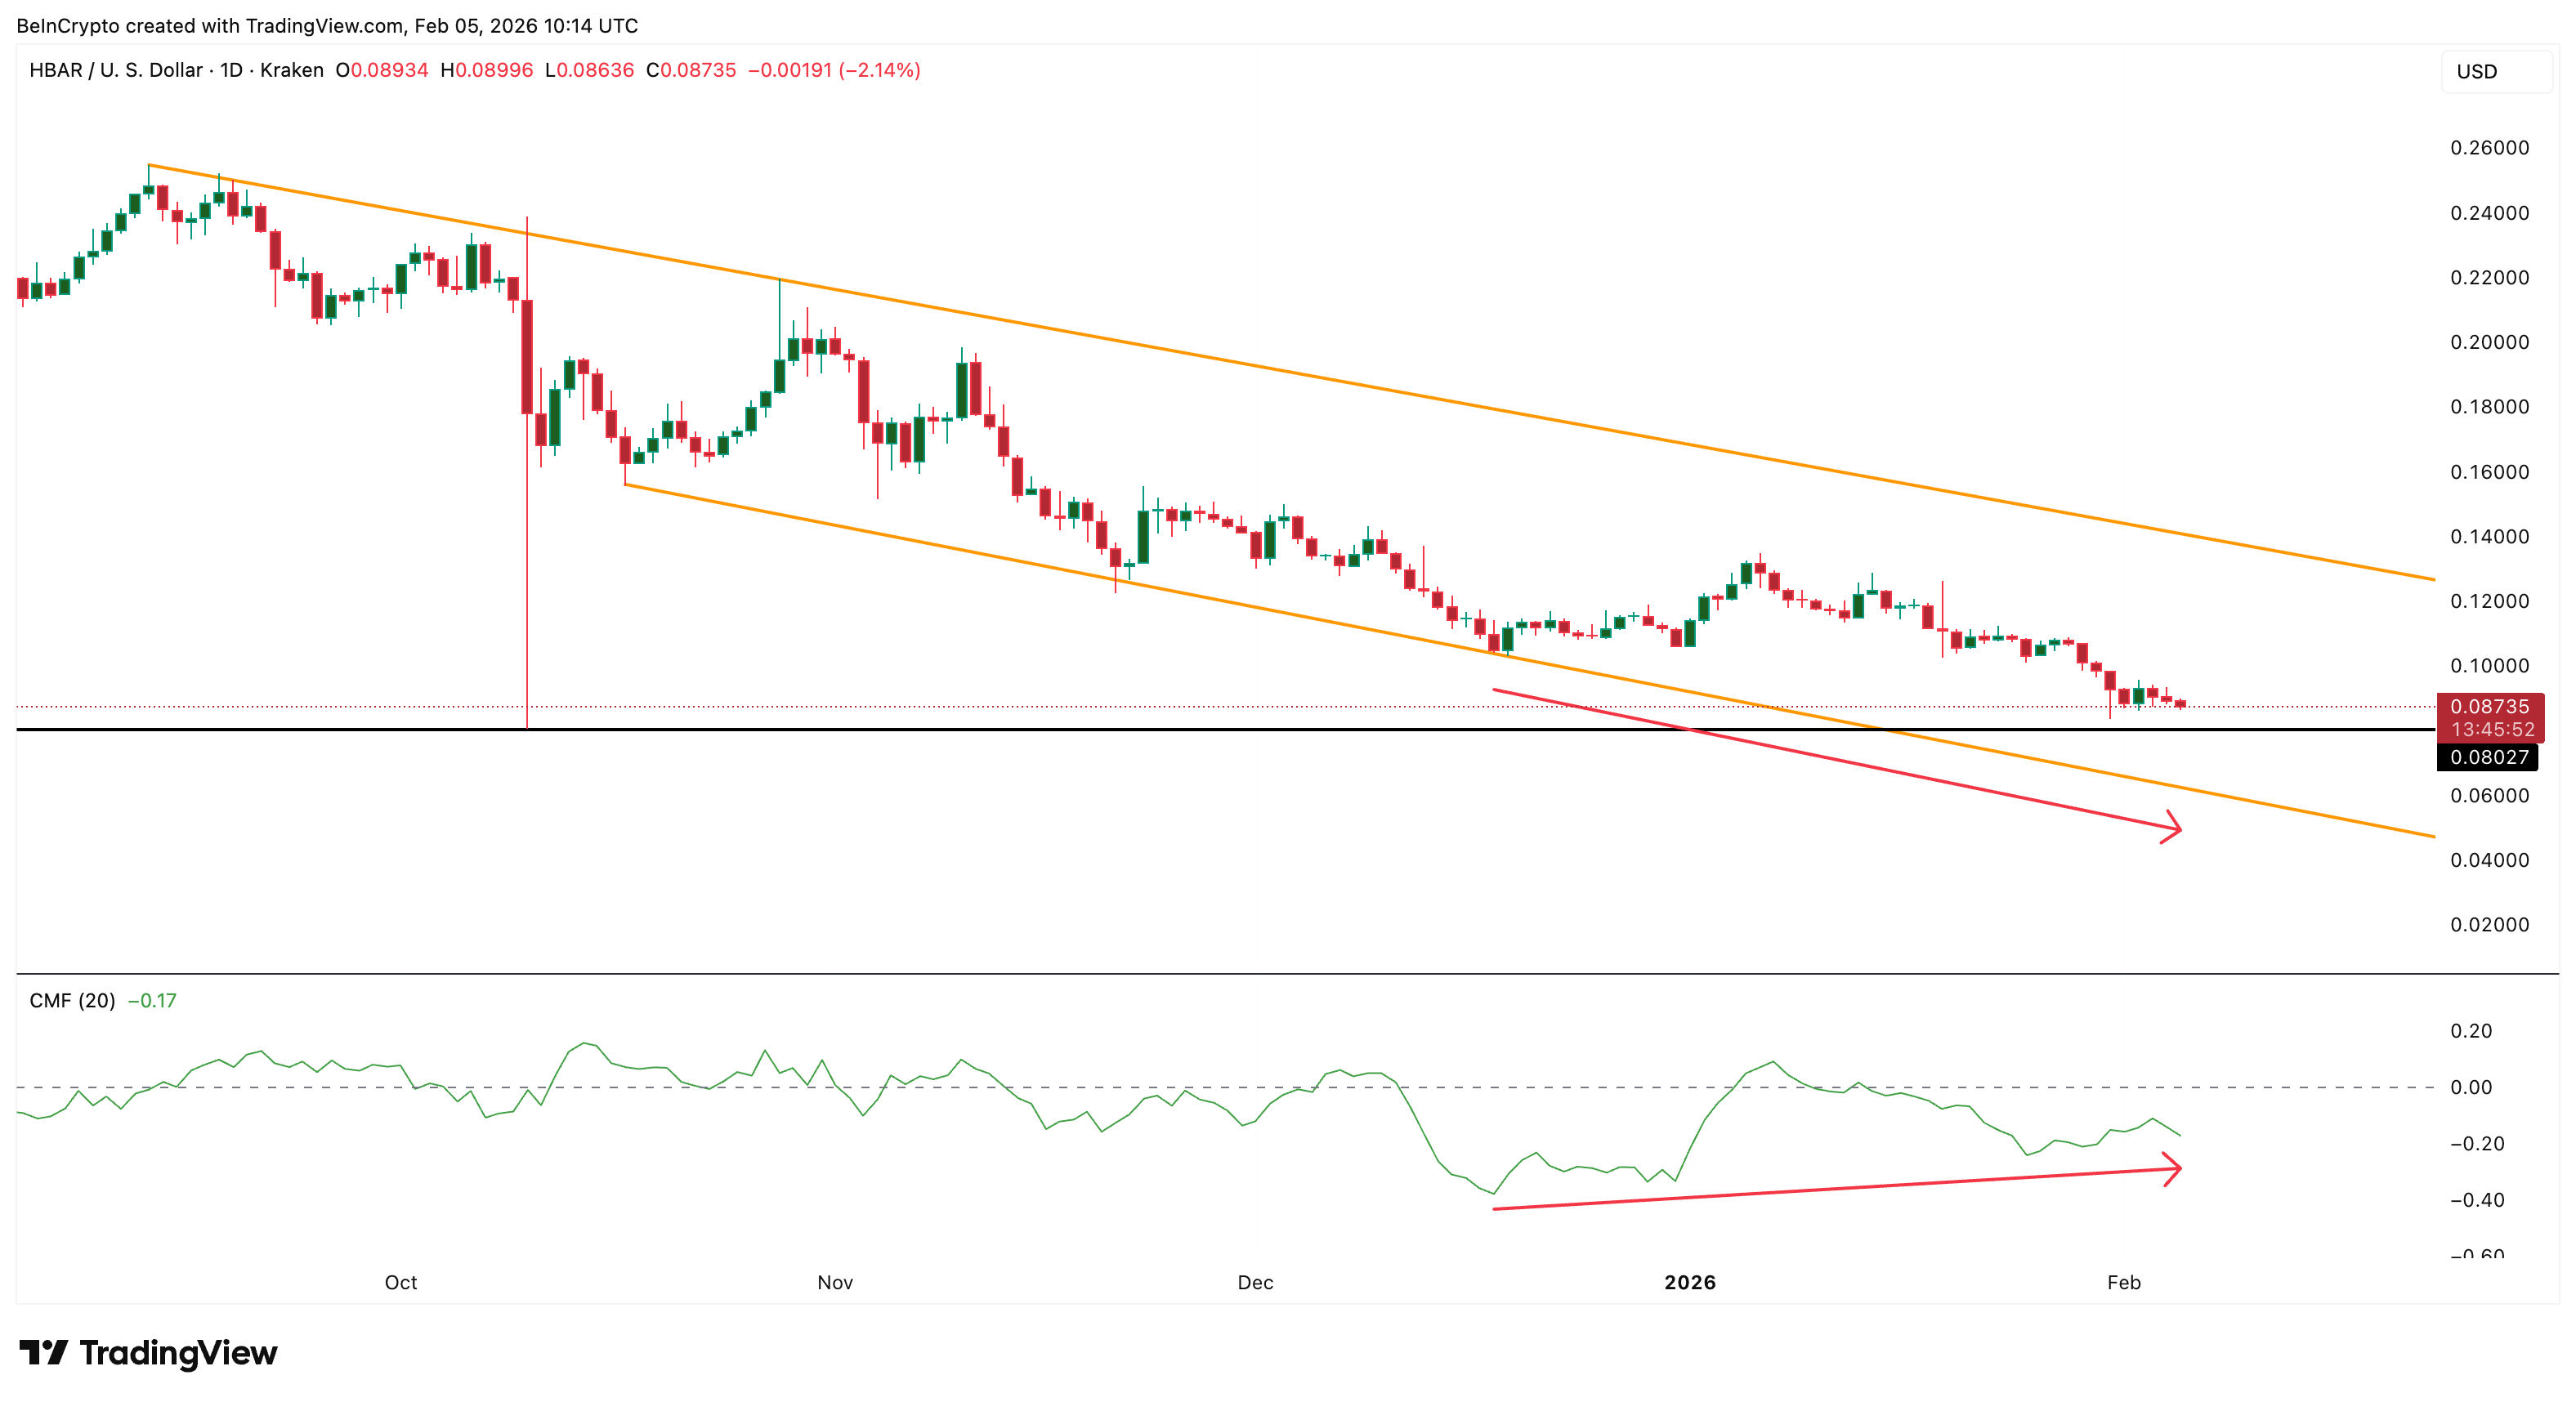
HBAR’s downtrend began in mid-September, when the price started trading against a falling trendline. Soon, the weakening prices entered a falling channel as lower highs met lower lows. Since then, every rally has been weaker, and each breakdown has pushed the token lower.
Sponsored
Sponsored
Want more token insights like this? Sign up for Editor Harsh Notariya’s Daily Crypto Newsletter here.
This HBAR price action mirrors what happened to Hedera’s on-chain liquidity.
Total value locked was near $122.5 million in September. It has now dropped to around $56 million, a decline of more than 50%. TVL measures how much capital is locked inside DeFi protocols. When TVL falls, it usually means users are withdrawing funds and activity is slowing.
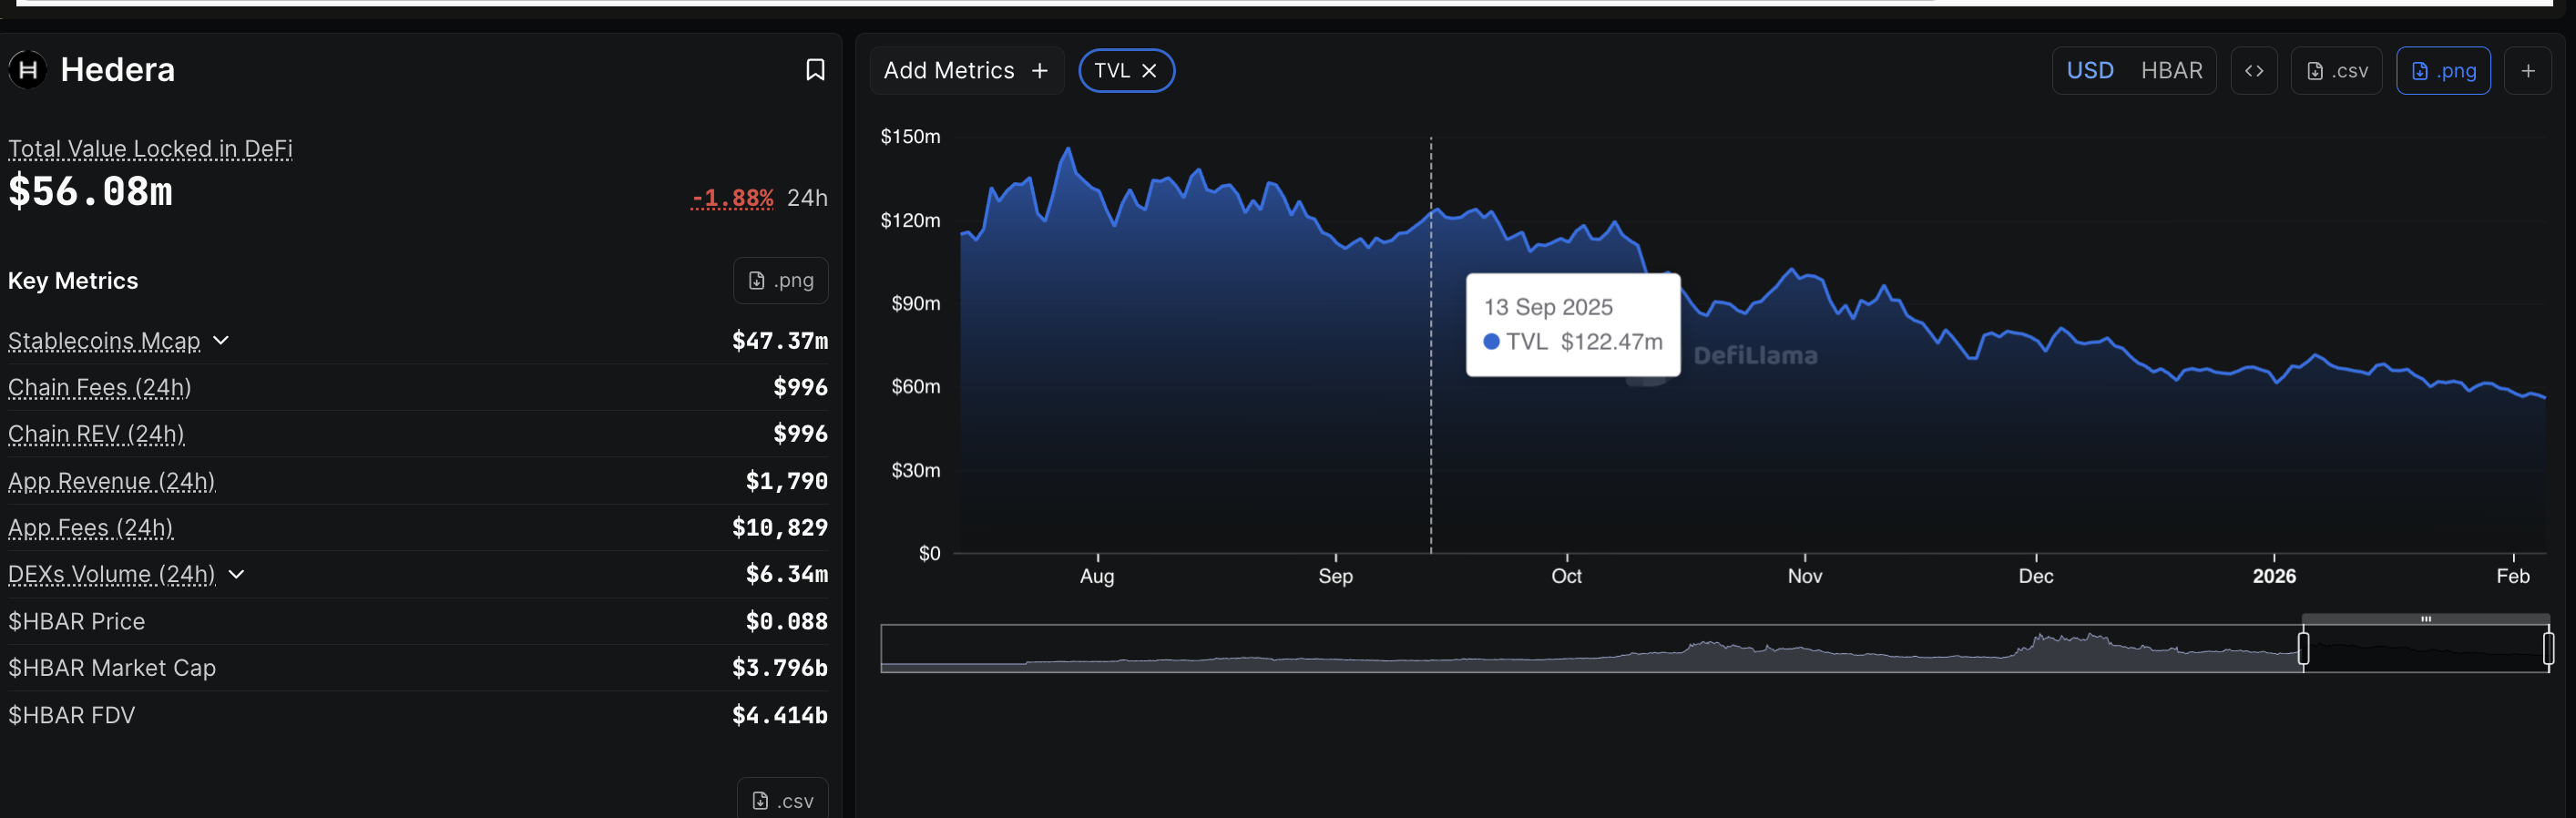
In simple terms, money started leaving the network months ago. The price just followed this fundamental weakness. This explains why HBAR’s decline looks gradual rather than sudden. Liquidity has been drying up steadily. Without fresh capital, rallies fail quickly.
As long as TVL stays weak, HBAR’s upside remains structurally limited.
Sponsored
Sponsored
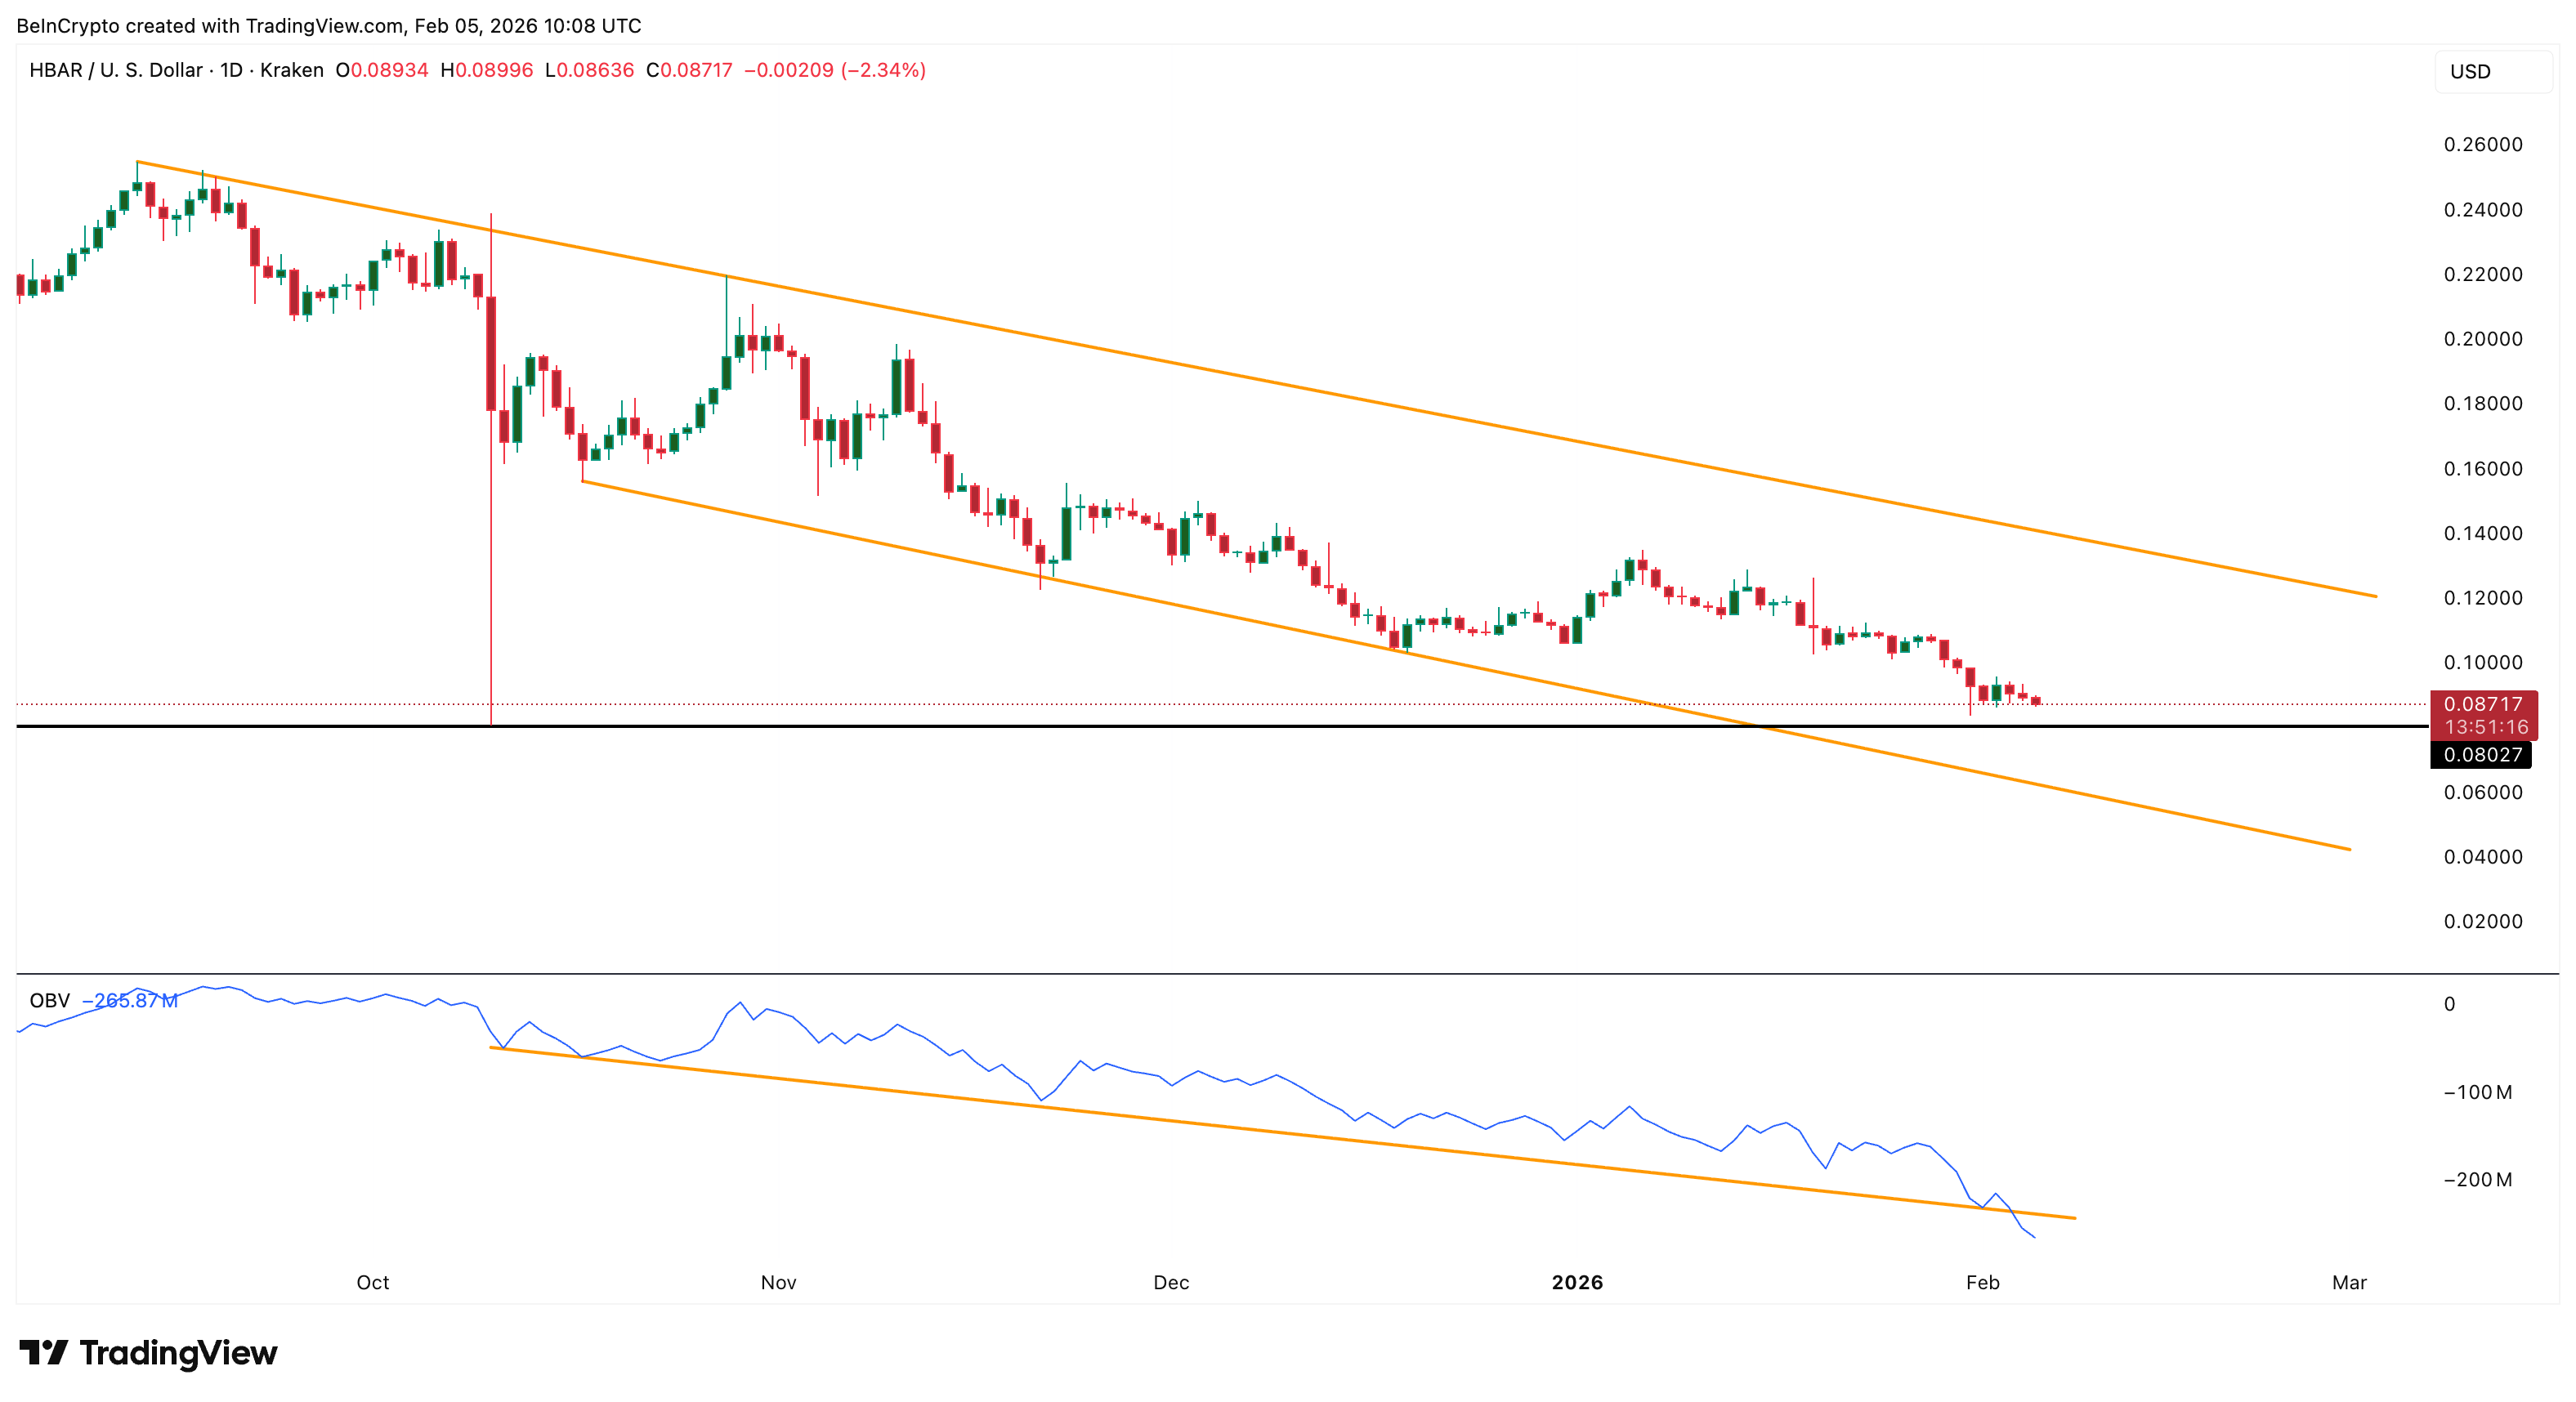
CMF Shows Selective Buying, But ETF and Retail Demand Remain Weak
Not all signals are bearish.
The Chaikin Money Flow has been rising since mid-December, even as the price moved lower. This creates a bullish divergence, showing that some larger investors are accumulating. However, CMF is still below zero. Outflows still dominate. Inflows are improving, but not strongly enough.
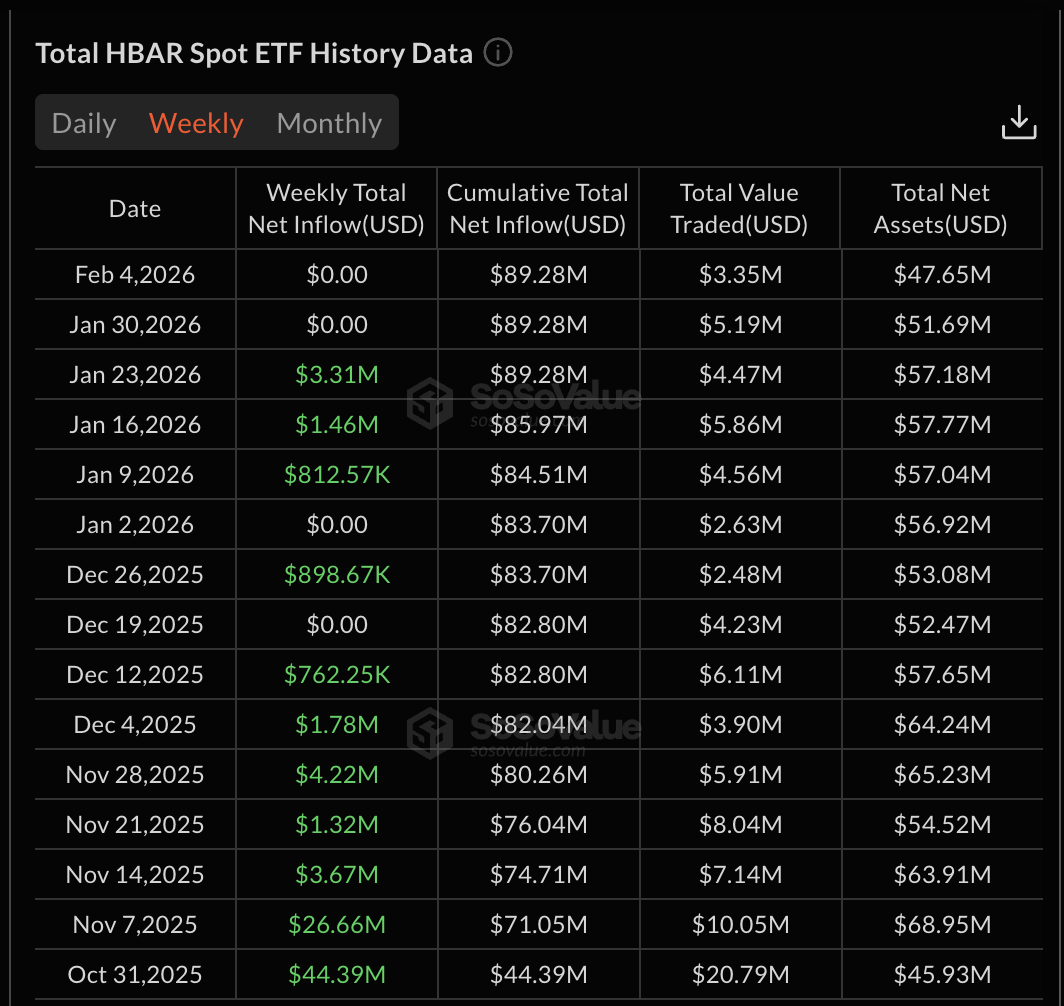
At the same time, spot HBAR ETFs have shown no recent inflows over the past two weeks. ETFs bring institutional capital and could help CMF move above the zero line. Their absence limits upside momentum.
The bigger warning comes from On-Balance Volume. OBV has been trending lower since October. This showed that participation and conviction were steadily weakening even during short-term bounces. Recently, OBV broke below this descending support line.
When OBV loses long-term support, it signals that selling pressure is accelerating and that market participation is deteriorating. It suggests that fewer buyers are stepping in, even at lower prices.
Sponsored
Sponsored
So the current setup looks like this:
- Some large buyers are accumulating slowly (CMF divergence)
- Institutional flows remain weak (ETF inactivity)
- Broader participation is shrinking (OBV breakdown)
Without strong volume support, rallies lack follow-through. This explains why HBAR continues to fail at resistance despite occasional inflow signals.
Until OBV stabilizes and ETF demand improves, upside moves are likely to remain fragile.
Sponsored
Sponsored
Falling Channel and OBV Breakdown Point to a 30% Risk Zone
The Hedera Price structure confirms this fragile setup.
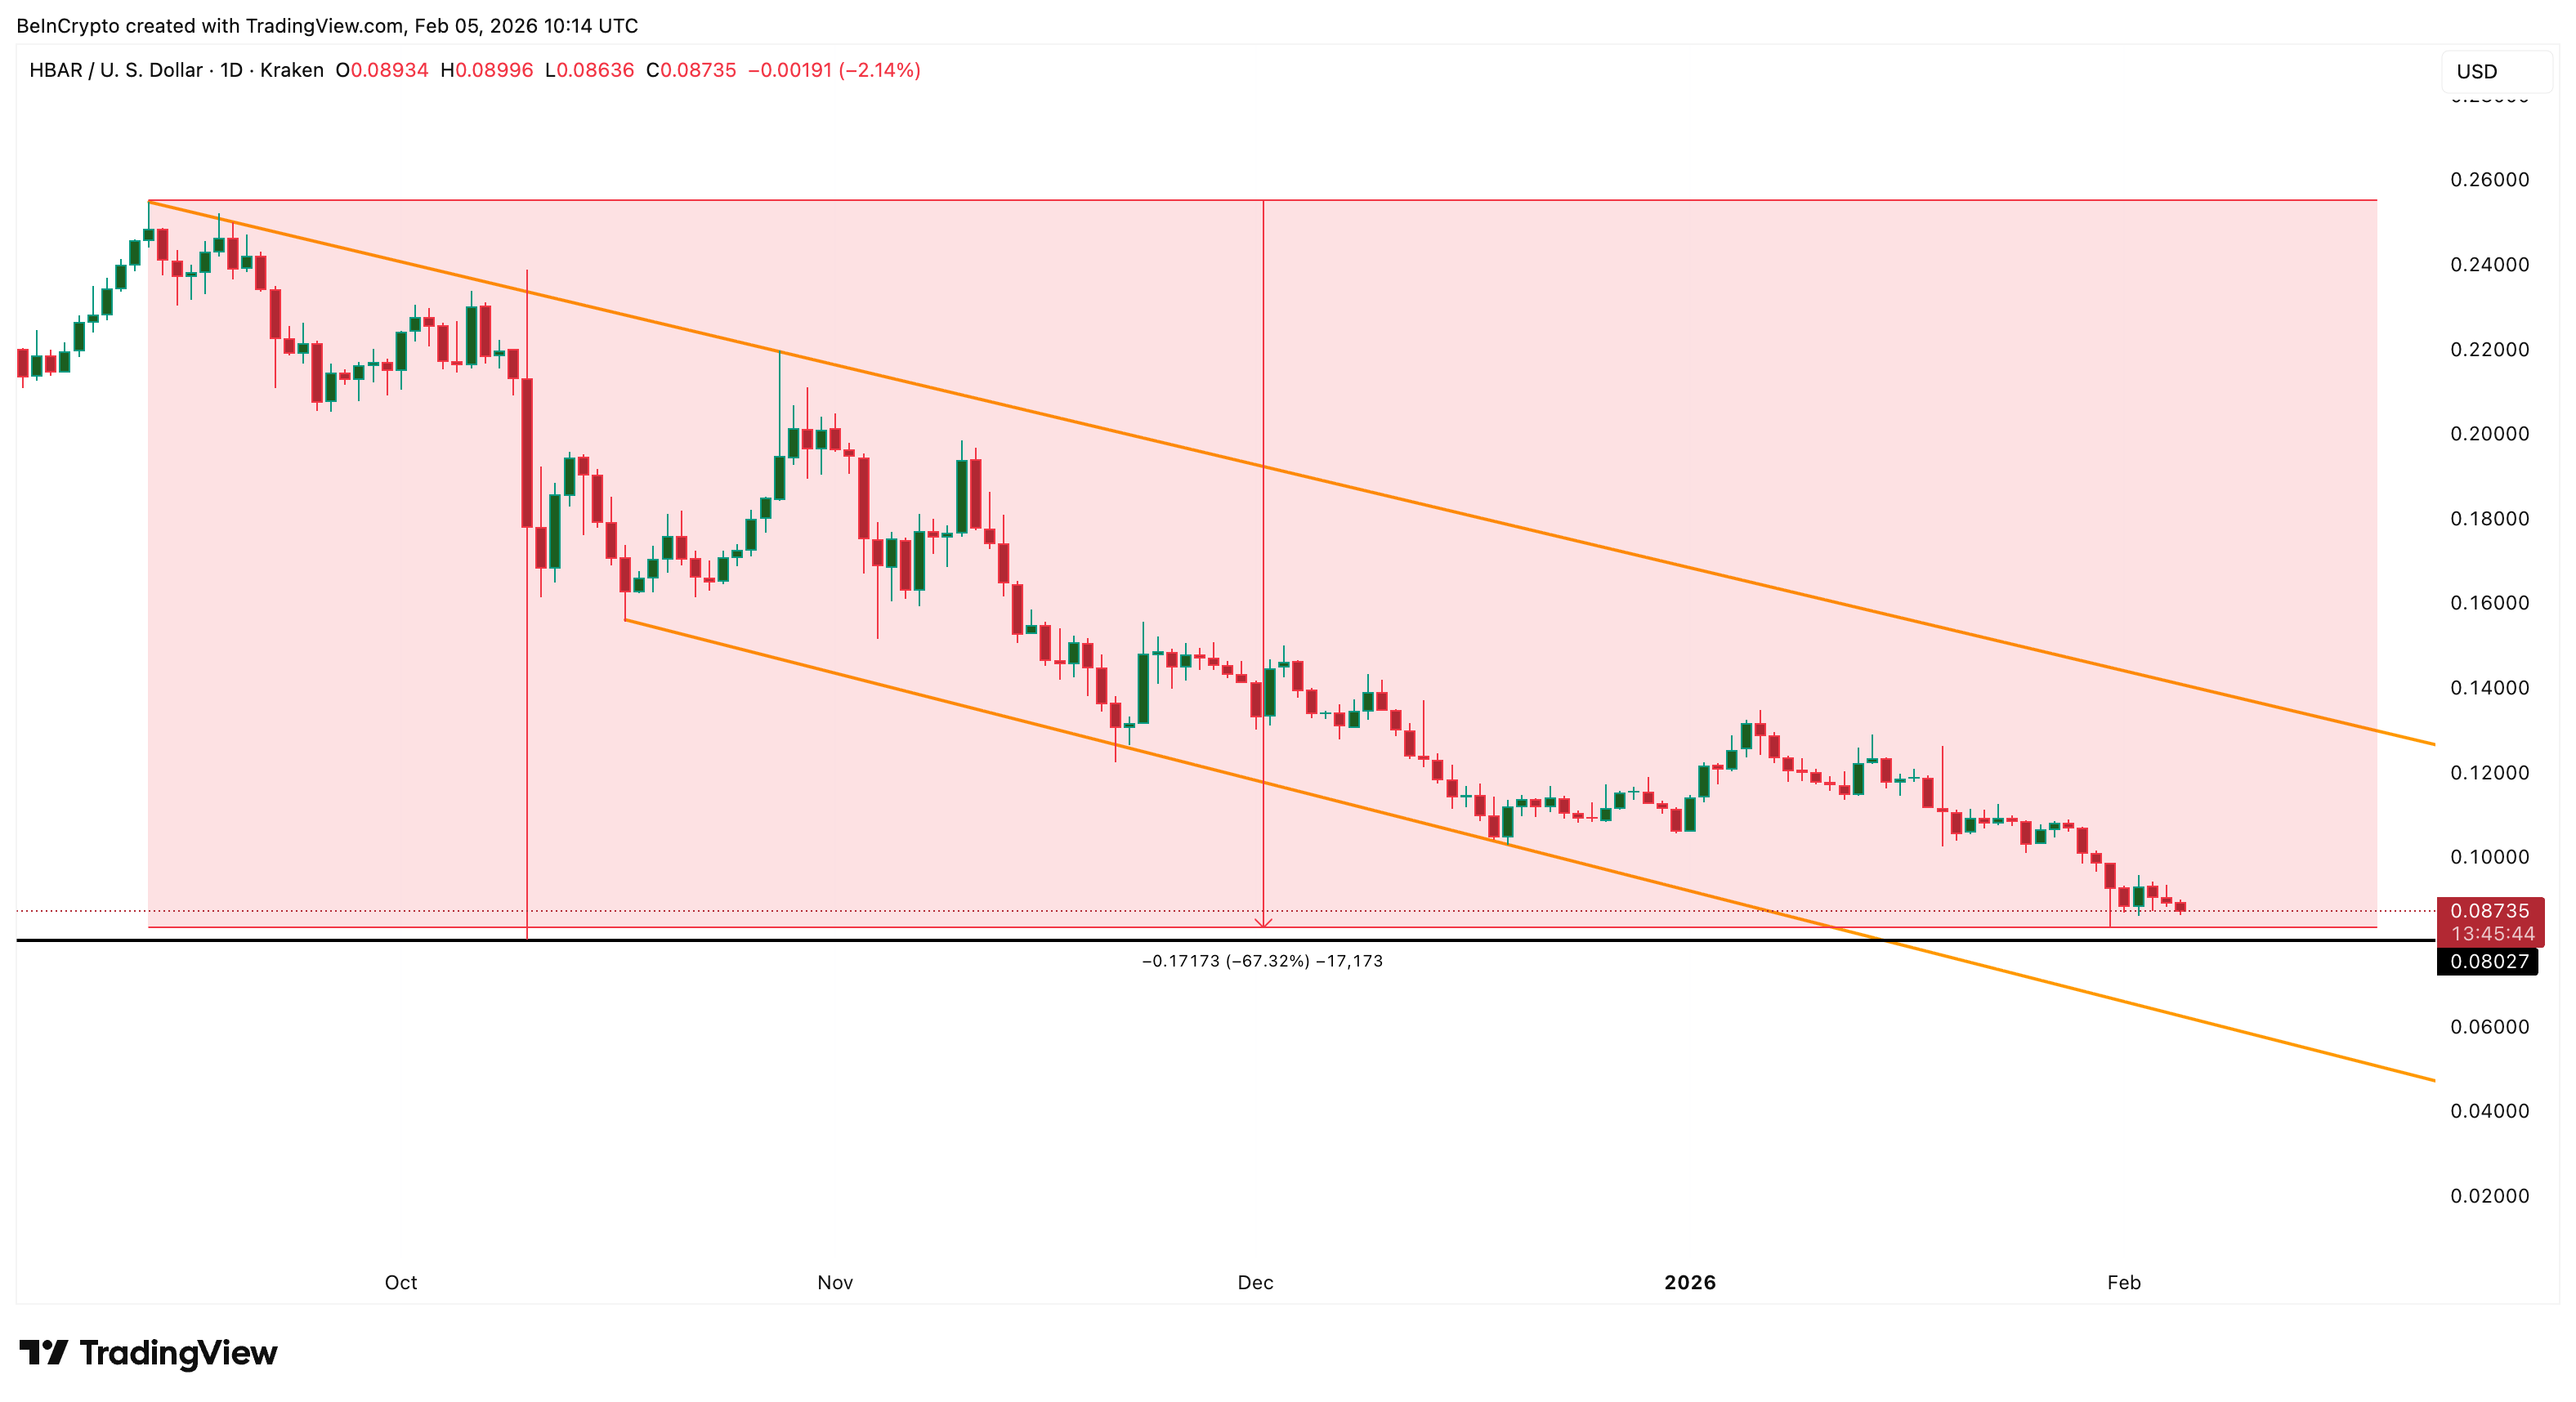
HBAR remains trapped inside a falling channel that has guided price lower since September, with a breakdown projection of around 30% if the lower trendline breaks.
The first major support sits near $0.080-$0.076. This zone has been in place since the October 10 crash. A daily close below it would weaken the structure. Below that, the next support lies near $0.062, based on Fibonacci extensions to the downside.
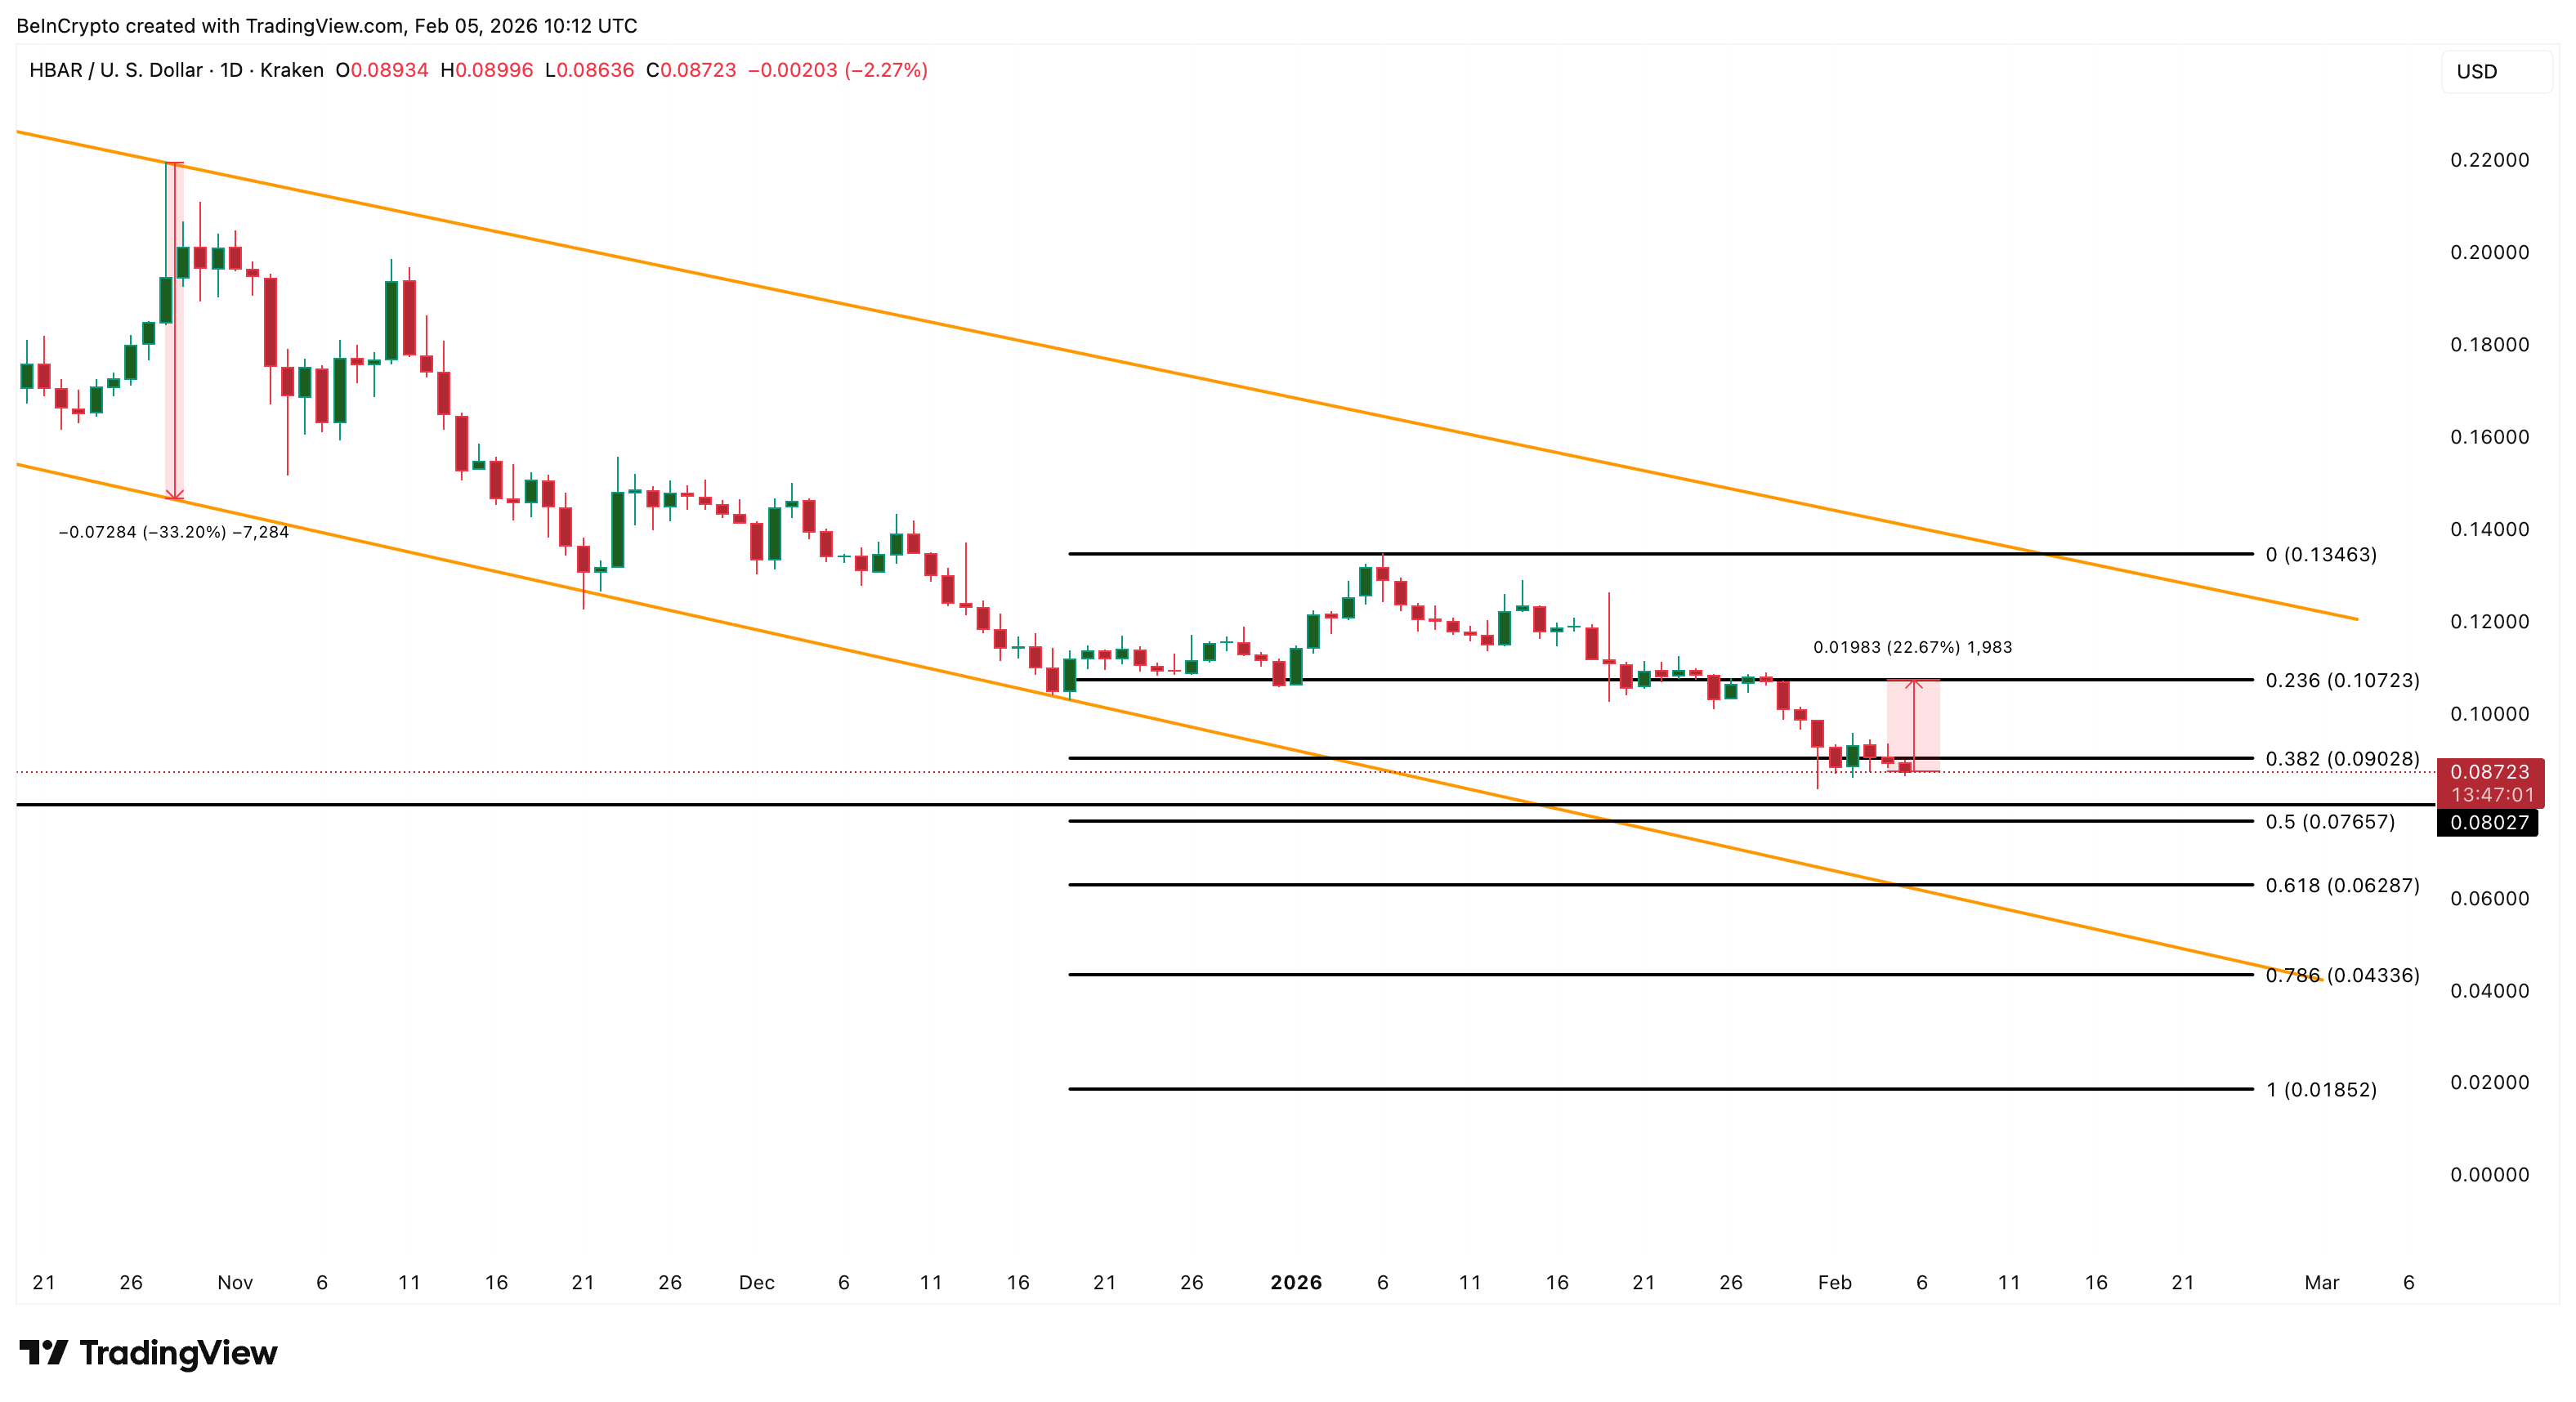
If this level breaks, the channel projection points toward $0.043, opening the 30% breakdown path. On the upside, recovery remains difficult.
HBAR must first reclaim $0.107. A move above $0.134 is needed to break the bearish channel. But that likely requires:
- A sustained TVL rebound
- Consistent ETF inflows
Without both, any HBAR price bounce attempt may fade quickly.

TLDR
- Aster’s layer-1 blockchain testnet is now live for all users, marking a key milestone for the platform.
- The Aster team plans to launch the mainnet in the first quarter of 2026.
- New features, including fiat currency on-ramps, will be introduced in Q1 2026.
- Aster will release its code for developers, fostering ecosystem growth and innovation.
- The platform’s shift to a perpetual futures DEX positions it as a competitor to Hyperliquid.
Aster, a decentralized crypto exchange (DEX) and perpetual futures platform, has announced the launch of its layer-1 blockchain testnet. The testnet is now available to all users, with the mainnet rollout scheduled for the first quarter of 2026. This major milestone is part of the company’s ambitious plans to enhance its platform and expand its offerings.
Aster’s Upcoming Features and Q1 2026 Launch Plans
Aster’s roadmap for 2026 includes several key developments that will significantly enhance its services. The introduction of fiat currency on-ramps will allow users to seamlessly convert their traditional currency into digital assets. Along with this, Aster will release its code for developers, enabling third-party builders to contribute to the platform’s growth.
The upcoming Aster layer-1 mainnet is designed to improve the platform’s efficiency and scalability. It will also serve as the backbone for future features and expansions. These developments are expected to increase Aster’s appeal to both traders and developers, fostering a more vibrant ecosystem.
In March 2025, Aster rebranded as a perpetual futures DEX. This move positioned the platform as a competitor to Hyperliquid, another prominent perpetual futures DEX. Hyperliquid operates on its own application-specific blockchain network, highlighting the trend of Web3 projects developing custom layer-1 blockchains for high-throughput transactions.
Aster’s decision to launch its own layer-1 blockchain aligns with this growing trend. It reflects the increasing demand for specialized blockchains that can handle high transaction volumes. By moving away from general-purpose chains like Ethereum and Solana, Aster aims to provide a more tailored and efficient solution for its users.
Surge in Perpetual Futures Trading Volume and Market Growth
The perpetual futures market saw a sharp rise in trading volume during 2025. According to DefiLlama, the cumulative trading volume nearly tripled, growing from approximately $4 trillion to over $12 trillion by the year’s end. About $7.9 trillion of this volume was generated in 2025, signaling increasing interest in crypto derivatives.
Monthly trading volumes hit the $1 trillion mark in October, November, and December. This surge highlights the growing demand for perpetual futures contracts, which allow traders to keep positions open without expiration dates.


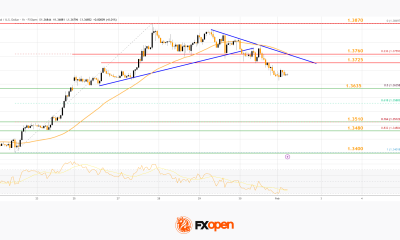
What Happens to XRP if the $1.30 Demand Zone Breaks?

More than just games: What stakes as Italy hosts Winter Olympics?

OpenAI is hoppin’ mad about Anthropic’s new Super Bowl TV ads


-

 Crypto World6 days ago
Smart energy pays enters the US market, targeting scalable financial infrastructure
-

 Politics6 days ago
Why is the NHS registering babies as ‘theybies’?
-
 Crypto World7 days ago
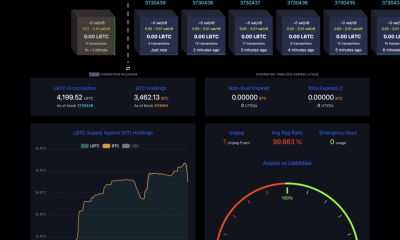
Adam Back says Liquid BTC is collateralized after dashboard problem
-

 Video3 days ago
When Money Enters #motivation #mindset #selfimprovement
-

 Fashion6 days ago
Weekend Open Thread – Corporette.com
-

 Tech2 days ago
Wikipedia volunteers spent years cataloging AI tells. Now there’s a plugin to avoid them.
-

 NewsBeat7 days ago
Donald Trump Criticises Keir Starmer Over China Discussions
-

 Politics4 days ago
Sky News Presenter Criticises Lord Mandelson As Greedy And Duplicitous
-

 Crypto World5 days ago
U.S. government enters partial shutdown, here’s how it impacts bitcoin and ether
-

 Sports5 days ago
Sinner battles Australian Open heat to enter last 16, injured Osaka pulls out
-
 Crypto World5 days ago
Bitcoin Drops Below $80K, But New Buyers are Entering the Market
-
 Crypto World3 days ago
Market Analysis: GBP/USD Retreats From Highs As EUR/GBP Enters Holding Pattern
-

 Business4 hours ago
Quiz enters administration for third time
-

 Crypto World6 days ago
KuCoin CEO on MiCA, Europe entering new era of compliance
-
Business6 days ago
Entergy declares quarterly dividend of $0.64 per share
-

 Sports4 days ago
Shannon Birchard enters Canadian curling history with sixth Scotties title
-

 NewsBeat10 hours ago
Still time to enter Bolton News’ Best Hairdresser 2026 competition
-

 NewsBeat3 days ago
US-brokered Russia-Ukraine talks are resuming this week
-

 NewsBeat3 days ago
GAME to close all standalone stores in the UK after it enters administration
-

 Crypto World2 days ago
Russia’s Largest Bitcoin Miner BitRiver Enters Bankruptcy Proceedings: Report