Russia’s Ministry of Finance has estimated the country’s daily cryptocurrency turnover at 50 billion rubles, or roughly $650 million, with annual activity exceeding 10 trillion rubles, around $130.5 billion.
The figures were shared by Deputy Finance Minister Ivan Chebeskov at the Alfa Talk conference, highlighting the growing scale of unregulated crypto use in the country, local outlet RBC reports.
“This is a turnover of more than 10 trillion rubles per year, which is currently taking place outside the regulated zone, outside our attention,” Chebeskov said.
Government officials, including the Bank of Russia, are now pushing for legislation to bring that activity into the regulatory fold.
Advertisement
Vladimir Chistyukhin, first deputy of chairman of the Central Bank, said both the government and the Bank hope a crypto market regulation bill will be passed during the State Duma’s spring session.
The proposed rules would allow existing licensed infrastructure, like exchanges and brokers, to enter the cryptocurrency space and boost their crypto offerings. The Moscow Exchange (MOEX) is already offering bitcoin BTC$68,770.50 and ether ETH$1,978.09 cash-settled futures contracts, and plans on adding SOL, XRP, and TRX futures.
The new framework would also allow MOEX and brokers to enter the spot market. Qualified and non-qualified investors would be allowed to participate, though with restrictions for the latter. Specific licensing would only apply to crypto exchange offices, and penalties are planned for unlicensed intermediaries.
According to the Bank of Russia’s financial stability report, Russian users held an estimated 933 billion rubles ($11.89 billion) on global crypto exchanges in mid-2025. These platforms are not currently regulated in Russia.
Advertisement
Sergey Shvetsov, Chairman of the Moscow Exchange’s Supervisory Board, said Russian users pay around $15 billion annually in commissions to global crypto platforms.
“As soon as it becomes possible, we will begin to compete with the gray sector,” he said. “The commissions that crypto exchanges and regular exchanges receive from trading crypto assets annually is $50 billion; there are estimates that the Russian share is about a third.”
Russia is indeed estimated to be the largest cryptocurrency market in Europe. Chainalysis found that between July 2024 and June 2025, Russia received $376.3 billion in crypto, far ahead of the $273.2 billion the United Kingdom received over the same period. Germany and Ukraine were the only other European countries to have received over $200 billion for the period.
Chainlink (LINK) moved back into focus after a large amount of LINK reached Binance during weekend trading.
Summary
Chainlink moved 19 million LINK, with most tokens sent to Binance during weekend trading hours.
LINK traded near $8.63 as RSI stayed below 50 and momentum remained weak overall today.
The quarterly unlock renewed focus on Binance inflows, exchange supply, and possible selling pressure.
CryptoQuant analyst Darkfost pointed to a large LINK transfer during what he described as a “low-liquidity weekend.” Separate onchain reports later said Chainlink completed its regular quarterly unlock, moving 19 million LINK worth about $165 million from three non-circulating supply addresses.
Advertisement
Of that total, about 14.375 million LINK, valued near $125 million, went to Binance. Another 4.625 million LINK, worth about $40.1 million, moved to multisig address 0xD50…8Af. Reports said Chainlink has followed a similar pattern about every three months, with most tokens going to exchanges and a smaller share set aside for staking rewards.
Large exchange inflows often draw attention because they can increase tradable supply. In this case, the Binance transfer arrived during a period when weekend liquidity was thinner than usual, which can make large token movements stand out more in market activity.
Even so, the purpose of the transfer remains unclear. Market observers said the movement could reflect routine treasury management, custody changes, or preparation for distribution, but none of those explanations had been confirmed at the time of reporting.
LINK price and chart stay cautious
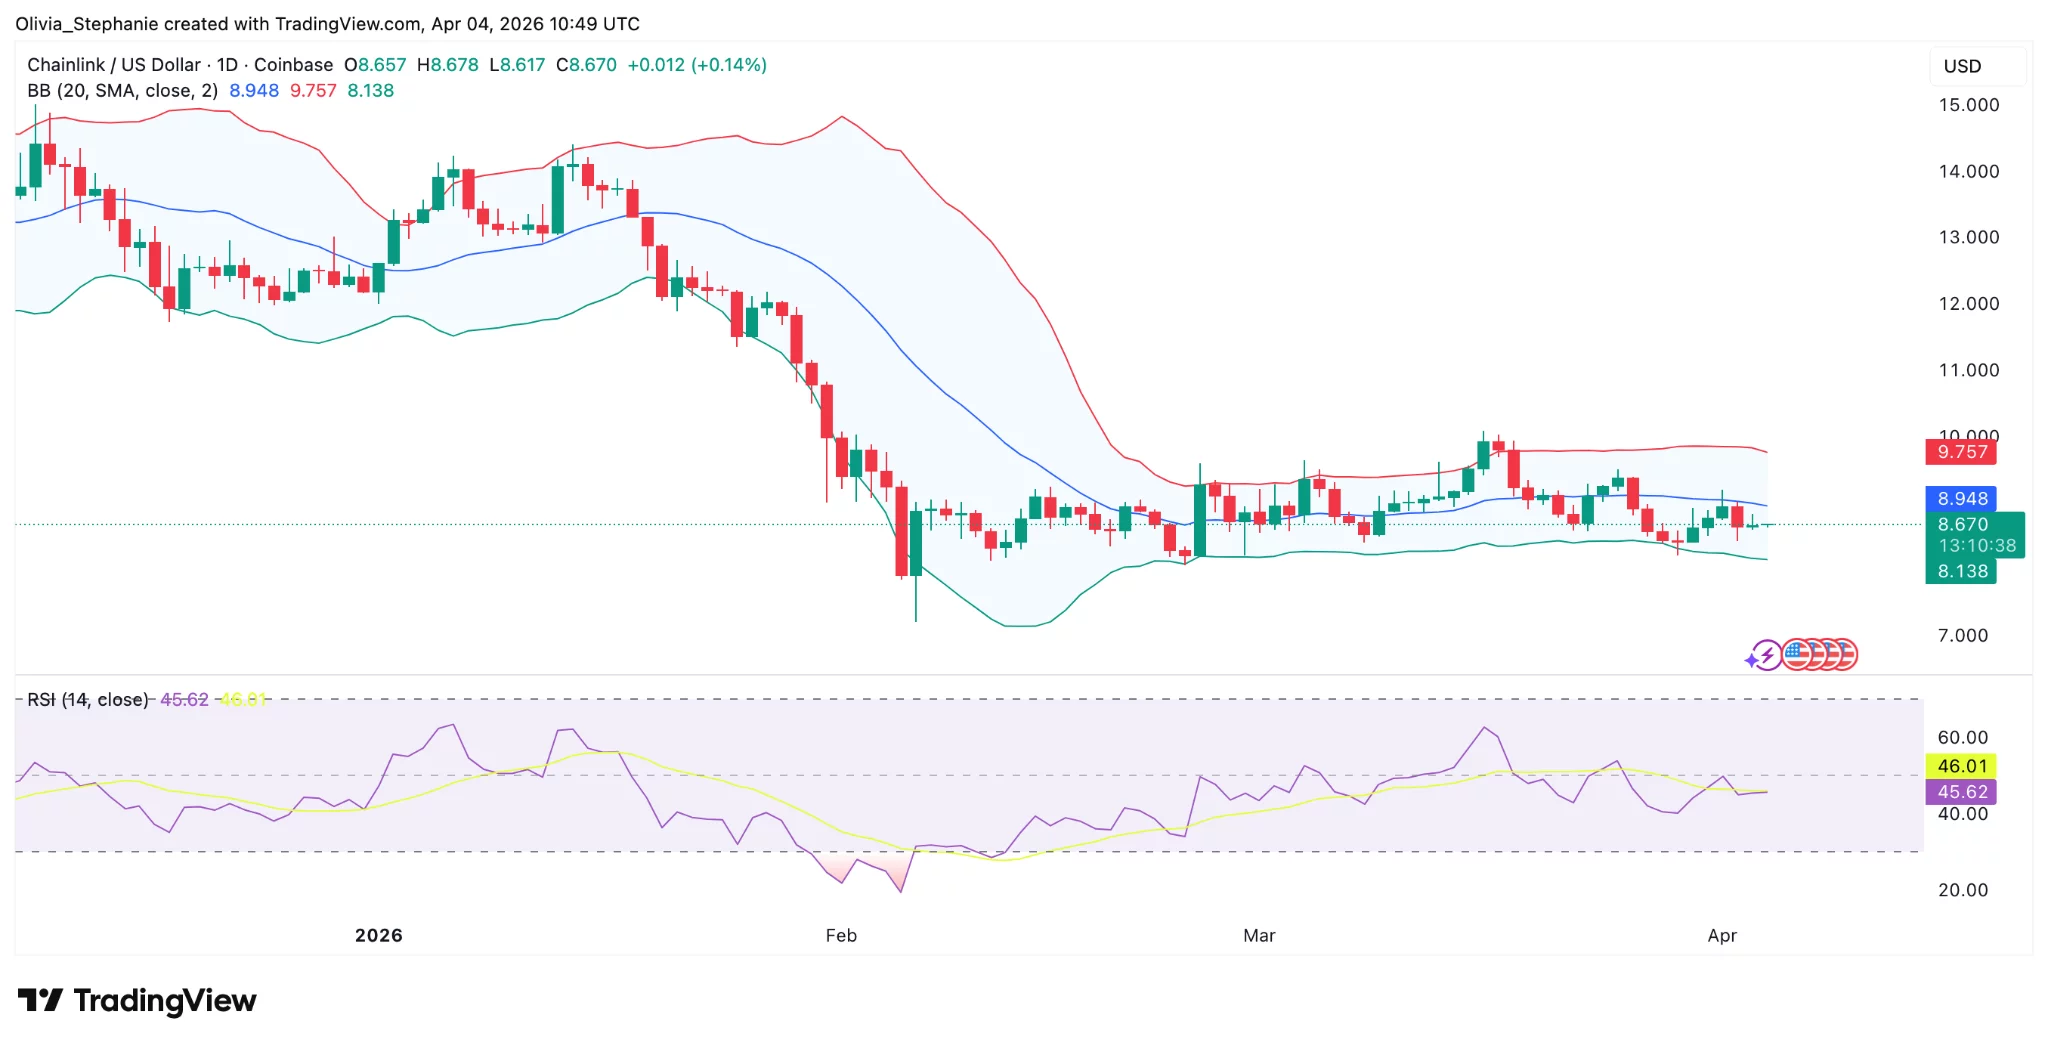
According to Crypto.News data, LINK traded at about $8.63 on April 4, with a market cap near $6.28 billion and 24-hour volume around $145.1 million, according to market data. That left the token little changed on the day and only modestly higher over the past week.
Advertisement
On the daily chart shared by the user, Bollinger Bands showed an upper band at 9.757, a middle band at 8.948, and a lower band at 8.138.
LINK price chart Source: TradingView
LINK traded below the 20-day average but above lower support, while the RSI sat near 45.48. That setup pointed to weak but stable momentum, with resistance near 8.95 and support around 8.14.
Disclosure: This article does not represent investment advice. The content and materials featured on this page are for educational purposes only.
Financial services giant Charles Schwab plans to launch direct trading for Bitcoin and Ethereum before the end of June.
This is a move that threatens to disrupt the dominance of crypto-native exchanges by leveraging the firm’s $12 trillion in client assets.
Schwab’s Crypto Launch Could Pull New Money Into Bitcoin and Ethereum
The firm is preparing to offer clients direct access to cryptocurrencies through a new platform called ‘Schwab Crypto.’
“Gain early access to the Schwab Crypto account, offered by Charles Schwab Premier Bank, SSB—your new gateway to buy and sell Bitcoin and Ethereum cryptocurrencies,” the firm’s website stated.
Notably, Schwab is structuring the service through Charles Schwab Premier Bank, SSB. This state savings bank charter indicates a conservative, compliance-driven approach to the new product.
Advertisement
The firm will also exclude residents of states with stringent crypto regulations, such as New York and Louisiana, during the initial rollout. This underscores its focus on regulatory safety over immediate national expansion.
Additionally, the firm’s deliberate choice to limit initial offerings to Bitcoin and Ethereum further highlights Schwab’s cautious strategy.
By excluding smaller, more volatile cryptocurrencies, the firm is validating the two largest digital assets while protecting its mainstream retail client base from the highly speculative fringes of the market.
Meanwhile, the initiative marks a strategic pivot for the Westlake, Texas-based brokerage. Previously, Schwab offered clients exposure to digital assets indirectly through crypto-linked stocks, futures, and spot exchange-traded products.
Schwab has a history of aggressive pricing, famously driving stock trading commissions to zero in 2019. If the firm applies a similar low-fee strategy to digital assets, it could force severe margin compression across the crypto exchange sector.
Furthermore, Schwab offers clients the convenience of managing traditional retirement accounts, equities, and digital assets on a single platform, eliminating the need for multiple financial applications.
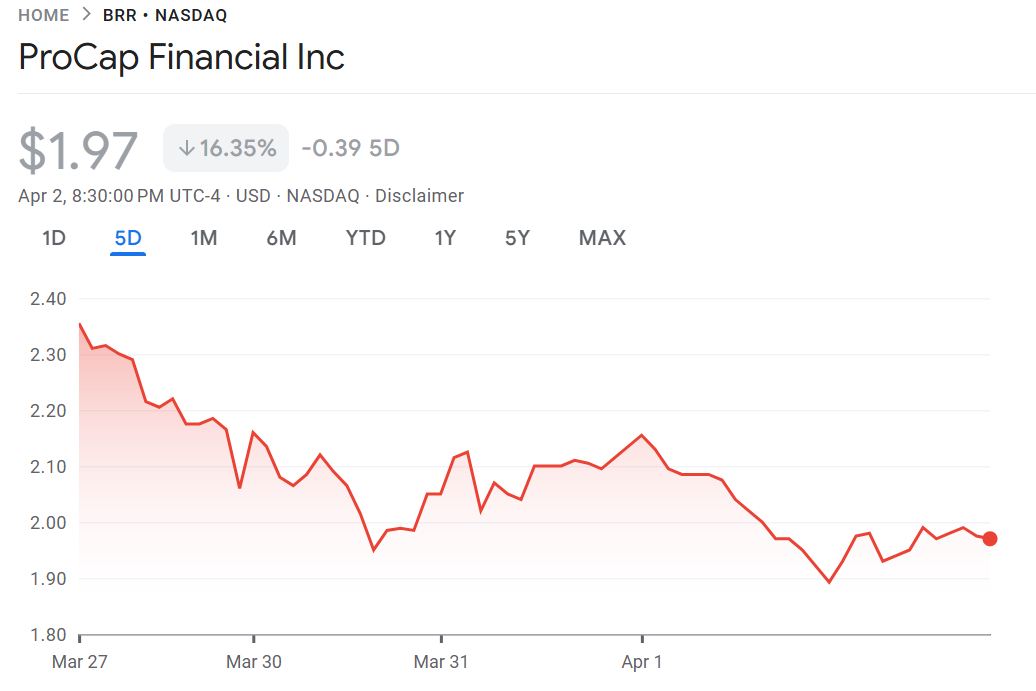
Jeff Park voluntarily resigned as Chief Investment Officer of ProCap Financial (BRR), effective April 3, 2026, according to an SEC filing.
The departure ends an eight-month stint at the Bitcoin treasury company founded by Anthony Pompliano. ProCap has not named a successor.
What the SEC Filing Reveals
The 8-K filing states Park’s exit was voluntary and not tied to any disagreement with ProCap’s board over operations, policies, or practices. Park also resigned from all subsidiary positions.
Resigned as CIO of ProCap today. Day 1 of whatever’s next. More soon.
His separation agreement, dated April 3, includes salary continuation through May 8, 2026, and continued vesting of restricted stock units through August 2026.
ProCap will also cover up to six months of group health insurance.
However, one detail stands out. The company waived Park’s non-compete covenant entirely.
He remains bound by confidentiality, non-solicitation, and non-disparagement clauses.
Advertisement
ProCap Financial BRR stock chart or BTC holdings graphic, Source: Google Finance
Park’s Role at ProCap
Park joined ProCap in mid-2025 after serving as Head of Alpha Strategies at Bitwise Asset Management. Pompliano recruited him to lead investment strategy and portfolio construction for the Bitcoin-focused firm.
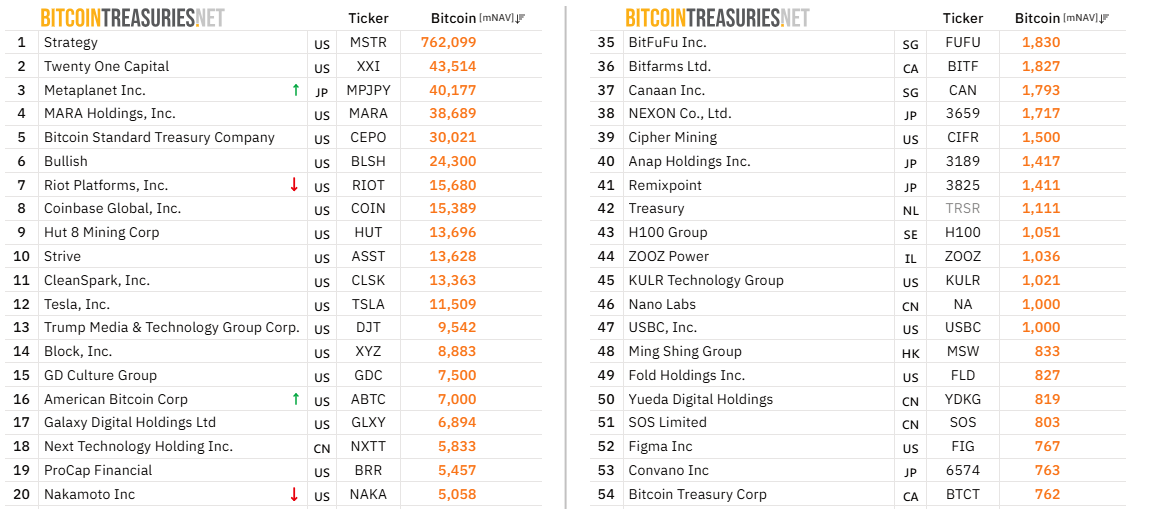
During his tenure, ProCap accumulated roughly 5,457 BTC and executed share buybacks to narrow a persistent discount to net asset value. The firm ranks 19th among public companies holding Bitcoin.
Public Companies Holding BTC. Source: Bitcoin Treasuries
Park also purchased BRR shares personally in December 2025.
He became a vocal advocate for what he called “Radical Portfolio Theory,” arguing that heavy Bitcoin allocations should replace traditional 60/40 portfolio models.
That framework shaped much of ProCap’s public-facing investment thesis.
What Comes Next
ProCap raised over $750 million through its SPAC merger and continues to pursue Bitcoin accumulation alongside financial services for retail investors.
Advertisement
Today I am announcing a $1 BILLION merger to create ProCap Financial, a bitcoin-native financial services. The company will be a publicly traded entity on Nasdaq at the conclusion of the proposed business combination between my private company ProCap BTC, LLC and Columbus Circle…
President Donald Trump submitted a $1.5 trillion defense spending request for fiscal year 2027 on Friday — the largest military budget proposal in U.S. history, a roughly 40% increase over current funding levels, arriving in the fifth week of the U.S.-led war against Iran.
Summary
Trump’s FY2027 budget seeks $1.5 trillion in defense spending, the proposed largest year-over-year increase in the post-WWII era, according to nonpartisan fiscal analysts
The plan pairs the defense surge with $73 billion in domestic cuts targeting health research, education, renewable energy, and community development programs
Non-defense discretionary spending would be cut by 10%; the proposal requires congressional approval and is expected to face significant pushback
According to Breaking Defense, the $1.5 trillion total is structured in two parts: a $1.15 trillion base budget — the first time the base Pentagon budget has crossed $1 trillion — and $350 billion to be passed through budget reconciliation.
The base budget requests approximately $260 billion for procurement and $220 billion for research, development, testing, and evaluation. The Golden Dome missile defense shield would receive $17.5 billion through reconciliation. The Air Force’s R&D account is slated to rise from $57 billion to $74.2 billion, funding programs including the F-47 stealth fighter scheduled for first flight in 2028. Shipbuilding capital reaches $65.8 billion for 34 vessels.
Advertisement
Budget Director Russell Vought said the plan “builds on the president’s vision by continuing to constrain non-defense spending and reform the federal government.”
Political Backdrop
NPR reports the request arrives as U.S. forces remain engaged in active combat with Iran, burning through Pentagon reserves at an estimated $1.2 billion per week. A separate emergency war supplemental is expected before Congress in late April or May. The Committee for a Responsible Federal Budget estimated the proposal would add $6.9 trillion to the national debt over 10 years, once interest costs are included. Federal Reserve Chair Jerome Powell warned separately that the debt trajectory “will not end well if we don’t do something fairly soon.”
Democratic Senator Patty Murray said she refuses “to provide a blank check to the Pentagon,” adding the department’s challenge is efficient spending, not funding volume. Republicans control both chambers but need to pass the reconciliation vehicle this year — with midterm elections approaching in November.
Advertisement
Market Implications
A budget of this scale, built on deficit spending during active military engagement, adds materially to inflation risk across global markets. As escalating military costs and oil supply disruption from the Iran conflict compress monetary policy options, investors in all asset classes — including digital assets — are recalibrating. The DeFiance CEO warned months ago that Middle East escalation would hit supply chains and financial markets in ways that would ripple broadly. Meanwhile, surveys show that 72% of financial institutions now classify digital assets as essential — a baseline that makes crypto markets increasingly sensitive to the macro signals this budget transmits.
Polymarket removed a market tied to a missing US service member after public criticism and political backlash.
Summary
Polymarket removed a market tied to a missing US service member after public backlash mounted.
The platform said the listing failed integrity standards and should not have gone live there.
Lawmakers and users raised fresh questions about prediction markets, ethics, safeguards, and insider-trading risks.
The platform said the listing failed to meet its integrity standards, adding new pressure on how prediction markets handle sensitive real-world events.
The controversy began after a market appeared asking whether US authorities would confirm the rescue of a pilot reportedly shot down over Iran. Most traders had bet that the person would not be rescued until Saturday, turning the listing into a wider public issue.
Advertisement
Polymarket later said it removed the market immediately. The company said the listing should not have gone live and added that it is now reviewing how the market passed its internal checks. The platform did not explain which specific rule had been broken.
US Representative Seth Moulton criticized the listing and said it should never have been available for trading. In a post on X, he called the market “disgusting” and said people were placing bets on the fate of a potentially injured service member.
“They could be your neighbor, a friend, a family member. And people are betting on whether or not they’ll be saved,” Moulton added.
The criticism drew more attention to the case and placed Polymarket under fresh public scrutiny over how it reviews markets before launch.
Advertisement
Although Polymarket said the market failed its integrity standards, the company did not say which rule applied. That lack of detail led some users and observers to question how the platform defines prohibited markets.
Business Insider correspondent Jack Newsham said he reviewed the platform’s market integrity page and terms of service but could not identify the relevant restriction. He wrote, “I’m looking at the “Market Integrity” page, and I checked the TOS, and I don’t see which prohibition is relevant here.”
Wider pressure on prediction markets
The latest dispute comes as Polymarket faces more attention over its growth and market activity. Reports recently said the platform’s daily fees climbed sharply after a broader fee model took effect across areas such as finance, politics, and technology.
At the same time, concerns about insider trading on prediction markets have continued to grow. Last month, reports said a group of traders made about $1 million by correctly betting on the timing of US strikes on Iran.
Advertisement
That activity led at least 42 Democratic lawmakers to urge the Commodity Futures Trading Commission and the Office of Government Ethics to warn federal employees against using non-public information to trade on prediction markets.
Defense Secretary Pete Hegseth forced Army Chief of Staff General Randy George into immediate retirement on Thursday — the latest in a pattern of senior military dismissals tied to a deepening conflict between Hegseth and uniformed leaders over diversity-linked promotion decisions.
Summary
Hegseth fired Gen. Randy George — the Army’s top uniformed officer — effective immediately on April 3, along with two other generals
The removal followed clashes over Hegseth’s decision to block promotions for four Army officers from a list of 29 candidates, two of them Black and two women
Gen. Christopher LaNeve, Hegseth’s former military aide, was named acting Army Chief of Staff
Pentagon spokesperson Sean Parnell confirmed George’s departure in a statement on X: “General Randy A. George will be retiring from his position as the 41st Chief of Staff of the Army effective immediately. The Department of War is grateful for General George’s decades of service to our nation. We wish him well in his retirement.”
No official reason was given. ABC News confirmed a senior Defense Department official told CBS News: “We are grateful for his service, but it was time for a leadership change in the Army.” Sources told CBS News that Hegseth wants someone in the role who will implement his and President Trump’s vision for the Army. Two other generals were also removed Thursday: General David Hodne, commander of the Army’s Transformation and Training Command, and Major General William Green Jr., the Army’s chief of chaplains.
Advertisement
What Drove It
The New York Times reported that George requested a meeting with Hegseth to discuss blocked promotions — and Hegseth refused to meet. The four officers removed from a promotion list of 29 candidates included two Black officers and two women. Nine U.S. officials familiar with the process told NBC News that Hegseth has blocked or delayed promotions for more than a dozen Black and female senior officers across all four military branches.
“If there are no open allegations or investigations, what was the reason they were removed from the list? They have all deployed and done their jobs, and all are combat-tested,” one official said.
George, a career infantry officer commissioned from West Point in 1988, served combat tours spanning Desert Storm, Iraq, and Afghanistan. Nominated to the Chief of Staff role by President Biden and confirmed in 2023, his term was expected to run through September 2027. He is the latest in a series of Joint Chiefs members removed by Hegseth, following the earlier dismissals of Joint Chiefs Chairman Gen. C.Q. Brown and Chief of Naval Operations Adm. Lisa Franchetti.
Advertisement
Pattern and Response
Democratic Senator Chris Murphy attributed the firings to the Iran conflict: “It’s likely that experienced generals are telling Hegseth his Iran war plans are unworkable, disastrous, and deadly.” The Joint Chiefs paid George a tribute: “Since 1988, General George and his family have consistently answered the nation’s call with honor and dedication.”
Military instability of this kind, during active combat, compounds the geopolitical uncertainty already affecting global markets. Analysts tracking Middle East escalation have consistently flagged its downstream effects on supply chains and financial systems. For context, Ripple’s survey data showed that 72% of financial institutions now view digital assets as essential infrastructure — a measure of how deeply integrated digital markets have become with the macro environment that geopolitical decisions like this one directly shape.
Polymarket has pulled a market tied to the fate of a missing U.S. service member after a wave of backlash, saying the listing violated its integrity standards. The decision comes amid heightened scrutiny of prediction markets that touch on real-world human outcomes and potential military actions.
The controversy centered on a prediction asking whether U.S. authorities would confirm the rescue of a pilot reportedly shot down over Iran, a topic that drew rapid and emotional reaction from users. Signals from the market suggested a majority—more than 60% of bettors—did not expect a rescue by the upcoming Saturday, highlighting how quickly sentiment can polarize around volatile, real-time events.
U.S. Representative Seth Moulton condemned the market as “disgusting,” expressing concerns about people speculating on the fate of a potentially injured service member. “They could be your neighbor, a friend, a family member. And people are betting on whether or not they’ll be saved,” he wrote, underscoring the human dimension behind the bets.
Polymarket stated that it removed the market immediately, adding that it should not have been listed and that the company is reviewing how the listing passed internal safeguards. The platform did not offer further detail about which specific rule or policy was violated.
Advertisement
Key takeaways
Polymarket deleted a market linked to the fate of a missing U.S. service member after backlash, signaling a potential tightening of internal safeguards for sensitive events.
Officials and commentators are calling for clearer governance of prediction markets that touch on human safety and military outcomes, amid questions about which rules apply to borderline cases.
Historical tensions around insider trading concerns persist in prediction markets, with recent reporting suggesting substantial profits from timing bets on geopolitical events and renewed calls from lawmakers for regulator guidance.
Polymarket’s monetization strategy, including a recent fee overhaul, has intensified scrutiny around the platform’s business model and its alignment with user interests and integrity standards.
The episode underscores the ongoing friction between innovative risk markets and ethical, regulatory, and operational safeguards—an area likely to attract regulatory attention in the near term.
Polymarket’s misstep and the boundaries of prediction markets
From the outset, the market’s subject—whether authorities would confirm the rescue of a potentially endangered service member—presses into delicate territory. Prediction markets have long drawn scrutiny when they intersect with real-world crises, where outcomes can directly affect real lives. Polymarket’s decision to remove the market suggests a recalibration of what content it deems appropriate for its platform, even as the broader market remains interested in forecasting events that straddle news cycles and human risk.
Users quickly noted the lack of clarity around policy enforcement. As coverage of the incident circulated, questions arose about which specific rule in Polymarket’s “integrity standards” had been breached. Critics argued that without transparent guidance on how safeguards are applied, users are left to guess at the boundaries between legitimate forecasting and ethically fraught betting lines. This kind of ambiguity can erate legitimate concerns about governance and user trust—issues that affect not only participants but potential partners and investors evaluating the long-term viability of decentralized or crypto-native prediction platforms.
Polymarket’s action follows a broader context of scrutiny in the sector. The platform has recently expanded its price feeds and product lines, moving into equities and commodities in collaboration with data providers, a move that coincided with a notable uptick in activity and monetization. In March, the company implemented a revamped fee structure, which Cointelegraph noted propelled daily fees well above prior levels and brought revenue into a higher profile. While monetization is essential for sustainable operation, it can also intensify incentives to broaden markets and attract trading volume, complicating the governance calculus when sensitive topics are on the table.
Insider trading concerns persist in prediction markets
Beyond governance questions, prediction markets remain under the lens for potential insider trading issues. Last month, reporting highlighted a group of traders who reportedly profited by accurately timing bets on U.S. strikes in the Middle East. The betting activity centered on the timing of events that could only be known with public or near-public information, and investigators flagged the pattern as suggestive of informational advantages being exploited through blockchain wallets created specifically to target those events. The episode underscored the tension between fast-moving information markets and safeguards against unfair advantages.
In response to those concerns, lawmakers entered the conversation. At least 42 Democratic lawmakers pressed the U.S. Commodity Futures Trading Commission (CFTC) and the Office of Government Ethics to warn federal employees against using non-public information to trade on prediction markets. The appeal reflects bipartisan interest in establishing guardrails that protect both market integrity and the broader public interest, particularly when markets touch on national security or military actions.
Advertisement
Taken together, these developments illustrate a pivot point for the sector. On the one hand, prediction markets offer a compelling lens on how information and sentiment drive consensus around uncertain events. On the other hand, the same dynamics that make these markets attractive—liquidity, rapid pricing, and the potential for swift monetization—also invite ethical and regulatory scrutiny when real-world stakes are high.
What readers should watch next
The Polymarket episode is likely to reverberate through the ecosystem as platforms reassess which markets to enable and how to articulate rules with greater precision. Investors and participants should monitor whether Polymarket, or comparable platforms, publish more granular guidance on integrity standards and incident-response processes. Regulators may also weigh in with clarifications on permissible subjects, disclosure practices, and anti-insider trading measures for decentralized or crypto-enabled markets.
As markets evolve, expect ongoing debates about balancing openness and innovation with accountability. For traders and builders, the takeaway is clear: clarity and safeguards are becoming as important as the odds themselves, and the next wave of policy and product decisions will likely shape how widely these markets are adopted in mainstream financial ecosystems.
Readers should stay tuned to see how Polymarket and peers adjust their governance models, whether new guardrails emerge from regulatory discussions, and how participants adapt their strategies in response to these evolving standards.
Advertisement
Risk & affiliate notice: Crypto assets are volatile and capital is at risk. This article may contain affiliate links. Read full disclosure
Binance ETH reserve fell to 3.3M ETH, breaking below both the February and August 2024 historical lows.
Bitcoin reserves on Binance declined from 670,000 BTC in early February to 636,000 BTC by early April 2025.
USDT reserves on Binance grew from $35 billion on March 12 to $38 billion by April 2, reflecting rising dry powder.
USDC balances climbed from $4.6 billion in February to $6.6 billion by April 2, adding to total stablecoin buying power.
Binance ETH reserve has dropped to its lowest level in over a year, falling below key historical lows. At the same time, stablecoin balances on the exchange have been rising steadily.
On-chain data from CryptoQuant shows that these two opposing trends are reshaping the exchange’s liquidity structure.
The shift points to easing sell-side pressure alongside growing buying power among traders holding dollar-denominated assets.
ETH and BTC Reserves Record Notable Declines on Binance
Binance’s Ethereum reserve has fallen to 3.3 million ETH, according to CryptoQuant analyst Amr Taha. This level sits below the February 2024 low of 3.53 million ETH and the August 29, 2024 low of 3.49 million ETH. Breaking below both historical support levels marks a clear downward trend in ETH holdings on the exchange.
Binance ETH Reserve Drops Below February 2024 Low While USDT and USDC Reserves Climb
“If this trend continues, it could create a more supportive setup for price expansion.” – By Amr Taha pic.twitter.com/aFbrLcdObH
Bitcoin reserves on Binance have also moved lower over recent weeks. The BTC balance declined from approximately 670,000 BTC in early February to 636,000 BTC by early April. That drop reflects a similar pattern of reduced crypto asset supply sitting on the exchange.
When fewer coins rest on an exchange, available sell-side supply tends to shrink. This shift often reduces the immediate pressure that sellers can place on spot prices during periods of market activity.
Rising Stablecoin Reserves Point to Growing Buying Power
As crypto reserves declined, stablecoin balances on Binance moved in the opposite direction. USDT reserves grew from $35 billion on March 12 to $38 billion by April 2. USDC reserves also climbed from $4.6 billion in February to $6.6 billion over the same period.
Advertisement
Taha noted in his analysis: “If this trend continues, it could create a more supportive setup for price expansion.” The combined growth in USDT and USDC balances reflects an accumulation of dry powder sitting ready on the exchange.
Stablecoin reserves rising while crypto reserves fall is a well-known market structure among experienced traders. It suggests that capital has rotated out of volatile assets and into dollar-pegged holdings, without leaving the exchange entirely.
Whether buyers begin deploying those stablecoin balances into spot markets remains the key variable to watch in the coming weeks.
X is preparing to automatically lock Twitter accounts that mention crypto for the first time, and the ripple effect on memecoin communities built entirely on social momentum could be severe.
X Head of Product Nikita Bier confirmed the mechanism directly: “We are in the process of implementing auto-locking + verification if a user posts about cryptocurrency for the first time in the history of their account.”
Yeah we’re aware. We are in the process of implementing auto-locking + verification if a user posts about cryptocurrency for the first time in the history of their account. This should kill 99% of the incentive, especially since Google isn’t doing shit to stop the phishing…
The trigger is first-time crypto posting, not repeat offenders. Bier’s rationale targets the 99% of phishing incentives tied to hijacked accounts promoting fraudulent tokens and fake giveaways. The move follows a wave of fake copyright violation emails stripping users of login credentials and 2FA codes.
For memecoins that depend on viral first-post discovery, new wallets, new converts, and new degens, this is a direct hit to the top of the funnel.
Advertisement
The broader market context adds pressure. X’s bot crisis, driven by AI-powered scam accounts exploiting recommendation algorithms with deepfake-heavy promotions, has already eroded trust in platform-native crypto signals.
Crypto Twitter Lock Mechanism Could Be A Good Cure For The Space
X’s verification layer filters scam noise and actually improves signal quality for legitimate crypto Twitter projects, driving renewed institutional interest and bringing back trust back to the industry. But the market might see whether the auto-lock policy reduces spam effectively or simply chills organic growth.
Advertisement
However, policy friction could also reduce crypto posting from new users by a material margin, cutting viral discovery loops that memecoins depend on.
X is about to auto-lock your account the moment you post about crypto – if it's your first time. Head of Product Nikita Bier just announced it. Hackers break into accounts and immediately start shilling random tokens. X is now looking to freeze those accounts before the damage… pic.twitter.com/IWV7ZuB4fw
Bitcoin Hyper Targets Early Infrastructure Upside as Memecoins Face Platform Risk
When social-layer memecoins face existential platform risk, capital has historically rotated toward projects with utility that doesn’t depend on viral posting cycles. That rotation is already showing up in presale momentum, and it’s worth watching where that money is going.
Bitcoin Hyper ($HYPER) is positioning directly in that gap. The project claims the title of the first-ever Bitcoin Layer 2 with Solana Virtual Machine (SVM) integration, delivering a faster performance than Solana through extremely low-latency processing, a Decentralized Canonical Bridge for BTC transfers, and high-speed smart contract execution.
Bitcoin has core limitations of slow transactions, high fees, and near-zero programmability, and Hyper is here to fix them. Hard numbers back the early traction, $32 million raised at a current price of $0.013678, with staking at a high 36% APY for early participants. Presale capital has been flowing toward infrastructure plays as memecoin sentiment cools.
Two U.S. military aircraft were shot down in separate incidents during combat operations over Iran on April 3 — an F-15E Strike Eagle and an A-10 Thunderbolt II — with a search-and-rescue operation still ongoing for one missing crew member as Operation Epic Fury approaches its sixth week.
Summary
Iran shot down a U.S. F-15E Strike Eagle on April 3; one of the two crew members was rescued, the other remains unaccounted for
An A-10 Thunderbolt II dispatched during the rescue effort was also struck by Iranian fire; the pilot ejected and was subsequently recovered
The incidents directly contradict recent U.S. government claims of complete air dominance over Iran, complicating the administration’s public messaging on the war’s progress
U.S. officials confirmed to CBS News that the F-15E Strike Eagle — a two-seat aircraft flown by a pilot and a weapons systems officer — was shot down by Iranian forces. One crew member was rescued by U.S. forces following a combat search-and-rescue mission. The second crew member, a weapons systems officer, remains missing. Images verified by CNN showed low-flying rescue aircraft conducting operations over Khuzestan Province in central Iran.
A rescue helicopter that extracted the surviving pilot was hit by small arms fire during the operation, wounding crew members on board before landing safely. An A-10 Warthog dispatched as part of the search effort was then struck by Iranian fire, forcing its pilot to eject over the Persian Gulf before recovery.
Advertisement
Iran’s state media posted claims of downing the aircraft and announced a reward for the capture of any “enemy pilot or pilots.” Iran’s Parliament Speaker Mohammad Bagher Ghalibaf mocked the U.S. search effort publicly on X.
A Direct Contradiction
The downing conflicts with statements from President Trump, who said in a prime-time address two days earlier: “They have no anti-aircraft equipment. Their radar is 100% annihilated. We are unstoppable as a military force.” Defense Secretary Pete Hegseth and other officials have repeatedly asserted U.S. air dominance over Iran.
According to Axios, three F-15Es had previously been lost to friendly fire during the conflict. The war has now claimed 13 American lives and wounded 365 service members. Israel separately suspended airstrikes in areas relevant to the ongoing U.S. rescue effort, according to an Israeli official speaking anonymously to the Associated Press.
Advertisement
Economic Pressure
Iran’s response has escalated alongside the aircraft losses. Tehran has imposed what amounts to a toll system on the Strait of Hormuz, a waterway through which approximately 20% of globally traded oil transits. Missile and drone attacks struck oil, gas, and desalination facilities across the Persian Gulf on Friday. The Federal Reserve Bank of Chicago’s Austan Goolsbee told CBS News that the Iran war risks fueling inflation in a way that could prevent the Fed from cutting rates in 2026.
As analysts warned months ago, Middle East escalation carries supply chain and inflationary consequences that reverberate across all risk assets. Institutional capital flows have already shifted in response to the conflict’s progression, with large asset managers repositioning across both traditional and digital markets as geopolitical uncertainty deepens.


 NewsBeat2 days ago
 Business1 day ago
 Fashion17 hours ago
 Crypto World3 days ago
 Tech5 days ago

 Tech5 days ago
 Tech4 days ago
 Sports4 days ago
 Business2 days ago
 Fashion6 days ago
 Tech6 days ago
 Tech4 days ago
 Fashion5 days ago
 Politics5 days ago
 Tech5 days ago
 Crypto World5 days ago
 Tech4 days ago
You must be logged in to post a comment Login