
Crypto World
Silver Price Prediction For March 2026: New All-Time High?

Silver price has had a brutal yet fascinating start to 2026. After surging to an all-time high near $121 on January 29, the metal crashed nearly 47% by February 6. But since then, silver has staged a relentless 32% recovery to trade near $84 on February 20.
With markets closed on the 21st and 22nd, the question heading into March is clear: is this recovery the real deal, or does more pain lie ahead? The technicals and positioning data paint a nuanced picture. A consolidation is likely before the next decisive move, but the weight of evidence leans bullish.
Cup Formation, Hidden Bearish Divergence, And Signs Of Consolidation
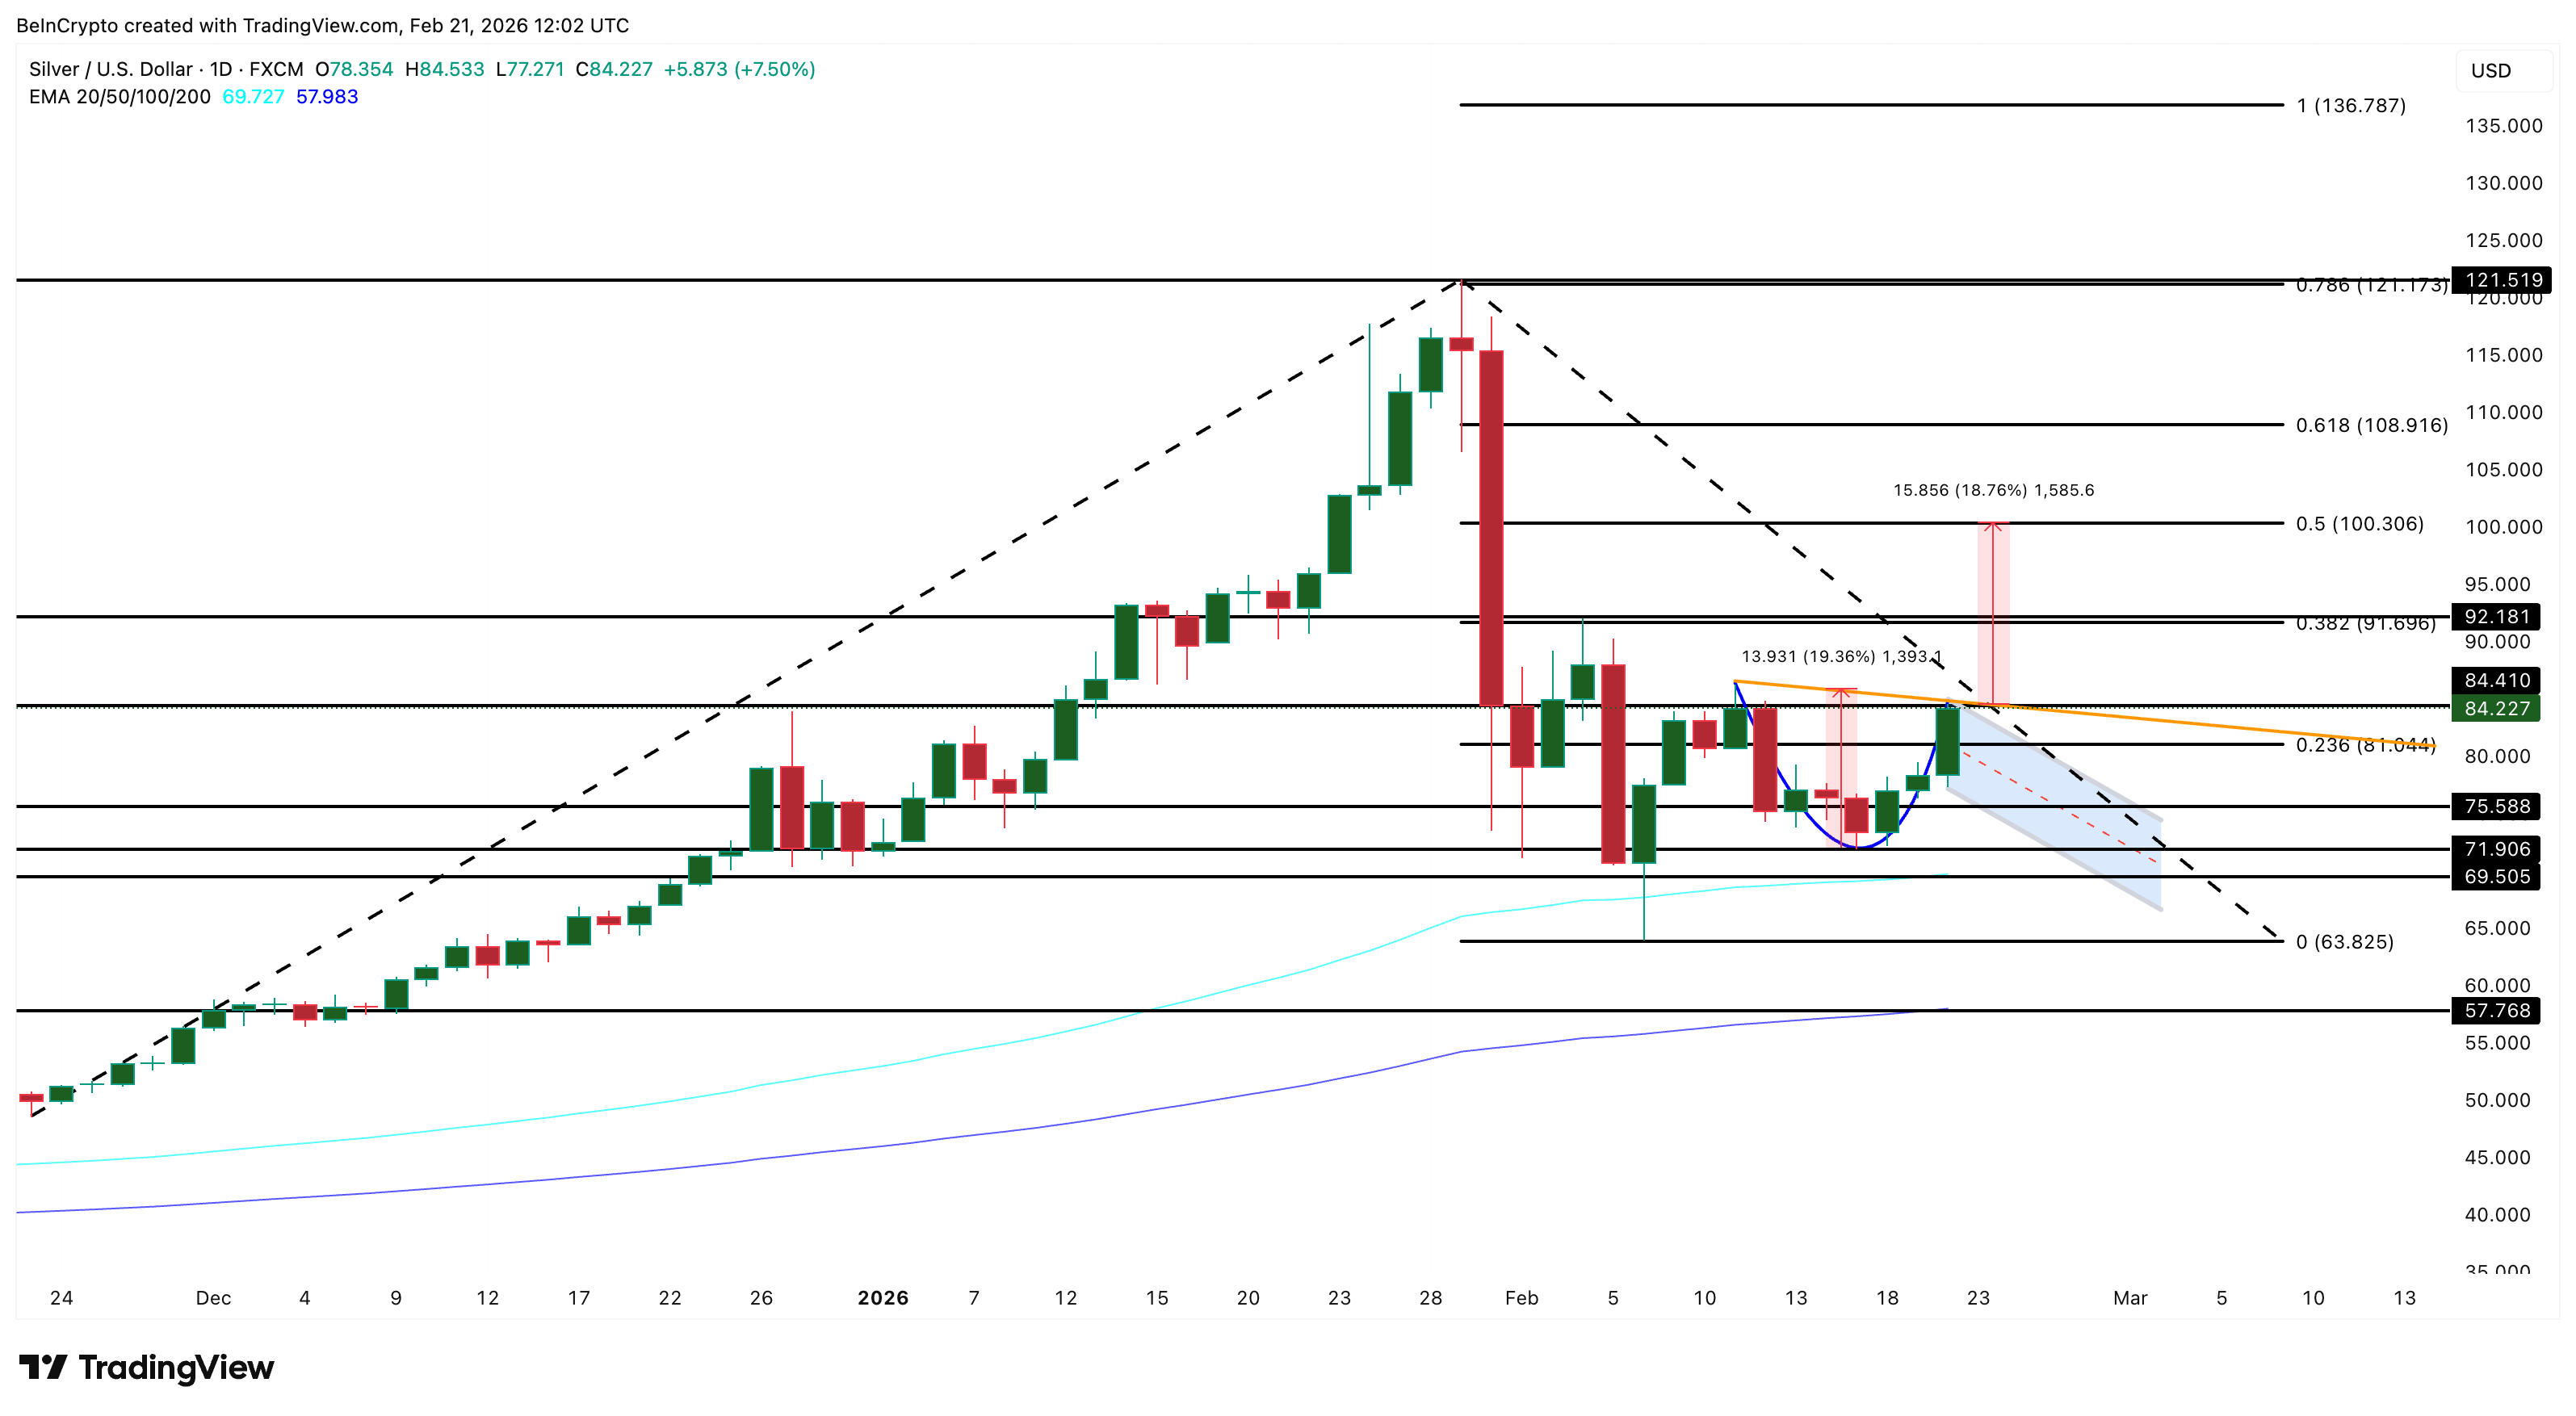
The XAG/USD daily chart reveals a developing cup pattern, with the impulse wave originating from November 21, 2025, peaking at $121 on January 29, and pulling back to $63.85 on February 6. The recent recovery toward $84 is now approaching the neckline of this formation.
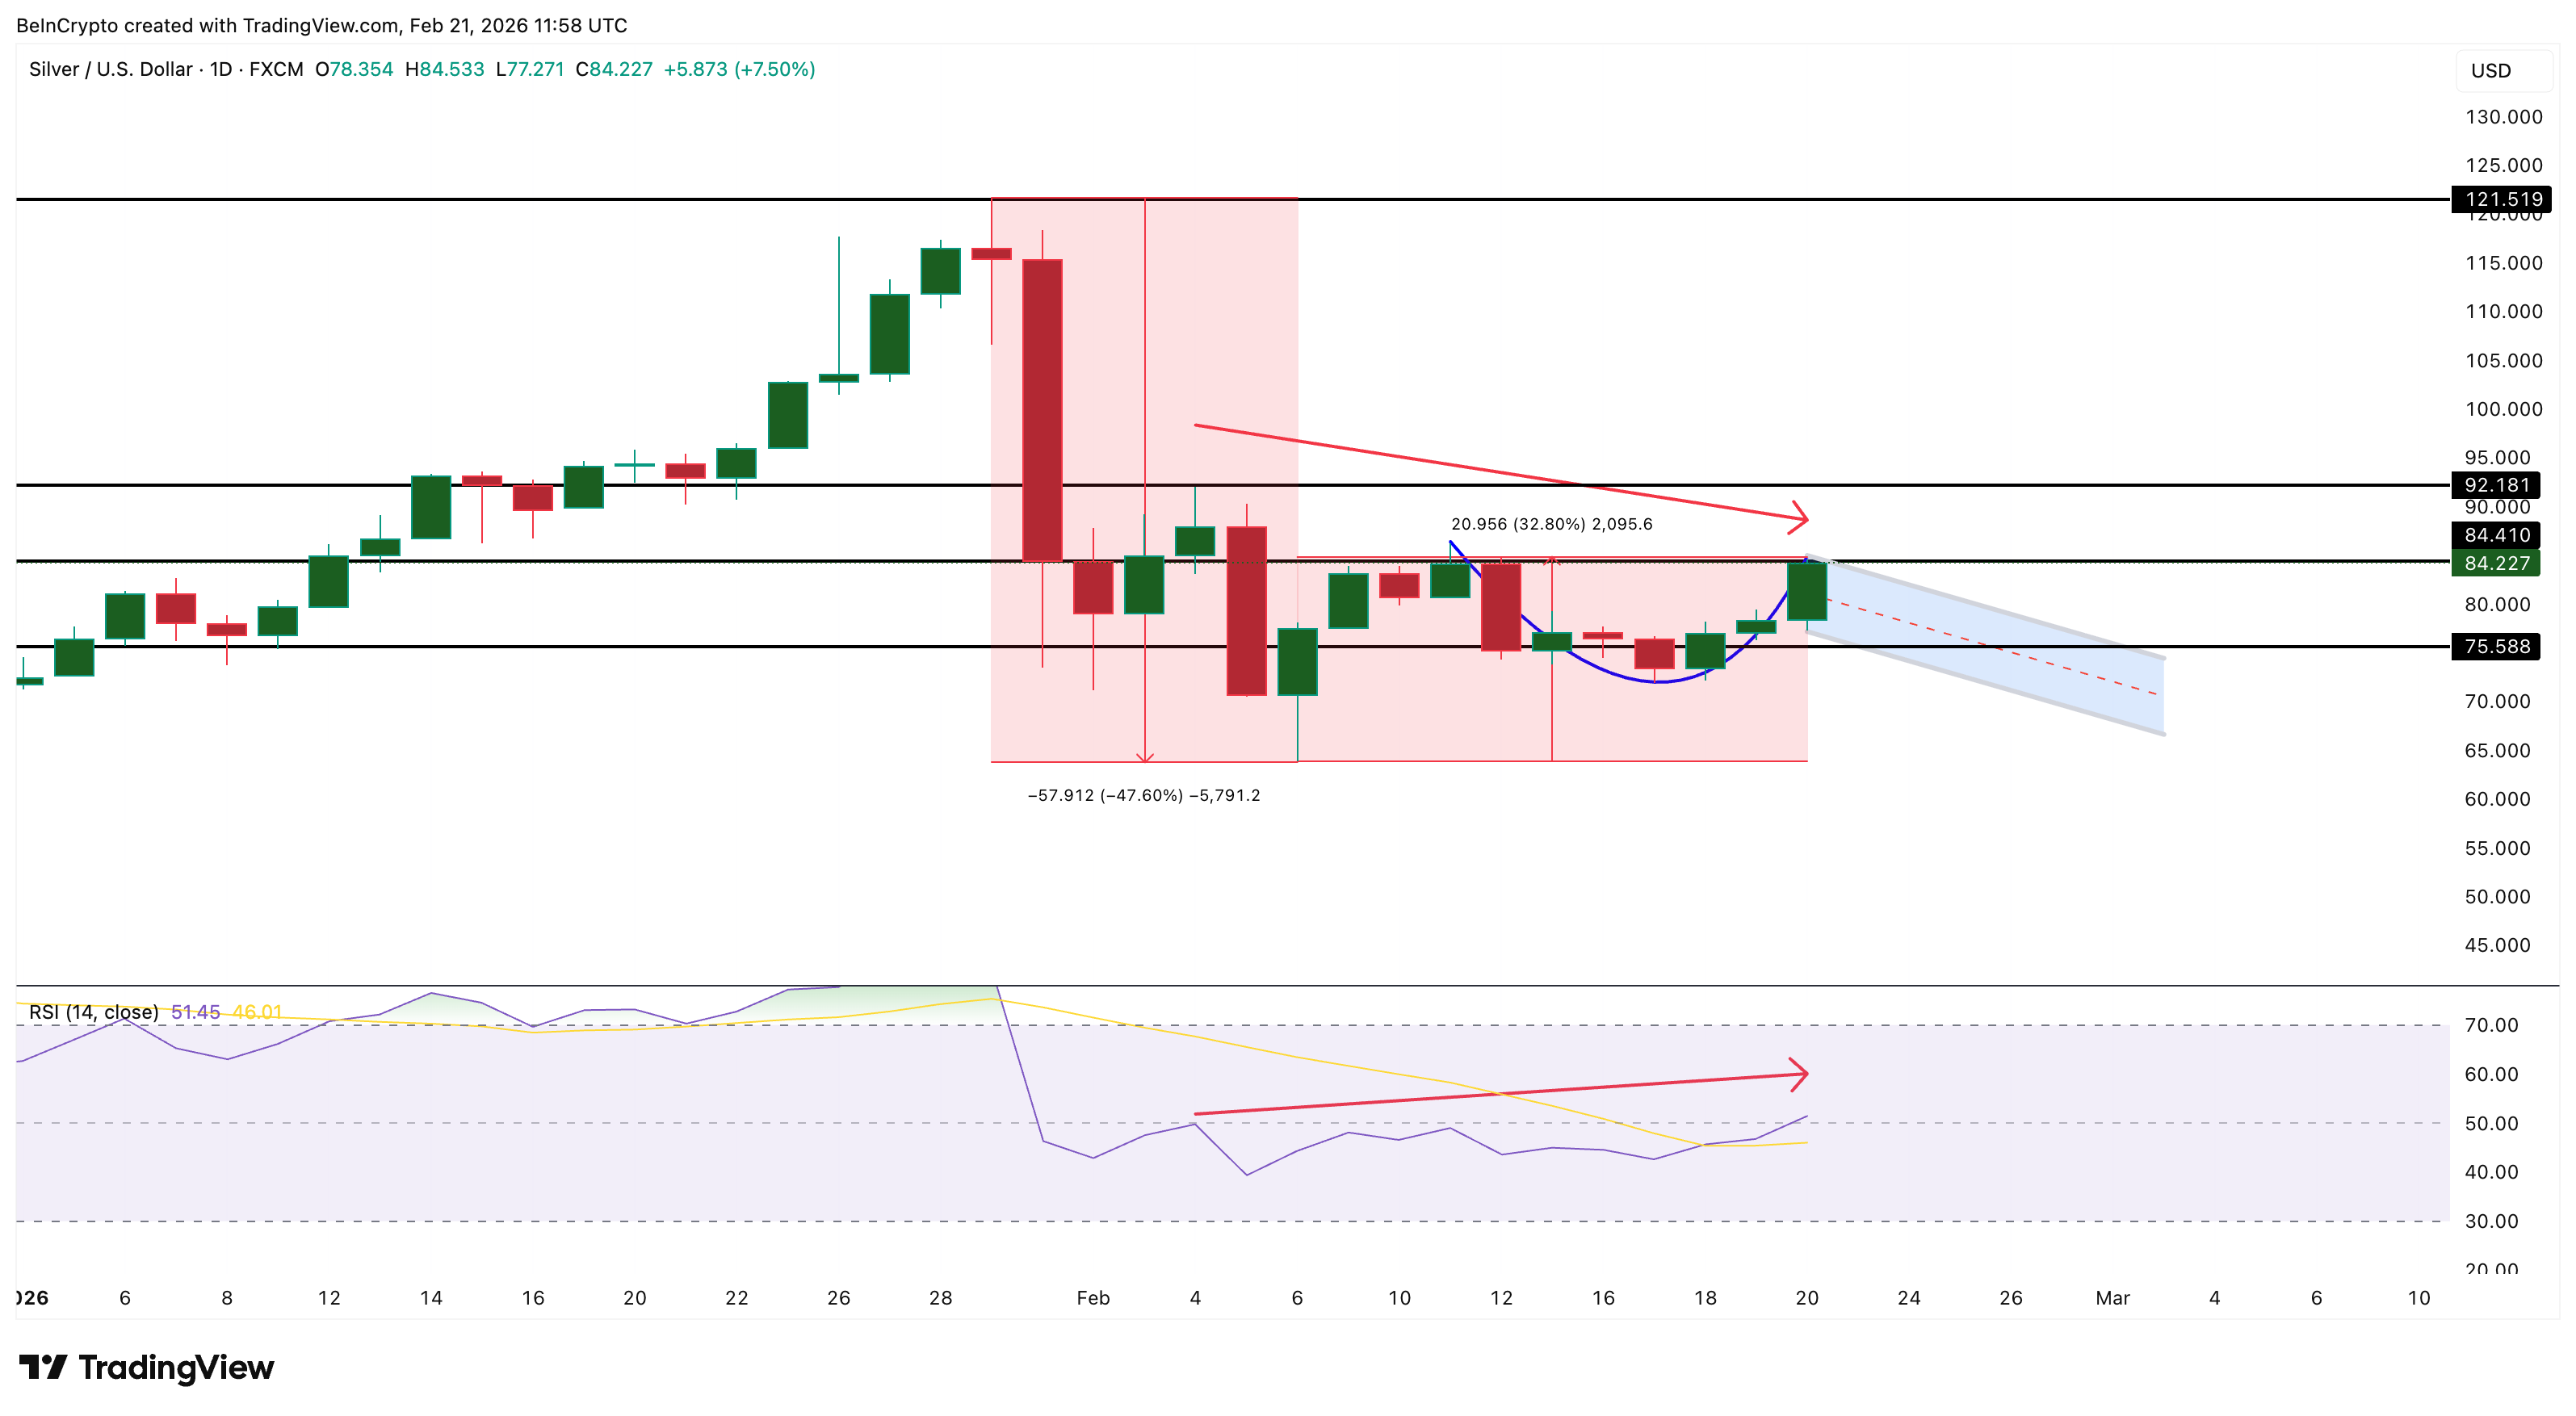
Between February 4 and February 20, silver is printing a lower high setup. But the relative strength index (RSI), a momentum indicator, during the same period is forming a higher high: a hidden bearish RSI divergence.
This signals that, despite apparent RSI strength, the price trend favors consolidation before a decisive move. This pattern holds as long as the next candle remains below $92 (the previous high) and the RSI continues to climb.
Smart money betting is betting on consolidation as well.
If the current consolidation develops into a handle, it must still hold above $75 to keep the bullish structure intact.
The cup-and-handle pattern gains validity on a clean daily close above $84. However, some consolidation is expected first — and the supporting indicators explain why a pause here is healthy rather than concerning.
Miners Lead, Silver Futures Lag: The Physical-Paper Divergence
The Global X Silver Miners ETF (SIL), trading above $107, adds early validation to the bullish case. SIL peaked at $119 on January 26 — three days before silver spot topped on January 29. Miners leading on the way up and holding relatively firm on the recovery is a classic bullish leading indicator.
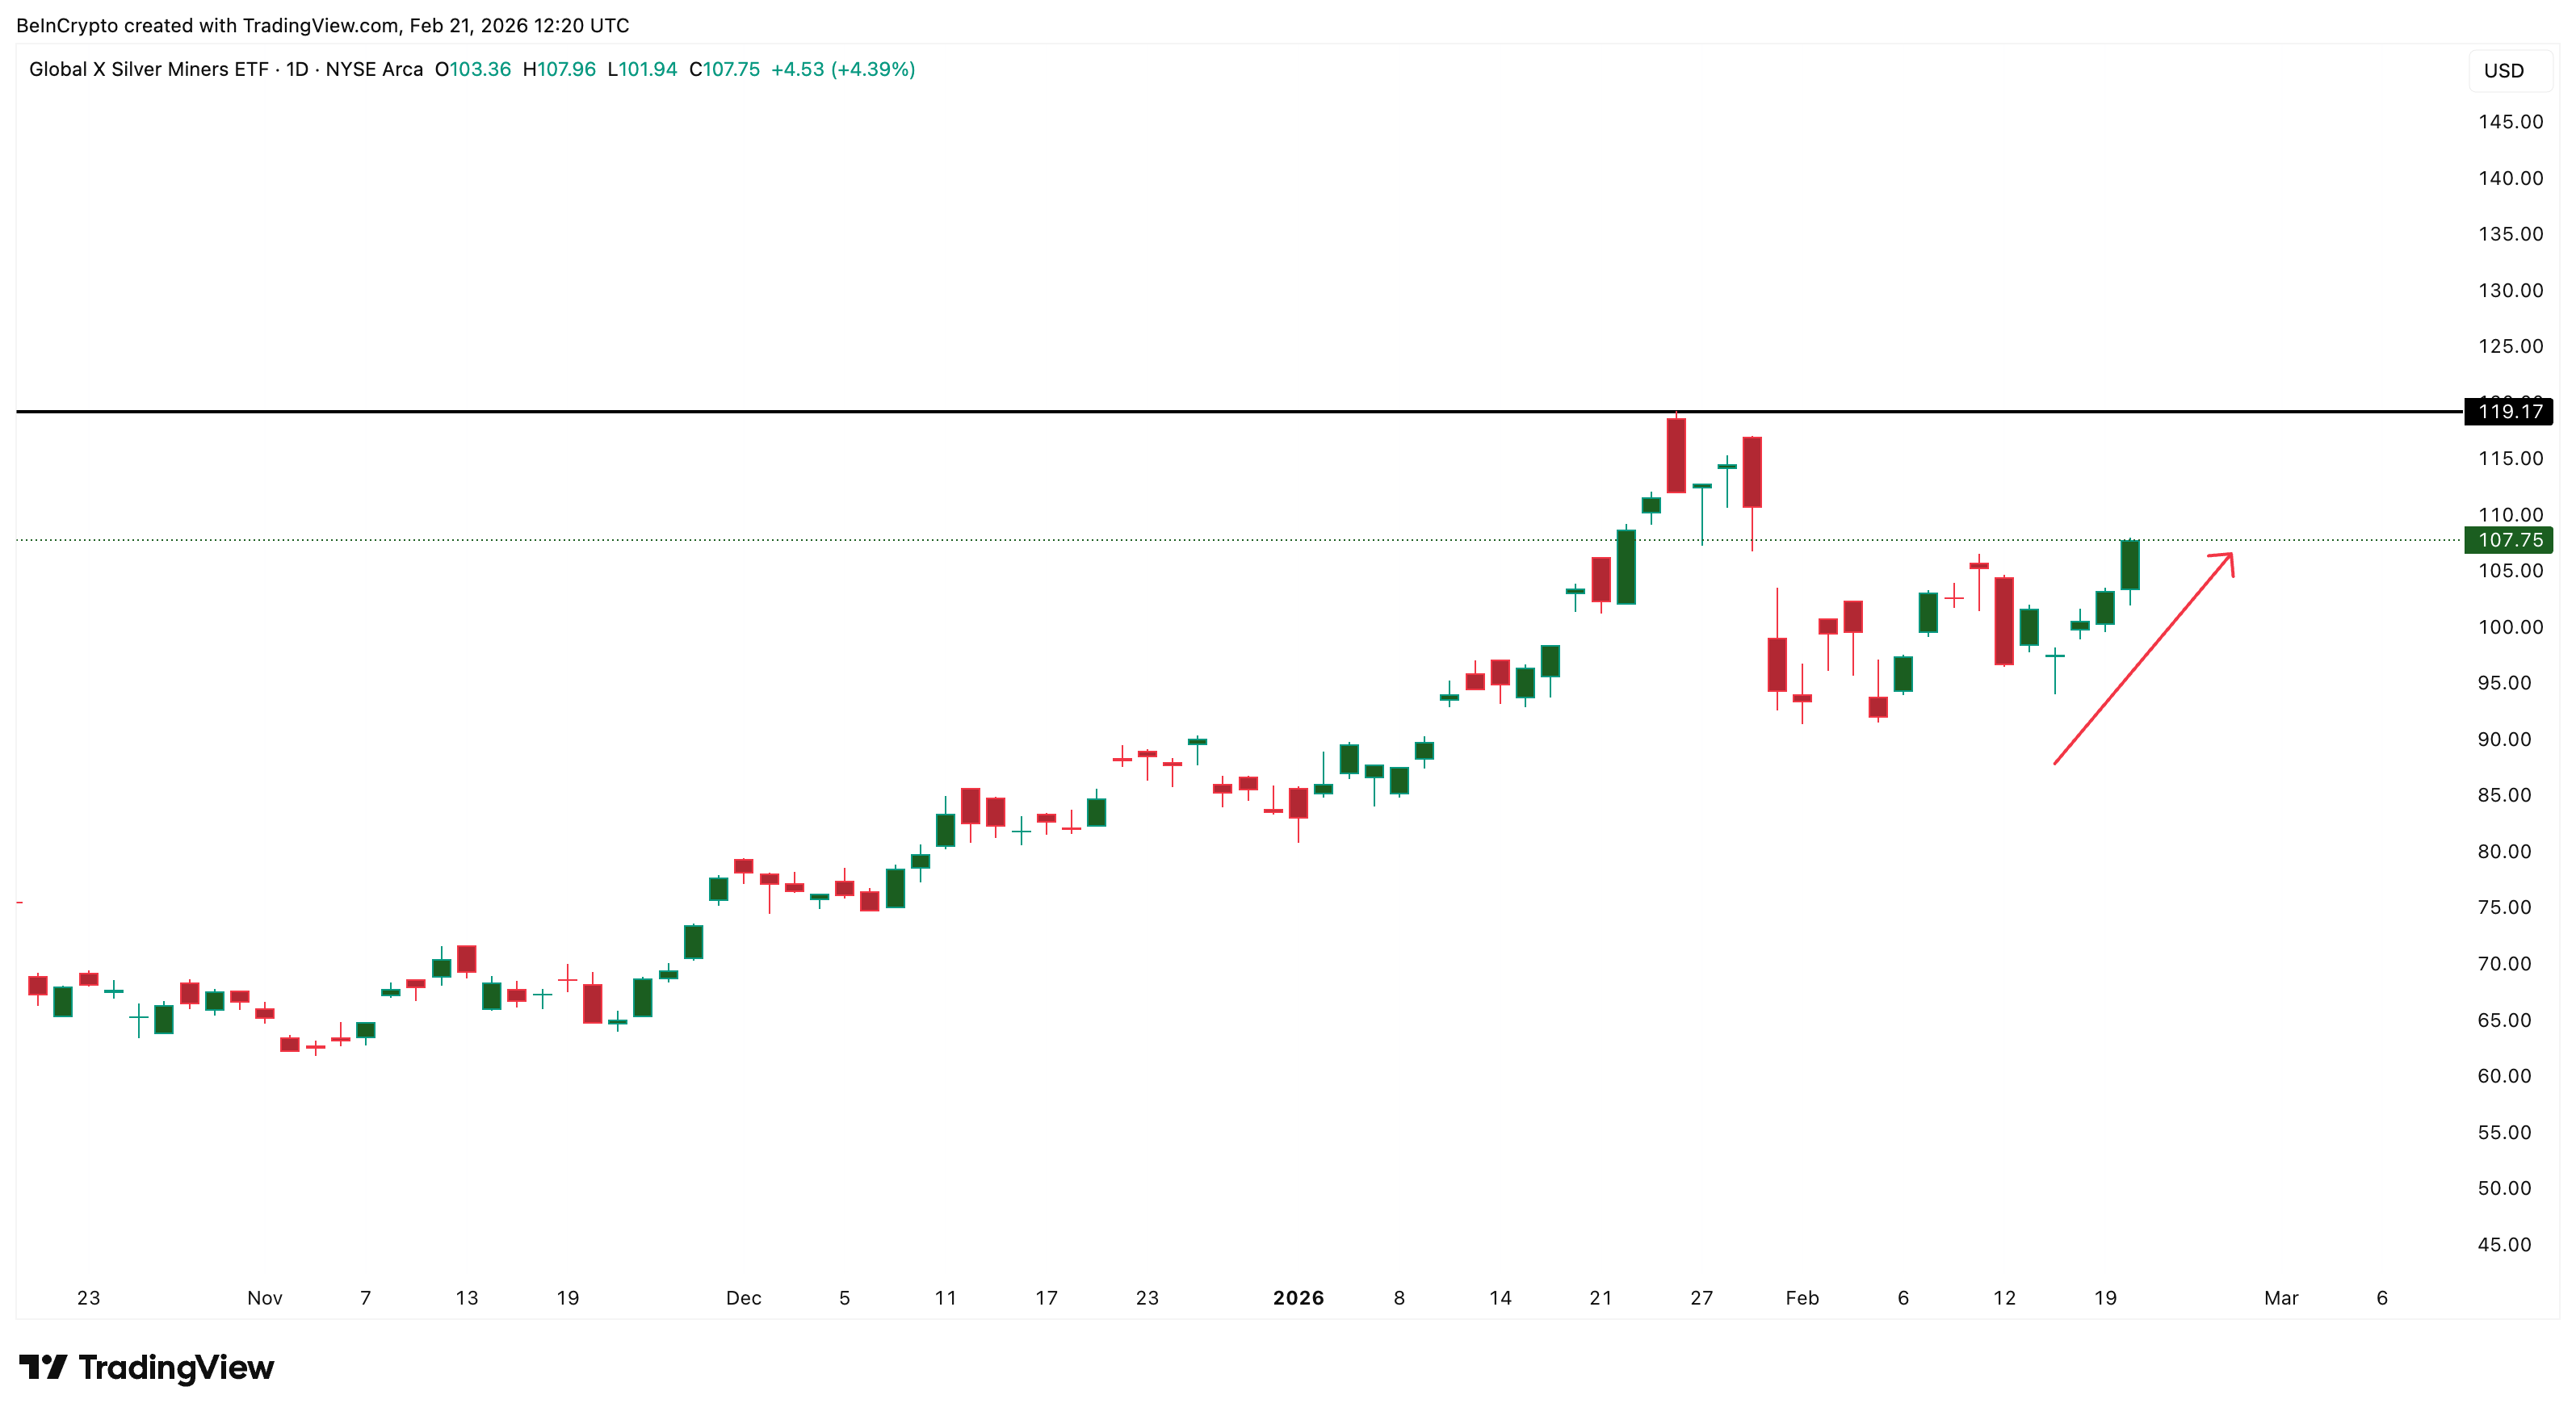
Mining companies have direct visibility into industrial order books and production demand, and their resilience suggests the fundamental picture remains intact despite the January liquidation. When miners hold while the metal consolidates, it typically signals that the next move is higher, not lower.
The disconnect between this physical market’s strength and the futures market’s hesitancy defines the current silver landscape.
COMEX silver futures (SI1!) are trading around $82 — below the spot price of $84. This backwardation (futures below spot) is rare and significant. It means buyers are willing to pay a premium for physical silver now rather than wait for future delivery.
The market is pricing urgency into spot, signaling physical tightness in the supply chain.
However, open interest on SI1! has been steadily declining since February 6, even as the Silver price rose from $63 to $82. A rising price amid falling open interest is the signature of a short-covering rally — traders who were short after the crash are buying back their positions, pushing the price higher.
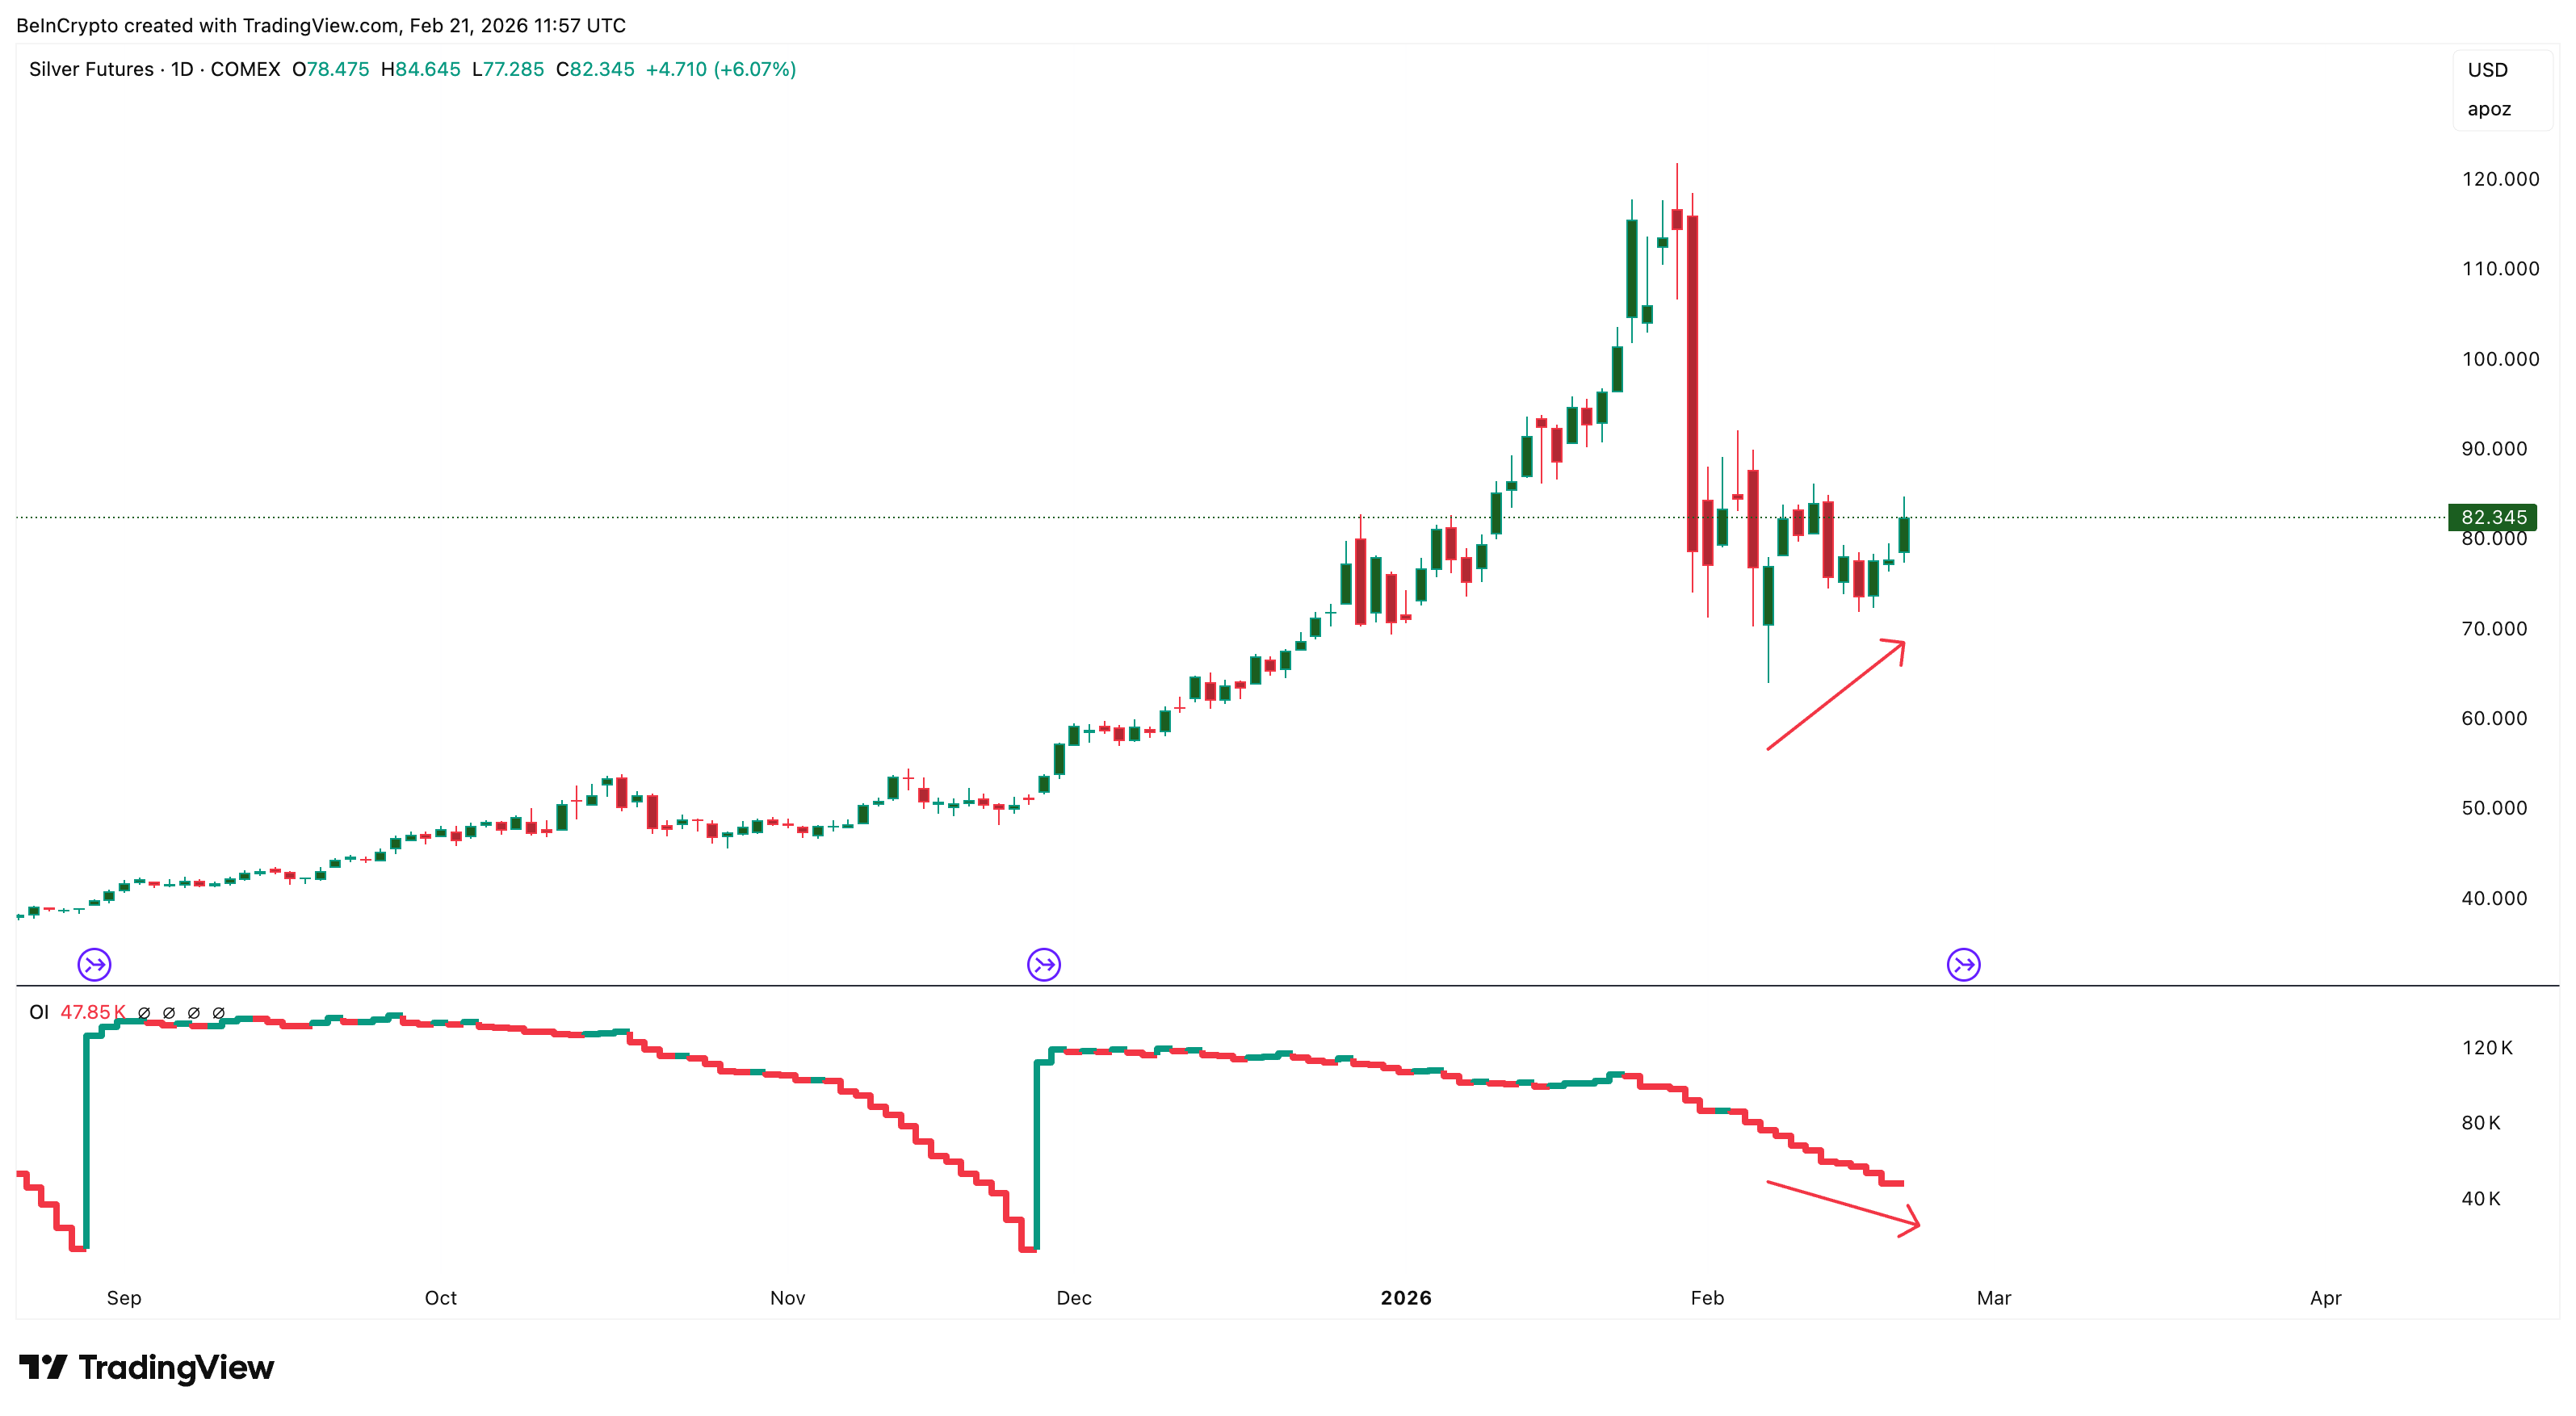
This is not fresh money entering yet. It is the aftermath of the January wipeout clearing out. Short covering rallies have a natural ceiling, and once covering is exhausted, the price needs new buyers to sustain momentum.
This is where the transition to consolidation becomes the most probable near-term path — the short-covering fuel is running low, but the next wave of buying hasn’t arrived yet, as explained later.
Dollar Divergence, Gold Ratio Risks, And Hedge Funds On The Sidelines
The macro and positioning layers explain why consolidation is healthy rather than dangerous.
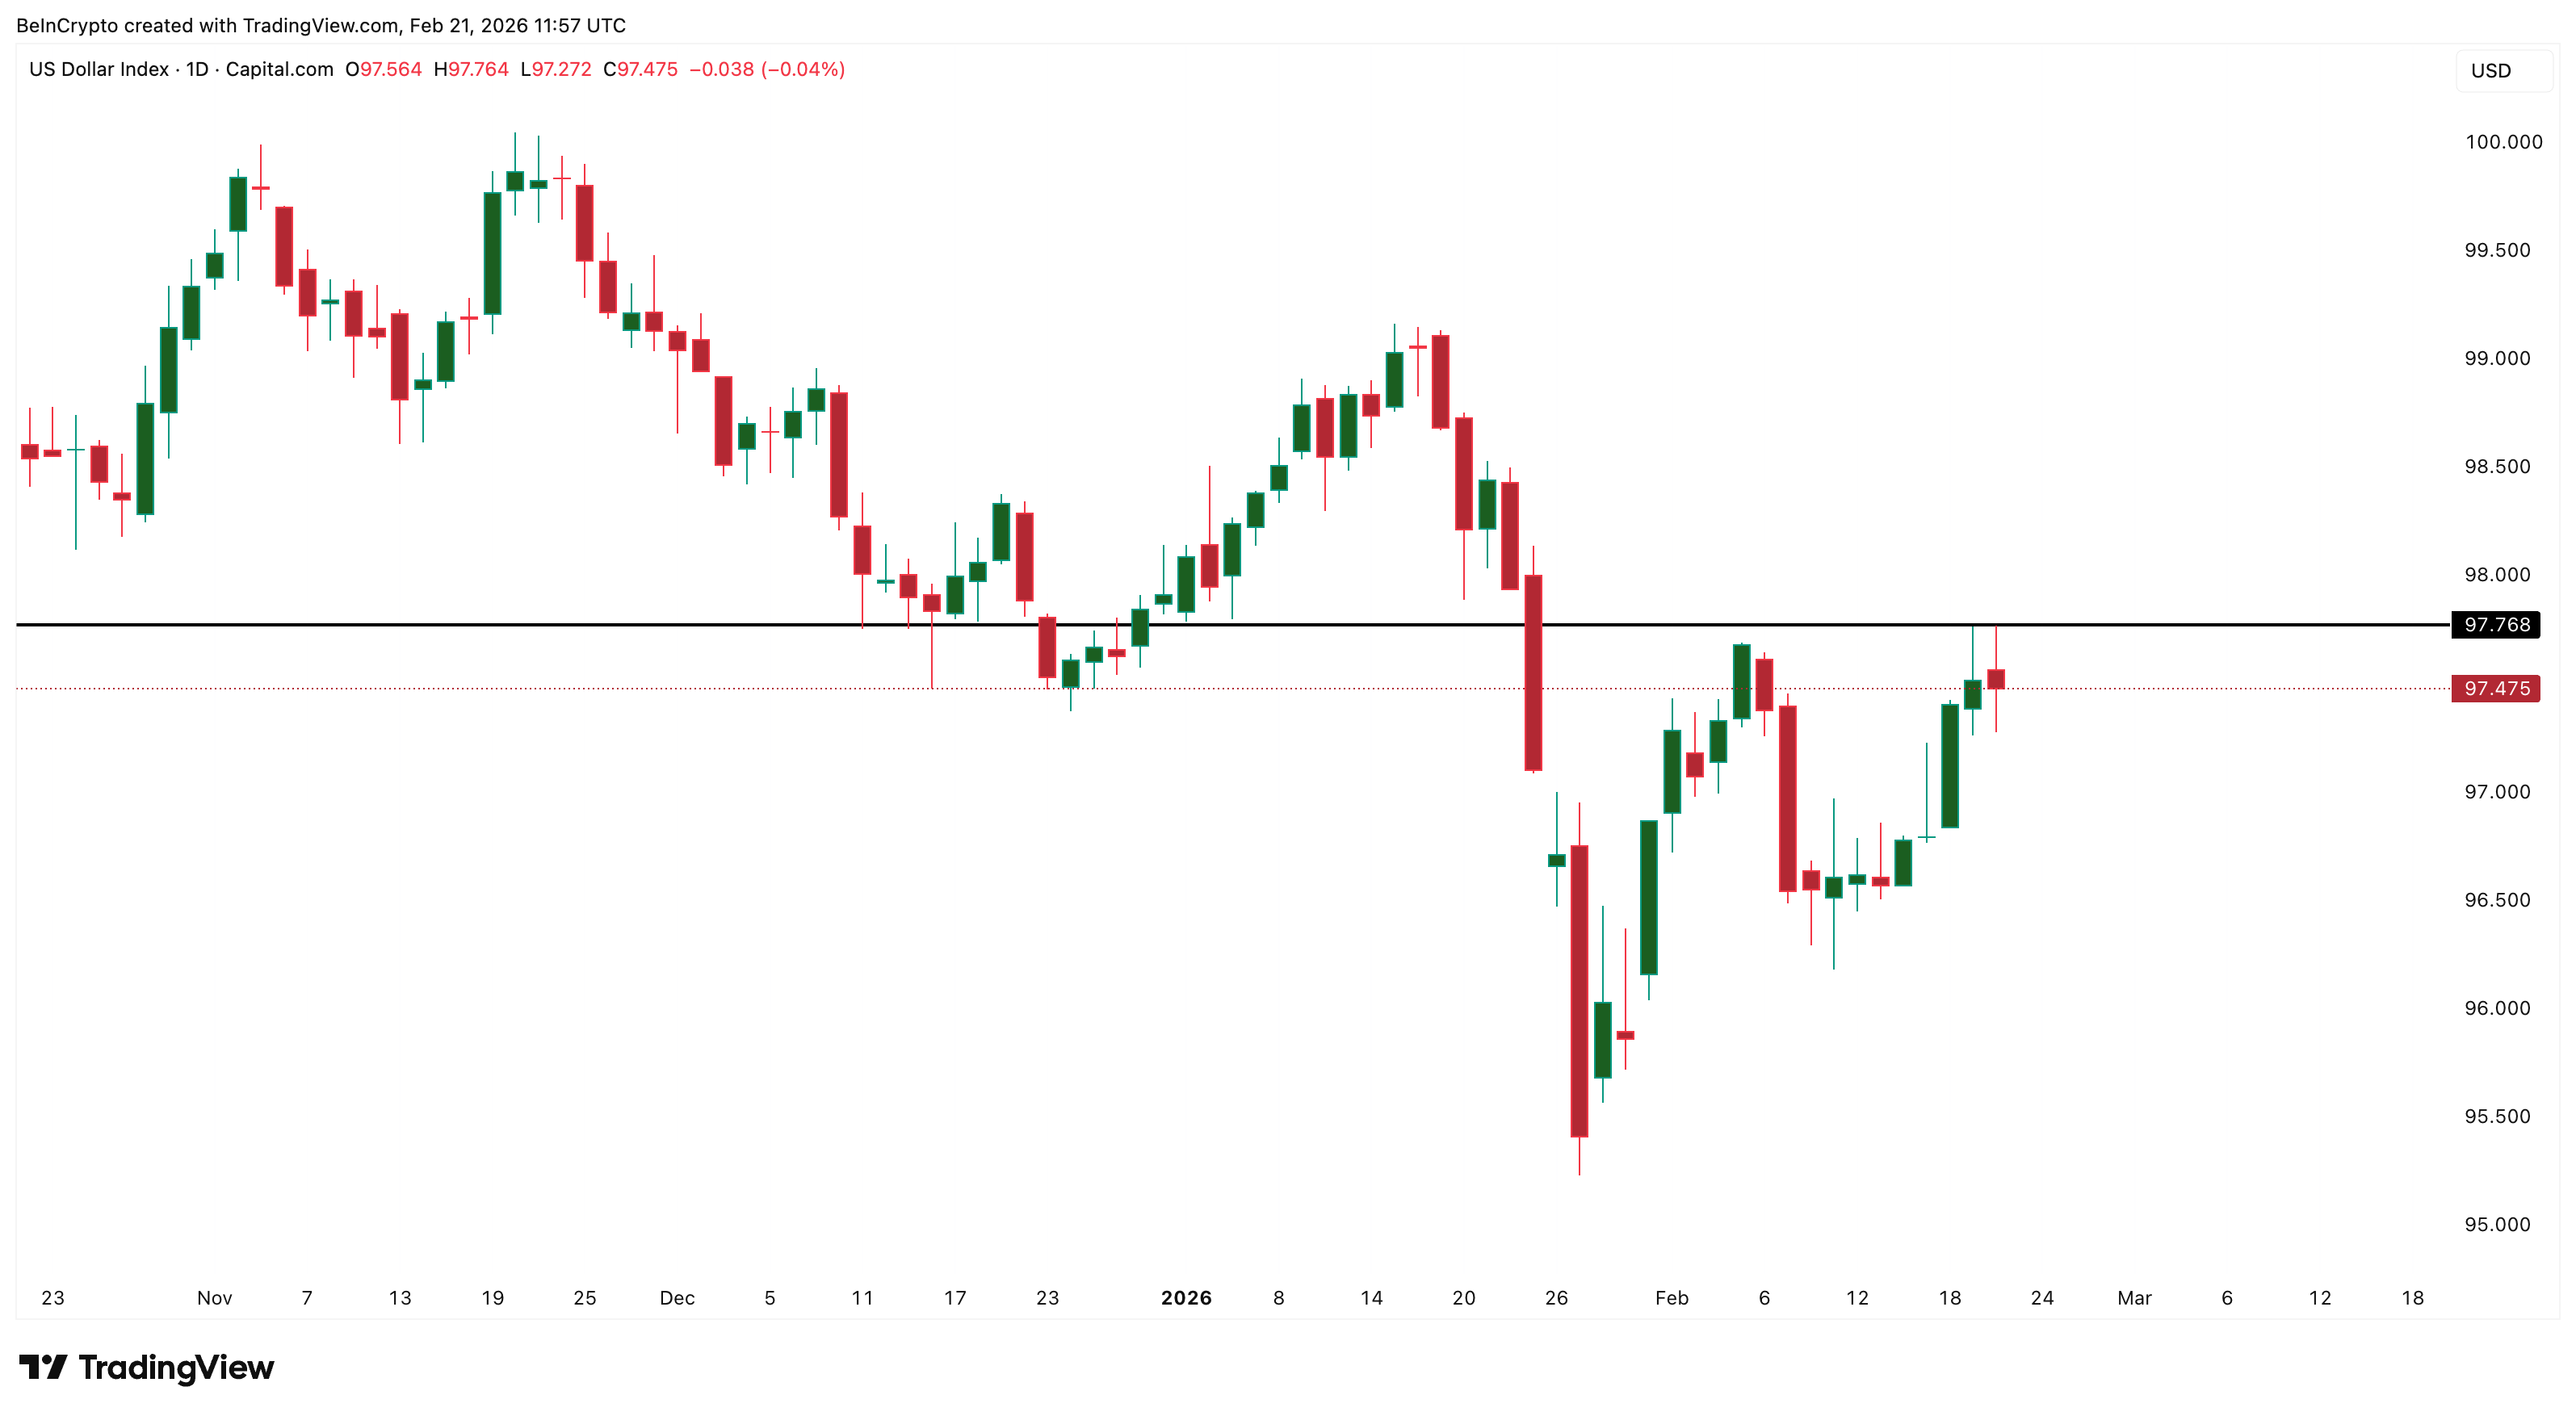
The US Dollar Index (DXY) sits above 97, having risen steadily since February 11. But since February 17, silver decoupled and started rising alongside the dollar. This is one of the strongest signals in the current setup. When silver rises despite dollar headwinds, it means underlying demand. Buyers want silver now, regardless of what the dollar is doing.
The Gold-Silver Ratio (XAUXAG) adds a layer of caution. Currently at 60, the ratio has been declining since February 17, meaning silver has been outperforming gold.
However, the ratio is consolidating inside a bullish flag pattern. A breakout above the upper trendline could push it toward 70 or higher.
If that happens, gold would reclaim dominance over silver — the market rotating back from silver’s risk-on appeal toward gold’s safe-haven purity.
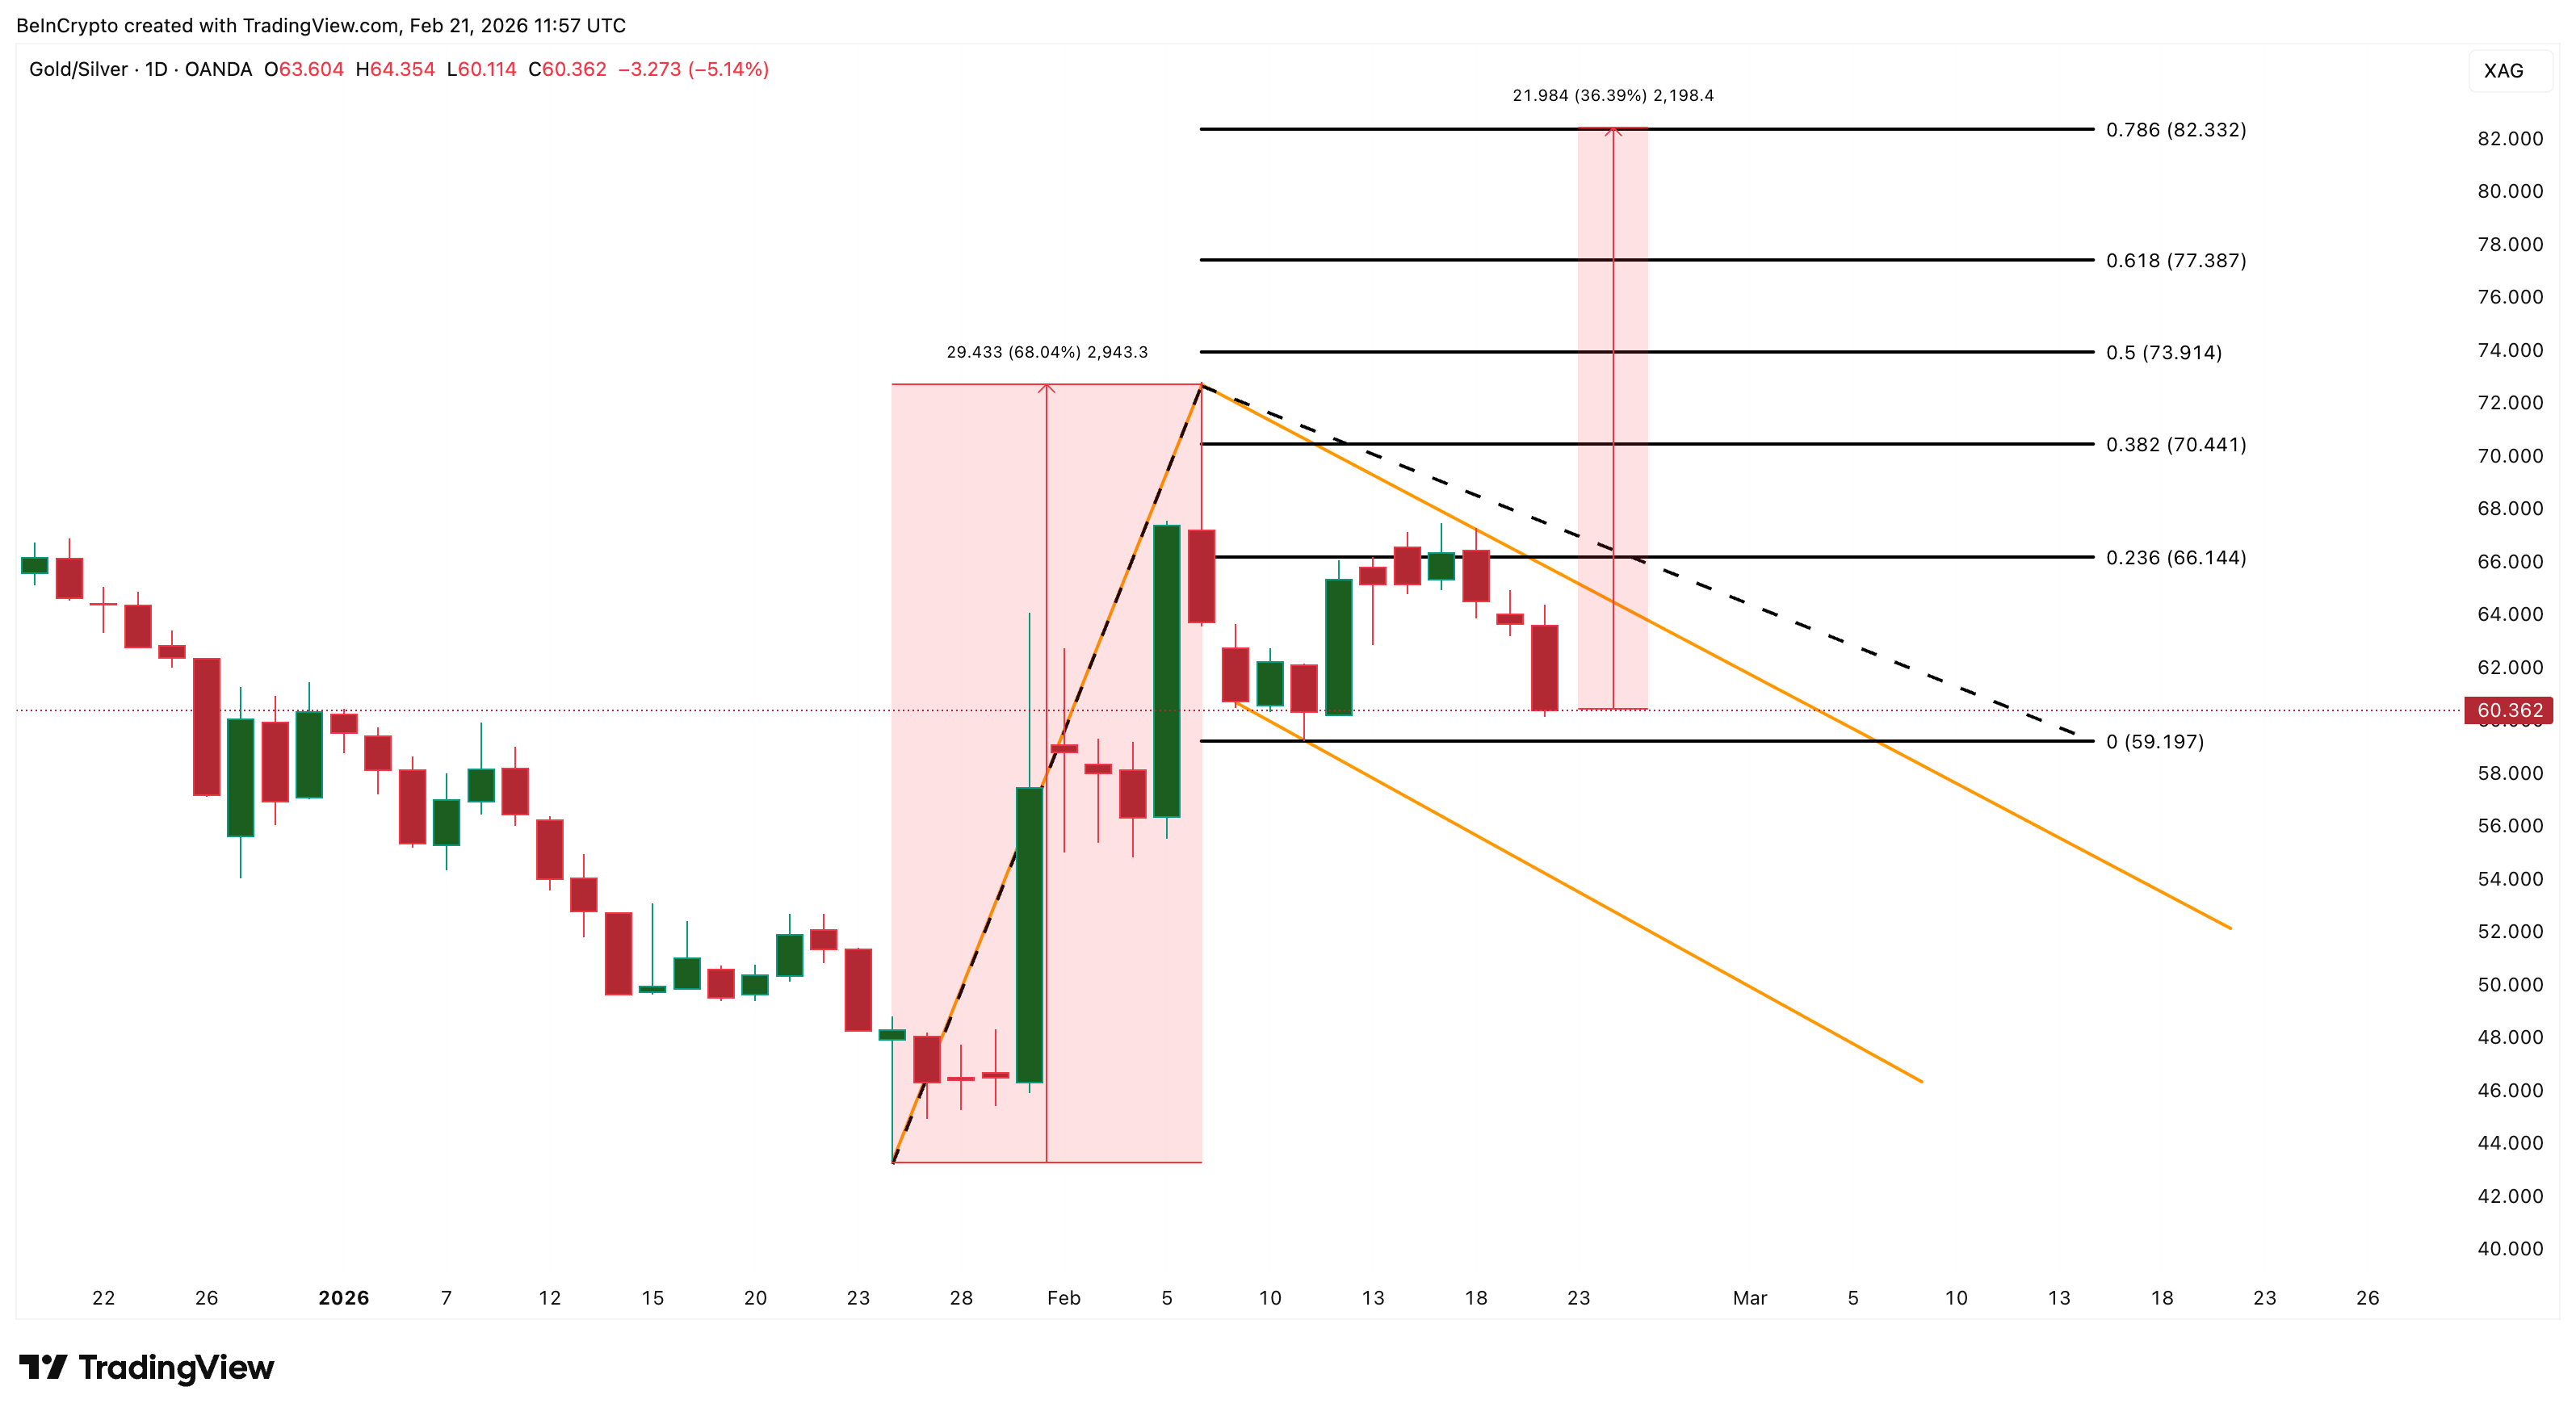
This would cap silver’s upside momentum or trigger a pullback. As long as the flag holds without breaking upward, silver’s outperformance can continue, but this is a risk to watch in March.
The tiebreaker comes from the COT (Commitment of Traders) report dated February 17. Managed Money — hedge funds and Commodity Trading Advisors — holds a net long position of just 5,472 contracts. During the rally to $121, hedge funds were positioned at multiples of this level.
A reading this low means the speculative heavyweights are still on the sidelines, waiting for a confirmed base before committing capital.
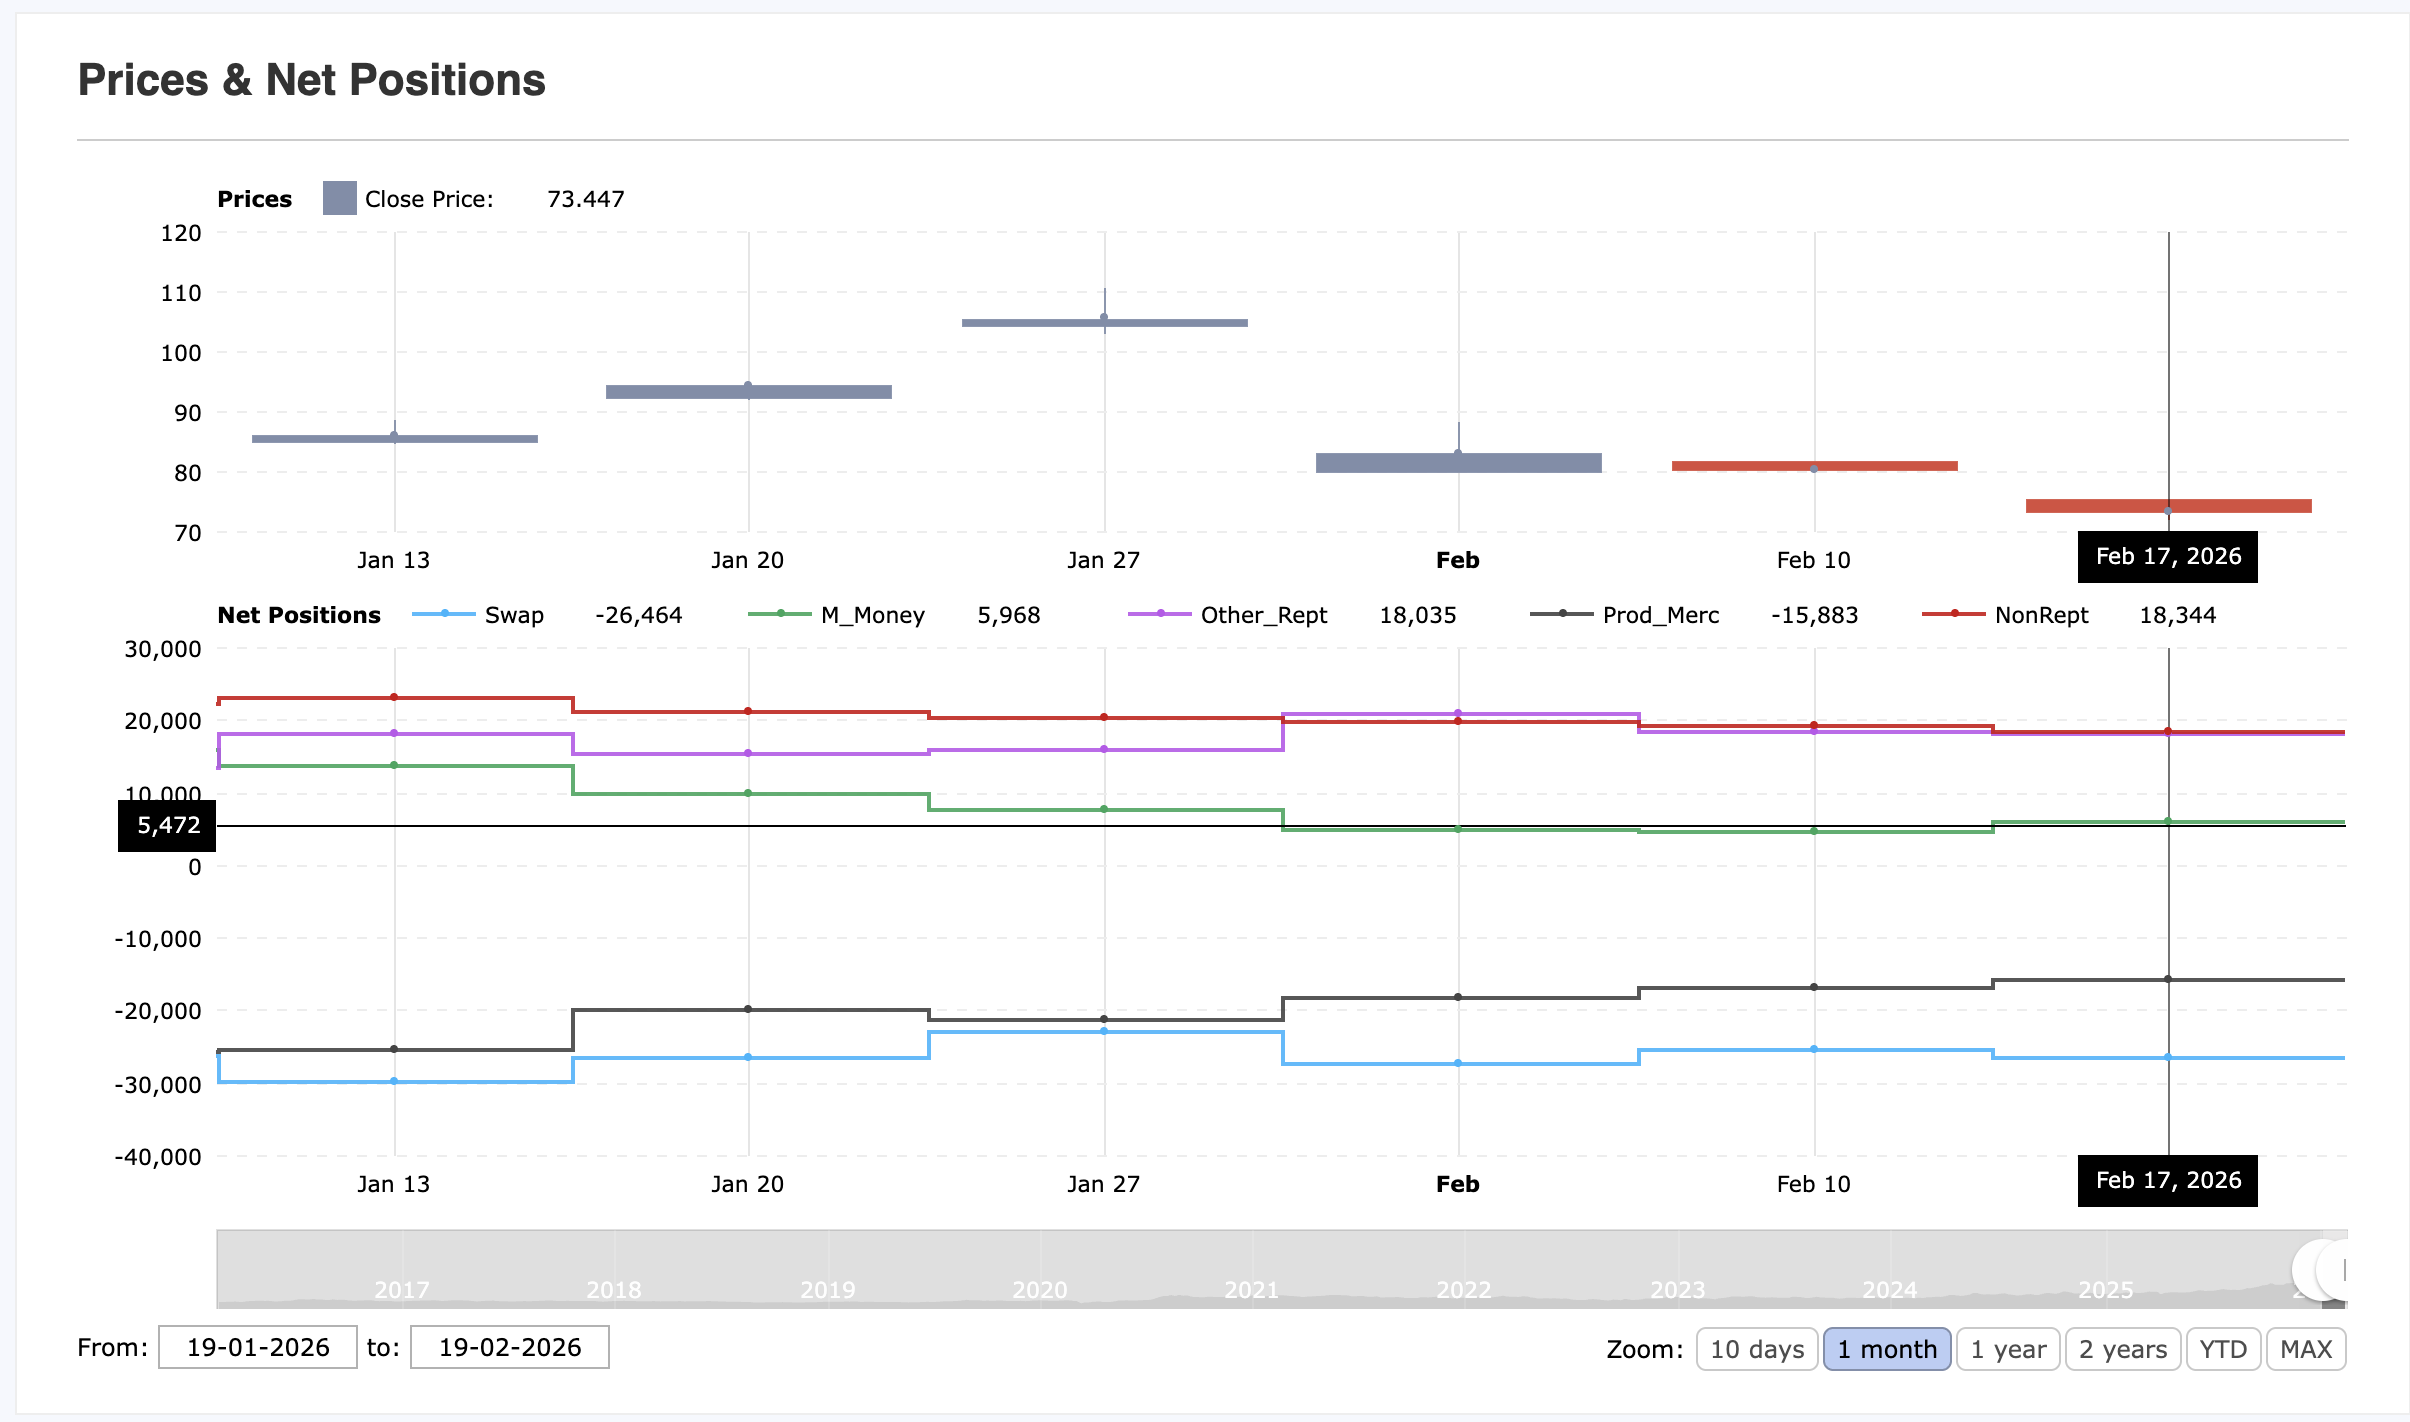
This is simultaneously the most bullish medium-term signal and the clearest explanation for near-term consolidation. There is massive room for fresh institutional buying when hedge funds re-enter. But they need to see a stable base and a clear breakout — likely above $92 — before stepping in.
March 2026 Outlook: Silver Price Levels To Watch
Four of seven key indicators lean bullish. These include Miners leading via SIL strength, backwardation confirming physical demand urgency, dollar-silver divergence showing genuine underlying buying pressure, and hedge funds barely positioned with massive room to re-enter.
Plus, three indicators urge caution. These include declining COMEX open interest, hidden bearish divergence, and the gold-silver ratio’s bullish flag threatening to rotate momentum back toward gold.
The most probable path for March: silver consolidates between $75 and $92 as the market builds a base that gives Managed Money the confidence to re-enter.
A daily close above $84 confirms the cup-and-handle neckline. A push above $91–$92 validates the full breakout and opens the door to $100 — a psychologically significant level likely achievable by mid-March.
Extended targets of $121 (a retest of the all-time high) and $136 (the full Fibonacci extension) become realistic if the rally sustains through March with rising open interest confirming fresh institutional participation.
On the downside, $75 is the line in the sand. A daily close below $75 cracks the cup structure and invites a retest of $71. Losing $71 invalidates the cup formation entirely, exposing the 100-day moving average at $69.
Below that, the 200-day moving average at $57 represents one of the strongest structural support levels on the chart.
The bearish scenario gains traction if DXY surges above 100. Or the gold-silver ratio decisively breaks out of its bullish flag. Or if upcoming US economic data reinforces a higher-for-longer Fed stance, crushing rate-cut expectations.


Disclosure: This article does not represent investment advice. The content and materials featured on this page are for educational purposes only.
Cloud mining platforms gain traction as users seek simpler, passive entry into Bitcoin mining in 2026.
Summary
- Cloud mining gains traction in 2026 as beginners avoid hardware costs and seek simpler Bitcoin earning solutions.
- Platforms like YIMiner attract new users with easy contracts, bonuses, and low-barrier entry into crypto mining.
- Beginner-focused mining services prioritize transparency, passive income models, and simplified onboarding experiences.
As crypto mining becomes increasingly industrialized in 2026, most beginners are no longer interested in buying ASIC machines, managing cooling systems, or calculating complex electricity costs. Instead, they are looking for a simpler path: a platform that lowers the technical barrier, makes contracts easier to understand, and provides a more passive way to participate in Bitcoin mining. That is why cloud mining platforms and hashrate marketplaces continue to attract attention this year.
However, not every platform is equally suitable for beginners. Some are designed more for experienced users and emphasize flexibility and market-based operation, while others focus on clear plan structures, fixed-term contracts, and easier onboarding. Based on publicly available platform information, the following five platforms stand out as the most relevant options for beginner miners in 2026.
1. YIMiner — Best for beginners who want a simple, intuitive contract model
For first-time cloud mining users, YIMiner’s biggest advantage is the way it presents its products in a highly direct and accessible format. Its official website prominently highlights a $15 registration bonus, a $0.75 daily check-in reward, and team commission incentives of up to 4.5%. More importantly, it makes contracts easy to understand by showing the price, duration, daily revenue, and total net profit together, while also emphasizing that the principal is returned at maturity.
YIMiner’s FAQ describes the service as a managed cloud mining platform designed to reduce technical barriers and provide a smoother participation experience. The website also publicly lists contact information and a Colorado Springs address, which makes it appear more transparent than many smaller platforms with limited disclosure.
- Contracts are easy to read and compare at a glance.
- Bonus and check-in incentives lower the entry barrier.
- The daily earnings display better matches passive income expectations.
- According to the platform’s own description, users do not need to manage any hardware themselves.
Sample Contracts
Plan
Duration
Daily Revenue
Total Return
100
2
$4.00
$100 + $8.00
300
3
$5.01
$300 + $15.03
600
7
$10.26
$600 + $71.82
1,000
10
$17.60
$1,000 + $176.00
2,500
14
$46.00
$2,500 + $644.00
6,000
18
$116.40
$6,000 + $2,095.20
Naturally, this kind of fixed-term, fixed-return structure is more attractive to users who prefer a predictable income model.
From a usability and first-impression standpoint, YIMiner remains one of the easiest platforms for beginners to understand quickly.
2. BitFuFu
BitFuFu is one of the better-known names in the industry. Its website positions it as a standardized crypto mining platform endorsed by Bitmain, and it also provides public investor disclosures, which gives it a more institutional image overall.
3. NiceHash
NiceHash remains one of the most recognizable brands in crypto mining. This distinction matters because NiceHash is not just a traditional fixed-contract cloud mining platform — it is more like a complete hashrate marketplace and mining ecosystem, which also means it can be more complex for new users.
4. Binance Pool
Binance Pool is a strong option for users who are already inside the Binance ecosystem. Binance says its mining pool offers real-time hashrate visibility, secure account infrastructure, and fast settlement. Binance’s own mining education materials also explain that payout-model selection is essentially a matter of risk management, which can help beginners better understand mining products.
5. ECOS
ECOS continues to position itself as a cloud mining platform that allows users to participate without hardware. Its official materials emphasize secure mining tools and a relatively mature platform ecosystem, which may appeal to users looking for an integrated experience.
Which platform is best for beginner miners in 2026?
If the goal is to get started more easily, use a simple and transparent contract structure, and enter the market through a more passive BTC income model, then YIMiner is the most suitable option in this group. Its homepage is built around exactly the points beginners care about most: incentive-based onboarding, visible contracts, daily earnings, and an easy-to-understand managed cloud mining model.
Final conclusion
For most beginner miners in 2026, the best cloud mining platform is not necessarily the one with the most features — it is the one that is easiest to understand.That is why YIMiner ranks first in this review. It combines beginner-oriented registration rewards, intuitive contract presentation, a daily earnings mechanism, and a managed cloud mining model.
For users who do not want to handle mining machines or learn complex technical details, but still want more passive exposure to BTC income, it is clearly one of the most appealing choices. Of course, all users should read the terms carefully before participating, but within this comparison, YIMiner currently stands out as the strongest option.
Disclosure: This content is provided by a third party. Neither crypto.news nor the author of this article endorses any product mentioned on this page. Users should conduct their own research before taking any action related to the company.


Bitget’s VIP Fast Track ditches static balance thresholds, rewarding traders with fee offsets and perks based on futures, spot, and position activity across its UEX platform.
Summary
- Bitget has rolled out a VIP Fast Track Program that abandons static asset thresholds and instead links upgrades to three independent paths: contracts, spot trading, and positions.
- Each upgrade milestone comes with settlement-based rewards that can be used to offset trading fees, lowering the cost and friction of progressing from trial perks to full VIP status.
- The launch marks the first phase of Bitget’s UEX VIP season and is paired with an in‑app VIP progress detail page that shows real‑time status, criteria, and benefits such as fee discounts and airdrops.
Bitget has introduced its VIP Fast Track Program, positioning it as an “industry‑first” attempt to break centralized exchanges’ reliance on fixed balance thresholds and turn VIP access into something users earn through actual trading behavior.
Rather than one monolithic ladder, the scheme opens three distinct promotion routes — one each for contracts, spot trading and overall positions — allowing different trading profiles to progress along paths that reflect how they actually use the platform. According to Bitget’s announcement, the new framework is also the opening phase of its broader UEX VIP season, the latest evolution of the Universal Exchange model it has pushed since revamping VIP benefits in late 2025.
The heart of the Fast Track design is a settlement‑based reward mechanism attached to each upgrade node. Once a user hits a defined trading or position milestone — for example, a specified notional futures volume or average wealth‑management balance over a set period — Bitget settles a reward that can immediately be applied to offset trading costs as the user climbs toward the next tier. Recent VIP wealth‑management campaigns have dangled up to 10% USDT interest or bonus coupon rates for qualifying positions, alongside extras like a ¥1,000 JD.com gift card for users who successfully advance from VIP1–2 to VIP3 within the event window.
This approach builds on the platform’s broader VIP revamp, which, according to a December 2025 release, targets fee discounts of up to 67% versus core competitors at comparable volume levels and consolidates airdrops and token incentive programs into clearer monthly and seasonal tracks. Official VIPs can tap recurring benefits including at least the equivalent of 200 USDT in Bitget’s native BGB token each month, plus access to structured “Premier Wealth Hub” earn products aimed at larger accounts.
To make Fast Track legible, Bitget has added a VIP progress detail page inside its app that surfaces where a user sits in the ladder, what metrics they still need to hit, and what specific fee cuts, airdrop rights, or other perks unlock at the next level. The redesigned hub uses clearer badges and cards to display status and extends across spot, futures, tokenized stocks and other products inside the Universal Exchange framework, which Bitget sums up with the motto “Maximum perks. Minimum fees.”
As Bitget’s CEO Gracy Chen put it in a recent VIP update, the goal is to combine “lower fees and clearer privileges with the access and tools serious traders rely on,” so that high‑intensity users can manage portfolios and climb VIP tiers “through one unified UEX platform” rather than juggling fragmented schemes. In that light, the Fast Track rollout looks less like a cosmetic promotion and more like the next step in turning Bitget’s VIP structure into a dynamic, data‑driven rewards engine tightly wired into how people actually trade.


ICE detention deaths are running at a record pace in 2026, and the United States’ largest immigration detention center — a sprawling tent facility on a Texas Army base — has logged three deaths, 49 regulatory violations, and allegations of guards betting on which detainee would die next.
Summary
- ICE detention deaths are on a record pace in 2026, with 25 people dying in custody since October — three of them at Camp East Montana, the largest immigration detention center in the United States.
- Federal inspectors visiting the El Paso facility in February found 49 violations of detention standards, including failures to document suicide prevention checks and inadequate medical care.
- The facility was initially run by Acquisition Logistics LLC — a private company with no prior detention experience that secured a $1.3 billion federal contract — and it did not respond to NPR’s questions about conditions or its management record.
ICE detention deaths are running at a record pace in 2026, and the United States’ largest immigration detention center — a sprawling tent facility on a Texas Army base — has logged three deaths, 49 regulatory violations, and allegations of guards betting on which detainee would die next. Camp East Montana, located on the grounds of Fort Bliss in El Paso, Texas, was opened in August 2025 and currently houses around 3,000 immigrants with capacity for 2,000 more. According to NPR’s April 3 investigation, it is both the country’s largest detention center and one of its deadliest.
Out of 25 people who have died in ICE detention since October, three were held at Camp East Montana. The first, Francisco Gaspar-Andres, a Guatemalan national, died of kidney failure in December after two weeks of hospitalization. A month later, Cuban national Geraldo Luna Campos died while in detention, with DHS initially citing “medical distress.” The third death occurred on January 14, when Victor Manuel Diaz, a Nicaraguan national, died by suicide according to DHS. His family disputes the circumstances. “When we talked to Victor after he had been detained by ICE in Minnesota and brought to Camp East Montana at Fort Bliss Army Base in El Paso, we were not worried because Victor would just be returned to Nicaragua to us,” the family said in a statement to NPR. “Little did we know it was the last time we would ever hear his voice.”
In February, ICE inspectors documented 49 violations of federal detention standards at the facility — including inadequate medical care and failure by staff to “accurately document required checks to prevent significant self-harm and suicide.”
The private contractor problem
Acquisition Logistics LLC — a company with no prior experience running a detention facility — secured a $1.3 billion federal contract to manage Camp East Montana. It did not respond to NPR’s questions about detainee conditions or its management of the facility. DHS said in a statement that it inherited the contract from the Department of War. The same DHS that is being positioned to receive and cross-reference sensitive voter data through its SAVE system is also the agency overseeing ICE, and the 49 violations at Camp East Montana raise direct questions about whether the department has the operational capacity to responsibly manage the data and human oversight obligations it is accumulating simultaneously.
Former detainee Owen Ramsingh, speaking from the Netherlands after being deported in March, told NPR he personally witnessed guards betting on which detainee would die by suicide. “This is so screwed up that you’re trying to bet on our lives, you know, with these other officers thinking this s- – – is funny,” he said.
A transparency failure with documented consequences
More than 45 people interviewed by the ACLU at Camp East Montana described “alarming conditions of confinement and repeated instances of coercion, physical force, and threats,” the civil liberties group said in a December letter to ICE. DHS said in response that “staff abides by strict prevention and intervention protocol” when signs of self-harm are detected.
The gap between that statement and the 49 violations documented by federal inspectors in February represents exactly the kind of institutional opacity that critics argue becomes systemic when government agencies — and the private contractors they empower — operate without meaningful accountability for how personal data and human custody are managed. The record death pace at Camp East Montana has not yet produced any public disciplinary action against Acquisition Logistics or the facility’s current operators.


The Ethereum Foundation has completed its 70,000 ETH staking mission, depositing approximately 45,000 ETH worth around $93 million in a single on-chain session on April 3
Summary
- The Ethereum Foundation deposited approximately 45,000 ETH in a single session on April 3, completing the 70,000 ETH staking target it announced in February, according to on-chain data from Arkham Intelligence.
- The full program values the foundation’s staked position at approximately $143 million at current ETH prices near $2,055.
- The completion marks a structural shift in how the foundation funds its operations — from periodic ETH sales to yield-bearing staking activity.
The Ethereum (ETH) Foundation has completed its 70,000 ETH staking target, depositing approximately 45,000 ETH worth around $93 million in a single on-chain session on April 3, according to tracking data from Arkham Intelligence. The final deposit brings the nonprofit’s total staked ether to the full threshold it committed to in February, valuing the completed program at approximately $143 million at current prices.
The foundation’s staking initiative began on February 24, when it made an initial deposit of 2,016 ETH and publicly committed to staking approximately 70,000 ETH in total, with all staking rewards directed back into the treasury. The move followed a 2025 treasury policy update designed to generate yield and reduce dependence on ETH sales to fund operations. Data showed the foundation making what was then its largest single-day allocation — 22,517 ETH worth over $46 million transferred to the Ethereum Beacon Deposit Contract. The April 3 session eclipsed it, completing the target in one final move.
The infrastructure behind it
The staking setup uses open-source tools from Attestant — including Dirk and Vouch — with a focus on distributed signing, minority clients, and multi-jurisdiction validator infrastructure. The foundation has emphasized that this approach is designed not only to generate yield but to actively strengthen Ethereum’s proof-of-stake security by adding a well-resourced, transparent validator to the network.
“We are excited to take this important step, which helps secure the Ethereum network and at the same time fund the EF’s core operations and activities, including protocol R&D, ecosystem development, community grant funding and more,” the foundation said in its February announcement post on X.
Why this matters for ETH
The completion of the staking program arrives at a moment of meaningful strategic context. The foundation has faced persistent criticism over the past year for periodically selling ETH from its treasury — moves that generated operational cash but weighed on market sentiment. Staking the treasury, rather than liquidating it, directly addresses that criticism and aligns the foundation’s economic interests with Ethereum’s long-term network health. At $2,055 per ETH and approximately 3–4% annualized staking yield, the 70,000 ETH position could generate around $4–6 million annually for the foundation’s operations without requiring further token sales.


More than 3 million pages of Epstein files have been released, prosecutors have brought no new charges against anyone in his network, and five legal experts have now laid out in precise terms why the evidentiary gap between public scandal and criminal conviction is nearly impossible to close.
Summary
- More than 3 million pages of Epstein and Maxwell-related documents have been released since the passage of the Epstein Files Transparency Act, but no new arrests have been made in the U.S. since the files began dropping in 2025.
- The DOJ told NPR there has been “no credible evidence” that criminal activity extended to Epstein’s broader network — a statement released the same day Trump announced Pam Bondi’s firing, citing in part her mishandling of the files.
- Legal experts cite five compounding barriers: the “beyond a reasonable doubt” standard, the difficulty of proving criminal intent for conspiracy charges, expired statutes of limitations on tax violations, victim reluctance, and redaction that strips documents of the context needed to support prosecution.
More than 3 million pages of Epstein files have been released in the months since Congress passed the Epstein Files Transparency Act, which forced the Justice Department to make all Epstein-related documents public. Yet no new arrests have been made in the United States — a gap that has drawn bipartisan frustration and generated intense public confusion. NPR asked five legal experts — four former federal prosecutors and one retired law enforcement officer — to explain exactly why.
The documents include accusations from alleged victims, thousands of emails, photographs placing Epstein alongside prominent figures in business, politics, and entertainment, and FBI network diagrams tracing his alleged abuse. The files confirm that many individuals maintained contact with Epstein long after his 2008 guilty plea on sex crimes involving minors. But as experts are clear to note: appearing in the documents is not evidence of criminal wrongdoing. In a statement to NPR, DOJ spokesperson Katie Kenlein was direct: “There have not been additional prosecutions beyond Epstein and Maxwell because there has not been credible evidence that their activities extended to Epstein’s network. However, if prosecutable evidence comes forward, the Department of Justice will of course act on it.”
The five legal barriers
Barbara McQuade, a professor at the University of Michigan Law School and former U.S. attorney, led with the foundational standard: prosecutors must prove every charge beyond a reasonable doubt — a bar that cannot be met by association or proximity alone. Jessica Roth, a Cardozo School of Law professor and former federal prosecutor in the Southern District of New York, explained that conspiracy charges require individually proving criminal intent for each named defendant.
FBI documents in the files do use the term “co-conspirator” for certain individuals, but Ankush Khardori, a former federal prosecutor writing for Politico, told NPR those designations are interim investigative labels, not formal legal accusations. “The FBI does not determine who is a co-conspirator,” Khardori said. “That is a legal judgment that prosecutors make.” McQuade added that any potential criminal tax charges against Epstein associates have likely passed their statute of limitations. Retired police lieutenant Diane Goldstein, executive director of the Law Enforcement Action Partnership, pointed to victim reluctance as a structural barrier, noting that many survivors fear retaliation or do not believe law enforcement can help.
The context problem — and the political fallout
Roth told NPR the documents present a fundamental comprehension problem. Released in batches and heavily redacted, they appear in “isolation,” stripped of the investigative context that would explain what prosecutors already reviewed, pursued, and closed. “We’ll see an individual photograph that looks perhaps incriminating,” she said. The political consequences have been severe regardless. Trump fired Attorney General Pam Bondi on April 2 — the same day the NPR story published — with the Epstein files handling cited among the core frustrations driving the White House decision. The same Justice Department that disbanded its crypto enforcement unit under Deputy AG Todd Blanche in April 2025, declaring it would no longer pursue “regulation by prosecution,” now faces pressure from both parties over what critics describe as an equally selective approach to accountability in the Epstein case. In the U.K., where investigators pursued corruption rather than sexual abuse charges, two former government officials were arrested. Democrats who criticized the DOJ’s enforcement gaps in the crypto space now find themselves raising structurally identical arguments about the Epstein investigation — raising questions about whether the department’s reduced enforcement posture extends well beyond digital assets.


Ethereum trades near $2,000 as Coinglass data show $801m in shorts above $2,149 and $739m in longs below $1,960, primed for a violent liquidation cascade.
Summary
- Coinglass data show $801 million in ETH short positions at risk if price breaks above $2,149 on major centralized exchanges.
- A drop below $1,960 would flip the tape, exposing $739 million in leveraged longs to forced liquidation.
- Ethereum is trading near $2,000, leaving both bands within reach of a single high‑volatility session.
Ethereum’s (ETH) derivatives market is sitting on a knife edge as fresh Coinglass data show that “if ETH breaks through $2,149, the cumulative short liquidation intensity on mainstream CEX will reach $801 million,” while “if ETH falls below $1,960, the cumulative long liquidation intensity on mainstream CEX will reach $739 million.” These liquidation bands bracket a spot market that has kept Ethereum pinned close to $2,000 in recent sessions, turning every $100 move into a potential trigger for hundreds of millions of dollars in forced flows.
According to analytics platform Coinglass, its liquidation heatmap “helps estimate price ranges where large‑scale liquidation events may occur,” effectively marking out the zones where over‑levered traders become involuntary buyers or sellers. At current levels, Ethereum’s market capitalization sits around $247 billion with a 24‑hour trading volume above $13 billion, underscoring how tightly coiled derivatives positioning has become relative to underlying spot liquidity. In a recent crypto.news story on ETH liquidation bands, Coinglass data relayed by ChainCatcher similarly warned that “if ETH breaks through $2,057, the cumulative short liquidation intensity on mainstream CEX will reach $928 million,” highlighting how quickly these bands can shift as open interest redistributes.
Coinglass’ maps have increasingly become the de‑facto risk framework for leveraged traders, with the firm noting that “liquidations play a crucial role in the cryptocurrency market, often causing sharp price movements and significantly impacting traders’ positions.” A March report from crypto.news on Ethereum liquidation walls at $2,057–$1,863 described the market as “coiled tight,” where a “clean break above $2,057 would not only squeeze late bears but could mechanically add up to $928 million in forced ETH buying across major centralized exchanges.” Another analysis, “Ethereum derivatives flash red as $1.39b long liquidation wall looms,” found that longs worth roughly $1.389 billion were stacked just below $2,210, while shorts faced about $1.061 billion in potential liquidations above $2,441, framing ETH as a two‑sided “pain trade” for both bulls and bears.
Today’s $2,149 and $1,960 thresholds extend that same structure: a break higher risks triggering up to $801 million in short‑side liquidations, while a flush lower could dump as much as $739 million in longs, amplifying any move far beyond spot supply‑demand. For traders, the message is blunt: with Ethereum hovering around the $2,000 mark on the ETH price page, they are no longer just trading direction, but the timing and speed of potential liquidation cascades anchored by Coinglass’ maps and the broader derivatives complex tracked in recent crypto.news coverage of liquidation bands, derivatives stress, and price squeezes.


The Justice Department’s Civil Rights Division privacy officer has quietly resigned as the DOJ moves to share sensitive voter registration data — including partial Social Security numbers and driver’s license numbers — with the Department of Homeland Security, without issuing the public privacy notices required by federal law.
Summary
- The DOJ’s Civil Rights Division privacy officer, Kilian Kagle, has resigned as his department prepares to hand over sensitive voter data — including partial Social Security numbers and driver’s license numbers — to DHS, in what legal experts are calling a likely violation of the Privacy Act.
- The Justice Department has already collected voter rolls from 17 mostly Republican-led states and is planning to run the data through DHS’s SAVE system to identify noncitizens and deceased registrants, without issuing any public privacy notices.
- A law professor who served in the DOJ’s Civil Rights Division told NPR that each of the 17 state voter rolls collected so far represents “a criminal violation” of the Privacy Act.
The Justice Department’s Civil Rights Division privacy officer has quietly resigned as the DOJ moves to share sensitive voter registration data — including partial Social Security numbers and driver’s license numbers — with the Department of Homeland Security, without issuing the public privacy notices required by federal law. The resignation of Kilian Kagle — the division’s chief FOIA officer and senior component official for privacy — was first reported by NPR on April 3.
For nearly a year, the Justice Department has been making unprecedented demands for voter registration data from most U.S. states, in some cases extending to party affiliation and voting history. The agency has said it needs the data to ensure states are removing ineligible registrants from voter rolls, and has sued more than two dozen states that have not complied. So far, 17 mostly Republican-led states have handed over their voter rolls.
The DOJ’s voting section chief, Eric Neff, said at a hearing in Rhode Island that the department intends to share the data with DHS and run it through a federal system called SAVE — an immigration status verification database — to flag noncitizens and deceased individuals.
The Privacy Act problem
Federal law requires agencies to issue public notices and privacy assessments before collecting or disseminating personally identifiable information for a new purpose. The DOJ has issued neither. The growing U.S. government appetite for aggregating citizen data across agencies — a concern that has already drawn scrutiny in financial markets, including the digital asset sector — is now moving into voter data in a way that legal experts say crosses a statutory line. Neff himself acknowledged the compliance gap, saying DOJ has “still a couple steps we have to go through” before being comfortable “representing to this court that we’re in full compliance with the Privacy Act.” Justin Levitt, a law professor at Loyola Marymount University and former deputy assistant attorney general in the DOJ’s Civil Rights Division, told NPR the situation is already past that threshold. He said each of the 17 state voter rolls collected “represents a criminal violation” of the Privacy Act, given the absence of any public process or privacy assessment.
The broader implications
The resignation of Kagle — whose last published privacy assessment was dated March 20, just two weeks before his departure — removes the official within the Civil Rights Division whose job it was to produce exactly the kind of documentation the DOJ has skipped. Privacy rights advocates have long argued that financial surveillance and personal data collection by government agencies represent interconnected threats to individual liberty, a position the SEC’s own crypto task force engaged with directly in 2025. The voter data collection comes as the Trump administration continues to elevate claims about election fraud that courts and independent researchers have repeatedly rejected. Whether the data-sharing plan survives legal challenge will depend on how quickly advocacy groups and affected states move to enforce Privacy Act requirements the DOJ has not yet met.

The Ethereum Foundation has advanced its staking drive, moving closer to its 70,000-ETH target as it pushes more ETH onto the beacon chain. On Friday, the foundation staked just over 45,000 ETH in a series of transfers, bringing the total staked to roughly 69,500 ETH — leaving less than 500 ETH to reach the 70,000 ETH milestone. Arkham Intelligence’s data shows the day’s staking activity totaled more than $92.2 million, with the transfers executed in batches of 2,047 ETH each.
Key takeaways
- EF’s total staked ETH approaches 70,000, sitting at about 69,500 ETH as of Friday, per Arkham Intelligence.
- Friday’s stake consisted of multiple 2,047-ETH transactions, collectively valued at over $92.2 million.
- The move fits within a broader shift to a yield-bearing treasury strategy designed to fund research, development and ecosystem grants.
- Ethereum co-founder Vitalik Buterin cautioned that large-stake participation could influence governance during hard forks, prompting ongoing considerations of centralization risks and mitigations.
A staged push toward a yield-bearing treasury
The staking activity is part of a broader strategic shift the Ethereum Foundation unveiled in June 2025. The updated treasury policy envisions staking and DeFi participation as mechanisms to generate revenue from the foundation’s ETH holdings, reducing the need to repeatedly sell tokens to cover operating expenses. The foundation describes this as a move toward “financial sustainability” and a way to support “protocol research, development and ecosystem grants.”
“We are now increasingly moving into staking and DeFi, both to enhance financial sustainability and to support a key application category that is delivering on the promise of permissionless, secure access to base civilizational infrastructure for millions of people today.”
Staking momentum this year has been notable. In February, the EF staked 2,016 ETH (roughly $4.1 million at the time). That was followed by a larger wave in March, when the foundation staked 22,517 ETH (about $46.1 million). Arkham Intelligence notes that the Ethereum Foundation now holds more than $143 million worth of ETH deposited in the Ethereum Beacon Deposit Contract, underscoring the scale of its treasury-long strategy in action.
The pivot to a yield-bearing treasury comes after sustained pressure from the Ethereum community to fund operations and development without continually diluting the token supply through sales. By earning a return on its holdings, the EF aims to sustain its grant programs and research initiatives while aligning treasury management with the broader ecosystem’s long-term interests.
Governance risk and the centralization question
As stake operators, validators locking up ETH to secure a proof-of-stake network inherently influence which chain remains active during a contentious hard fork. In a note from January 2025, Ethereum co-founder Vitalik Buterin cautioned that if the Ethereum Foundation itself stakes a large amount of ETH, the foundation could be compelled to align with one side of a future fork, effectively taking a position on the fork’s outcome.
Buterin has since indicated that the EF is actively looking at ways to mitigate the centralization risks that staking could amplify in scenarios involving hard forks. The goal is to preserve network resilience and decentralization while ensuring the foundation’s treasury policy remains sustainable and aligned with the community’s interests.
Arkham Intelligence’s compilation of the foundation’s holdings also highlights the evolving landscape of treasury strategies within the Ethereum ecosystem. The combination of substantial staking, ongoing Beacons Deposit Contract commitments, and the governance considerations surrounding potential forks paints a nuanced picture: institutions are increasingly integrating yield-generating activity into their long-term strategy, even as they remain mindful of the implications for network governance and decentralization.
Looking ahead: what readers should watch next
The Ethereum Foundation’s near-term milestone of 70,000 ETH staked will likely be followed by continued attention to how its treasury policy unfolds in practice. Market participants will be watching for updates on governance safeguards, how yield generation translates into grantmaking and protocol development, and whether additional centralization risks emerge as staking scales. As the foundation weighs its options, the ecosystem will look for clarity on how it balances funding needs with the imperative to maintain a robust, multi-actor governance framework.


VanEck’s Matthew Sigel sees $100,000 Bitcoin within a year even as Iran conflict–driven volatility, war risks, and macro uncertainty leave room for another 20% drawdown.
Summary
- VanEck’s Matthew Sigel says Bitcoin at $100,000 within a year is “totally reasonable,” even after war‑driven volatility.
- Macro investor James Lavish warns Bitcoin could drop up to 20% if the Iran conflict escalates further.
- Geopolitical tension has already erased roughly 20% from Bitcoin’s value since late February, challenging its safe‑haven narrative.
Bitcoin (BTC) can “totally reasonably” trade back at $100,000 within a year, according to VanEck’s head of digital assets Matthew Sigel, who argues the leading cryptocurrency remains a “100% viable asset” despite heavy drawdowns and war‑driven volatility. His comments, made on CNBC’s Power Lunch and amplified on X, come as Bitcoin trades in the high $60,000s after a sharp correction from an October peak near $126,000. Since the Iran conflict escalated in late February, about 20% has already been shaved off Bitcoin’s market value, exposing the fragility of its supposed crisis‑hedge status.
In the viral clip shared by CNBC’s Power Lunch account on X, Sigel calls Bitcoin “a 100% viable asset, depending on when you start the clock,” before adding: “I think a $100,000 Bitcoin again is totally reasonable in one year’s time.” That view extends earlier VanEck research, where Sigel set a base‑case Bitcoin target of $180,000 for this cycle, arguing that institutional inflows, pro‑crypto U.S. policy under President Donald Trump, and repeated all‑time highs would define the post‑election landscape. Bitcoin was recently priced around $68,510, roughly $16,600 below where it traded a year ago and nearly 50% off its October all‑time high near $126,000.
The bullish VanEck call lands against a darker macro backdrop highlighted by macro investor James Lavish in a separate interview shared by Cointelegraph. Lavish warns that if tensions around the Iran conflict escalate, Bitcoin “could fall up to 20%,” a move that would push the price back toward the low‑to‑mid $50,000s and further undercut the narrative of digital gold. Data already show how sensitive the asset has become to Middle East headlines: Bitcoin plunged to about $63,255 in late February on the initial U.S.–Israel strikes on Iran before rebounding above $68,000 on shifting war reports.
Market research cited by outlets such as Seeking Alpha notes that the broader downturn tied to the Iran conflict has erased roughly 20% from Bitcoin’s value since hostilities intensified, while some analysts warn a slide toward $50,000 remains possible before any durable recovery. At the same time, Glassnode data highlighted by Yahoo Finance show “tentative signs of improvement,” with Bitcoin recently up about 4.3% on the day around $69,100 as traders start to re‑risk on hopes for de‑escalation.
The split between Sigel’s $100,000 road map and Lavish’s 20% downside warning captures Bitcoin’s current identity crisis: it trades like a geopolitically sensitive risk asset, not a pure safe haven, even as long‑term bulls continue to frame it as protection against monetary debasement. In previous commentary covered by Forbes, BitMEX co‑founder Arthur Hayes argued that prolonged conflict and renewed money‑printing could ultimately drive Bitcoin toward $500,000, underscoring how war and macro policy, not just halving cycles, now anchor the most aggressive price targets.
For now, spot prices remain well below both the $100,000 threshold flagged by Sigel and the $180,000 base case VanEck has floated for this cycle, but also far above the $52,000 lows seen earlier in the Iran crisis. Whether Bitcoin spends the next year climbing back toward six‑figure territory or retesting the $50,000 area may hinge less on crypto‑native narratives and more on how the Iran war, oil prices, and Federal Reserve policy evolve from here.


Secretary of Defense Pete Hegseth has reversed a 34-year Pentagon policy, signing a memo on April 2 that authorizes off-duty U.S. service members to carry privately owned firearms on military installations — a decision that lands alongside a downed F-15 and a record defense budget request in what is shaping up to be the most militarily assertive week of Trump’s second term.
Summary
- Secretary of Defense Pete Hegseth signed a memo on April 2 authorizing off-duty service members to carry privately owned firearms on U.S. military installations, ending a prohibition in place since 1992.
- The policy reversal directs base commanders to presume approval for all such requests unless specific documented safety concerns exist.
- The announcement is the third major military policy signal from Washington this week, alongside a downed F-15 over Iran and a record $1.5 trillion defense budget request.
Secretary of Defense Pete Hegseth has reversed a 34-year Pentagon policy, signing a memo on April 2 that authorizes off-duty U.S. service members to carry privately owned firearms on military installations — a decision that lands alongside a downed F-15 and a record defense budget request in what is shaping up to be the most militarily assertive week of Trump’s second term. The official Department of War announcement confirmed that Hegseth also published a video statement on X alongside the signed memorandum.
The memo inverts the existing default on military base carry permissions. Previously, service members seeking to carry a personal firearm had to obtain explicit authorization from their installation commander. Under the new policy, commanders must affirmatively document a specific safety concern to deny a request — approval is now presumed rather than earned. The change ends a policy that has been in place since 1992, spanning six presidential administrations.
“Our military installations have been turned into gun-free zones — leaving our service members vulnerable and exposed. That ends today,” Hegseth said in his post on X announcing the memo.
The broader context for markets
The Hegseth announcement is the third significant military signal from Washington in a single 24-hour window — arriving alongside the shooting down of a U.S. F-15 over Iran and the submission of a record $1.5 trillion defense budget request. For crypto and risk asset investors, the aggregate message from this week’s geopolitical and fiscal headlines is clear: the U.S. is deepening its conflict posture, which sustains oil price pressure, keeps inflation elevated, and narrows the window for Federal Reserve easing.
As crypto.news has reported, Bitcoin has been trading as a risk-sensitive asset throughout the Iran conflict, de-rating during escalation rather than acting as a traditional safe haven. Until a credible path toward de-escalation and Hormuz reopening emerges, the macro regime remains structurally unfavorable for sustained crypto price recovery.
Royal Mail urges customers to act or risk delivery suspension
Drugs Made In America Acquisition II Corp. enters $300,000 convertible note agreement

5 leading crypto cloud mining platforms for beginner miners in 2026

Smart energy pays enters the US market, targeting scalable financial infrastructure

Why Israel is blocking foreign journalists from entering

Bitcoin: We’re Entering The Most Dangerous Phase

MAJOR XRP CLARITY ACT UPDATE!!!! THERE IS NO TIME LEFT. (Urgent)

BITCOIN: Something BIG Is Coming! (very soon) – BTC Price Prediction Today

Z9II First Epic Specs? | Nikon’s New Financial Year Begins | Roadmap Ahead?! | Z8II? | Matt Irwin
-

 NewsBeat1 day ago
Steven Gerrard disagrees with Gary Neville over ‘shock’ Chelsea and Arsenal claim | Football
-

 Business23 hours ago
No Jackpot Winner and $194 Million Prize Rolls Over
-
Entertainment4 days ago
Fans slam 'heartbreaking' Barbie Dream Fest convention debacle with 'cardboard cutout' experience
-

 Crypto World2 days ago
Gold Price Prediction: Worst Month in 17 Years fo Save Haven Rock
-

 Fashion5 hours ago
Weekend Open Thread: Spanx – Corporette.com
-

 Tech5 days ago
The Pixel 10a doesn’t have a camera bump, and it’s great
-
 Entertainment6 days ago
Lana Del Rey Celebrates Her Husband’s 51st Birthday In New Post
-
Crypto World3 days ago
Dems press CFTC, ethics board on prediction-market insider trades
-

 Tech5 days ago
Avatar Legends: The Fighting Game comes out in July and it looks pretty slick
-

 Sports3 days ago
Tallest college basketball player ever, standing at 7-foot-9, entering transfer portal
-

 Tech4 days ago
EE TV is using AI to help you find something to watch
-

 Business2 days ago
Login and Checkout Issues Spark Merchant Frustration
-

 Fashion6 days ago
Amazon Sundays: Soft Spring Layers
-

 Fashion7 days ago
When Evening Dressing Gets Colorful for Spring
-

 Tech5 days ago
Elon Musk’s last co-founder reportedly leaves xAI
-

 Tech4 days ago
How to back up your iPhone & iPad to your Mac before something goes wrong
-

 Tech4 days ago
Apple will hide your email address from apps and websites, but not cops
-

 Politics4 days ago
Should Trump Be Scared Strait?
-

 Crypto World4 days ago
U.S. rule change may open trillions in 401(k) funds to crypto
-

 Tech4 days ago
Flipsnack and the shift toward motion-first business content with living visuals
You must be logged in to post a comment Login