

Crypto World
Solana price signals ABC correction after range-rejection
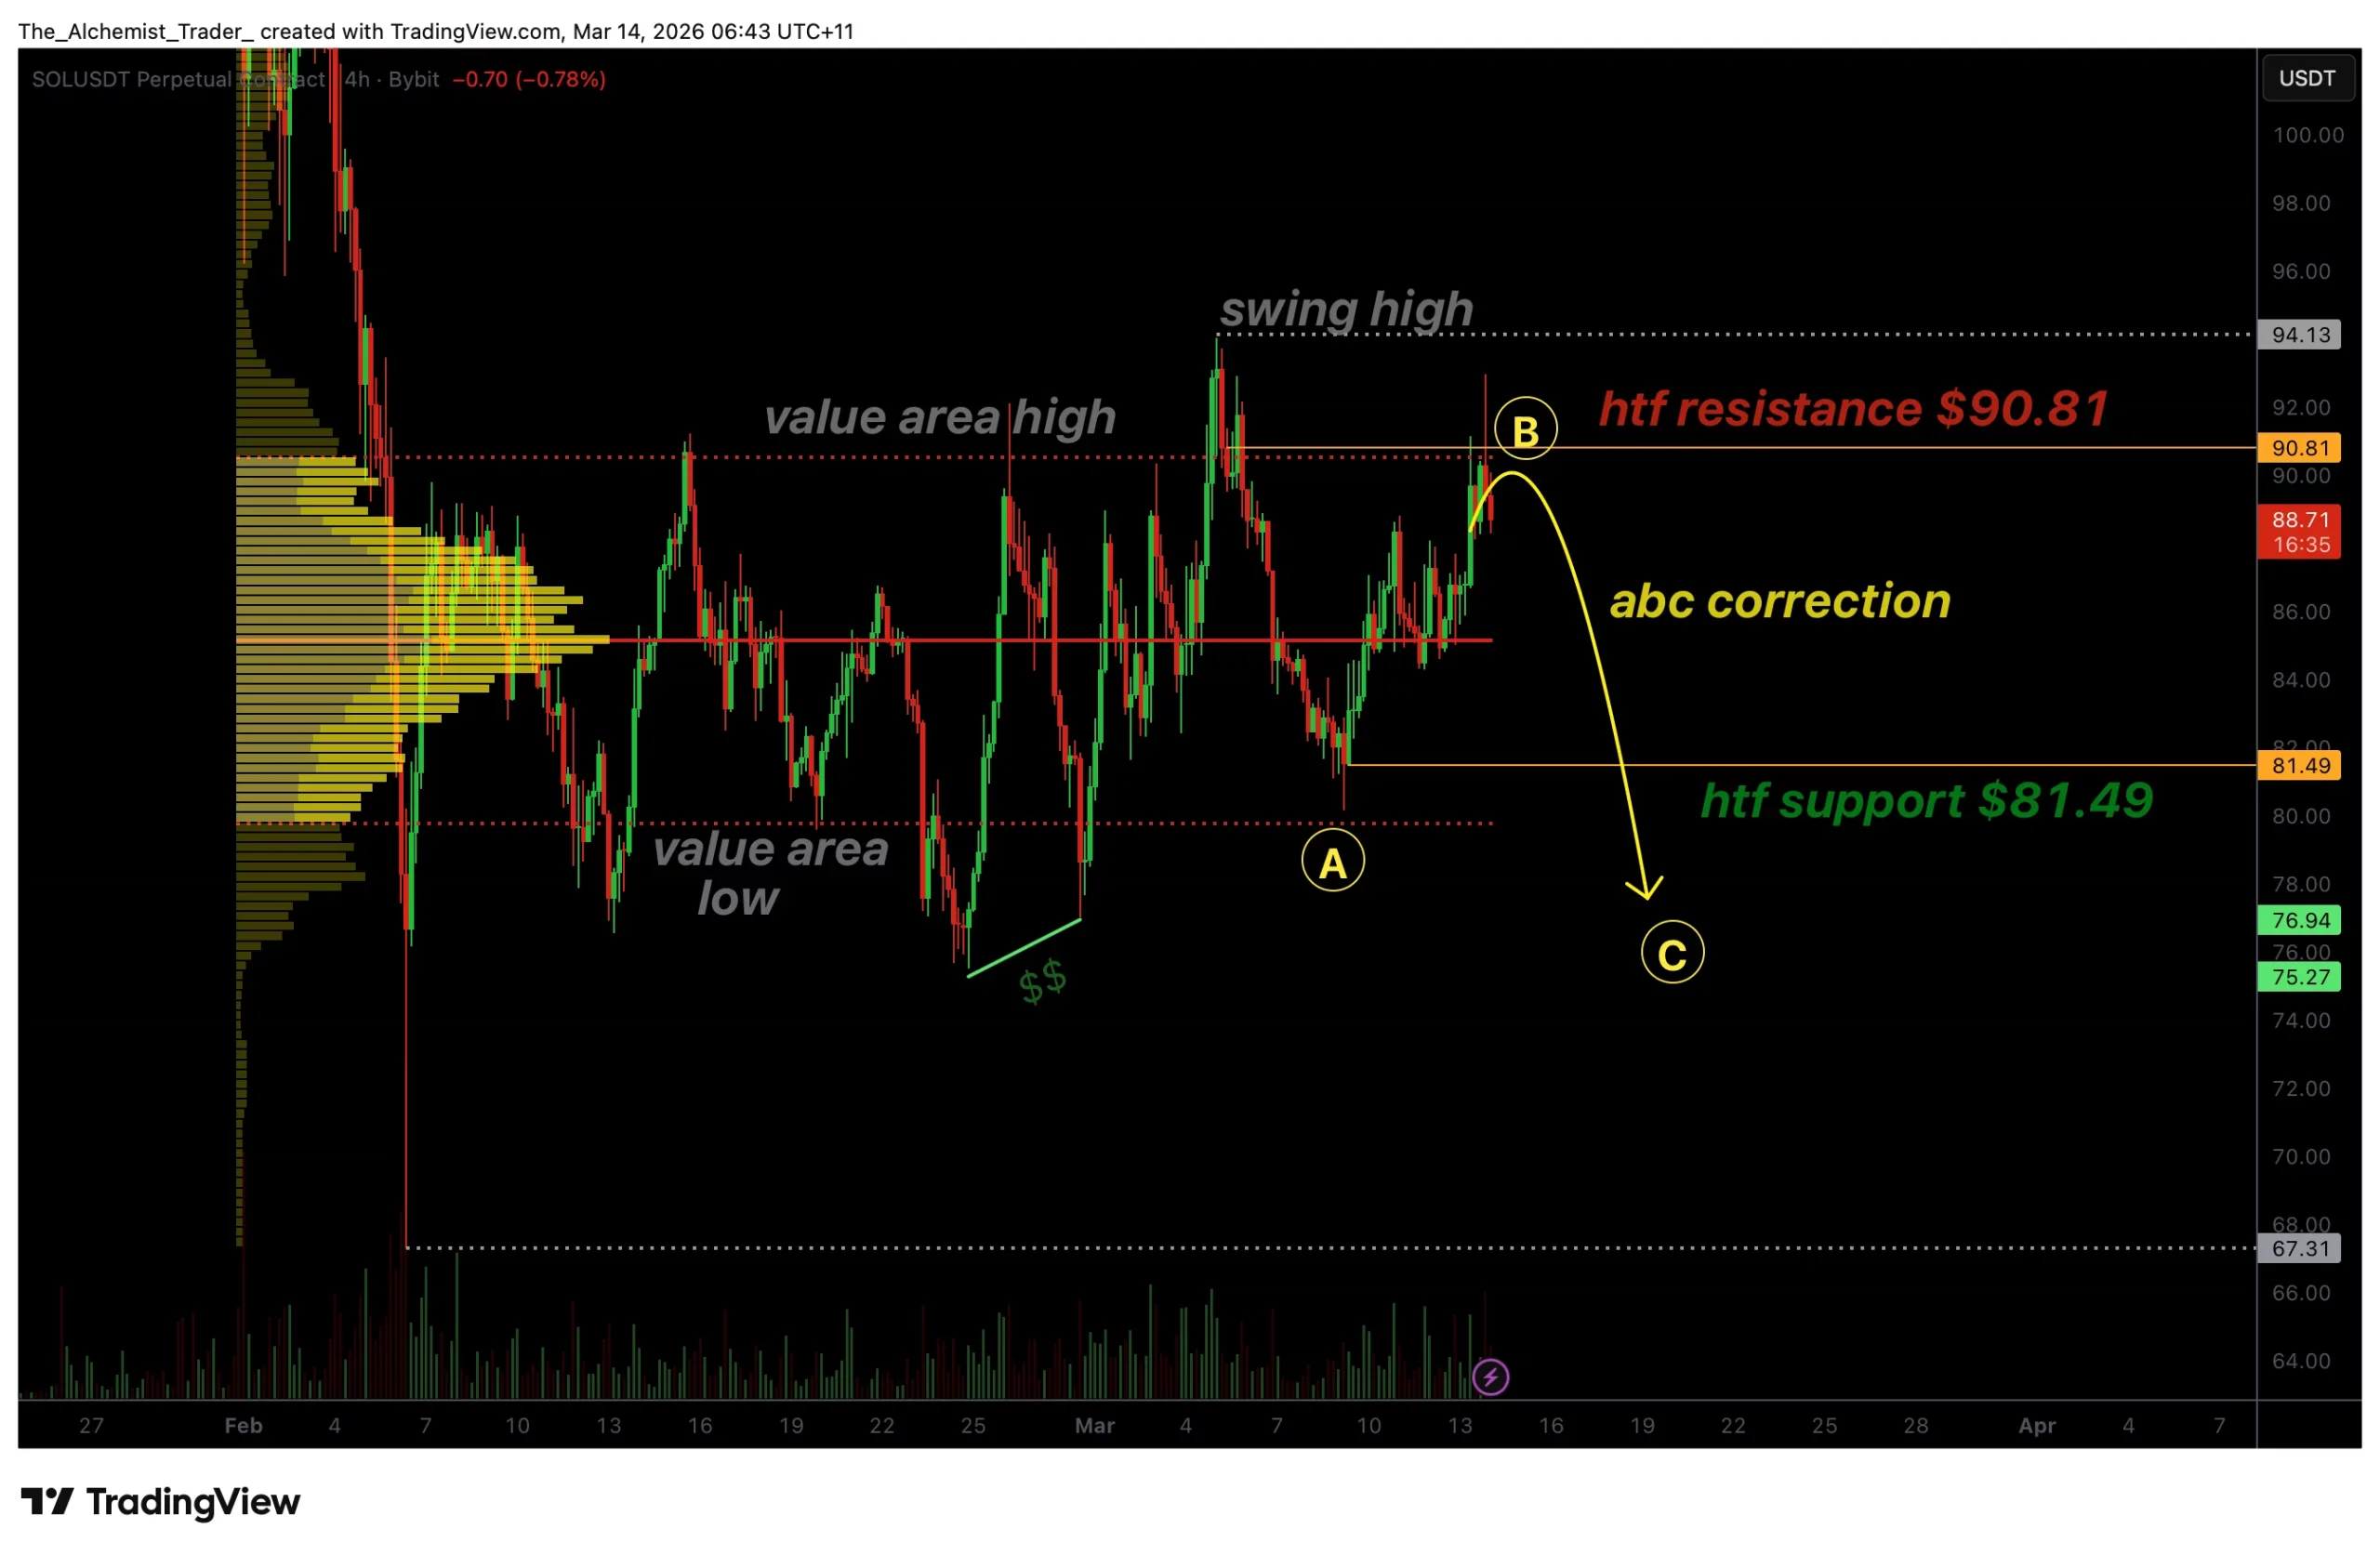
Solana price has rejected a key resistance zone near $90, signaling the potential continuation of an ABC corrective structure.
Summary
- Key Resistance: $90 aligns with high-timeframe resistance and the value area high.
- ABC Correction: Rejection suggests the C-leg of a corrective structure may be underway.
- Support to Watch: A break below $81 could open downside toward the value area low.
Solana’s (SOL) recent price action suggests the market may be entering a corrective phase following a clear rejection from the upper boundary of its trading range. The $90 region has acted as a significant high-timeframe resistance zone, aligning with the value area high and several structural resistance levels on the chart.
With the latest move failing to hold above this region, the probability of a deeper corrective move is beginning to increase.
Solana price key technical points
- Range-High Resistance: $90 aligns with high-timeframe structural resistance and the value area high.
- ABC Structure: Price action is signaling the continuation of a corrective ABC pattern.
- Downside Target: Potential move toward $81 support and the value area low.
Solana’s price action recently approached the $90 region, which has historically acted as an important resistance level within the current market structure. This zone represents the upper boundary of the broader trading range and aligns closely with the value area high derived from the volume profile. When price approaches these areas, selling pressure often emerges as traders look to defend previous resistance.
The latest price movement shows a clear rejection from this region, reinforcing the idea that Solana remains within a corrective phase rather than entering a sustained breakout. The inability for price to reclaim the $90 resistance level suggests that buyers may be losing momentum at this point in the trend.
From a technical perspective, the rejection also aligns with a developing ABC corrective pattern, a common structure in market cycles where price moves through three phases before potentially resuming a broader trend. In this structure, the initial decline forms the A leg, followed by a temporary recovery known as the B leg, before the market enters the C leg, which typically extends toward lower liquidity zones.
In Solana’s case, the recent rally toward $90 may represent the B leg of the correction. Because the move has failed to sustain above resistance, the market may now be transitioning into the C leg of the structure, which typically involves price breaking below intermediate support levels as liquidity is cleared from the market.
This technical setup is unfolding as broader ecosystem developments continue, including Nasdaq-listed Solmate Infrastructure announcing plans to establish a Solana infrastructure hub in the United Arab Emirates as part of a wider corporate restructuring and capital overhaul.
One of the key levels to watch in this scenario is the $81 support zone, which represents an important high-timeframe support level within the current structure. If price moves below this level, it would confirm increasing bearish pressure and open the door for a deeper rotation toward the value area low.
The value area low acts as a key liquidity region where large clusters of orders tend to accumulate. In range-bound markets, price frequently rotates between the value area high and value area low as traders rebalance positions and search for liquidity.
Another important factor supporting the corrective outlook is the presence of untapped swing lows below the current price. Markets often move toward these zones as they contain resting stop orders and liquidity pools that larger participants may target before establishing a new directional move.
The confluence of resistance levels near $90 strengthens the probability that the rejection will continue to influence price direction. Multiple technical factors align in this region, including structural resistance, the value area high, and Fibonacci retracement levels, making it a significant barrier for bullish continuation.
Because of this, the broader market structure suggests that Solana may remain in a rotational environment until either the range high or range low is decisively broken. For now, the rejection from resistance suggests that the downside portion of the range may be tested next.
What to expect in the coming price action
As long as Solana remains below the $90 resistance zone, the ABC corrective structure is likely to remain active. A break below the $81 support level could accelerate downside momentum toward the value area low, while a strong reclaim of $90 would invalidate the bearish outlook and signal renewed bullish momentum.

Key takeaways:
-
Bitcoin sits above $71,000 as weak US economic data and the US and Israel-Iran war drive investors toward scarce assets.
-
Tech stocks’ correlation to BTC and rising oil prices suggest that the 5-month correction from $126,000 might not be over.
Bitcoin (BTC) jumped above $73,000 on Friday, successfully locking in the 70,000 support for the week. These gains occurred as the US reported weak economic activity data, triggering concerns of an impending recession while the war in Iran continues to drag on.
While socio-economic events and institutional inflows might have led to Bitcoin’s bullish momentum, traders are still questioning if the bear market has actually ended.
Economic turmoil, growing investor appetite for BTC back Bitcoin’s breakout
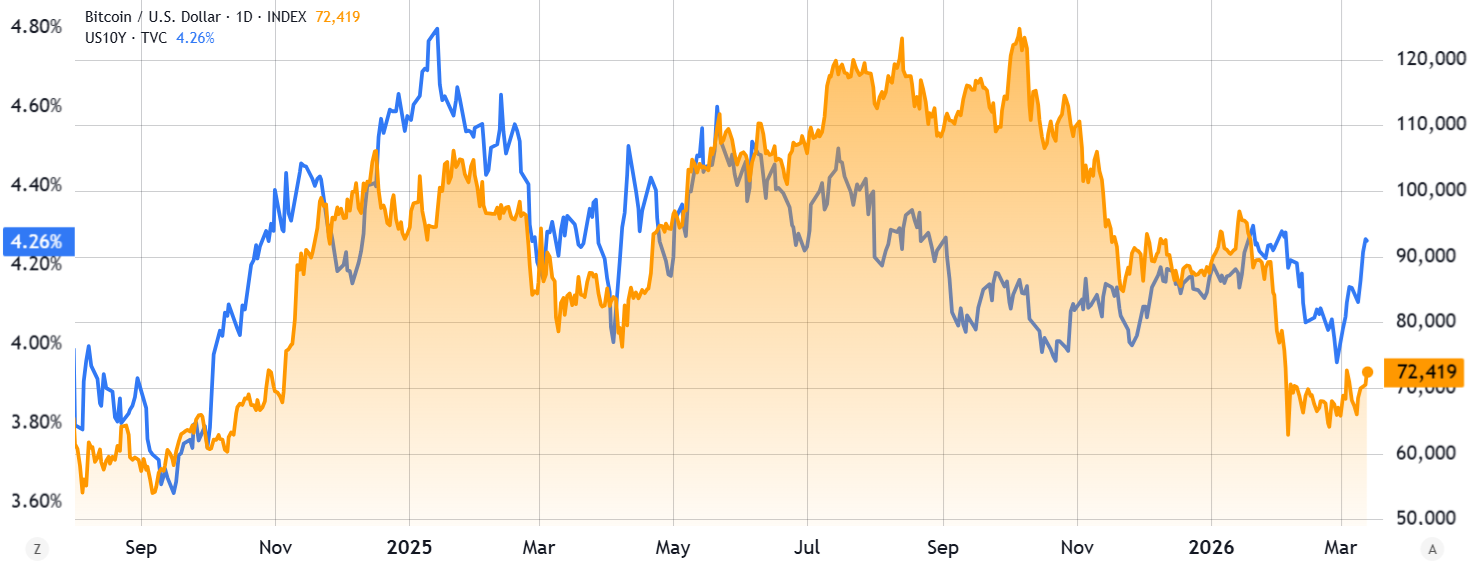
The US economy grew by a mere 0.7% between October and December 2025, which was a significant downgrade from previous estimates, according to a US Commerce Department report released on Friday. While the final report is due April 9, the risks of a recession throughout 2026 have increased, driving investors away from US Treasuries.

Yields on the US 10-year Treasury surged to 4.26%, meaning investors are demanding a higher return to hold those assets. The mere risk of additional liquidity causes traders to seek shelter in scarce assets. This partially explains why the S&P 500 traded just 5% below its all-time high despite the worsening economic conditions.

On Monday, the S&P 500 futures plummeted to their lowest levels in over three months after oil prices briefly surged to $119.50. The US decision to temporarily authorize the purchase of Russian oil stranded at sea helped to cool off some of the risks. This move, announced by US Treasury Secretary Scott Bessent on Friday, eased the markets’ short-term concerns.

Institutional demand for Bitcoin has also been signaled as a potential driver for the recent bullish momentum. Spot exchange-traded funds (ETFs) faced four consecutive days of net inflows totaling $583 million, while analysts estimate that Strategy (MSTR) accumulated over $900 million through the yield-bearing STRC instrument.
Related: Bitcoin’s ‘extremely precise’ macro signal puts $100K target back in play
Bitcoin’s momentum turned bullish, but the bear market carries on
At first glance, the economic backdrop points toward liquidity injections and rising institutional interest in Bitcoin. However, that doesn’t necessarily mean the five-month correction following the $126,000 peak in October 2025 has ended.
Bitcoin’s 50-day correlation with the Nasdaq 100 sits at 84%. As concerns grow over sticky inflation and stagnant economic growth, the odds of a stock market pullback increase. Traders are unlikely to use Bitcoin as a hedge, especially given its recent underperformance compared to gold.
Adding to this, oil prices remain $30 higher than levels seen before the war in Iran began. These high fuel costs hit consumer spending and create inflationary pressure, which reduces the capital retail traders have available for crypto investments.
Inflows to the spot BTC ETFs have surged as $2.14 billion entered the ETFs from Feb. 24 to March 4, driving a 14% rally. However, prices slipped 10% over the next four days as those flows reversed. This suggests spot ETF activity is just reacting to Bitcoin’s price rather than acting as a leading indicator.
Whether Bitcoin stays above $70,000 over the weekend may not shift investor sentiment. While a five-week consolidation and several tests of the $64,000 support show bulls’ confidence, the recent price action hasn’t delivered a clear signal for a breakout.
This article does not contain investment advice or recommendations. Every investment and trading move involves risk, and readers should conduct their own research when making a decision. While we strive to provide accurate and timely information, Cointelegraph does not guarantee the accuracy, completeness, or reliability of any information in this article. This article may contain forward-looking statements that are subject to risks and uncertainties. Cointelegraph will not be liable for any loss or damage arising from your reliance on this information.

Billionaire investor Stanley Druckenmiller said blockchain and stablecoins may only be a decade away from powering the global payments system — though he isn’t sold on the idea of crypto functioning as a store of value.
In an interview with Morgan Stanley recorded on Jan. 30 and released on Friday, the former hedge fund manager said blockchain-based tokens — particularly stablecoins — boost productivity in the payments space:
“Blockchain and the use of stablecoins, if you want to throw crypto into that, tokens, incredibly useful in terms of productivity,” Druckenmiller said.
“I assume our whole payment systems will be stablecoins in 10 or 15 years,” he said, adding that stablecoins are more efficient, faster and cheaper than existing solutions.

Druckenmiller founded Duquesne Capital Management in 1981 and closed the fund in late 2010. During that time, he achieved an average annual return of 30% and never experienced a down year.
Druckenmiller said back in May 2021 that a blockchain-based system could replace the payment rails that power the US dollar due to a lack of trust in the traditional banking system.
“Well, the problem has been clearly identified. It’s Jerome Powell and the rest of the world, central bankers. There’s a lack of trust,” he told CNBC’s Squawk Box at the time.
Several traditional payments firms, such as Western Union, MoneyGram and Zelle, announced plans to launch stablecoin settlement systems last year following the passage of the stablecoin-focused GENIUS Act in July, which provided a clear regulatory framework for payment firms to offer digital asset services.
Drunkenmiller not sold on crypto as a store of value
Despite Druckenmiller’s conviction on blockchain and stablecoins, he isn’t convinced that cryptocurrencies like Bitcoin (BTC) can function as a store of value.
“It’s a solution looking for a problem. I’m very sad that it ever happened,” Druckenmiller told Morgan Stanley.
Related: Crypto Biz: Circle stock defies Wall Street and digital asset selloff
“It wasn’t needed,” but crypto has become a brand that some people love, so it will function as a store of value to them, he said.
Back in October 2023, Druckenmiller said he compared Bitcoin to gold, stating that he prefers the latter because it is a “5,000-year-old brand.”
Druckenmiller went on to say that he doesn’t own any Bitcoin, but that he should.
Magazine: Bitcoin’s ‘narrative vacuum,’ Ethereum now inevitable: Trade Secrets

A U.S. federal appeals court has closed the book on Custodia Bank’s bid for direct access to the Federal Reserve’s master-account program, delivering a setback after years of legal maneuvering. In a 7-3 ruling, the U.S. Court of Appeals for the Tenth Circuit declined to rehear the case, leaving intact the Fed’s long-standing discretion over who receives master accounts and access to the central bank’s payment rails. The decision arrives as crypto firms continue to seek direct lines to Fed services, while other players in the sector push for broader access and clearer regulatory pathways.
Key takeaways
- The Tenth Circuit rejected Custodia Bank’s final challenge in a 7-3 vote, effectively ending the bank’s bid for a Fed master account.
- Custodia originally applied in October 2020; after initial Fed rejection, it argued that the Monetary Control Act entitles state-chartered banks to Fed services, including a master account.
- Multiple courts have upheld the Fed’s discretion in granting master accounts, reinforcing the central bank’s gatekeeping role in access to payment rails.
- Kraken became the first crypto platform to receive a master account from the Federal Reserve Bank of Kansas City on March 4, tying it to Fedwire payments, albeit with a narrower set of services than a traditional bank.
- Disagreeing with the majority, Judge Tymkovich warned that a master account is “indispensable” for a bank’s operations and suggested denial could be viewed as a prohibitive outcome for a crypto-focused institution.
- The case underscores ongoing regulatory debate about “skinny” or limited master accounts for crypto firms, signaling a cautious but evolving approach to central-bank access.
Market context: The ruling lands amid broader regulatory discussions about how crypto-native firms should access traditional financial rails and liquidity. As more players seek direct Fed access to improve settlement efficiency and risk management, regulators have signaled openness to narrower, crypto-specific arrangements, while maintaining the Fed’s discretionary authority over master accounts.
Why it matters
The decision reinforces a foundational policy stance: the Federal Reserve controls who earns entry to its payment system through master accounts. For Custodia, the outcome closes a five-year pursuit that began with ambitions to settle digital-asset transactions with direct Fed support, reducing the likelihood of a direct route around traditional correspondent banking relationships. The ruling clarifies that the Fed’s authority to grant or withhold master accounts is not easily trumped by statutory arguments and that courts are unlikely to compel the Fed to provide access in the absence of a clearly defined statutory mandate.
Yet the same period has also seen notable progress elsewhere. Kraken, a prominent crypto exchange, secured a master account from the Fed’s regional arm in Kansas City, marking a pivotal milestone for the sector’s integration with the U.S. central bank’s system. This development demonstrates that the Fed is willing to grant access, albeit selectively, to entities that can demonstrate robustness, compliance, and operational readiness to connect to Fedwire payments. The distinction between “full” access and the more limited services available to nontraditional banks highlights the evolving nature of central-bank engagement with digital-asset firms.
While Custodia’s setback narrows the path for state-chartered banks seeking direct Fed access, the broader ecosystem remains engaged in a pragmatic dialogue about what accommodations crypto firms should receive. Proponents of increased access argue that direct ties to the Fed could reduce settlement risk and improve liquidity management in a sector characterized by rapid custody and settlement needs. Opponents caution against broadening eligibility without stringent risk controls and robust compliance frameworks. The tension mirrors larger regulatory dynamics as policymakers weigh consumer protection, financial stability, and innovation in parallel tracks.
The court’s opinion also underscores a practical reality: the Fed’s discretion has persisted through multiple adjudications. Although some judges have criticized the Fed’s stance, the majority’s analysis emphasizes that, absent a legislative change, master accounts remain a matter of administrative choice rather than automatic entitlement. In this sense, Custodia’s experience serves as a cautionary tale for other applicants that seek to accelerate entry into federal settlement rails without meeting the precise criteria the Fed applies in evaluating risk, governance, and operational readiness.
In the same thread, commentary around “skinny” master accounts—limited types of accounts designed to offer essential access without granting the full suite of services reserved for traditional banks—continues to gain attention. Advocates contend that even a pared-down pathway could substantially reduce the frictions crypto firms encounter when scaling and integrating with regulated financial infrastructure. Critics, however, argue that the integrity of the payment system requires careful calibration of who can participate and under what conditions. The recent disclosures, including Kraken’s march toward Fed-linked settlement capabilities, illustrate a cautious but tangible shift toward more inclusive mechanisms that balance safety with innovation.
What to watch next
- Regulators and the Fed may continue refining criteria for “skinny” master accounts and similar arrangements for crypto firms.
- Other applicants could reassess their strategies in light of the Custodia decision, potentially pursuing alternative means of direct Fed access or partnerships with traditional banks.
- Ongoing regulatory discussions and potential policy guidance could shape how future master-account decisions are communicated and implemented.
- Industry observers will monitor Kraken’s ongoing integration efforts and any further expansions of its Fed-connected capabilities.
Sources & verification
- U.S. Court of Appeals for the Tenth Circuit — Opinion documenting the denial of Custodia’s appeal: https://www.ca10.uscourts.gov/sites/ca10/files/opinions/010111400884.pdf
- Custodia Bank rehearing en banc master account coverage: https://cointelegraph.com/news/custodia-bank-rehearing-en-banc-master-account
- Custodia crypto bank appeal federal reserve master account coverage: https://cointelegraph.com/news/custodia-crypto-bank-appeal-federal-reserve-master-account
- Kraken receives master account and links to Fedwire coverage: https://cointelegraph.com/news/kraken-crypto-exchange-fed-master-account
- Additional context on Fed services not related to central bank digital currencies: https://cointelegraph.com/news/federal-reserve-service-not-related-to-cbdcs
Why it matters
The court’s ruling crystallizes the principle that access to the Fed’s payment rails is not an automatic entitlement for crypto-focused banks. It foregrounds the Fed’s discretion as a central feature of how digital-asset firms can participate in the U.S. financial infrastructure, at least in the near term. For stakeholders seeking to integrate digital assets into mainstream settlement processes, the decision clarifies the legal landscape and raises the bar for establishing the robust governance, risk controls, and compliance frameworks that the Fed expects of applicants.
At the same time, the Kraken milestone demonstrates that meaningful progress is possible even within a system that remains cautious about crypto-adjacent actors. By securing a master account from a regional Fed bank, Kraken has opened a pathway to improved liquidity and settlement efficiency, though with a narrower set of services than those enjoyed by conventional banks. The contrast between Custodia’s unresolved bid and Kraken’s operational foothold suggests that the road to broader access will likely be incremental, tempered by risk, regulatory clarity, and demonstrated resilience in transaction processing and governance.
Sources & verification
To verify the key elements of this story, readers can consult the official court filing and the referenced industry coverage:
- The Tenth Circuit opinion PDF confirming the denial of Custodia’s appeal: https://www.ca10.uscourts.gov/sites/ca10/files/opinions/010111400884.pdf
- Cointelegraph coverage on Custodia’s rehearing and related master-account discussions: https://cointelegraph.com/news/custodia-bank-rehearing-en-banc-master-account
- Cointelegraph coverage on Custodia’s crypto-bank appeal and Fed master account issues: https://cointelegraph.com/news/custodia-crypto-bank-appeal-federal-reserve-master-account
- Cointelegraph coverage on Kraken obtaining a master account: https://cointelegraph.com/news/kraken-crypto-exchange-fed-master-account
What the story means for the crypto ecosystem
As policy discussions evolve, the industry is watching how regulators balance the benefits of direct Fed access—lower settlement risk, faster liquidity management, and greater resilience—with the imperative to maintain safety, transparency, and financial stability. The Custodia ruling reinforces the notion that central-bank access is not guaranteed and that applicants must meet rigorous criteria and demonstrate systemic readiness. Simultaneously, Kraken’s milestone signals real-world progress and a potential blueprint for future entrants who can align with enhanced risk controls and compliance standards while leveraging more direct settlement capabilities. The next chapter will likely hinge on policy direction, the development of “skinny” account frameworks, and continued collaboration between policymakers, banks, and crypto firms to expand access without compromising systemic integrity.
Crypto World
US CLARITY Act Unlikely to Pass Senate Banking Committee Before April: Senator John Thune


Senator John Thune said the crypto-focused CLARITY Act faces further delays due to unresolved disagreements between banks and stablecoin issuers.
The long-awaited Crypto Clarity Act is unlikely to advance through the Senate Banking Committee before April, according to Senator John Thune. The delay stems from ongoing disagreements between banks and stablecoin issuers over key legislative provisions, per reporting from The Block.
The CLARITY Act has been a focal point for crypto industry advocates seeking regulatory clarity on digital assets and stablecoin issuance. The continued stalling of the legislation signals that critical stakeholders have yet to align on framework details, pushing any Senate committee vote further into 2025.
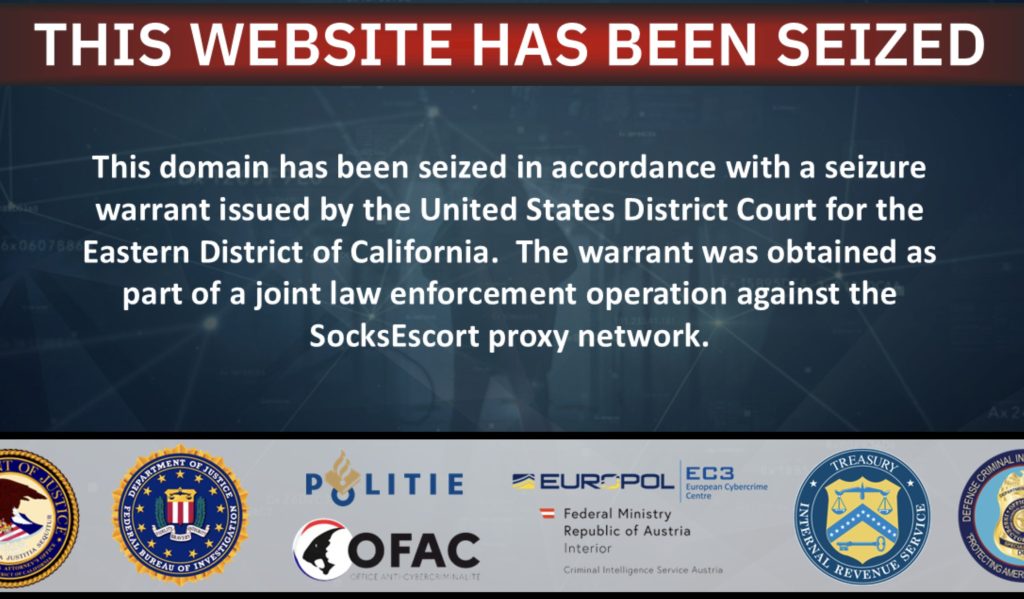
The DOJ and Europol just took down SocksEscort. A residential proxy network that has been running since 2009.
34 domains seized. 23 servers were knocked offline across 7 countries. $3.5 million in crypto frozen.
SocksEscort was the infrastructure layer cybercriminals used to stay invisible. Account takeovers, ransomware attacks, crypto fraud. All of it ran through this network to mask where the attacks were actually coming from.
It took over a decade. But the operation is done.
What the DOJ-Europol Takedown Actually Targeted
The network had hijacked 369,000 devices across 163 countries. Routers, IoT devices, residential IPs. All were infected with AVRecon malware and rented out to criminals who needed clean addresses to bypass fraud detection at banks and crypto exchanges.

20,000 new devices are infected every week since early 2024. Total revenue is estimated at $5.8 million over the life of the operation. One victim in New York lost roughly $1 million in crypto alone after their account was hit through a SocksEscort proxy.
8 countries were involved in Operation Lightning. France, Germany, and the Netherlands, among them. The coordination was deliberate. Authorities are no longer just chasing individual criminals. They are targeting the infrastructure that makes crypto crime possible in the first place.
Europol’s executive director put it plainly. Proxy services like SocksEscort are the anonymity shield that lets illicit funds move across borders undetected. Remove the shield, and the whole operation falls apart.
That is exactly what happened here.
The Compliance Pressure This Puts on Exchanges and Mixers
The takedown creates an immediate problem for everyone who used the service.
SocksEscort had 124,000 registered users. All of them were masquerading as legitimate residential traffic to defeat IP-based fraud detection at exchanges. Credential stuffing, password spraying, wash trading, and account takeovers. The proxy network was the tool that made all of it invisible.
Now the servers are seized. And they are full of transaction data.
FBI Deputy Assistant Director Jason Bilnoski confirmed it directly. Thousands of users are now exposed. A wave of downstream indictments is coming.
For exchanges, the pressure is also shifting. Regulators are drawing a harder line between legitimate privacy tools and criminal evasion infrastructure. Compliant platforms are already moving to verify that user traffic comes from legitimate ISPs rather than compromised botnets. Those who do not will be next in the crosshairs.
SocksEscort is gone. But the forensic trail it left behind is just getting started.
Discover: The best new crypto in the world
The post DOJ and Europol Dismantle Crypto-Linked Proxy Network SocksEscort in Joint Action appeared first on Cryptonews.
Bitcoin’s brief jump above $73k shows bulls still in control, but Iran war risks, oil shocks and crowded leverage leave BTC vulnerable to a violent flush.
Summary
- Bitcoin price reclaimed the $73k area as global risk assets bounced despite ongoing Iran war headlines and oil market stress.
- Derivatives data show rising funding, packed longs and whale leverage on BTC and ETH, primed for cascade liquidations if momentum stalls.
- With Iran threatening shipping and higher oil, traders are shifting to tighter stops, staged profit‑taking and options hedges into late‑cycle volatility.
Bitcoin (BTC) price briefly cleared the $73,000 mark in the last trading session, signaling the current bullish phase is intact but leverage and positioning are now approaching blow‑off conditions.
Bitcoin breaks above $73K as risk appetite returns
Bitcoin pushed above $73,000 in the past 24 hours, gaining around 4% and extending its march to new all‑time highs against a backdrop of renewed risk appetite in global markets. This move comes as US equities continue to trade near record levels and traders maintain expectations for at least one Federal Reserve rate cut before year‑end, keeping liquidity conditions supportive for high‑beta assets such as BTC. On major derivatives venues, funding rates and open interest have been grinding higher, reflecting aggressive long positioning rather than spot‑led demand.
The latest leg higher follows weeks of sustained inflows into Bitcoin exchange‑traded products and centralized exchanges, with market depth still thinner than in prior cycles despite the larger nominal price. That combination of rising leverage and limited resting liquidity leaves the market vulnerable to sharp liquidations if price momentum stalls or macro data surprise to the upside on inflation.
Leverage and whale positioning intensify
Onchain and derivatives‑tracking dashboards show that a handful of large traders have materially increased risk into the breakout, using double‑digit leverage on both BTC and ETH. One heavily watched account has built sizeable long positions on Ethereum with leverage around 15x, echoing similar high‑stakes trades reported in prior ETH rallies in 2025 that at times exceeded 25,000 ETH notional and over $100 million in exposure. While the current configuration differs in size and entry levels, the underlying dynamic is the same: concentrated players are amplifying upside moves, but also raising the risk of cascade liquidations if the market reverses.
In parallel, research firm Trend Research and its affiliates have repeatedly moved large ETH tranches between self‑custody, lending protocols and centralized exchanges in recent weeks, including deposits and withdrawals in the tens of thousands of ETH and tens to hundreds of millions of dollars in value. These flows underline how a small group of funds can influence short‑term liquidity and sentiment when Bitcoin tests new highs and investors chase beta down the risk curve.
What this means for traders
For directional traders, Bitcoin reclaiming and holding above the $70,000–$73,000 band confirms that the primary trend remains intact, but it also suggests that risk management now matters more than raw conviction. Elevated open interest, richer funding rates and large whale leverage all point to a market that can overshoot higher but will unwind violently on any macro or regulatory shock.
From a portfolio‑construction perspective, professional desks are likely to favor staggered profit‑taking on strength, tighter stop‑losses on high‑leverage BTC and ETH longs, and increased use of options to hedge downside tails while keeping upside participation. Retail investors chasing the breakout should be aware that the easy part of the move is probably behind, and that late‑cycle volatility around psychological levels like $75,000 and $80,000 historically separates disciplined participants from forced sellers.
Ethereum price surges as derivatives open interest jumped nearly 9% to above $30b, concentrating leverage on Binance, Gate, Bybit and OKX and priming Ethereum for sharper liquidations.
Summary
- Ethereum derivatives open interest climbed about 9% in 24 hours to roughly $30.4b, tracking Ethereum above $2,180.
- Binance, Gate, Bybit and OKX now hold most ETH OI, raising spillover risk if one venue sees a funding squeeze or outage.
- Rising OI with higher prices signals a reflexive setup: further gains could richen funding, while any stall may trigger fast deleveraging.
Ethereum (ETH) derivatives just lit up. Here’s a clean crypto.news-style piece on the ETH open interest story, using $ not “dollar.”
ETH derivatives open interest has jumped nearly 9% in 24 hours, pushing total ETH contract exposure above $30 billion and underscoring how fast leverage is building behind the latest leg of the rally.
ETH open interest climbs as traders add leverage
According to derivatives tracker Coinglass, total ETH contract open interest has increased by 8.94% over the past 24 hours, with aggregate open interest now at $30.451 billion across major exchanges. Binance leads with $6.593 billion in ETH OI, followed by Gate at $3.875 billion, Bybit at $2.358 billion, and OKX at $2.042 billion. The move comes as ETH trades above $2,180 and tracks Bitcoin’s push into fresh all‑time highs, drawing in both speculative longs and basis traders.
The pace of growth in ETH open interest mirrors similar spikes seen in late February, when Ethereum derivatives OI rose between 7% and 14% in a single day as traders positioned around key resistance and ETF narratives. Each of those prior expansions in open interest preceded periods of elevated intraday volatility, as crowded positions were tested by relatively small spot flows.
Market structure: more size, more sensitivity
With more than $30 billion now tied up in ETH futures and perpetuals, relatively minor price moves can trigger meaningful liquidation flows. Recent Coinglass data shows that when open interest in ETH contracts has sat in the mid‑20s to high‑20s billions range, subsequent 24–48 hour windows often featured sharp wipe‑outs as funding flipped and over‑levered longs or shorts were forced out.
Exchange concentration also matters. Binance, Gate, Bybit, and OKX have repeatedly accounted for the bulk of ETH derivatives risk in recent months, with Binance alone often carrying more than $5 billion in ETH OI. That clustering means that any sudden funding squeeze, outage, or large liquidation event on one of these venues can spill quickly into spot books and cross‑exchange pricing.
What traders should watch next
For short‑term ETH traders, the combination of rising open interest and higher spot prices typically signals a more reflexive environment: price drives positioning, and positioning in turn drives price. If ETH continues grinding higher with OI expanding, funding rates and basis are likely to richen, creating both carry opportunities and greater downside risk if the trade becomes too crowded.
If, instead, OI starts to roll over while price stalls or pulls back, that would indicate aggressive deleveraging and could mark a local top or a reset phase similar to prior episodes where ETH contract open interest dropped 4–6% in a day. In both cases, the key tells will be funding, liquidation clusters, and whether open interest continues to climb above the $30 billion mark or snaps back toward the mid‑20s.
Crypto World
DeepSnitch AI Bonus: Hurry Up, Only a Few Days Left! The Bull Run Every Trader Has Been Waiting For Finally Has a Starting Gun

Oil almost touched $100 this week after tensions around the Strait of Hormuz sparked a macro panic. Stocks sold off and macro Twitter went into meltdown mode. Then, US Treasury Secretary Scott Bessent stepped in with a temporary license allowing countries to buy Russian oil already stranded at sea, calling the spike a short-term disruption. Oil dropped quickly, and crypto reacted fast.
Bitcoin pushed close to $72,000 with strong ETF inflows and continued accumulation from major buyers. The dollar also weakened, which is exactly the kind of macro setup that usually fuels risk assets.
The macro setup that every trader has been waiting for is building exactly the way the textbook says it should, and the Deepsnitch AI bonus codes are still live, but not for long. Here’s why you should hurry up ahead of the launch.

BTC jumps to $72K after Bessent kills the oil scare
Treasury Secretary Scott Bessent stepped into a market that was panicking about oil racing toward $100 a barrel and cooled things down fast. Iran’s new supreme leader had said the Strait of Hormuz would stay closed, and Donald Trump said stopping Iran mattered more than oil prices, which sent equities sliding and macro Twitter into full panic mode.
Then Bessent announced General License 134, a temporary move allowing countries to buy Russian oil that was already stuck at sea. He called the spike a short-term disruption and said the economy could actually benefit once things settle. Oil quickly dropped about $2 a barrel, and Bitcoin jumped close to $72,000 within hours while stocks were still trying to catch up.
This is what the setup looks like right before a sustained bull move starts: macro fear gets resolved faster than expected, institutional buying was already happening before the resolution, and the Deepsnitch AI bonus countdown is ticking in the exact window when new capital starts looking for the highest-asymmetry entries it can still access before the crowd arrives.
Three positions to load before this window shuts: $DSNT, BTC and ETH
1. The DeepSnitch AI bonus still live! Hurry up, only a few days left!
If you are still sitting on the sidelines reading about the Deepsnitch AI bonus and not positioning, this section is your last clear-headed moment before FOMO kicks in at the Uniswap listing price.
$DSNT is the only presale in this market where five AI security tools are already live and working for traders every single day at $0.04399 before the ground floor closes.
AuditSnitch scans any smart contract in seconds and risk-scores it before you sign anything. SnitchGPT handles your on-chain research with real market context, so you are not walking into positions based on vibes and influencer threads.
SnitchFeed streams whale wallet activity and volume anomalies in real time, so you see the move before the chart confirms it and before retail gets trapped. Token Explorer gives you full holder concentration, liquidity depth, and risk scoring on any token before you commit a dollar.
SnitchCast keeps your market read sharp and current without building your own research stack from scratch. Coinsult and SolidProof have both independently audited the smart contract, and $2 million has already been raised with up to 300% bonuses still active.
If the bull case sends $DSNT to $30, this is the type of trade that creates serious wealth. This is a crypto presale ending soon situation with zero wiggle room because March 31 is the date and there is no extension coming.
2. Bitcoin (BTC) update for March 2026
BTC is currently trading around $72,000 on March 13 after recovering from the $63,000 to $64,000 range that defined February’s fear cycle, and the setup underneath it right now is the strongest it has been since Q4 2025 when BTC hit its all-time high of $126,000.
The 2026 bull target sits at $200,000, and the majority of analyst consensus clusters between $120,000 and $150,000 for the cycle high. BTC will not give you 100x from here. But as a store-of-value position running alongside a presale like $DSNT that is still in its final days of token presale window, BTC is the safest way to make sure you have exposure to the broad market recovery without having to time an altcoin rotation correctly.
3. Ethereum (ETH) update for March 2026
ETH reclaimed $2,000 this week and is currently trading around $2,100 on March 13 after spending the past several months in a brutal drawdown from its $4,105 ATH in December 2024.
The current entry is sitting 50% below the all-time high, with the Pectra upgrade scheduled for Q1 to Q2 2026.
The 2026 ETH high target sits at $6,000, and the most bullish analyst projections reach $10,000 to $15,000 in the supercycle case.
The upside math is still a 3x to 5x from here in the base case. That is a good trade, but it is not the same as DeepSnitch AI.
DeepSnitch AI bonus code: Hurry up, only a few days left before launch!
Bessent just gave the market a macro green light by capping oil at $100, BTC responded by jumping to $72K with ETF inflows running for three straight weeks, and the bull run setup that serious traders have been positioning for all year is starting to look a lot more like the real thing.
BTC and ETH are the right plays for traders who want cycle exposure with lower volatility and a clear path to 3x to 5x from current levels. But the Deepsnitch AI bonus is for the traders who want the move that makes the BTC chart look boring in comparison.
$DSNT at $0.04399 with five live tools, dual audits, 41.4M staked coins, and a 150% bonus on $10K-plus entries is the final days token presale setup that closes March 31 and never reopens at this price.
Visit the official DeepSnitch AI website and lock in your $DSNT before the deadline. Join X and Telegram community to catch the listing announcement drop.
FAQs
What exactly is the Deepsnitch AI bonus and does the deadline actually move?
The Deepsnitch AI bonus deadline is March 31 and the team has confirmed zero extension. It is a crypto presale ending soon situation with up to 300% bonuses that disappear the moment the presale closes.
Is the limited-time crypto bonus on DSNT worth stacking alongside BTC at $72K and ETH at $2,100 right now?
BTC and ETH are solid cycle plays, but a 3x to 5x is the realistic ceiling from current prices. The limited-time crypto bonus of up to 300% on $DSNT at $0.04399 puts tokens in your wallet for free.
Why is the final days token presale window on $DSNT more urgent than waiting for a discount after the Uniswap listing?
There is no discount after the listing. The final days token presale price of $0.04399 could be the floor that never returns. Every AI infrastructure token from TAO to RENDER listed above presale and never looked back. This is the last entry at ground floor and it is closing on March 31.
Disclaimer: This is a Press Release provided by a third party who is responsible for the content. Please conduct your own research before taking any action based on the content.

Ether (ETH) traded about 30% below its yearly open of $2,990, as traders grow increasingly risk-averse amid a global conflict and macroeconomic uncertainties.
Still, stronger network usage and increasing inflows into ETH accumulation addresses could provide a spark that may see the price finally break $2,200 resistance.
Key takeaways:
-
ETH held in accumulation wallets has risen 32% since January, showing strong long-term confidence.
-
Staked ETH reaches a record 37.85 million, representing over 30% of supply.
-
Analysts say Ether bulls must reclaim $2,200 as support
6.5 million ETH increase in accumulation addresses
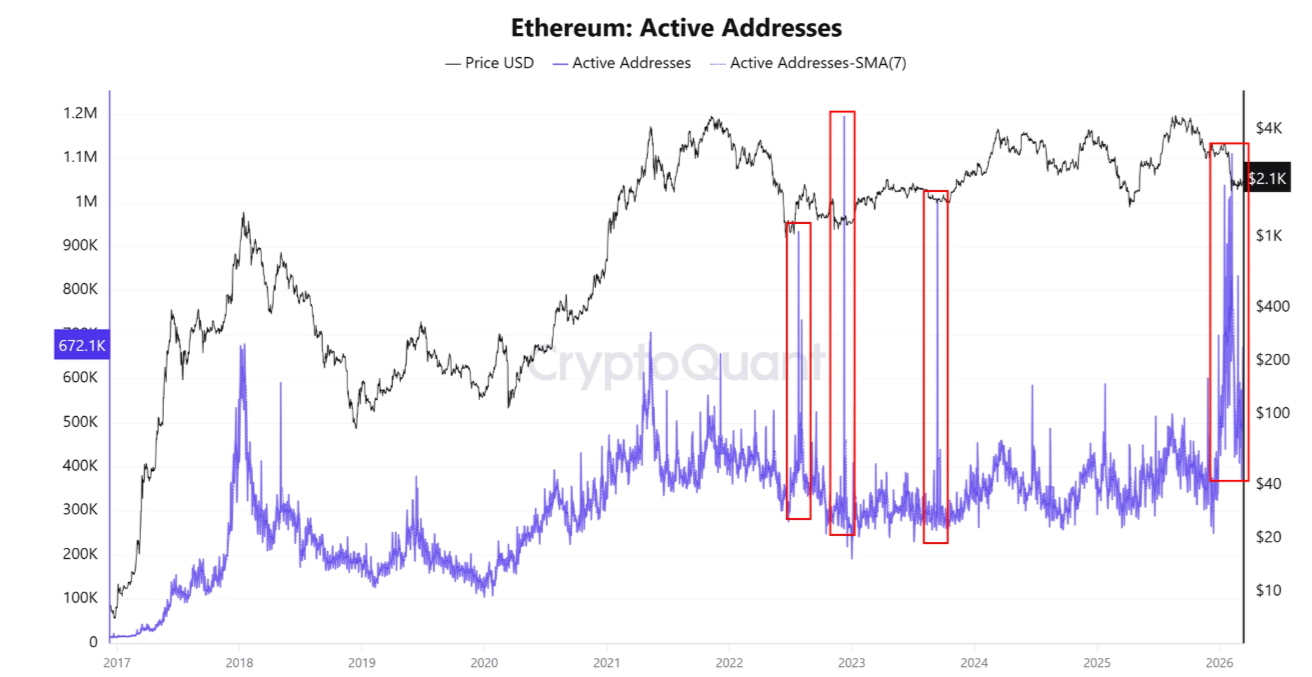
Although Ether’s price has fallen in 2026, network activity increased, with daily active addresses (DAA) rising to 1.1 million in February, the highest level since December 2022. The DAAs jumped by 80% to 672,170 from 370,390 in the past seven days.
“The increase in ETH active addresses indicates bullish market movements,” CryptoQuant analyst CW8900 said in a QuickTake note on Friday.
The chart below shows that activity increased most significantly after Ether’s recent drop below $2,000.
“This implies that accumulation activity was at its most active,” the analyst added.

Similar activity has been consistently observed near macro bottoms since 2022, preceding significant ETH price rallies.
Additionally, daily inflows into accumulation addresses have increased steadily since mid-2025, reaching a record high of 1.14 million ETH in November 2025. The inflows have continued to climb in 2026, averaging 200,000 ETH per day, with a spike to over 350,000 on Thursday.
As a result, the amount of ETH held in accumulation wallets, or holders with no history of selling, has increased by 6.5 million to 26.55 million from 20.1 million on Jan. 1, representing a 32% increase.
The ETH supply held in accumulation addresses is an important indicator for traders and market participants, as it reflects overall confidence in Ether’s long-term outlook.

The total value of ETH staked further reinforces this outlook. The supply of staked Ether reached an all-time high of 37.85 million this week, signaling growing investor confidence and a squeeze on the liquid supply. This represents over 30% of the total ETH supply.

A growing staked supply also indicates that a large percentage of investors are preparing to hold their ETH for longer.
As Cointelegraph reported, Ether supply held on exchanges fell to a new multi-year low of 3.46 million ETH, further tightening the available liquidity on the order books.
Ether price needs to flip $2,200 into support
Data from TradingView shows ETH attempting to breach the $2,100-$2,200 resistance that has suppressed its price over the last month.
“This has been an important price area over the past couple of years of price action for Ethereum,” analyst Daan Crypto Trades said in a recent X post.
The last time the ETH/USD pair reclaimed this level was in May 2025. It rallied 24% in less than a week. In June 2025, it served as a launchpad for a 126% ETH price rally to the current all-time high of $4,950 reached in August 2025.

A key area to watch on the downside is $1,750-$1,850, which, if lost, could extend the downtrend to as low as $1,000.
“I assume that when this breaks either side of the range, we will see a large move occur,“ Daan Crypto Trades added.
This support area coincides with an ascending trend line that has upheld the price on the weekly chart since 2022.
Technical analyst Prof said holding this support would then trigger a retest of the 21-week exponential moving average at $2,700, 22% above the current price.

As Cointelegraph reported, a decisive break above the $2,100 resistance and the 50-day EMA at $2,200 will have the bulls target $2,600 next.
This article does not contain investment advice or recommendations. Every investment and trading move involves risk, and readers should conduct their own research when making a decision. While we strive to provide accurate and timely information, Cointelegraph does not guarantee the accuracy, completeness, or reliability of any information in this article. This article may contain forward-looking statements that are subject to risks and uncertainties. Cointelegraph will not be liable for any loss or damage arising from your reliance on this information.
Crypto World
BTC Rejected at $74K Amid Rising Middle East Tensions, BlackRock’s ETHB Debuts: Weekly Recap
BTC experienced some intense volatility on Friday after the release of the US PCE data. However, its rally was quickly halted.
It was another eventful week, with the headlines strongly focused on the quickly developing (and, in most cases, worsening) situation in the Middle East as both sides continue to hit each other, or allies.
In the meantime, the ever-volatile cryptocurrency industry responds to almost all new developments. Bitcoin, for example, started the week on the wrong foot, slipping from $68,000 on Sunday to a multi-day low of $65,600 when almost all financial markets opened for trading after the strikes and statements during the weekend.
However, the bulls were quick to intervene and didn’t allow further decline. Instead, BTC began its gradual recovery, which saw it near $70,000 by Wednesday. After the initial rejection, the bulls stepped up and pushed the asset to almost $72,000. It faced more resistance at this level and returned to $69,000 when the US CPI numbers came out later that day.
Although expectations and reality met, BTC remained relatively calm at first, but jumped by nearly two grand later on after Trump said there’s “practically nothing left to target” in Iran. Following another volatile session around $70,000, the cryptocurrency went on the offensive on Friday after the release of the US PCE data for January. which showed a 0.3% MoM increase, and a 2.8% YoY rise.
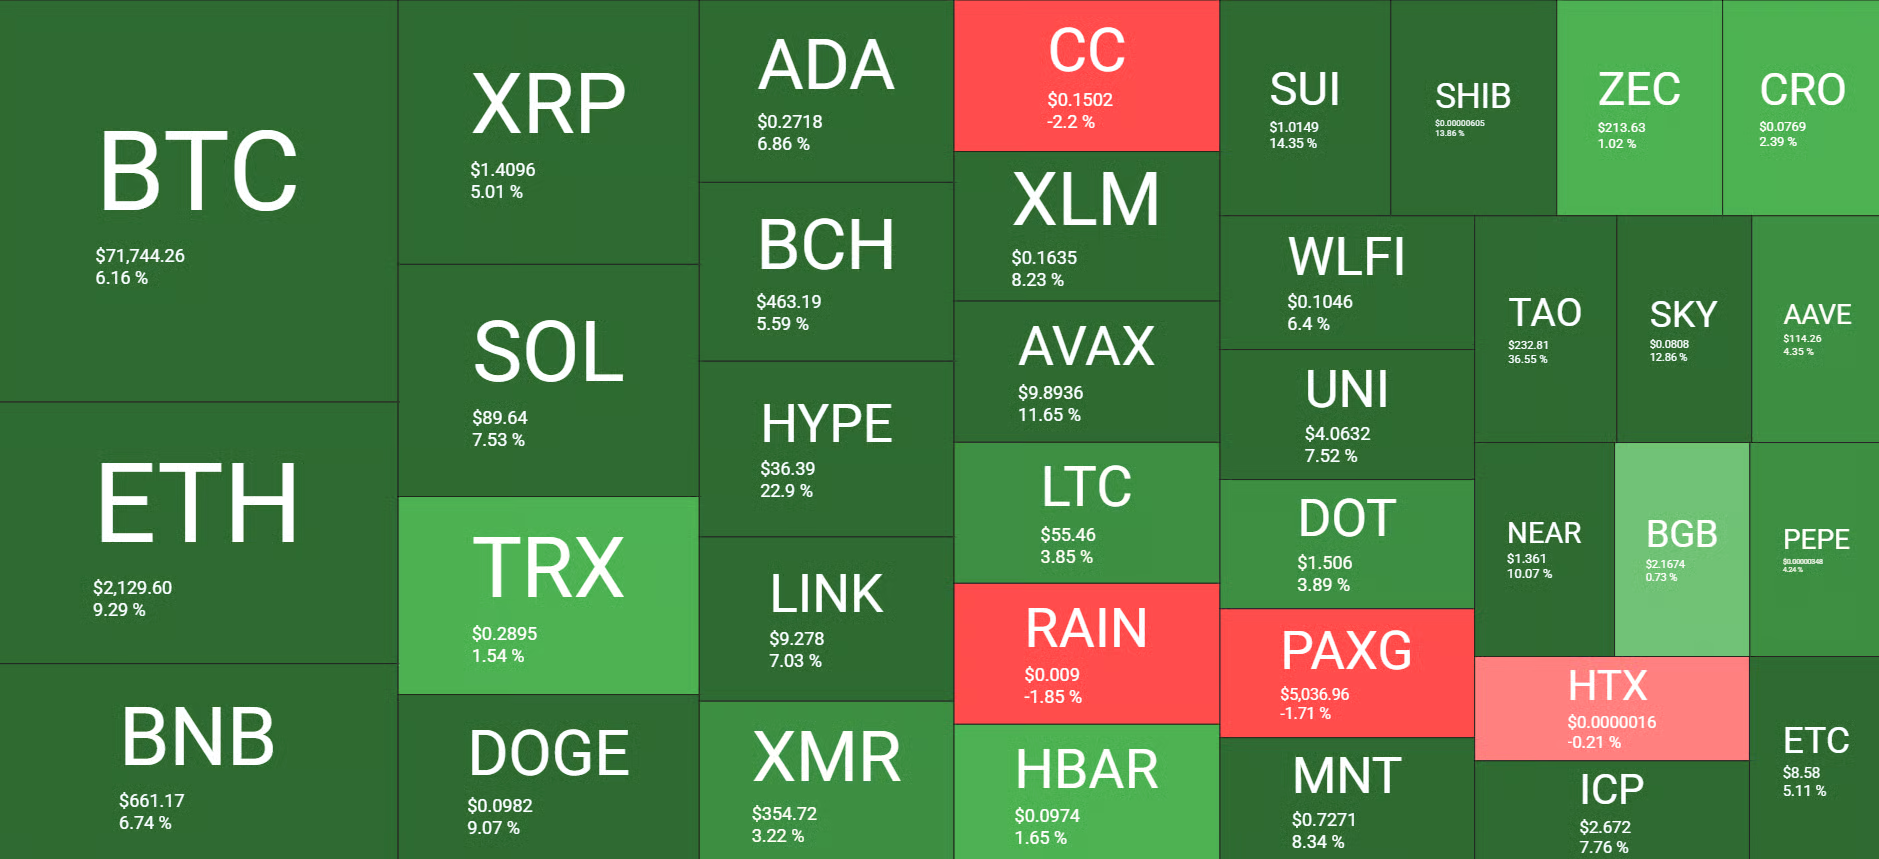
Bitcoin tapped $74,000 for the second time in the past 10 days, but it was stopped once again and driven south by over two grand. Nevertheless, it’s still 6% up weekly, similar to BNB, XRP, and SOL. Ethereum has added almost 10% in the past seven days, while HYPE has exploded by 23%.
Market Data
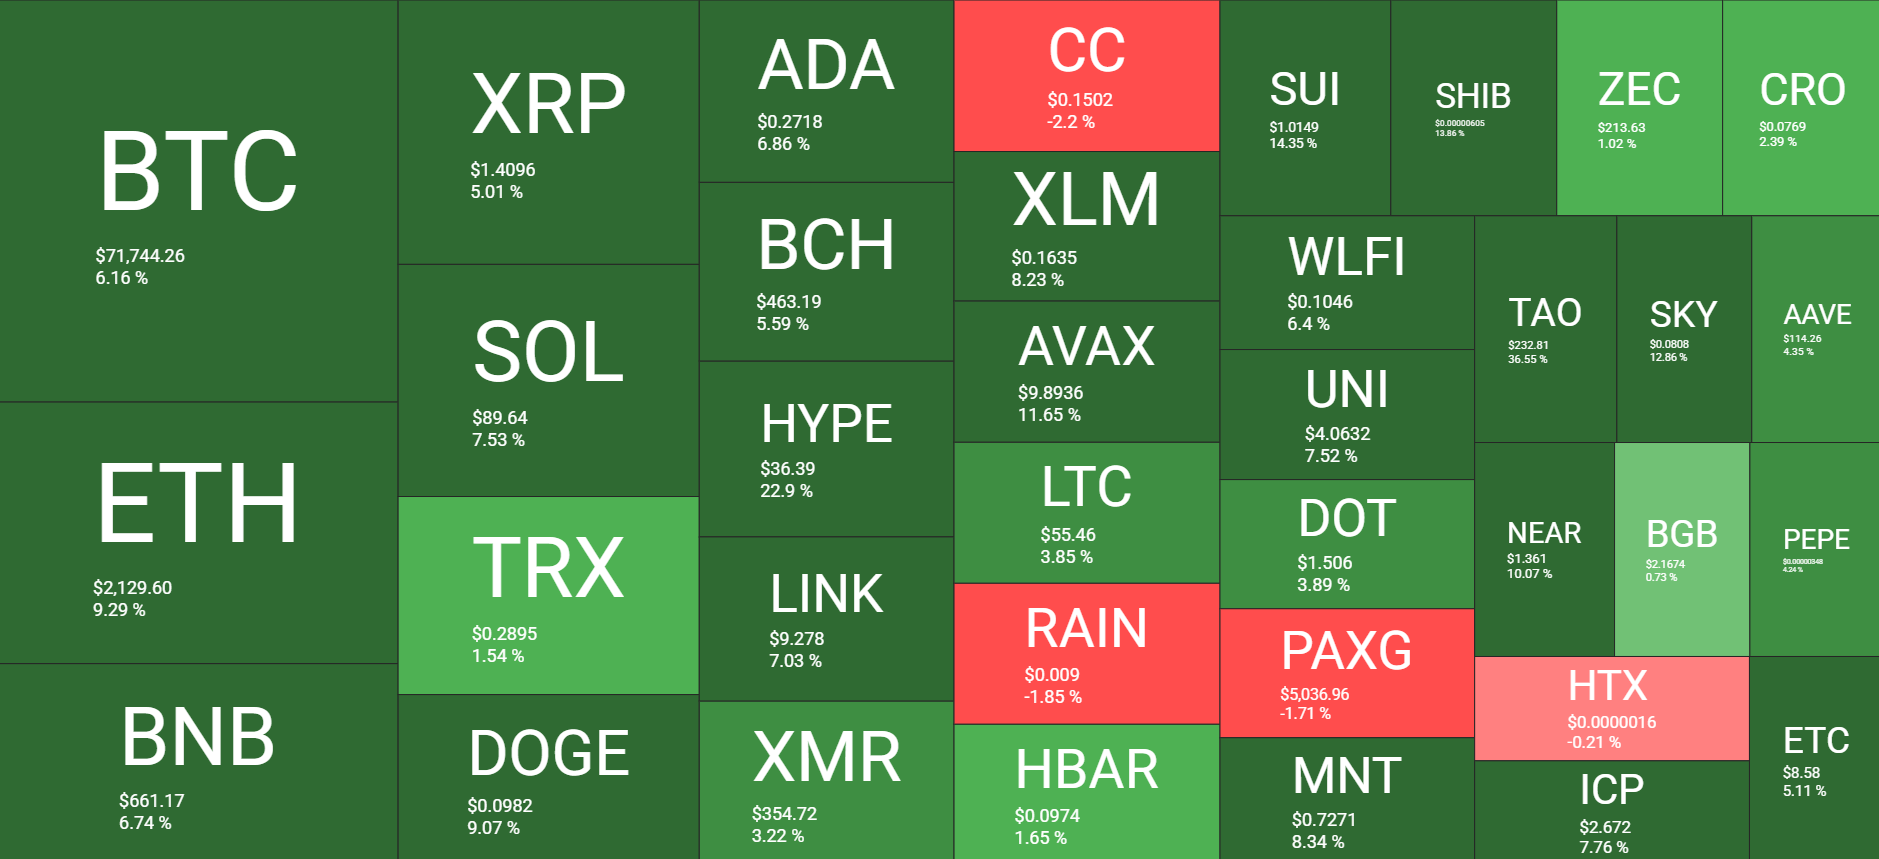
Market Cap: $2.52T | 24H Vol: $138B | BTC Dominance: 56.9%
BTC: $71,700 (+6.1%) | ETH: $2,130 (+9.3%) | XRP: $1.4 (+5%)
You may also like:
This Week’s Crypto Headlines You Can’t Miss
BlackRock Staked Ethereum ETF Sees $15.5M First-Day Volume. Perhaps the most significant piece of industry news this week came from the world’s largest asset manager. BlackRock debuted a new sort of Ethereum ETF that allows investors to take advantage of the network’s staking function. The launch day saw $15.5 million in daily volume.
Ripple Targets $50B Valuation With $750M Buyback Amid Major Partnerships. A recent report indicated that Ripple has launched a share buyback program that puts it at a whopping valuation of $50 billion. Its plan is to repurchase up to $750 million in shares from employees and investors.
POTUS to Headline Gala for Top TRUMP Holders as Price Soars 50% After ATL. Following a consistent and painful decline for the meme coin TRUMP, the US President stepped up to headline a gala for the top asset holders in several weeks. The token reacted immediately with a massive 50% surge.
Here’s When Arthur Hayes Will Buy Bitcoin Again. The co-founder of BitMEX remains a bitcoin bull, but he believes the asset is likely to retrace again amid the ongoing conflict between the US and Israel on one side, and Iran on the other. As such, he said he might look for a new bottom below $60,000 before he starts accumulating again.
Binance Under DOJ Investigation for Possible Iran Sanctions Violations: WSJ. The Wall Street Journal reported that the US Department of Justice has begun an investigation into whether Binance was used in any form to help Iranian-linked wallets bypass American sanctions. Meanwhile, the exchange has sued the publication for defamation over an article from February 24.
Elon Musk Confirms Early Public Access Launch of X Money Next Month. Musk continues with his attempts to transform the social media platform, and indicated that users will receive public access to X Money in April.
Charts
This week, we have a chart analysis of Ethereum, Ripple, Cardano, Binance Coin, and Hyperliquid – click here for the complete price analysis.
Binance Free $600 (CryptoPotato Exclusive): Use this link to register a new account and receive $600 exclusive welcome offer on Binance (full details).
LIMITED OFFER for CryptoPotato readers at Bybit: Use this link to register and open a $500 FREE position on any coin!

Slow Growth Keeps Me On The Sidelines For First Hawaiian Stock (NASDAQ:FHB)

Man Allegedly Killed Girlfriend and Left Her Body in Backyard

TUS launches AI-powered digital platform for professionals and employers


-

 News Videos5 days ago
10th Algebra | Financial Planning | Question Bank Solution | Board Exam 2026
-
 Tech3 days ago
A 1,300-Pound NASA Spacecraft To Re-Enter Earth’s Atmosphere
-

 Crypto World4 days ago
Paradigm, a16z, Winklevoss Capital, Balaji Srinivasan among investors in ZODL
-

 Business3 days ago
ExxonMobil seeks to move corporate registration from New Jersey to Texas
-

 Tech3 days ago
ChatGPT will now generate interactive visuals to help you with math and science concepts
-

 Fashion9 hours ago
Weekend Open Thread: Addict Lip Glow
-

 Sports6 days ago
Three share 2-shot lead entering final round in Hong Kong
-

 Sports6 days ago
Braveheart Lakshya downs Lai in epic battle to enter All England Open final | Other Sports News
-

 NewsBeat2 days ago
Residents reaction as Shildon murder probe enters second day
-

 Business5 days ago
Search for Nancy Guthrie Enters 37th Day as FBI Probes Wi-Fi Jammer Theory
-

 Business3 days ago
Search Enters Sixth Week With New Leads in Tucson Abduction Case
-
 NewsBeat4 days ago
Pagazzi Lighting enters administration as 70 jobs lost and 11 stores close across Scotland
-

 Tech5 days ago
Despite challenges, Ireland sixth in EU for board gender diversity
-

 Business4 days ago
Search Enters 39th Day with FBI Tip Line Developments and No Major Breakthroughs
-

 NewsBeat3 days ago
I Entered The Manosphere. Nothing Could Prepare Me For What I Found.
-

 Business7 days ago
Iran war enters second week as Trump demands ’unconditional surrender’
-

 Sports5 days ago
Skateboarding World Championships: Britain’s Sky Brown wins park gold
-

 Crypto World4 days ago
Will Chainlink price reclaim $10 amid volatility squeeze?
-

 Sports5 days ago
Tomorrow’s Top 25 Today: Florida jumps to No. 4; Louisville, Wisconsin enter projected rankings
-

 Sports2 days ago
PWHL, Senators discussing plan to keep Charge in Ottawa