
Crypto World
Solana price slips back into old range as 78 support comes
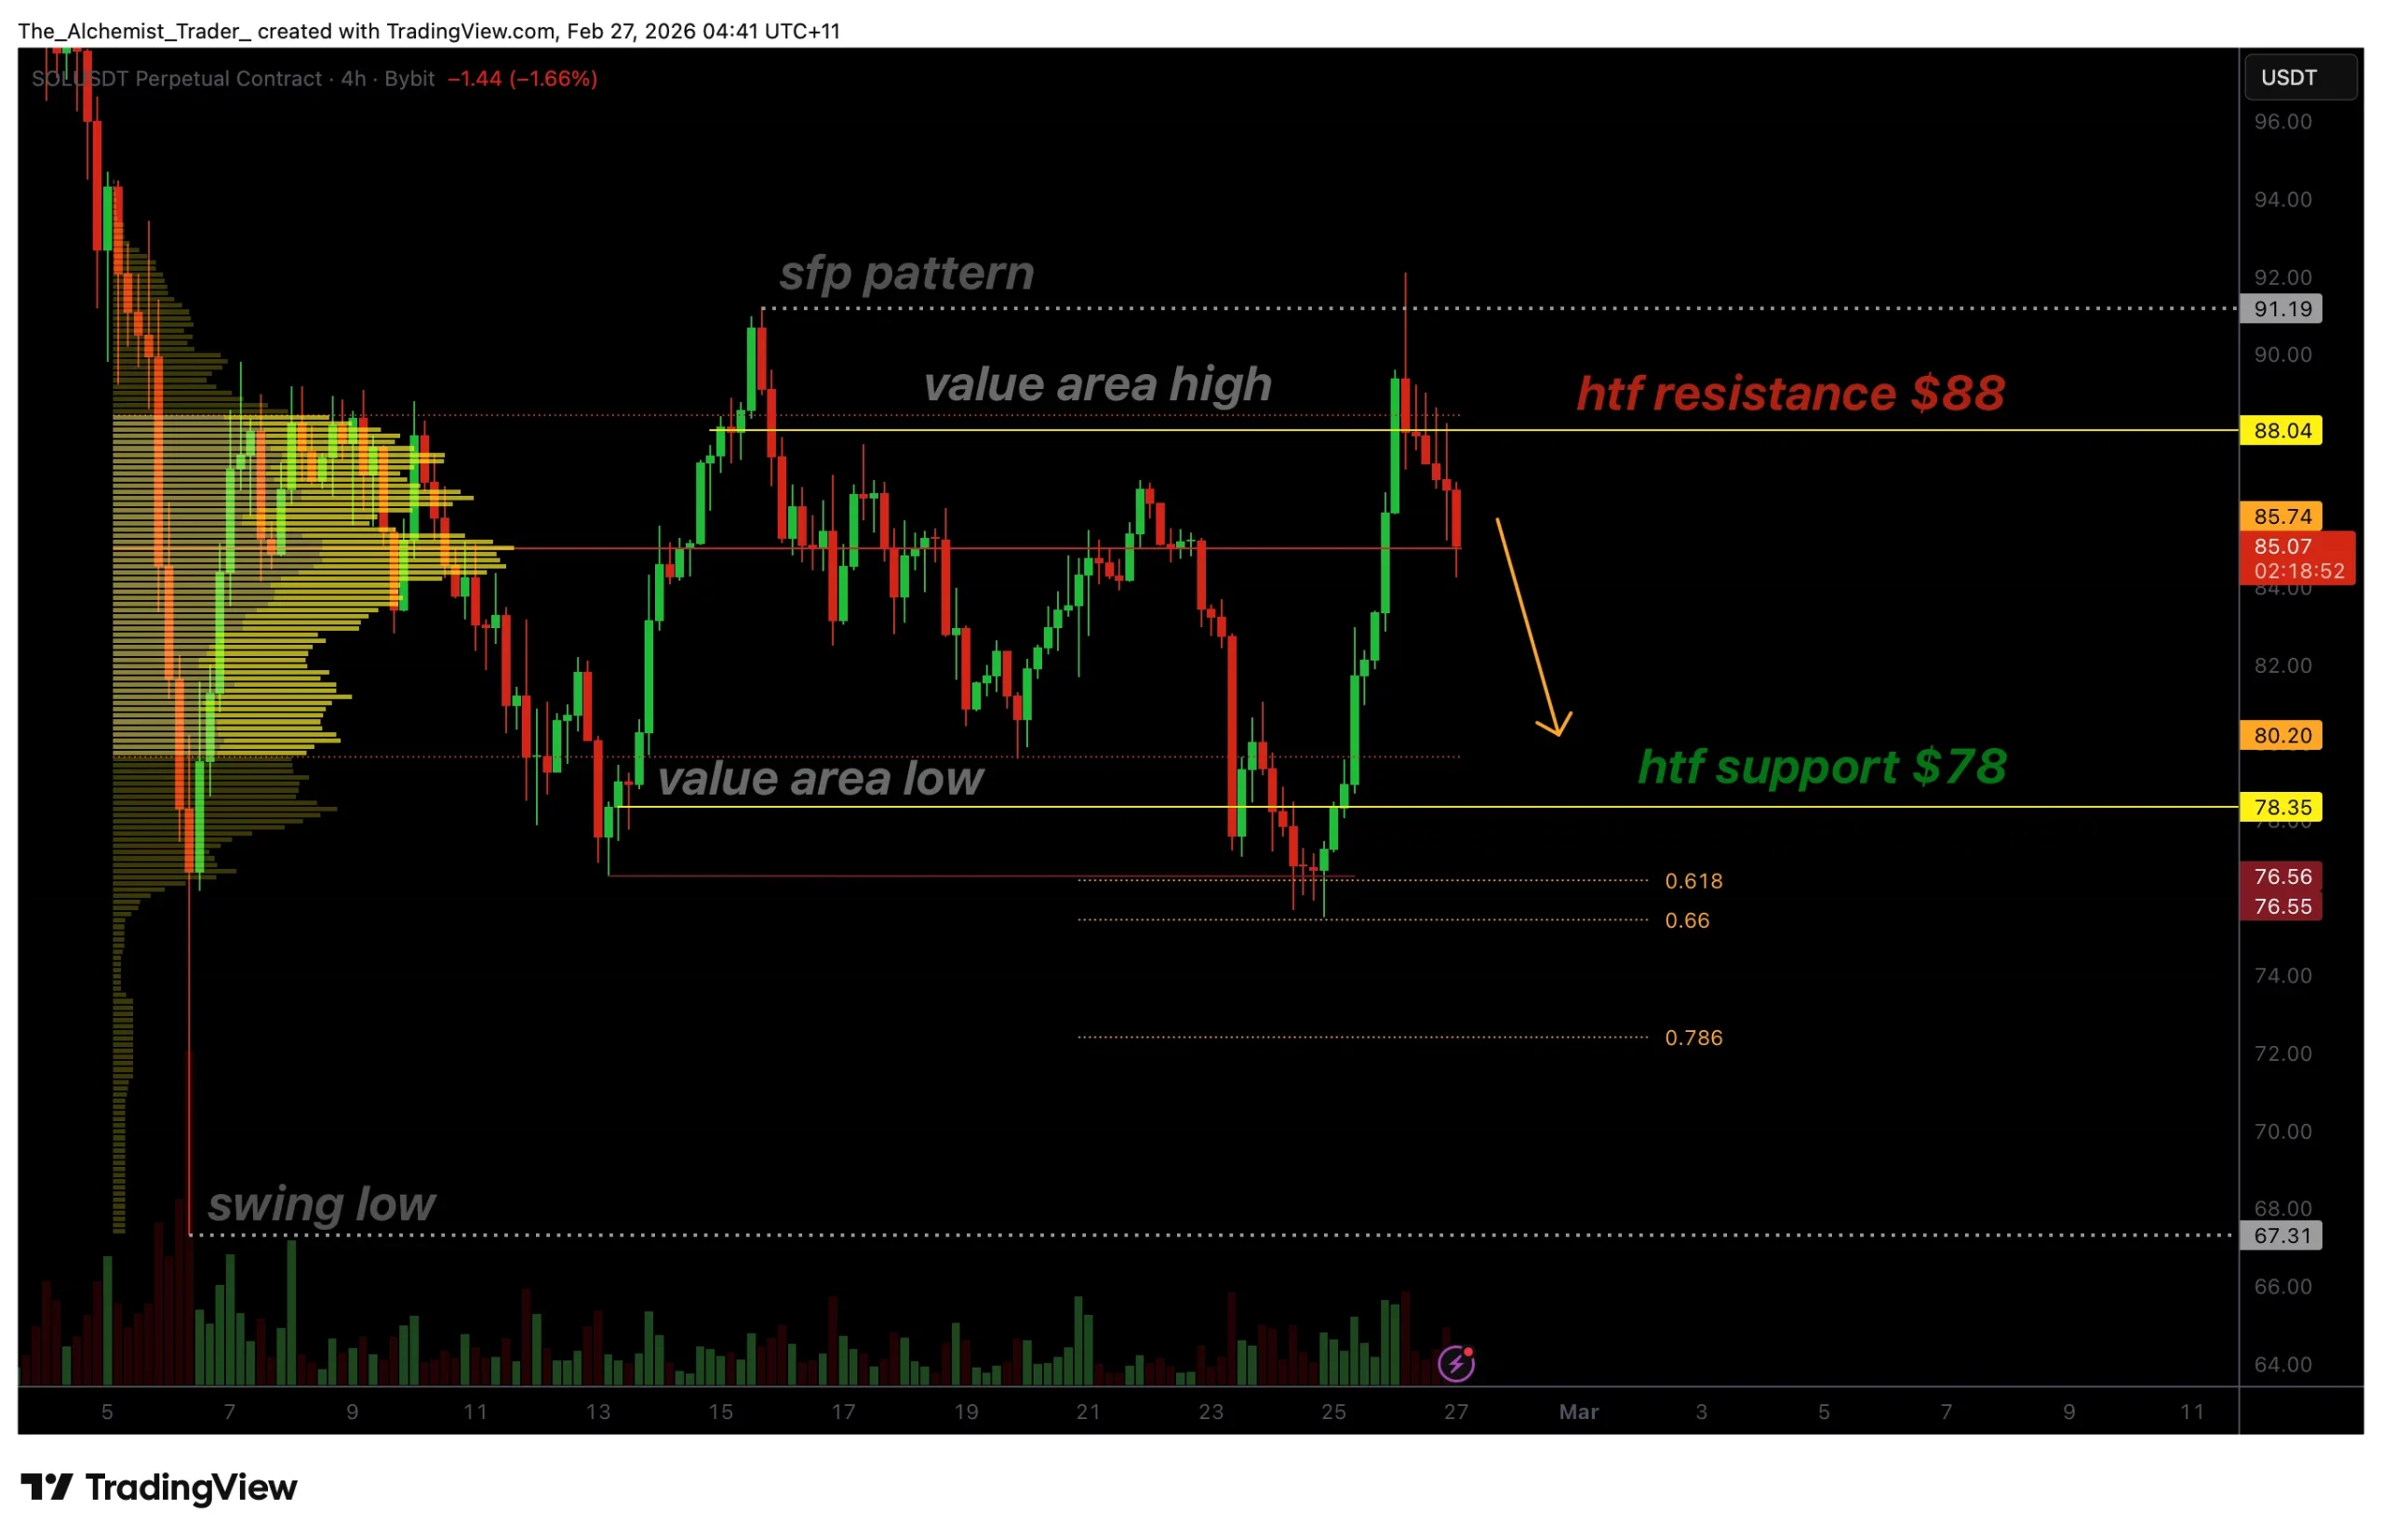
Solana price has turned corrective after losing key support near $88, pushing price back into its previous trading range. The shift in market structure now places $78 support at risk as downside pressure builds.
Summary
- Loss of $88 support flips level into resistance
- Price re-enters established trading range structure
- $78 value area low becomes next key downside support
Solana’s (SOL) recent price action signals a transition away from bullish continuation and back into range-bound conditions. After failing to hold above a major technical level, the market has begun rotating lower, reflecting weakening momentum and growing seller control.
The loss of a key support zone has altered short-term structure, increasing the probability that Solana revisits lower range support before any sustained recovery can develop.
Solana price key technical points
- Lost Support: $88 level flips into resistance alongside the value area high.
- Structural Shift: Price has re-entered its previous trading range.
- Downside Target: $78 aligns with the value area low and high timeframe support.
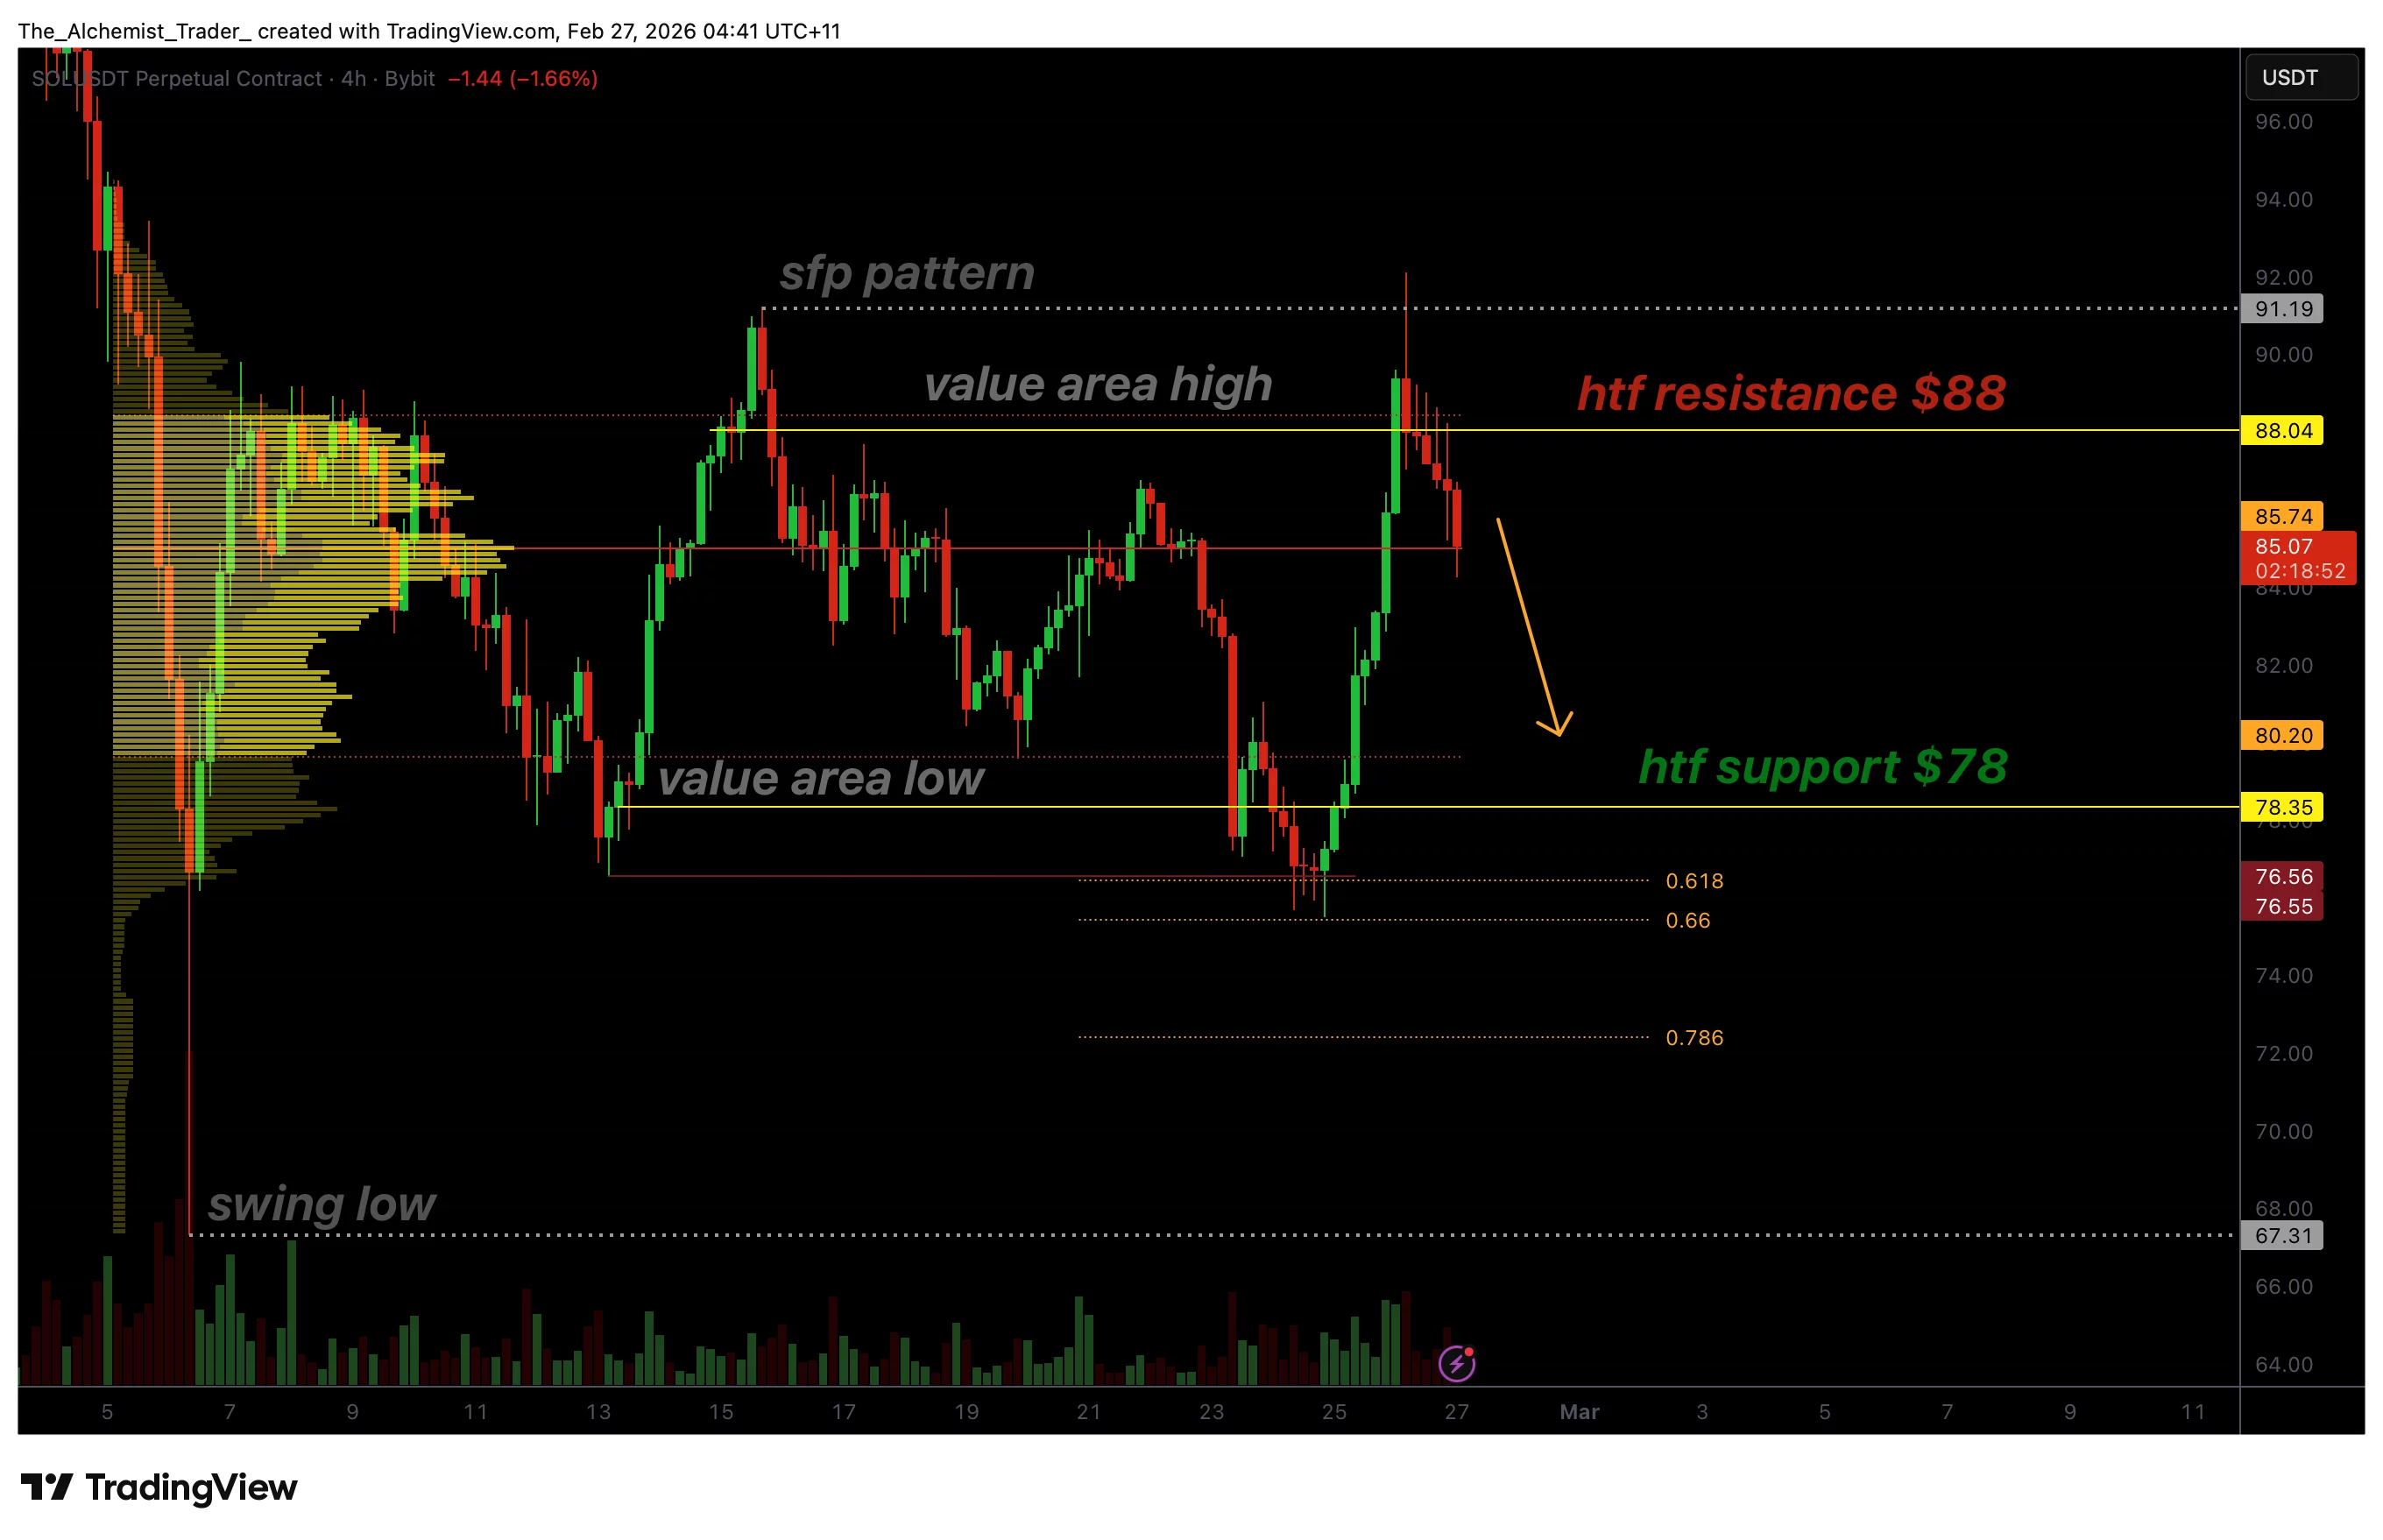
Solana recently lost the important $88 level, which previously acted as a structural support zone. This area also aligned with the value area high, making it a strong technical confluence region. When price loses a value area boundary, it often signals rejection rather than continuation, forcing markets back toward equilibrium within the established range. The failure to hold above this level confirms that buyers were unable to maintain control following the prior recovery attempt.
With the loss of $88 support, Solana has effectively reverted into its previous trading range. Range environments typically trap price action between clearly defined highs and lows, creating rotational market behavior rather than trending movement. In this case, the range low and major support zone sits near $78, which coincides with the value area low and high timeframe demand.
This comes as Step Finance announced it will shut down its Solana-based platforms following a January exploit that drained roughly $40 million, adding to cautious sentiment surrounding the ecosystem.
Currently, price action is hovering near the Point of Control (POC), the level representing the highest volume traded within the range. The POC often functions as equilibrium between buyers and sellers. Solana barely holding this level suggests market indecision, but it also signals vulnerability. A confirmed close below the POC would indicate acceptance at lower prices, significantly increasing the probability of a move toward range support.
From a market structure perspective, the current movement appears corrective rather than impulsive. Corrective phases typically unfold through gradual rotations toward liquidity pools where demand previously emerged. The absence of strong bullish continuation after losing support further reinforces the corrective bias. Without reclaiming $88 resistance, upside momentum remains limited.
Volume dynamics also support the corrective outlook. The recent decline has not been met with strong accumulation signals, suggesting buyers are waiting at deeper value zones rather than defending mid-range prices. This behavior is common within established ranges, where participants prefer to engage at extremes rather than within the middle of consolidation.
If Solana continues to trade below former support turned resistance, price action is likely to gravitate toward the lower boundary of the range. The $78 level therefore becomes a critical area to monitor. A reaction at this support could trigger a relief bounce or range continuation, while a breakdown below it would expose Solana to a broader structural reset. This comes as Zora expanded onto the Solana blockchain with the launch of its new “attention markets” platform, signaling continued ecosystem development despite the current corrective structure.
Despite the short-term weakness, range environments are not inherently bearish. Instead, they represent periods of market balance where liquidity accumulates before the next major expansion. For now, Solana remains confined within this structure, with directional clarity dependent on either reclaiming resistance or testing deeper support.
What to expect in the coming price action
Solana is likely to continue rotating within its established trading range unless bulls reclaim the $88 resistance level. Failure to hold the POC increases the probability of a move toward $78 support, where the next meaningful reaction is expected to occur.

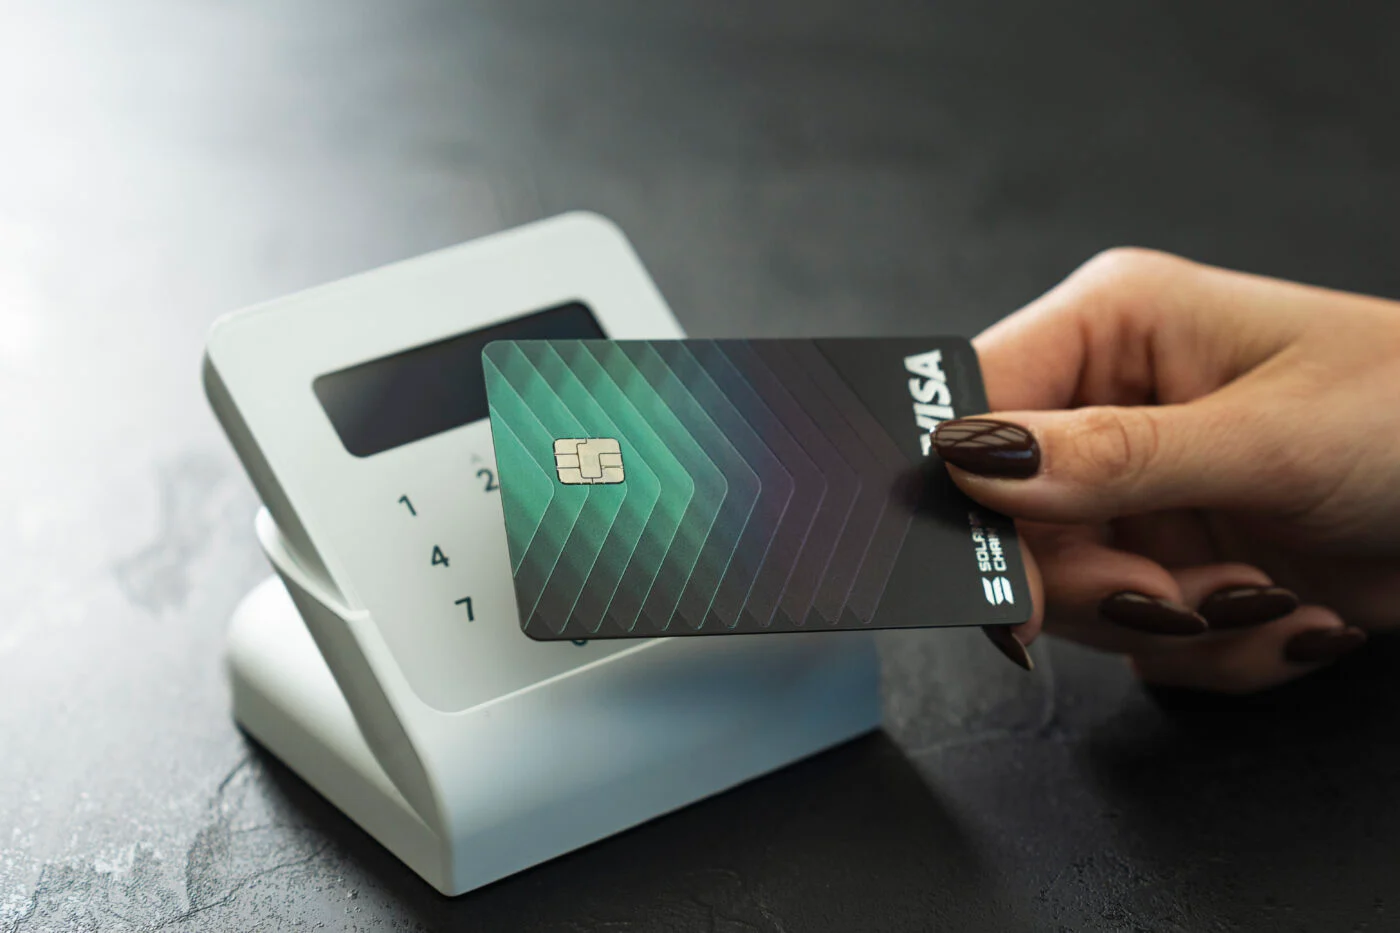
A crypto card can look simple. You tap to pay, shop online, or withdraw cash, and it works much like a regular card.
Still, the total cost is not always obvious. Depending on the provider, users may pay blockchain fees, conversion costs, foreign exchange charges, ATM fees, or merchant markups. Some of those costs appear clearly. Others are built into the rate or show up only at checkout.
That is why the real cost of a crypto card is not one single fee. It is the total cost of moving funds, converting them, and spending them.
Network fees can start before you even spend
The first cost can appear when a user moves crypto into a wallet or account linked to the card. In that case, the blockchain may charge a network fee, often called a gas fee.
That fee usually does not come from the card provider. Instead, it comes from the network that processes the transaction. As a result, the cost can change depending on which blockchain the user picks and how busy that network is.
So even before the card is used for a purchase, the funding step may already carry a cost.
The exchange rate can include a hidden conversion cost
Many crypto cards convert crypto into fiat at the moment of payment. In some cases, that conversion cost appears as a stated fee. In other cases, it sits inside the exchange rate itself.
That difference matters. A card may look cheap on paper, but the user may still pay more through the rate used to convert crypto into dollars, euros, or another currency.
So when comparing cards, users should not look only at the fee page. They should also look at how the provider handles conversion.
Foreign purchases can trigger FX fees
When a card is used in a different currency, foreign exchange fees can apply. That is common when users travel, shop on foreign websites, or withdraw cash abroad.
In some cases, the card network sets one rate and the issuer adds its own FX fee on top. That means the final cost can rise even when the transaction goes through normally.
This is one reason why cross border spending often costs more than a domestic purchase.
DCC is one of the clearest ways to overpay
Another common cost appears at the terminal. When a user pays abroad, the merchant or ATM may ask whether to charge the card in the user’s home currency instead of the local one. That is Dynamic Currency Conversion, or DCC.
It often looks convenient, but it usually costs more. BEUC, the European Consumer Organisation, said consumers are financially worse off in “practically every single case” when they accept DCC. The same paper cited research showing DCC was on average 7.6% more expensive in one study, while the highest markup reached 12.4%.
So the cleaner option is usually the local currency, not the home currency shown on the screen.
A simple DCC example
|
Option |
What happens |
Typical result |
| Pay in your home currency through DCC | The merchant or ATM converts the purchase | Often a worse rate than letting the card network handle it |
| Pay in the local currency | The card network and issuer handle the conversion | Usually the more standard and lower cost route |
That difference may look small on one purchase. Still, it adds up across repeated payments and withdrawals. BEUC’s paper also found examples where payment markups in stores ranged from 2% to 5%, while ATM DCC increases ran from 2.6% to 12% in one dataset.
ATM withdrawals can stack several fees at once
Cash withdrawals are another area where costs can pile up fast. First, the ATM operator may charge its own fee. Then the card issuer may add a withdrawal fee. If the withdrawal is in a foreign currency, an FX fee may apply as well.
So one ATM transaction can combine several charges in a single step. That is why withdrawing cash is often one of the more expensive ways to use a crypto card.
Users should check both the card provider’s fee schedule and the ATM screen before confirming the transaction.
 Card holds are not fees, but they still affect spending
Not every unexpected charge is a fee. Hotels, fuel stations, car rentals, and some online merchants often place a temporary hold on the card before the final charge settles.
That hold reduces the available balance for a period of time. Later, the merchant posts the final amount and releases the unused part.
So while a hold is not a direct cost, it can still confuse users and make the card balance look lower than expected.
Other small charges can still matter
Some crypto cards also charge for physical card shipping, replacement cards, premium plans, or inactivity. These costs are not the same across the market, so they should not be treated as universal.
That is why the fee page matters as much as the headline promise. A provider may advertise low spending fees while charging in other places.
In short, the total cost depends on the full structure, not one line in the marketing copy.
What cost can look like in practice
A user may pay one fee to move crypto onchain, another cost through the conversion rate, another fee on a foreign purchase, and another markup if DCC is accepted by mistake. Then, if the same user withdraws cash abroad, ATM and FX charges may come on top.
KAST’s public fee page offers one example of how that structure can work. It says non-USD card purchases carry a foreign exchange fee of 0.5% to 1.75%, depending on the countries involved. It also says ATM withdrawals cost $3 plus 2% of the withdrawal amount, with the same 0.5% to 1.75% FX fee added for non-USD withdrawals.
That example does not make crypto cards unusually expensive. It simply shows that the total cost often comes from several layers, not one headline fee.
If you want to see how a real fee schedule is laid out before you travel or spend abroad, take a minute to explore KAST.
The main point on cost
Crypto cards are easier to understand when each cost is separated clearly. The main ones to watch are network fees, conversion costs, FX fees, DCC markups, ATM charges, and temporary holds.
Among them, DCC remains one of the clearest traps because it can make a transaction more expensive without adding any real benefit for the cardholder. BEUC’s findings underline that point.
So the simplest rule is this: check how the card handles conversion, read the fee page before using it abroad, and choose the local currency when a terminal gives you the choice.


Enhanced Labs raised a $1 million pre-seed led by Maximum Frequency Ventures to expand options-based yield strategies across on-chain and tokenized real-world assets.
Summary
- Enhanced Labs secures $1 million pre-seed round led by Maximum Frequency Ventures.
- Backers include GSR, Selini, Flowdesk and several angel investors.
- Funds will expand options-based yield strategies to more on-chain and tokenized real-world assets.
U.S.-based DeFi infrastructure startup Enhanced Labs has closed a $1 million pre-seed funding round to expand its options-based yield products across a wider range of on-chain assets, including tokenized real-world assets. The round was led by Maximum Frequency Ventures, with market-making and trading firms GSR, Selini and Flowdesk joining alongside a group of undisclosed angel investors. According to the company, the capital will be used to support product development, operations and go-to-market efforts.
Enhanced Labs positions itself as a provider of “options-based yield strategies” designed to sit on top of existing DeFi and tokenization rails, rather than competing directly with spot lending or simple staking. By extending these structured strategies to tokenized real-world assets, the firm is effectively betting that on-chain treasuries, credit, commodities and other RWAs will need the same kind of yield engineering and risk-transfer mechanisms that already exist in traditional markets. The goal is to package those exposures in a way that can be deployed programmatically, but still remain accessible to institutions that need clearer risk parameters than typical DeFi products offer.
Backing from names like GSR, Selini and Flowdesk suggests Enhanced Labs is targeting the intersection of market-making, derivatives and on-chain liquidity rather than retail-facing savings products. For these investors, options-based yield on tokenized assets is not just a new narrative but a potential source of structured flow if RWAs continue to move on-chain. The pre-seed size is modest by bull-market standards, but at this stage the more important signal is that specialized trading firms are willing to seed infrastructure aimed at making RWAs behave more like fully featured, hedgeable collateral.
If Enhanced Labs executes, it could help close one of the gaps in today’s tokenization pitch: plenty of projects can put a bond or a real-estate claim on-chain, but far fewer can offer a robust menu of ways to hedge, lever or generate predictable income on top of those assets. Whether a $1 million war chest is enough to build those tools—while navigating the regulatory and risk constraints that come with engineering yield on real-world exposures—remains an open question.
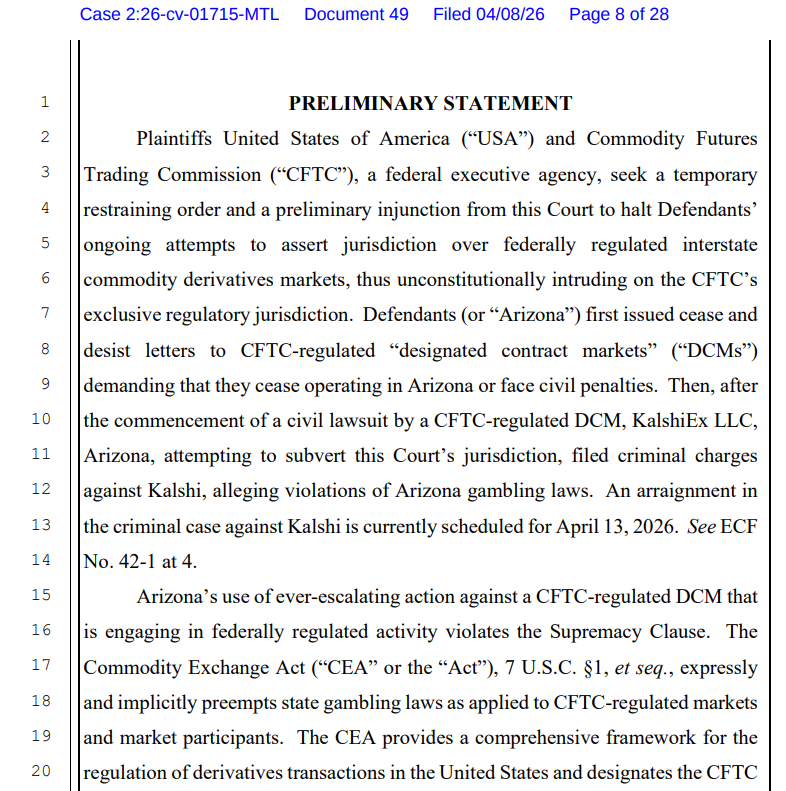
The US Department of Justice (DOJ) and Commodities and Futures Trading Commission (CFTC) asked a federal court to block Arizona from enforcing state gambling law against Kalshi’s event contracts, arguing that they fall under the CFTC’s exclusive authority over swaps markets.
The Wednesday filing argues that event contracts listed on federally regulated platforms such as Kalshi are swaps under the Commodity Exchange Act and therefore fall within the CFTC’s exclusive jurisdiction.
The filing says Arizona’s enforcement effort unlawfully intrudes on the CFTC’s exclusive jurisdiction over federally regulated event-contract markets.
If granted, the order would block Arizona from applying its gambling laws to prediction markets that are listed as federally regulated event contracts. An arraignment in the criminal case against Kalshi is currently scheduled for Monday.
Arizona Attorney General Kris Mayes announced charges against the companies behind Kalshi on March 17, accusing them of operating an “illegal gambling business in Arizona without a license” and offering illegal election wagering.
Kalshi co-founder and CEO, Tarek Mansour, claimed the charges were a “total overstep” and “not about gambling.”
Federal and state regulators clash over prediction markets
The dispute has become a major test of whether prediction market contracts belong under federal commodities law or state betting rules.

On April 2, the CFTC filed three separate lawsuits against the gaming regulators of Illinois, Connecticut and Arizona, claiming that the event contracts offered by the platforms violated state gambling laws and licensing requirements.
In those suits, the CFTC says it has exclusive jurisdiction over CFTC-registered designated contract markets that list lawful event contracts. Kalshi is the clearest example in the current litigation.
Related: Kalshi, Polymarket face trading halt in Nevada after court rulings
Prediction markets are facing growing regulatory pressure in the US, where 11 states have pursued legal action against them.
Prediction market activity has been rising since the beginning of the US and Israeli military conflict with Iran, fueling renewed insider trading allegations, after six Polymarket traders netted $1 million by accurately betting when the US would strike Iran.
In response to insider trading concerns, Democratic Party Senator Adam Schiff has introduced legislation seeking to ban prediction markets on war, death and terrorism.
Magazine: Train AI agents to make better predictions… for token rewards
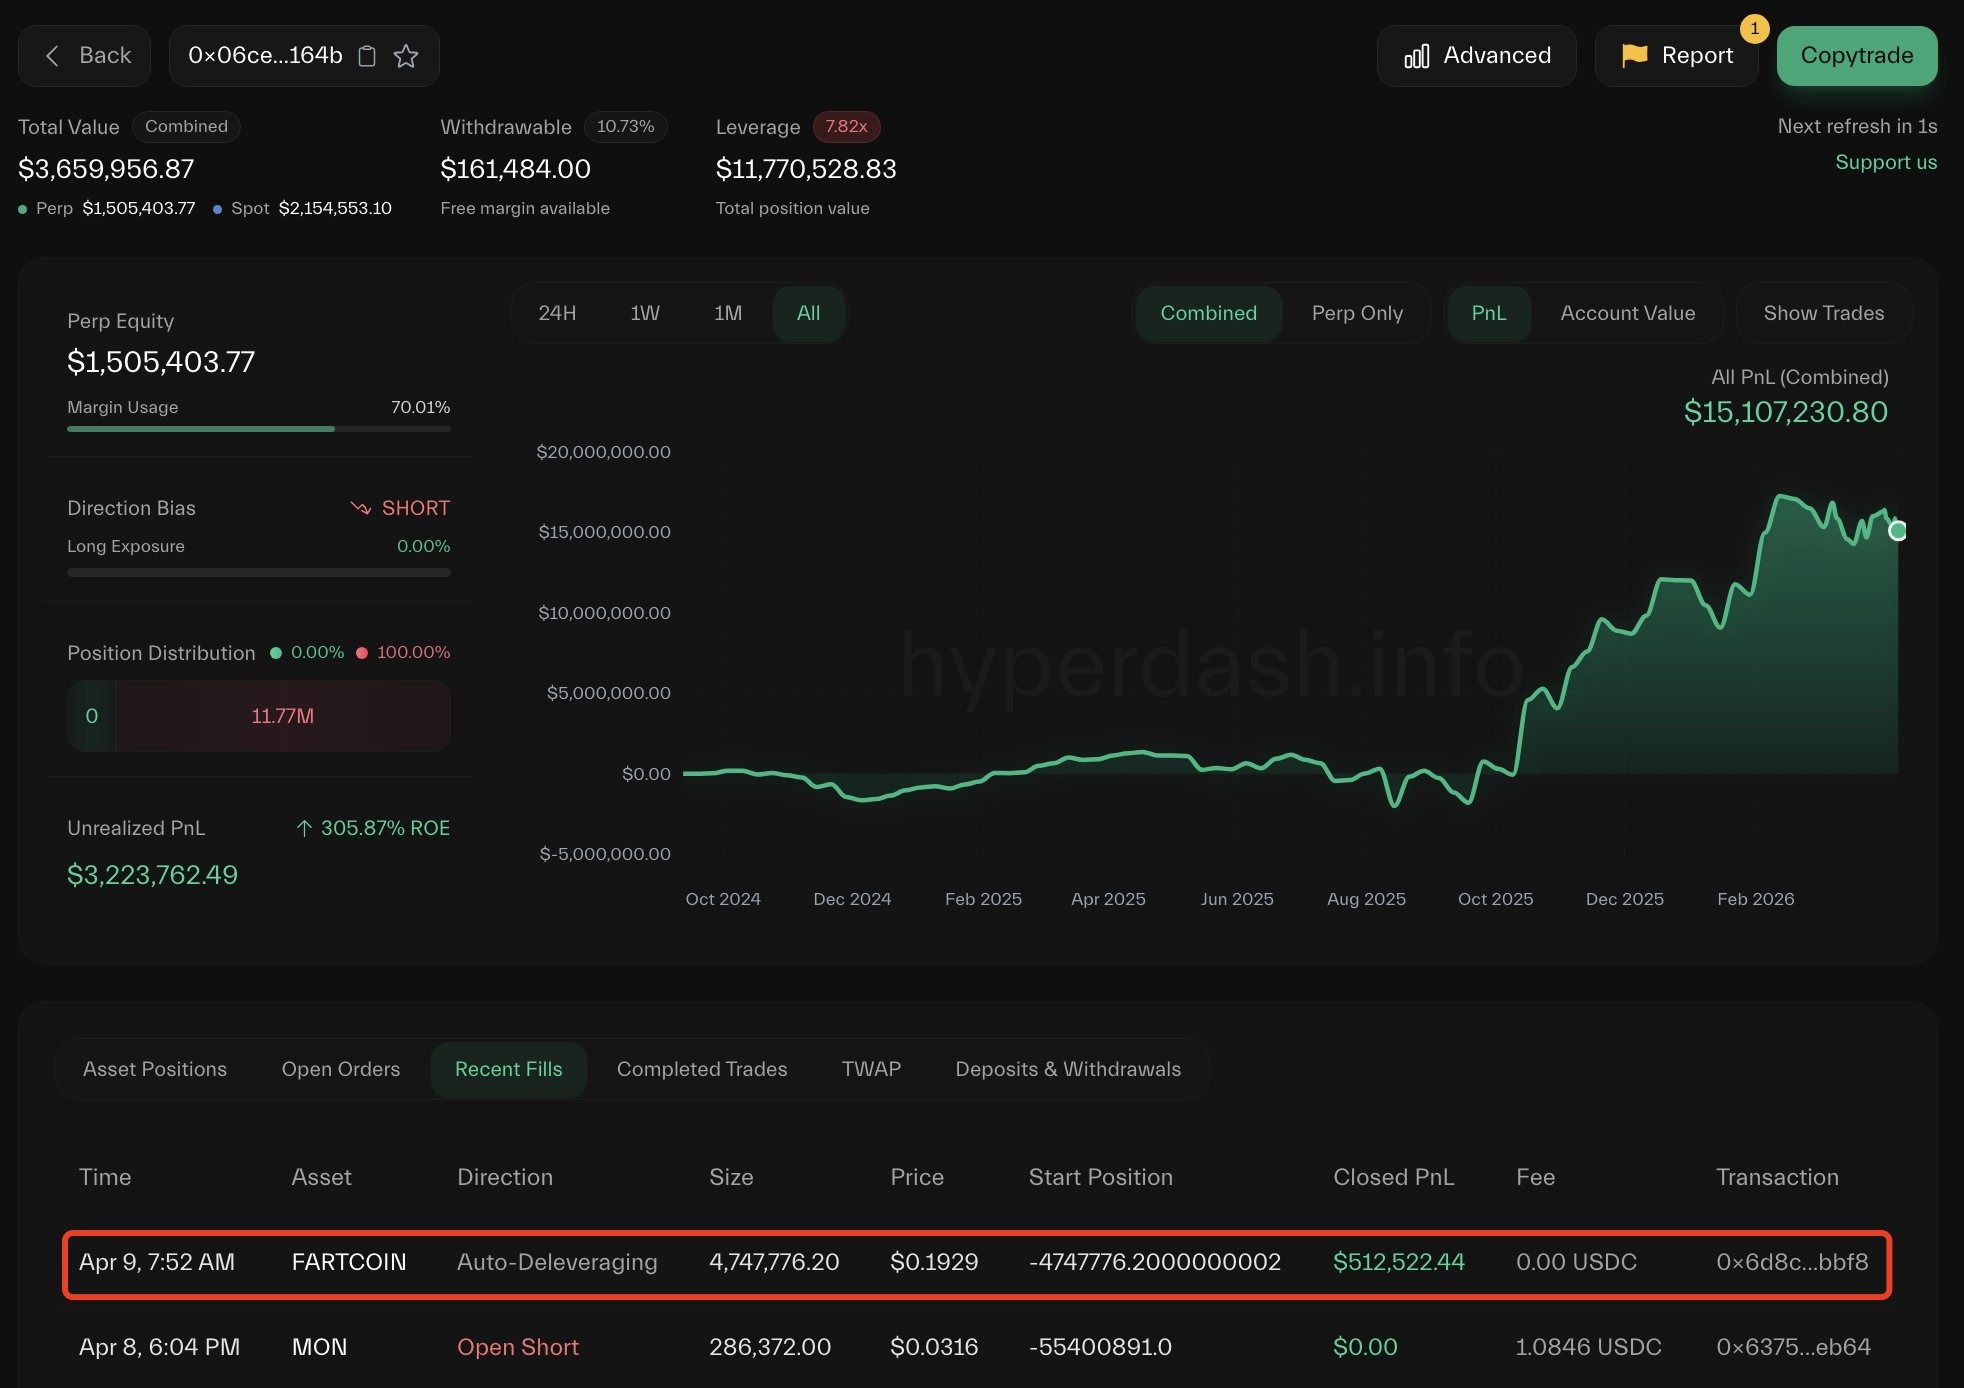
A trader lost about $3 million after building a large leveraged Fartcoin position on Hyperliquid that unraveled in thin liquidity, triggering the platform’s auto-deleveraging (ADL) mechanism.
Hyperliquid data flagged by Lookonchain shows that the trader accumulated about 145 million tokens across multiple wallets before being liquidated. The liquidation redistributed gains to opposing traders, with at least two wallets seeing around $849,000 through ADL.
PeckShield said the unwind produced about $3 million in accounting losses and left Hyperliquid’s HLP vault down roughly $1.5 million over 24 hours, though Hyperliquid had not publicly confirmed those figures by publication.
The episode highlighted how ADL can crystallize gains for traders on the other side of a collapsing position, while raising fresh questions about how Hyperliquid’s liquidation and vault structure behave in low-liquidity markets.

PeckShield said the activity appeared structured to trigger liquidations in low-liquidity conditions, potentially pushing losses onto Hyperliquid’s liquidity pool while being offset by positions elsewhere.
Cointelegraph reached out to Hyperliquid for comments, but had not received a response before publication.

Past trades exposed similar pressure on Hyperliquid’s liquidity system
This is not the first time Hyperliquid’s liquidity system has come under pressure from large, concentrated positions.
On March 13, 2025, the platform’s Hyperliquidity Provider (HLP) vault took a roughly $4 million hit after an oversized Ether (ETH) position was unwound, triggering liquidations under thin market conditions. After the incident, the team said that losses stemmed from market dynamics rather than a protocol exploit.
Related: Onchain perp DEX volumes fall for five straight months after October peak
A similar episode occurred later that month involving the JELLY memecoin. On March 27, 2025, a trader used multiple leveraged positions to exploit the platform’s liquidation system.
However, the final outcome remained unclear, with Arkham saying the trader withdrew about $6.26 million but may still have ended up down nearly $1 million.
On Nov. 13, 2025, a similar pattern occurred when a trader built large leveraged positions in the POPCAT market, triggering cascading liquidations that left a $5 million hole in the HLP vault. Community members said the strategy appeared designed to create and then remove liquidity to force the vault to absorb the impact.
Magazine: Solana exec trolls crypto gamers, Pixel tackles play-to-earn issues: Web3 Gamer
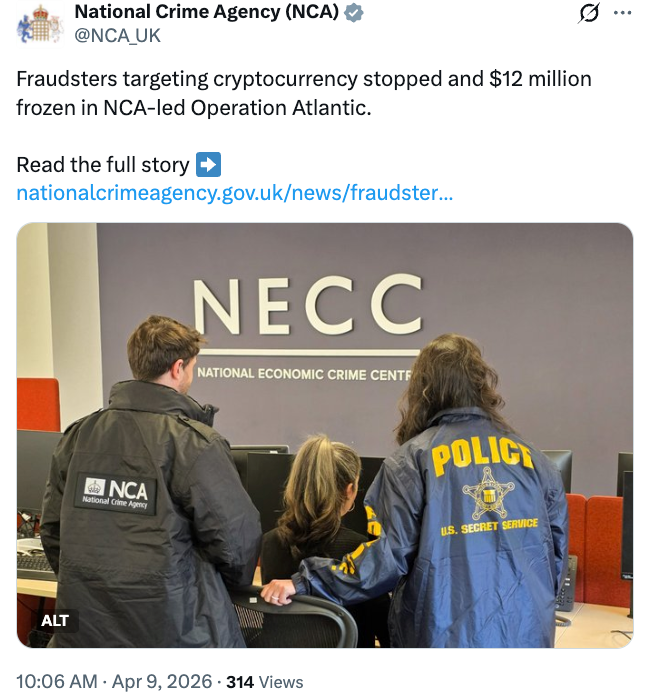
Authorities in the United States, United Kingdom and Canada have frozen millions of dollars tied to crypto scams in a joint enforcement operation called Operation Atlantic.
The operation, focused on phishing attacks, took place in March and was coordinated by the UK’s National Crime Agency (NCA), the US Secret Service, the Ontario Provincial Police and the Ontario Securities Commission.
Operation Atlantic identified more than 20,000 victims across the US, Canada and the UK, securing and freezing more than $12 million in suspected criminal proceeds, the NCA said Thursday. It also identified “more than $45 million stolen in cryptocurrency fraud schemes,” the agency added.
“Operation Atlantic is a powerful example of what is possible when international agencies and private industry work side by side,” NCA Deputy Director of Investigations Miles Bonfield said.
The operation involved assistance from major cryptocurrency exchange Binance, according to a separate statement by the company.

What is an approval phishing scam?
Approval phishing scams trick users into signing malicious permissions that allow attackers to access and drain crypto wallets.
Unlike typical scams, where perpetrators trick victims into sending them crypto, approval phishing misleads victims into unknowingly authorizing malicious transactions that allow scammers to spend specific tokens inside the victim’s wallet.

“Approval phishing is one of the most damaging types of scams targeting crypto users today,” said Flavio Tonon, Binance’s senior regional advisor for the Europe, Middle East and Africa region.
Related: Drift explains $280M exploit as critics question Circle over USDC freeze
He noted that the operation underscores how effective crime fighting is possible when private and public partners work together, adding that blockchain transparency makes it difficult for criminals to get away with phishing exploits.
No funds were frozen on Binance as part of the operation
Operation Atlantic included on-site investigations at the NCA’s London headquarters, where Binance said its Special Investigations team provided support, including live account screening and scam intelligence.
The company also provided insights on potential bad actors in order to assist with asset seizure efforts, and conducted research that identified scam websites that were still actively defrauding victims at the time of the operation.
Binance said no funds were frozen on Binance accounts.
Magazine: AI agents will kill the web as we know it: Animoca’s Yat Siu


Stablecoins are on track to become a foundational layer of global finance, with adjusted transaction volumes projected to reach $719 trillion by 2035, according to a new report by blockchain research firm Chainalysis on Wednesday.
The growth, driven by organic adoption alone, signals a structural shift in how value moves across borders and through everyday commerce, the research firm added.
Stablecoins moved more than $35 trillion on blockchain rails last year, noting that only roughly 1% was for real-world payments, according to a March report by McKinsey and blockchain data firm Atermis Analytics.
A key catalyst is the looming generational wealth transfer, with as much as $100 trillion expected to pass from Baby Boomers to Millennials and Gen Z over the coming decades. These younger cohorts, far more likely to use crypto as a financial instrument by default, are set to redefine payment preferences at scale, embedding digital assets into mainstream economic activity.
“When crypto becomes the default for the next generation of capital, the question is no longer if stablecoins compete with traditional rails, but how quickly they replace them,” Chainalysis said in its report.
At the same time, stablecoin transaction volumes are quickly converging with traditional payment networks. Chainalysis said that current trends suggest onchain payments could match Visa and Mastercard’s volumes no later than 2039, placing direct competitive pressure on legacy rails long defined by intermediaries, fees and delayed settlement.
Unlike card networks, stablecoins enable near-instant, 24/7 settlement and programmable transactions, reducing friction across remittances, business payments, and treasury operations. As merchant adoption expands, paying with stablecoins is increasingly shifting from a deliberate choice to invisible infrastructure, the firm added.
Chainalysis is also introducing a new category of blockchain intelligence agents, aimed at helping institutions navigate and operationalize this transition as digital assets move from the margins to the core of global finance.
“The institutions that build for onchain payments now will define the next era of global finance, while those that wait risk settling on someone else’s rails,” Chainalysis said.
In today’s newsletter, Joshua de Vos from CoinDesk breaks down cryptos performance in the first quarter, highlighting shifting institutional demand and new regulatory clarity setting the stage for Q2.
Q1 2026 Digital Asset Review
Digital assets closed Q1 2026 under meaningful pressure, extending a downturn that began in late 2025. As presented in CoinDesk’s latest “Quarterly Review and Outlook,” the quarter was shaped by escalating geopolitical tensions, a cautious Federal Reserve, and institutional flows that turned sharply negative before partially recovering into month-end.
Q1 in review
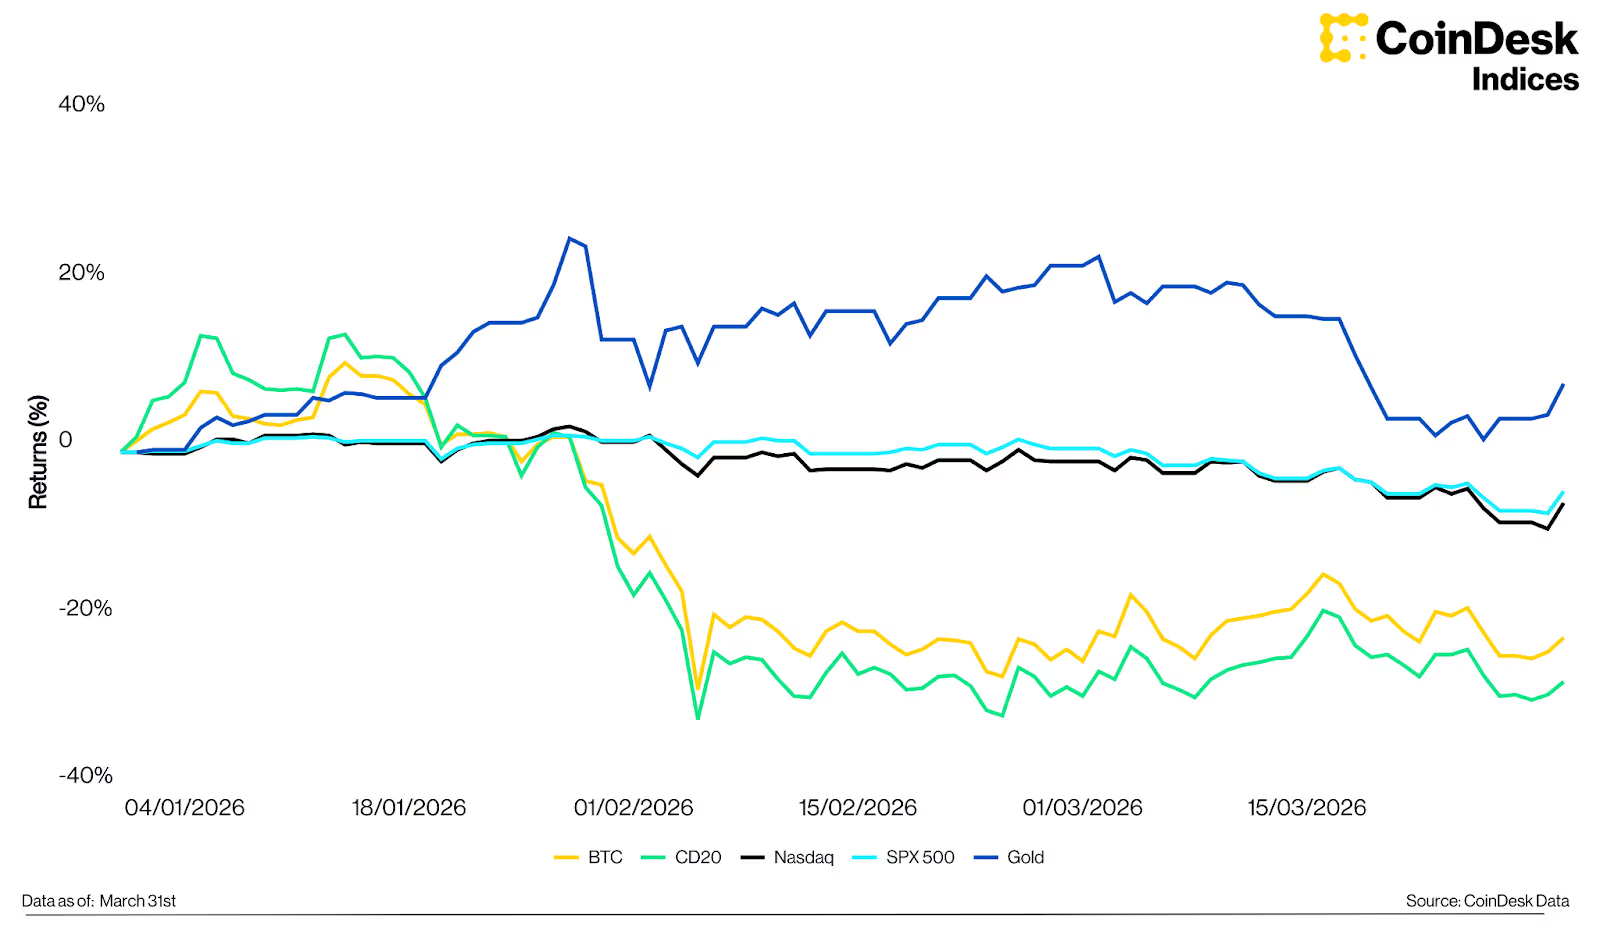
The CoinDesk 20 Index declined 27.4% to 1,952, while bitcoin fell 22.1% to $68,228; its second-largest quarterly decline since Q2 2022. Escalating tensions in the Middle East pushed crude oil above $100 per barrel, while the Federal Reserve held rates steady at 3.5%–3.75% following its March meeting. The S&P 500 and Nasdaq declined 4.63% and 5.98% respectively; gold was the standout, rising 8.19% to $4,671.
BTC vs gold vs SPX vs Nasdaq vs the CD20 Index, Q1 2026

A notable dynamic emerged in the quarter’s second half. Bitcoin had already declined roughly 30% from its February peak before geopolitical tensions escalated sharply in late February, suggesting much of the fear and forced liquidations had been priced in before the event. Since tensions intensified, bitcoin returned 3.54%, while the S&P 500 and Nasdaq fell 5.09% and 4.89%. The CoinDesk Memecoin Index was the weakest performer at -41.7%; the CoinDesk 80 outperformed bitcoin, declining 16.5%, with Hyperliquid (+43.8%) and Morpho (+40.9%) leading positive returns among its constituents.
BTC and CD20 Index vs selected assets, returns since Feb 28th

Institutional flows in focus
Among U.S. spot bitcoin ETFs, net outflows of $1.81B across January and February erased much of the institutional demand built during the prior year. Although March saw a recovery of $1.32B in inflows, Q1 closed with net redemptions of approximately $496M. Bitcoin’s stabilisation in March coincided with the return of positive net inflows, suggesting institutional positioning had begun to rebuild before the quarter ended.
Bitcoin ETF flows and BTC price, Q1 2026

In the spot ETF era, institutional flow data provides a real-time signal of sentiment unavailable in prior cycles. The March recovery sets a baseline worth watching for Q2, particularly as Morgan Stanley reportedly prepares a spot bitcoin ETF ($MSBT) at a 0.14% fee, designed to integrate into its network of over 16,000 advisors.
The regulatory picture clarifies
A joint SEC–CFTC ruling on March 17 designated 16 assets, including SOL, XRP and DOGE, as digital commodities and thus outside the securities definition. This removes a key regulatory overhang and opens the pathway for spot ETF approvals across a broader range of assets. Basket and index-based ETPs now rank second only to bitcoin-focused products by number of pending filings, with CoinDesk indices including the CD20 and CD100 increasingly referenced as natural benchmarks for these vehicles.
Number of pending crypto ETP applications, 2025

Looking ahead to Q2
Market direction in Q2 will be shaped by two variables: the trajectory of the Middle East conflict and the Federal Reserve’s response to inflation data. A de-escalation would ease energy price pressure and creates conditions for recovery; prolonged conflict would keep financial conditions tight. Bitcoin’s October 2025 peak near $126,000 and the subsequent correction are broadly consistent with the historical halving cycle, which typically produces an 18–24 month post-ATH drawdown. This cycle’s structural difference is institutionalised ETF demand; on peak days in 2024, inflows topped $1 billion, equivalent to absorbing over 30 days of mining supply in a single session. Combined with a more supportive regulatory environment and a deepening institutional product suite, the structural foundation entering this correction is meaningfully more durable than in prior cycles.
Constituent highlights
Ether declined 29.1% in Q1, with U.S. spot ether ETFs recording net outflows of $758 million. The more significant forward-looking development is Ethereum’s structural position in tokenised assets; 59.4% of total real-world asset supply resides on Ethereum as of Q1 2026. BlackRock’s ETHB staking ETF, launched on March 12 with a projected 3–7% annual yield, introduces an income-generating dimension to ETH that could broaden its appeal to yield-oriented allocators.
Solana declined 33.2% but registered a notable milestone: peer-to-peer stablecoin transaction volume reached a new all-time high of $832 billion in Q1 2026, reflecting a shift toward payments infrastructure. Solana’s real-world asset holder count also surpassed Ether for the first time, driven by platforms such as Ondo Global Markets and xStocks.
XRP declined 27.1%, but the narrative is increasingly centred on Ripple’s expanding institutional infrastructure. RLUSD reached a market capitalization of $1.42 billion by quarter-end, and Ripple’s acquisition strategy, spanning prime brokerage through Hidden Road ($1.25 billion, clearing $3 trillion annually) and treasury management through GTreasury ($1 billion), points toward a comprehensive financial ecosystem built around XRP and RLUSD. The key catalyst for Q2 is whether these integrations translate into measurable on-chain activity.
This summary was created based on CoinDesk Research’s latest report “Digital Assets: Quarterly Review and Outlook, Featuring CoinDesk 5 and CoinDesk 20.”
– Joshua de Vos, research team lead, CoinDesk
Keep Reading
- JP Morgan CEO Jamie Dimon says the bank must “move faster” with its blockchain efforts due to the threats banking faces from blockchain technology.
- Morgan Stanley’s own bitcoin ETF opened this week creating competition on Wall Street.
- The U.S. Treasury is pitching new rules for stablecoin issuers to treat them like every other financial firm that must maintain armor against illicit uses.
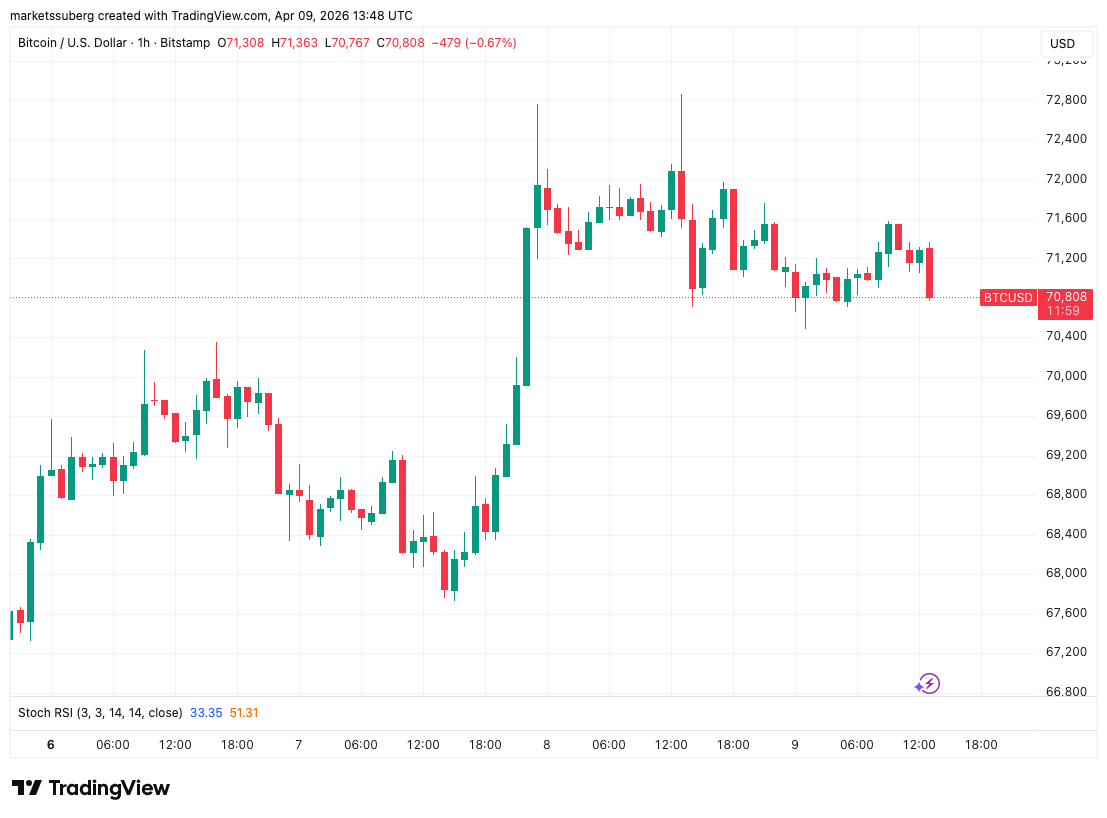
Bitcoin (BTC) circled $71,000 at Thursday’s Wall Street open after US inflation data conformed to expectations.
Key points:
-
Bitcoin waits for new catalysts as US PCE inflation data conforms to market expectations.
-
Friday’s CPI release will be the first to show any impact of the US-Iran war.
-
$80,000 remains in play as a BTC price target, a trader says.
PCE data avoids surprises for risk assets
Data from TradingView showed cooling BTC price volatility after local highs near $73,000 the day prior.

Relief over a US-Iran ceasefire combined with favorable readings from the Federal Reserve’s “preferred” inflation gauge, the Personal Consumption Expenditures (PCE) index.
Core PCE year-on-year came in at 3% for February. On a monthly basis, core PCE was at 0.4%, per data from the US Bureau of Economic Analysis (BEA).

Reacting, trading resource The Kobeissi Letter noted that the impact of the US-Iran war and oil-supply squeeze were not yet reflected in PCE.
“This marks the final pre-Iran War PCE inflation datapoint,” it wrote on X.
Markets remained cautious about future Fed policy, with data from CME Group’s FedWatch Tool continuing to show no expectations of interest-rate cuts in 2026.

While Bitcoin offered no obvious reaction to the latest data, meanwhile, economist Mohamed El-Erian argued that Friday’s March Consumer Price Index (CPI) release was more important.
“While PCE inflation is widely regarded as the Fed’s favorite measure, the bigger inflation focus this week will be on tomorrow’s CPI data, as PCE covers February and not March,” he told X followers.
As Cointelegraph reported, CPI is particularly susceptible to fallout from oil-price swings.
Trader: $80,000 BTC price push “on the horizon”
BTC price action thus left traders guessing as to when and where the next move would be.
Related: Bitcoin RSI ‘nearly perfectly’ copying end of 2022 bear market: Analysis
In their latest market commentary, pseudonymous trader LP leveraged liquidation clusters to give potential targets.
“On the HTF, some upside low-leverage liquidation clusters have been cleared, but sizeable liquidity still remains around 73K and above the highs near 76K. Meanwhile, liquidity is starting to build on the downside, mainly around 69K and 64K,” an X post stated.
“With price still range-bound, both sides remain in play. If the 69–68K level holds, price is likely to push higher and target the remaining upside liquidity around 73K.”

Crypto trader Michaël Van de Poppe was more optimistic, keeping the $80,000 mark in play.
“As long as Bitcoin continues to hold these ranges, there’s a strong new upwards leg on the horizon towards $80K,” he summarized on the day.

This article is produced in accordance with Cointelegraph’s Editorial Policy and is intended for informational purposes only. It does not constitute investment advice or recommendations. All investments and trades carry risk; readers are encouraged to conduct independent research before making any decisions. Cointelegraph makes no guarantees regarding the accuracy or completeness of the information presented, including forward-looking statements, and will not be liable for any loss or damage arising from reliance on this content.
Crypto World
Bitmine Immersion (BMNR) uplists to NYSE and boosts share buyback program to $4 billion


Bitmine Immersion Technologies (BMNR) began trading on the New York Stock Exchange on Thursday, moving from the NYSE American as it scales its crypto-focused treasury strategy.
The company paired the uplisting with an increase in its share repurchase program, raising the authorization to $4 billion from $1 billion. The buyback ranks among the largest announced this year, according to the company. BMNR’s stock has plunged roughly 90% since peaking last summer amid the height of the digital asset treasury mania. Shares are lower by 2.8% in early Thursday trading.
Bitmine now holds about 4.8 million ETH, equal to 3.98% of total supply, and continues to target 5%, or what it calls the “Alchemy of 5%.”
The macro backdrop could play a role. Fundstrat co-founder Tom Lee, who also chairs Bitmine, has argued that U.S. equities may have found a bottom following a ceasefire tied to tensions in Iran. Stocks, oil and volatility shifted sharply in response, a pattern that has also lifted crypto markets.
Bitcoin recently moved above $72,000 alongside gains in equity futures, reflecting a broader “risk-on” trade. Ether may benefit as well, with recent inflows into spot exchange-traded funds and increased staking activity reducing selling pressure, according to Lee.
For Bitmine, the link is direct. Each 1% rise in ether’s price adds roughly $100 million to the value of its holdings. A sustained rebound in crypto could support its balance sheet and stock.
Crypto World
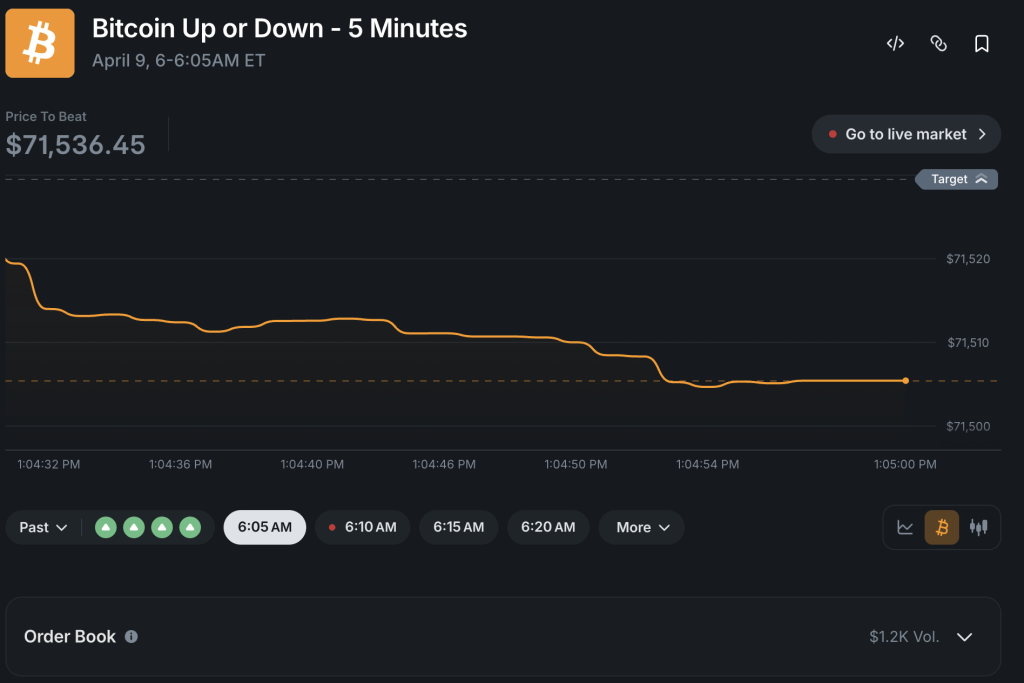
Polymarket Just Hit $4 Billion in Volume on 5-Minute Markets: Is Chainlink the Infrastructure Behind the Next DeFi Explosion?

$153 million in daily volume. $4 billion total. $200 million in the first week alone. Polymarket’s 5-minute prediction markets have gone from experimental product to one of the highest-velocity trading venues in DeFi – and Chainlink oracles are the reason any of it works.
The volume surge, confirmed by on-chain data shared across crypto analytics channels, represents a roughly 400% increase from earlier baseline figures, with the 3x weekly growth rate still accelerating as of the latest reporting window.
Discover: The best pre-launch token sales
Why 5-Minute Prediction Markets Break Standard Oracle Architecture
Standard oracle infrastructure built for hourly or daily market resolution can tolerate latency. A price feed delayed by 30 seconds is noise when a contract settles in 48 hours.
In 5-minute prediction markets, that same 30-second delay is the difference between a valid settlement and a manipulated one, exactly why Polymarket’s architecture required a fundamentally different oracle setup.
Chainlink’s Data Streams integration, deployed on Polygon where Polymarket settles, delivers timestamped price reports at sub-second intervals.
Combined with Chainlink Automation handling the on-chain settlement triggers, the system processes the full cycle, price confirmation, contract resolution, USDC payout, without human intervention and without the manipulation vector that centralized price feeds introduce.
The oracles provide the official price feeds that trigger contract settlements, removing the need for a centralized authority entirely.
The scale of what’s now running through this infrastructure is significant. Over 3,000 traders are actively using Chainlink Data Streams across integrated platforms, and the Dashlink dashboard tracking oracle demand shows a direct correlation between the Polymarket volume surge and a decline in LINK exchange reserves – whales are pulling supply off exchanges as network utilization hits new highs for prediction market settlements.
Native USDC collateral adoption within these markets has further accelerated institutional participation by improving capital efficiency.
The appeal is obvious: a platform already under scrutiny for insider trading patterns on longer-duration markets now offers a format where information asymmetry has a 5-minute shelf life.
The risks are real and shouldn’t be buried. Short timeframes amplify volatility, HFT-dominated order flow can crowd out retail, and oracle delays, however rare, carry outsized consequences when resolution windows are measured in minutes.
But the volume data doesn’t lie: the format is capturing demand that didn’t have an instrument before.
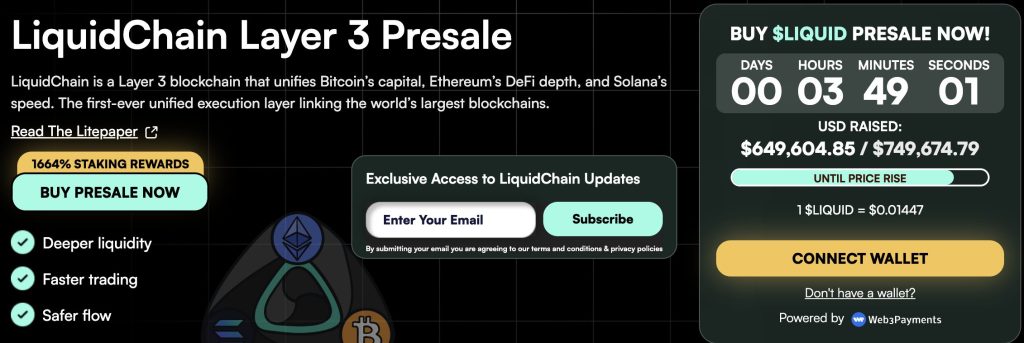
Convergence Hackathon Closes – Liquid Chain Takes the Grand Prize on CCIP
Liquid Chain built a Unified Liquidity Layer that aggregates capital across multiple Layer-2 networks using Chainlink’s Cross-Chain Interoperability Protocol (CCIP) as the messaging backbone.
The core problem it solves is real and expensive – assets stranded on individual L2s require manual bridging, creating slippage, delay, and trust assumptions that institutional allocators won’t accept.
Liquid Chain’s architecture lets users move assets seamlessly across chains without manual bridge interactions, with CCIP handling the verification and message-passing layer beneath the surface.
The project has been pitching its Layer-3 DeFi buildout as a credible answer to the fragmentation problem, and the Convergence judges agreed.
Other notable hackathon submissions concentrated on Real-World Asset tokenization and DeFi automation – a consistent signal that Chainlink’s developer community is orienting toward institutional-grade infrastructure rather than consumer speculation. The CCIP adoption rate implied by the hackathon submissions validates Chainlink’s cross-chain positioning at exactly the moment demand for tamper-proof oracle settlement is breaking records on Polymarket.
Explore the LiquidChain presale and current allocation terms here.
The post Polymarket Just Hit $4 Billion in Volume on 5-Minute Markets: Is Chainlink the Infrastructure Behind the Next DeFi Explosion? appeared first on Cryptonews.

Crypto Card Fees Explained: Hidden Costs To Know

Kevin Smith Pitches ‘Clerks 4’ to a Room Full of Dogs [Exclusive]

5 Smart Money Rules You Must Follow | Tamil Financial Tips to Save & Grow Wealth#moneytips #shorts


-

 NewsBeat7 days ago
Steven Gerrard disagrees with Gary Neville over ‘shock’ Chelsea and Arsenal claim | Football
-

 Business7 days ago
No Jackpot Winner and $194 Million Prize Rolls Over
-

 Fashion6 days ago
Weekend Open Thread: Spanx – Corporette.com
-

 Business5 days ago
Expert Picks for Every Need
-

 Business4 days ago
Three Gulf funds agree to back Paramount’s $81 billion takeover of Warner, WSJ reports
-

 Sports5 days ago
India men’s 4x400m and mixed 4x100m relay teams register big progress | Other Sports News
-

 Tech2 days ago
How Long Can You Drive With Expired Registration? What Florida Law Says
-
Business4 days ago
No Jackpot Winner, Prize to Climb to $231 Million
-

 Fashion3 days ago
Massimo Dutti Offers Inspiration for Your Summer Mood Board
-

 Fashion2 days ago
Let’s Discuss: DEI in 2026
-
Politics6 days ago
Wings Over Scotland | The quality of mercy
-

 Business5 days ago
Akebia Therapeutics, Inc. (AKBA) Discusses Pipeline Progress and Strategic Focus on Kidney Disease Treatments at R&D Day – Slideshow
-

 Fashion7 days ago
Statement Sunglasses: The Accessory Shaping Modern Fashion
-

 Crypto World1 day ago
Bitcoin recovers as US and Iran Agree a Ceasefire Deal
-

 Politics7 days ago
East Jerusalem Palestinian families eviction orders
-

 Fashion7 days ago
Coffee Break: Santa Croce Tote
-

 Fashion7 days ago
For Love & Lemons’ Spring 2026 Line is for the Romantics
-

 Politics6 days ago
Why so many children are now classified as ‘disabled’
-

 Politics7 days ago
Nuclear rockets, moon bases and NASA’s Mars plan
-

 Tech6 days ago
The Threadless Ball Screw Never Took Off, But Don’t Write It Off
You must be logged in to post a comment Login