

Crypto World
Solana price slips back into old range as 78 support comes
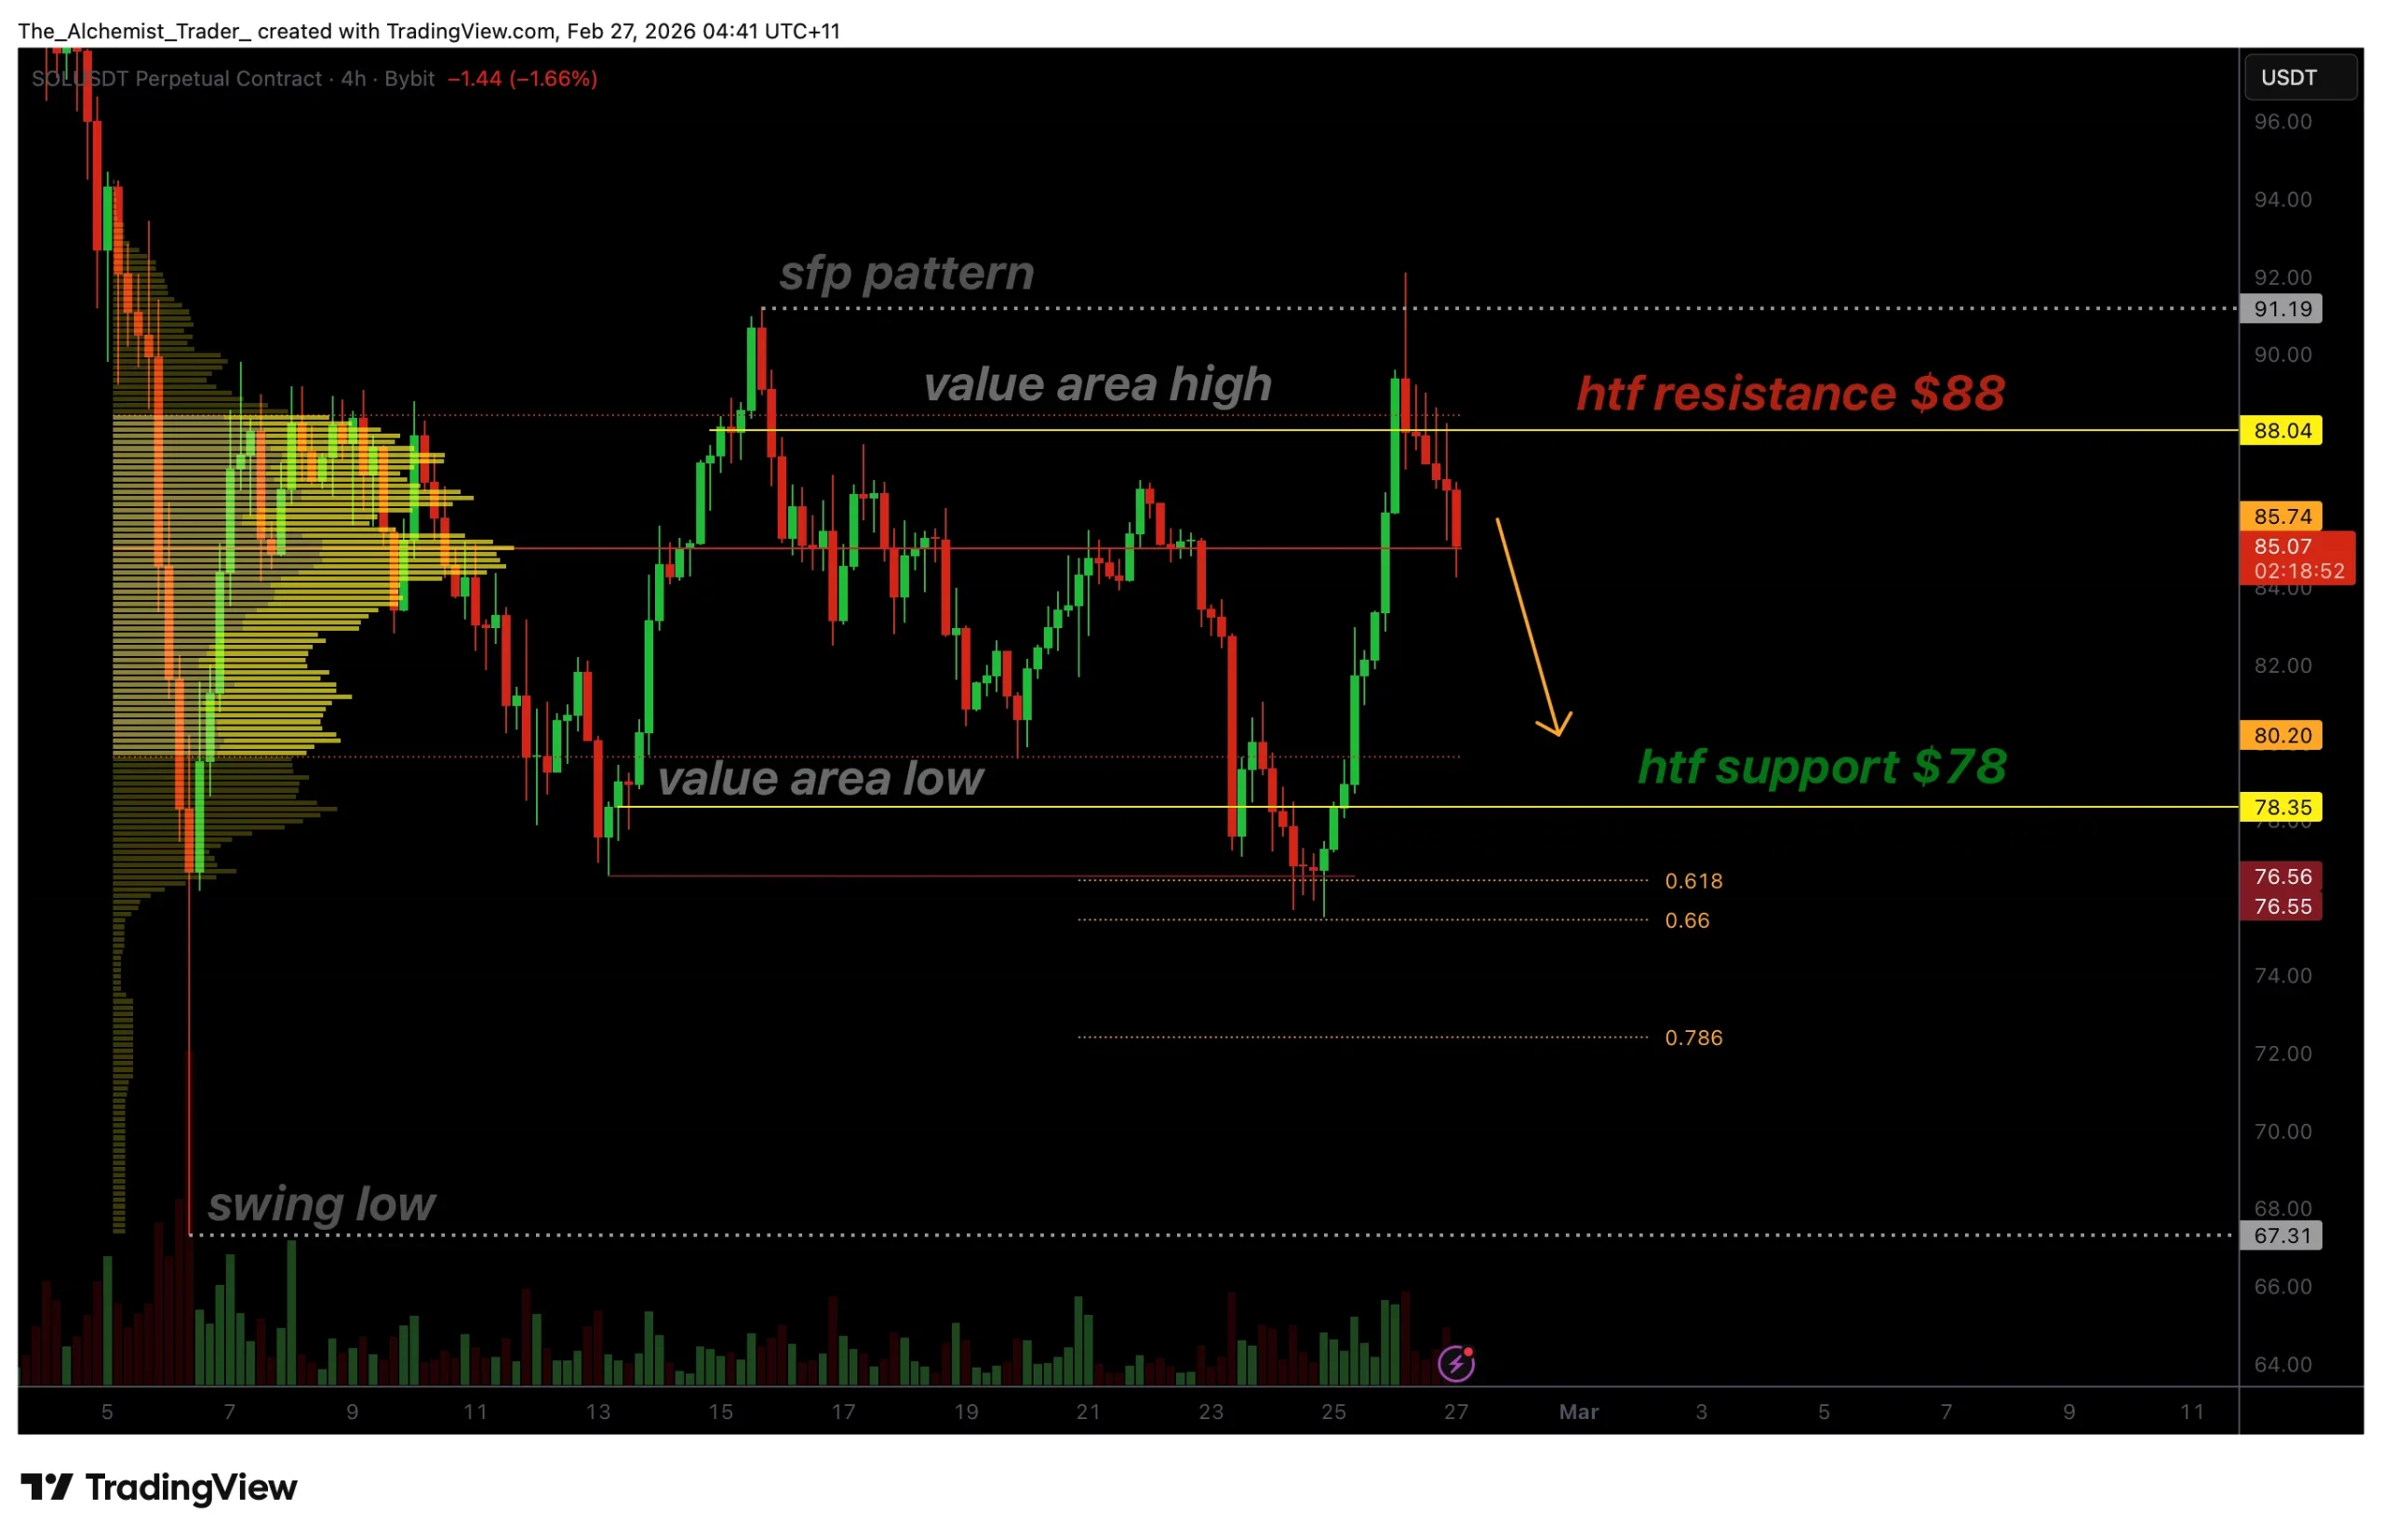
Solana price has turned corrective after losing key support near $88, pushing price back into its previous trading range. The shift in market structure now places $78 support at risk as downside pressure builds.
Summary
- Loss of $88 support flips level into resistance
- Price re-enters established trading range structure
- $78 value area low becomes next key downside support
Solana’s (SOL) recent price action signals a transition away from bullish continuation and back into range-bound conditions. After failing to hold above a major technical level, the market has begun rotating lower, reflecting weakening momentum and growing seller control.
The loss of a key support zone has altered short-term structure, increasing the probability that Solana revisits lower range support before any sustained recovery can develop.
Solana price key technical points
- Lost Support: $88 level flips into resistance alongside the value area high.
- Structural Shift: Price has re-entered its previous trading range.
- Downside Target: $78 aligns with the value area low and high timeframe support.
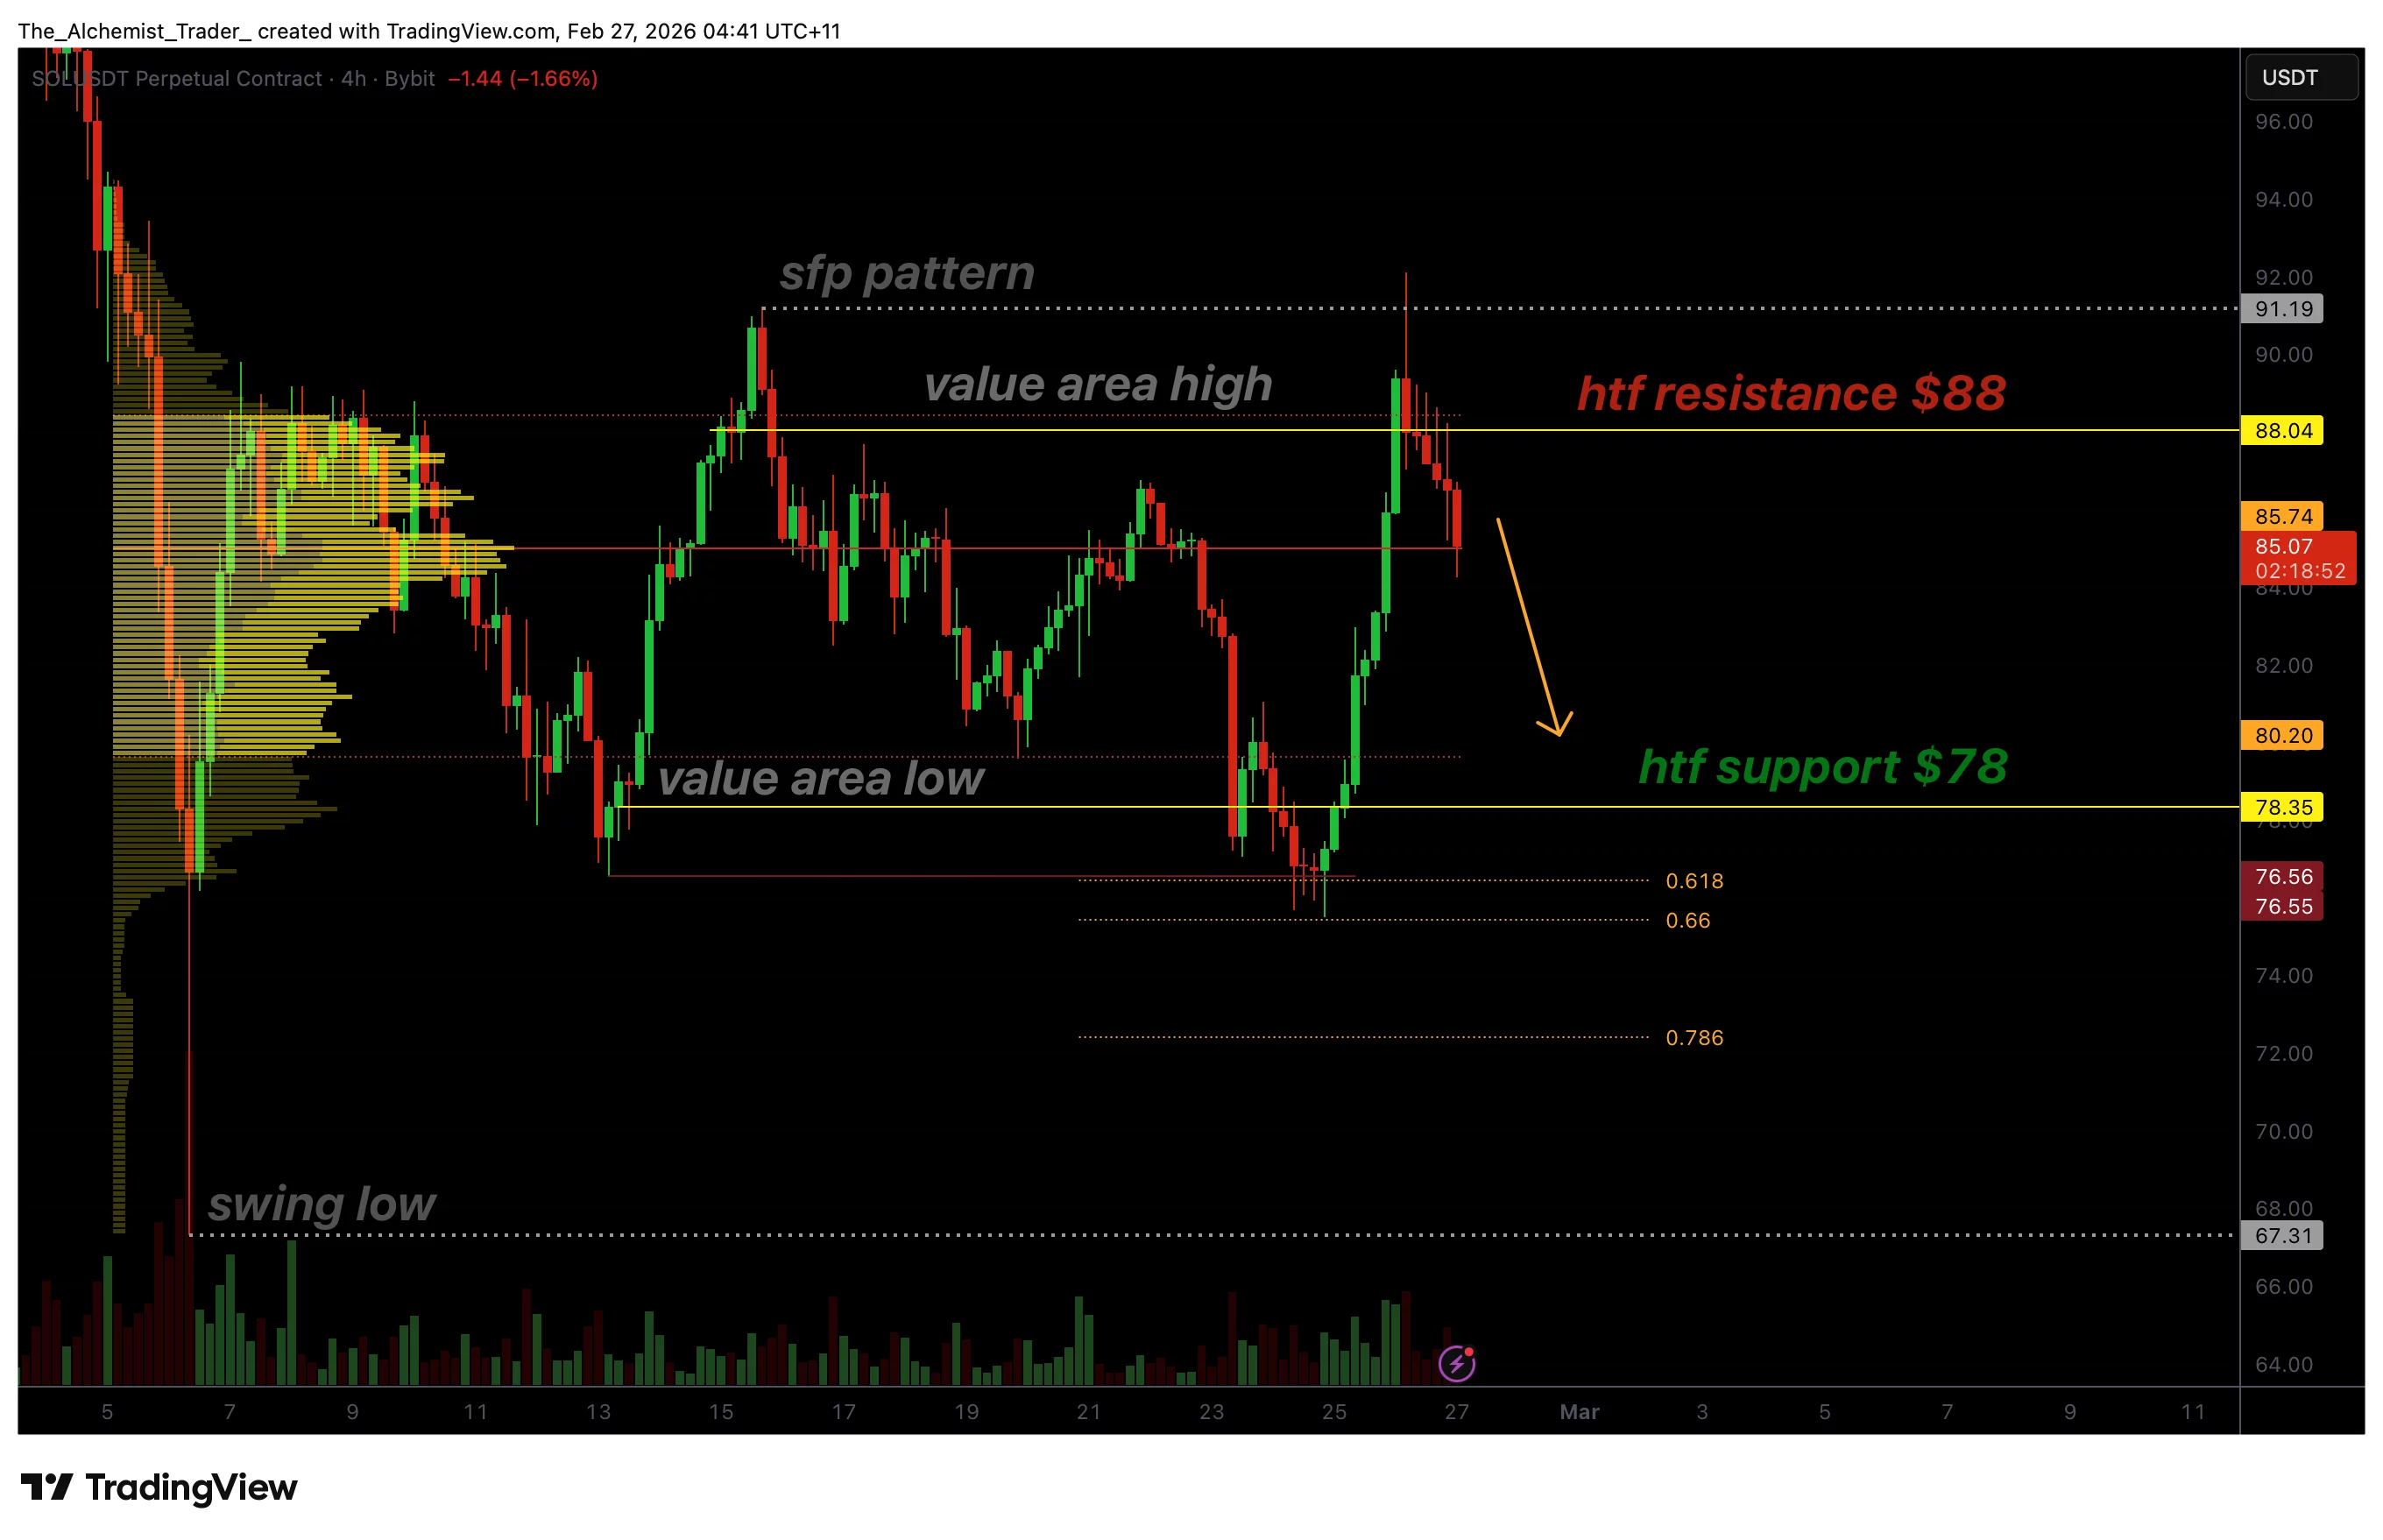
Solana recently lost the important $88 level, which previously acted as a structural support zone. This area also aligned with the value area high, making it a strong technical confluence region. When price loses a value area boundary, it often signals rejection rather than continuation, forcing markets back toward equilibrium within the established range. The failure to hold above this level confirms that buyers were unable to maintain control following the prior recovery attempt.
With the loss of $88 support, Solana has effectively reverted into its previous trading range. Range environments typically trap price action between clearly defined highs and lows, creating rotational market behavior rather than trending movement. In this case, the range low and major support zone sits near $78, which coincides with the value area low and high timeframe demand.
This comes as Step Finance announced it will shut down its Solana-based platforms following a January exploit that drained roughly $40 million, adding to cautious sentiment surrounding the ecosystem.
Currently, price action is hovering near the Point of Control (POC), the level representing the highest volume traded within the range. The POC often functions as equilibrium between buyers and sellers. Solana barely holding this level suggests market indecision, but it also signals vulnerability. A confirmed close below the POC would indicate acceptance at lower prices, significantly increasing the probability of a move toward range support.
From a market structure perspective, the current movement appears corrective rather than impulsive. Corrective phases typically unfold through gradual rotations toward liquidity pools where demand previously emerged. The absence of strong bullish continuation after losing support further reinforces the corrective bias. Without reclaiming $88 resistance, upside momentum remains limited.
Volume dynamics also support the corrective outlook. The recent decline has not been met with strong accumulation signals, suggesting buyers are waiting at deeper value zones rather than defending mid-range prices. This behavior is common within established ranges, where participants prefer to engage at extremes rather than within the middle of consolidation.
If Solana continues to trade below former support turned resistance, price action is likely to gravitate toward the lower boundary of the range. The $78 level therefore becomes a critical area to monitor. A reaction at this support could trigger a relief bounce or range continuation, while a breakdown below it would expose Solana to a broader structural reset. This comes as Zora expanded onto the Solana blockchain with the launch of its new “attention markets” platform, signaling continued ecosystem development despite the current corrective structure.
Despite the short-term weakness, range environments are not inherently bearish. Instead, they represent periods of market balance where liquidity accumulates before the next major expansion. For now, Solana remains confined within this structure, with directional clarity dependent on either reclaiming resistance or testing deeper support.
What to expect in the coming price action
Solana is likely to continue rotating within its established trading range unless bulls reclaim the $88 resistance level. Failure to hold the POC increases the probability of a move toward $78 support, where the next meaningful reaction is expected to occur.


In a 48-hour period at the end of January, the two largest decentralized social protocols underwent major leadership changes. Farcaster shifted stewardship of its protocol, flagship client, and leading Base launchpad, Clanker, to its primary infrastructure provider, Neynar. Concurrently, Lens Protocol announced its transition from Avara (the team behind Aave) to Mask Network.
The suddenness of these transitions was enough to rekindle a familiar debate: Do these restructurings by the sector’s most established projects signal a failure for crypto social? For many critics, the answer was an immediate yes. They argued that crypto social never moved beyond the crypto bubble, failed to compete meaningfully with Web2 giants, and ultimately imploded under its own momentum. For them, the ownership changes confirmed that decentralized social media is a dead end—at best, a niche experiment. However, this view misinterprets a necessary market correction as a complete collapse.
Why the first save struggled
What these transitions actually reveal is a long-overdue acknowledgement of reality: building social networks is not primarily a question of ideology or infrastructure, but of product quality, distribution and incentives. The first wave of crypto social struggled not because decentralization is inherently flawed, but because it attempted to recreate legacy social platforms while layering crypto’s complexity on top of them. Farcaster and Lens were ambitious efforts to reimagine social media around user-owned identity, open graphs and composable data. Both attracted top-tier capital and world-class engineers. And yet neither managed to break meaningfully beyond a crypto-native audience.
A key misstep was assuming social graphs would scale like blockchains, that you could build a shared, open layer first, and value would naturally accrue. In practice, social graphs do not compound simply by existing. And this is not uniquely a crypto lesson. Decentralized social graphs have existed for years, with Mastodon and Nostr as the obvious examples, yet neither has achieved sustained mainstream adoption. The pattern is consistent: users do not migrate for ideological reasons, and portability does not overcome the cold start. Without a flagship experience that feels materially better today, with better content, better loops, better status and better tools, decentralization remains an implementation detail that appeals to a committed minority, not a mass-market hook.
In addition, both ecosystems leaned too early into platform-building and developer ecosystems, overestimating their ability to solve the cold-start problem for builders. With user counts in the low tens of thousands, the economic pie was simply too small for third-party applications to thrive. Builders were asked to take on distribution risk before meaningful distribution existed, while competing, implicitly or explicitly, with flagship clients that controlled the primary surface area.
Social networks live and die by network effects, and crypto introduces additional friction at every layer: wallets, security assumptions, moderation trade-offs and identity management. Convincing users to abandon platforms where their social graphs already exist is difficult under any circumstances. Asking them to do so while navigating unfamiliar tooling raises the bar even higher.
From Social Media to Social Financial Networks
Rather than chasing a decentralized Twitter analogue, the narrative is shifting toward what might be better described as social financial networks. In these systems, the primary function is not broadcasting opinions or accumulating followers, but coordinating information, capital and collective belief. Success is measured less by engagement metrics and more by the quality of signal and the flow of value.
Seen through this lens, crypto may already have found its most compelling native social platform, just not in the form many expected. Prediction markets such as Polymarket function as social coordination engines. They aggregate opinion, surface collective intelligence and transform discourse into probabilistic outcomes. Crucially, this model is not a copy of Web2 social media. It does not rely on advertising, algorithmic outrage or attention extraction. And it has demonstrated relevance beyond a purely crypto-native audience.
But social financial networks are only the first wave of what crypto can unlock. Blockchains make certain end-user experiences possible in a way Web2 rails simply do not, and speculation is just the most legible early expression of that. Polymarket turns conversation into accountable belief. Products like FOMO show how trading itself can become social, with transparency, shared context, and real-time feedback loops baked into the graph.
The bigger opportunity goes well beyond a social + markets equation. It is social systems where ownership, identity and monetization are native rather than bolted on. Digital ownership can turn content and status into durable assets. Programmable incentives can align creators, curators, and communities around long-term behavior rather than short-term extraction. Onchain coordination can unlock new group behaviors, from collective funding to shared membership, shared governance and shared upside. The point is not that crypto makes social cheaper or more open, but rather it expands the design space for what social networks can be.
A reset, not an obituary
Declaring crypto social “dead” misses the point. What has ended is a particular vision of Web3 social, one that assumed legacy social media could be recreated on crypto rails with better incentives and better values.
What remains is a harder, more grounded challenge: identifying where crypto enables forms of social coordination that were previously impossible. Capital formation, information markets, community-owned infrastructure and new mechanisms for aligning incentives all remain open design spaces. Crypto social is not disappearing. It is shedding its earliest assumptions.
One reason the “dead” narrative feels premature is that we may have been looking for the next crypto social breakout in the wrong place. Moltbook is a deliberately weird experiment: a social network designed primarily for AI agents, with humans as observers. In a matter of days, tens of thousands of agents reportedly spun up emergent behaviors that look uncannily social, creating religions, organizing governance, publishing manifestos and even experimenting with privacy and encryption.
The surprising part is that watching it has been engaging for humans, precisely because it feels like observing a new social class forming in real time, negotiating norms, status and even revenue strategies, sometimes explicitly trying to evade human legibility. It is too early to know whether this is a durable phenomenon or a passing narrative, but it is a bold reminder that new forms of social can emerge when the participants, incentives and constraints change. If AI agents increasingly need to transact and coordinate across the digital world, blockchains are a natural substrate for them to do so.
For now, it turns out, the crypto social obituary was written for the wrong thing.
Long live crypto social!
Legal Disclaimer: This article is for general information purposes only and should not be construed as or relied upon in any manner as investment, financial, legal, regulatory, tax, accounting, or similar advice. Under no circumstances should any material at the site be used or be construed as an offer soliciting the purchase or sale of any security, future, or other financial product or instrument. Views expressed in the article are those of the individual 1kx personnel quoted therein and are not the views of 1kx and are subject to change. The article is not directed to any investors or potential investors, and does not constitute an offer to sell or a solicitation of an offer to buy any securities, and may not be used or relied upon in evaluating the merits of any investment. All information contained herein should be independently verified and confirmed. 1kx does not accept any liability for any loss or damage whatsoever caused in reliance upon such information. Certain information has been obtained from third-party sources. While taken from sources believed to be reliable, 1kx has not independently verified such information and makes no representations about the enduring accuracy or completeness of any information provided or its appropriateness for a given situation. 1kx may hold positions in certain projects or assets discussed in this article.
The views and opinions expressed in this article are solely the authors’ own and do not reflect the views of their employer, 21Shares, or any affiliated organizations.
Ether (ETH) price is up 18% since plunging below the $1,800 mark on Feb. 6, reclaiming the $2,000 support level. Surging price volatility and a low MVRV Z-score value are also signaling a local bottom forming.
Key takeaways:
-
Ether realized volatility on Binance has risen to its highest level since March 2025, hinting at a potential recovery.
-
Ether’s MVRV Z-Score has dropped into the accumulation zone, suggesting that ETH has bottomed.
-
Ether’s multiyear trend line around $1,800-$1,900 holds as support.
Ether’s volatility hits 12-month highs
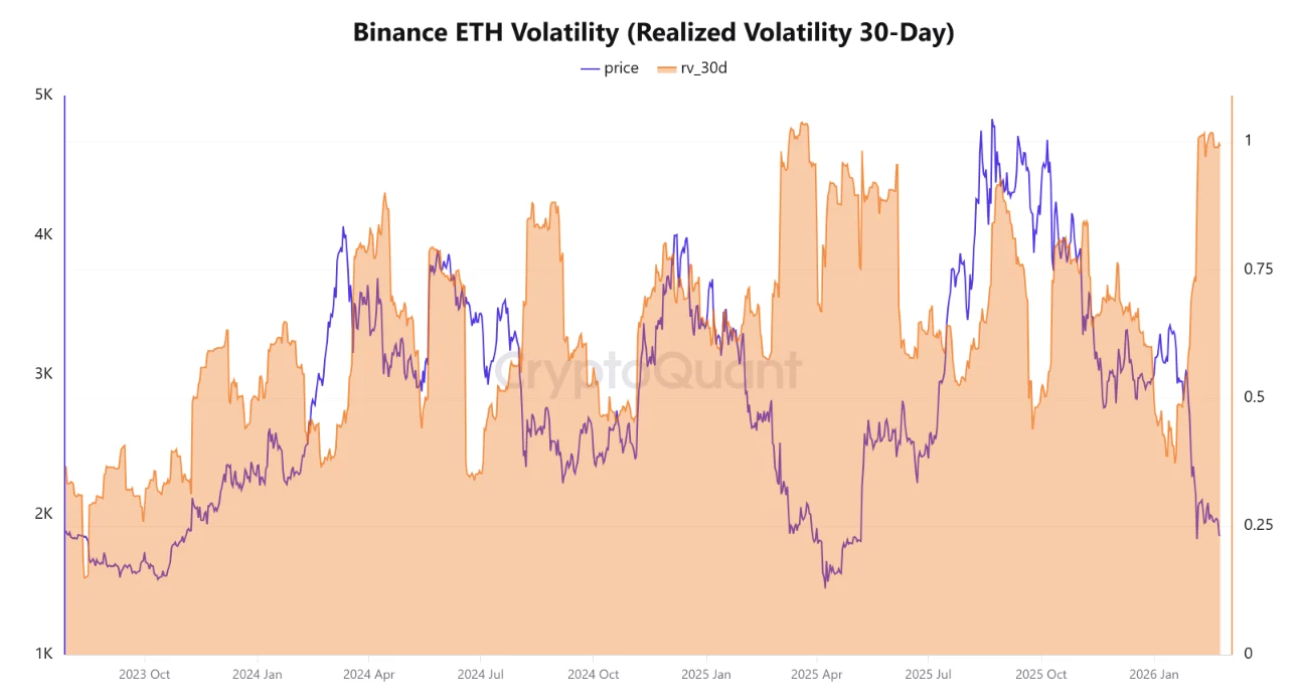
Ether’s volatility has seen a sudden spike, suggesting that the market is entering a period of intense activity and strong repricing, according to data from CryptoQuant.
Volatility is a metric used to determine how much and how quickly Ether’s price fluctuates over a given period.
Related: ETH options turn bearish as traders prepare for extended Ether price downside
The chart below shows that the realized volatility (30-day) indicator on Binance rose sharply to 0.97 on Thursday from 0.37 in mid-January.
A spike in realized volatility to such high levels indicates that the “market has emerged from a period of relative calm and entered a highly volatile environment,” CryptoQuant analyst Arab Chain said in a Quicktake analysis, adding:
“Past experience has shown that such readings have often preceded a significant upward move in Ethereum’s price.”

The last time the volatility was this high was late March to early April 2025 as ETH price formed a bottom range of $1,500 to $1,700.
After that, the ETH/USD pair rallied 77% to $2,700 in less than 30 days. A similar spike in Q4/2024 preceded a 74% rally in Ether’s price.
If history repeats itself, this spike in volatility could mark the end of the downtrend, setting up ETH for a multimonth rally once volatility normalizes and conviction builds.
MVRV Z-Score suggests Ether bottomed below $1,800
Ether’s MVRV Z-Score, one of the most popular onchain metrics used to identify market tops and bottoms, has dropped into the historical accumulation zone (the green line in the chart below), strengthening the argument that ETH may have found its bottom.

The last time Ether’s MVRV Z-Score dipped to the current level around -0.31 was in April 2025, after a 66% price drawdown. This coincided with a price bottom at $1,400 and preceded a multi-month rally, with ETH price rising 258% to its $4,950 all-time high.
This indicates that, from an onchain perspective, Ether is oversold and may continue the ongoing recovery, potentially rising toward liquidity clusters between $2,200 and $2,500 in the short term.
Ether’s 2020 fractal projects an “explosive climb” for ETH price
Ether’s current technical structure closely mirrors the setup that sparked its 2020-2021 price rally.
The monthly chart below suggests that the price is currently holding a multi-year trend line, much like the one that supported the price from December 2018 to April 2020.
“Every time price holds above this ascending support trend line, it launches into a parabolic rally,” as seen in 2020, analyst Trader Tardigrade said in an X post on Thursday, adding:
”Now $ETH is testing the trendline again. If it holds here, history says we’re gearing up for another explosive climb.”

This trend line lies within the $1,900 to $1,800 support zone, where investors recently acquired 2.9 million ETH, Glassnode’s cost basis distribution heatmap shows.
As Cointelegraph reported, ETH could continue its recovery to retest the 50-day simple moving average (SMA) at $2,540 if bulls manage to push the price above $2,100.
This article does not contain investment advice or recommendations. Every investment and trading move involves risk, and readers should conduct their own research when making a decision. While we strive to provide accurate and timely information, Cointelegraph does not guarantee the accuracy, completeness, or reliability of any information in this article. This article may contain forward-looking statements that are subject to risks and uncertainties. Cointelegraph will not be liable for any loss or damage arising from your reliance on this information.
The stablecoin company had a strong 2025 and is exploring a token launch for Arc, its new Layer 1 blockchain.
Circle’s stock, CRCL, is up 40% over the last two trading days after the company unveiled its Q4 2025 report, showcasing a 64% increase in revenue and 104% growth in earnings year over year (YoY).
The report sent CRCL rallying from $61 per share to $86.25, as the company also shared an 82% increase in total USDC minted and a 59% increase in what it calls “meaningful wallets,” defined as any onchain wallet holding more than 10 USDC.

The stock appears to be pricing in future growth, as the company still posted a net loss of $70 million in 2025, “significantly impacted by $424 million for stock-based compensation.”
The company also touched on its upcoming Layer 1 stablechain, Arc, which launched its testnet in October.
In addition to Arc’s impending mainnet launch, Circle CEO Jeremy Allaire also revealed that Circle is exploring a native token for the Arc blockchain, but did not reveal any further details.
While the earnings report and subsequent rebound offer some relief for shareholders, CRCL is still down 71% from its all-time high of $300, reached shortly after its initial public offering (IPO).
Since dropping by 35% from Jan. 14 to Feb. 5, Bitcoin (BTC) has consolidated in a range from $60,000 to $70,000 over the past 22 days. At the same time, several BTC adoption-linked metrics are moving in different directions across exchange-traded funds (ETFs), whales, miners and corporate Bitcoin treasuries.
These divergences highlight steady capital commitment beneath muted price action and how each signal fits into the bigger picture.
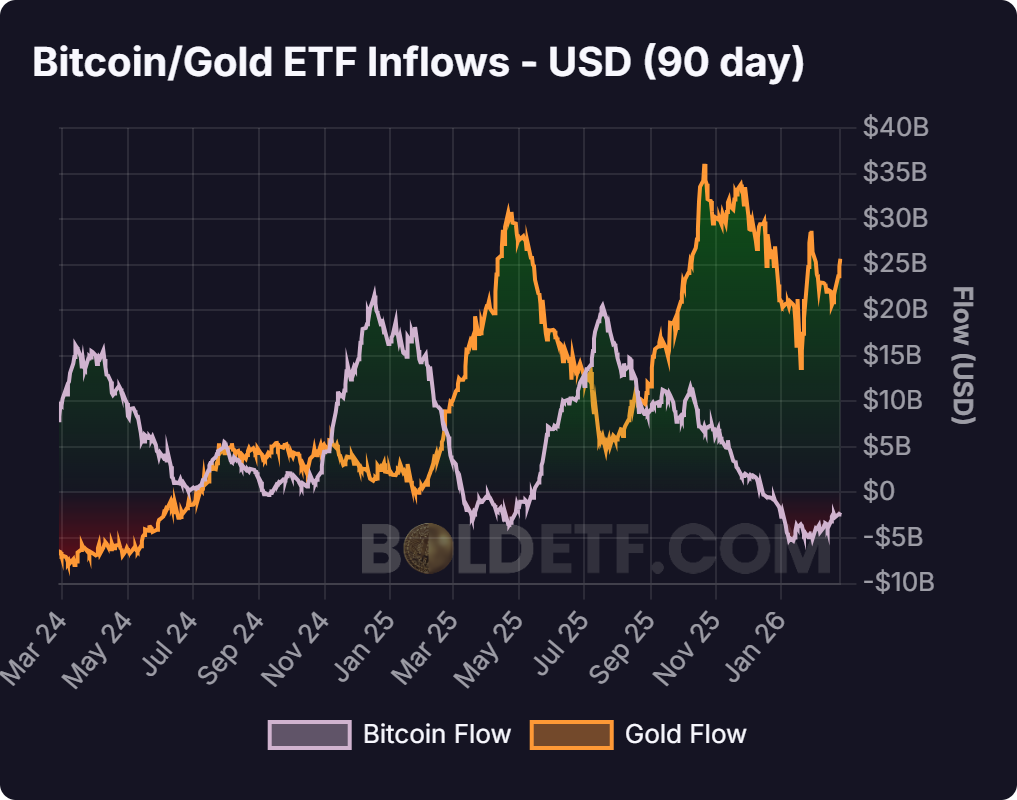
Bitcoin ETF flows remain negative
The 90-day rolling average of US spot Bitcoin ETF net flows has dropped to -$2.18 billion. Over the past two years, the metric has turned negative only twice: from March to May 2025, and in the current stretch that began on December 11, 2025. In both instances, Bitcoin followed with a corrective phase.

When the rolling average turns negative, it means more money is leaving ETFs than coming in over a longer period. That reduces buying pressure, weakens overall demand, and can make it harder for prices to move higher.
A move back above zero, followed by steady inflows, may mark the return of institutional participation. Sustained positive readings tend to align with stronger price action from BTC, alongside improving liquidity conditions.
BTC whale accumulation versus dominant trend
CryptoQuant data tracks the one-year change in total whale holdings and its 365-day moving average. Addresses holding 1,000 to 10,000 BTC added more than 200,000 BTC from June to November 2023, while the price ranged from $25,000 to $30,000.
When the raw one-year change crosses above its 365-day average, whales are accumulating faster than their longer-term trend. That crossover in 2023 coincided with supply absorption during sideways trade, which eventually led to BTC’s bullish rally.

Thus, a bullish trend may unfold for BTC once the one-year change sustainably moves above its moving average (365-SMA), signaling renewed large-scale absorption.
Hash rate and infrastructure signal
Bitcoin’s 30-day mean hash rate stands near 0.99 ZH/s after peaking at 1.10 ZH/s in November 2025. Both hash rate and price have moved lower in recent weeks.
Hash rate measures the computational power securing the network and reflects miner investment in hardware and energy capacity. Rising hash rate during price consolidation points to infrastructure expansion independent of short-term price gains.

If the hash rate trends higher while the price trades sideways, it points to a stronger long-term commitment from miners. A sustained divergence, where hash rate rises ahead of price, can signal growing confidence within the mining sector.
Likewise, miner economics must also improve. Stabilizing the hash price and lower miner sell pressure confirms that rising computational power is backed by healthier revenue conditions rather than tightening margins.
Related: Analysts reject Jane Street ‘10 a.m. dump’ claims, say Bitcoin isn’t easily manipulated
Corporate BTC treasury concentration cools
A recent report from bitcointreasuries.net noted that treasuries added about 43,200 BTC in January, with Strategy accounting for about 40,150 BTC.
Zooming out, the chart shows that corporate accumulation by Strategy has slowed significantly since late 2024. Monthly additions peaked near 148,000 BTC in November 2024 and 87,000 BTC in July 2025.
Recent monthly figures are materially lower, and the last 30-day increase represents only a marginal change relative to the 1.13 million BTC now held by public companies.

The latest monthly net increase equates to roughly 0.1% growth relative to total public company holdings. That pace signals stability rather than acceleration in treasury expansion.
For BTC price, broader and accelerating treasury inflows help absorb available supply more effectively. Slower increases, by contrast, signal companies are largely maintaining positions rather than driving new demand.
Related: Bitcoin bear market not ‘over already’ as price rejects at $68K trend line
This article does not contain investment advice or recommendations. Every investment and trading move involves risk, and readers should conduct their own research when making a decision. While we strive to provide accurate and timely information, Cointelegraph does not guarantee the accuracy, completeness, or reliability of any information in this article. This article may contain forward-looking statements that are subject to risks and uncertainties. Cointelegraph will not be liable for any loss or damage arising from your reliance on this information.

TLDR
- Circle shares surged nearly 50% within two sessions after the company reported fourth quarter earnings.
- Analysts said a short squeeze drove the rally rather than a change in the company’s fundamentals.
- Hedge funds had built large bearish positions before the earnings release, which led to rapid short covering.
- USDC circulation rose 72% year over year to $75.3 billion during the quarter.
- Circle reported a net loss of $70 million for 2024 compared with a net profit in the prior year.
Circle shares surged nearly 50% within two sessions after the company released fourth quarter earnings on Wednesday. The rally followed an 80% decline from record highs reached last year and reversed recent losses. Analysts said short covering, rather than improved fundamentals, powered most of the advance.
Circle Earnings Trigger Short Squeeze
Circle reported strong growth in USDC circulation during the fourth quarter. The company said USDC supply reached $75.3 billion, up 72% year over year. However, analysts linked the sharp share price jump to hedge fund positioning.
Markus Thielen, founder of 10x Research, said positioning drove the move. He stated, “The magnitude of the move was not driven purely by the headline numbers.” He added, “The real catalyst was positioning,” and described the rally as a “high-probability short squeeze rather than a fundamental re-rating.” He estimated hedge funds lost about $500 million in one day on short positions.
Hedge funds had built large bearish bets before the earnings release. As the stock climbed, short sellers rushed to cover positions. Consequently, buying pressure accelerated and pushed shares sharply higher.
The surge broke a prolonged downtrend that had erased most of last year’s gains. Shares had fallen about 80% from prior record levels before the earnings report. The rapid rebound followed heavy trading volumes across sessions.
USDC Growth Contrasts with Profitability Decline
Circle’s flagship stablecoin, USDC, expanded in circulation during the quarter. The company reported $75.3 billion in USDC supply, which outpaced Tether’s USDT growth rate. Harvey Li, founder of Tokenization Insight, highlighted the supply increase in a research note.
Revenue from reserve income rose 58% to $2.64 billion. Circle earns reserve income mainly from U.S. government debt backing USDC. However, distribution costs climbed 66% to $1.66 billion during the same period.
Despite higher circulation, Circle posted a net loss of $70 million for 2024. The company had reported a $156 million net profit in 2023. Li said, “Stablecoin may be scaling; stablecoin issuance is a tough business.”
Japanese investment bank Mizuho raised its price target on Circle to $90 from $77. The bank cited stronger fourth-quarter results and growth linked to prediction markets. However, it kept a neutral rating and warned that lower rates could pressure reserve income.
Analysts Dan Dolev and Alexander Jenkins said revenue and profit exceeded expectations. Management pointed to prediction and betting platforms, including Polymarket, as drivers of USDC growth. Executives also described USDC as a potential default currency for AI agents in digital marketplaces.
Mizuho projected an average USDC circulation of about 123 million in 2027. The bank modeled reserve income near $3.7 billion and EBITDA of $916 million for that year. It applied a 24x EBITDA multiple and set a $90 price target.

Bloomberg is collaborating with Kaiko, a Paris-based digital asset market data provider, to make Bloomberg’s licensed financial data accessible directly within blockchain environments rather than through traditional offchain databases.
The companies said Thursday that the initiative is designed to address the challenge of inconsistent data across tokenized markets.
In many tokenized asset ecosystems, companies may rely on different versions of pricing data, security identifiers or reference information, increasing the risk of discrepancies and operational inefficiencies.
By enabling a common, licensed data source to be embedded onchain, the collaboration aims to ensure that market participants reference the same dataset, potentially reducing reconciliation disputes and improving data integrity.
The first use case focuses on tokenized US Treasurys and repo markets operating on the Canton Network, a permissioned blockchain network designed for institutional financial applications. Kaiko launched that data on-ramp service in August.
The integration targets banks, asset managers and other regulated financial institutions experimenting with blockchain-based versions of traditional financial instruments, rather than retail crypto traders.
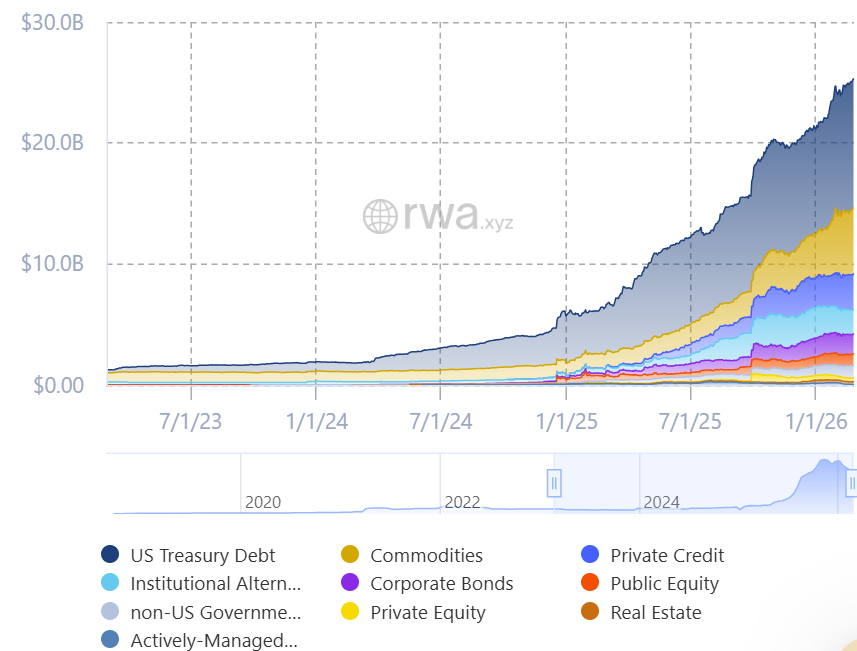
Questions around data reliability and market size in tokenized real-world assets (RWAs) have surfaced before.
In May, Cointelegraph interviewed Chris Yin, co-founder of RWA platform Plume, who said that the tokenized asset market may be significantly smaller than figures cited by some industry aggregators. At the time, Yin said the sector’s actual size was likely closer to half of what major data sources were reporting.

Related: Hong Kong to link new digital bond platform with regional tokenization hubs
Why data integrity matters for tokenized markets
Kaiko CEO Ambre Soubiran said institutional-grade data is essential for well-functioning financial markets, stating that the collaboration with Bloomberg “will extend the availability of market data used in traditional markets to now support the next generation of tokenized securities infrastructure.”
Kaiko expanded its footprint in the digital asset data sector with its 2024 acquisition of European crypto index provider Vinter, strengthening its presence in regulated benchmark and index services across Europe.
Reliable data has long been a priority in the digital asset industry, where market participants have relied not only on price feeds but also on onchain analytics and sentiment indicators to improve transparency.
In tokenized markets, particularly those linked to real-world assets like Treasurys, consistent pricing data and reference information help ensure that onchain assets accurately mirror the underlying financial instruments.
Related: Aster’s quiet relisting on DefiLlama leaves ‘big gaps’ in data: Exec
Crypto World
The network is moving away from being a slow giant to become a high-speed ‘internet of value’ by 2029
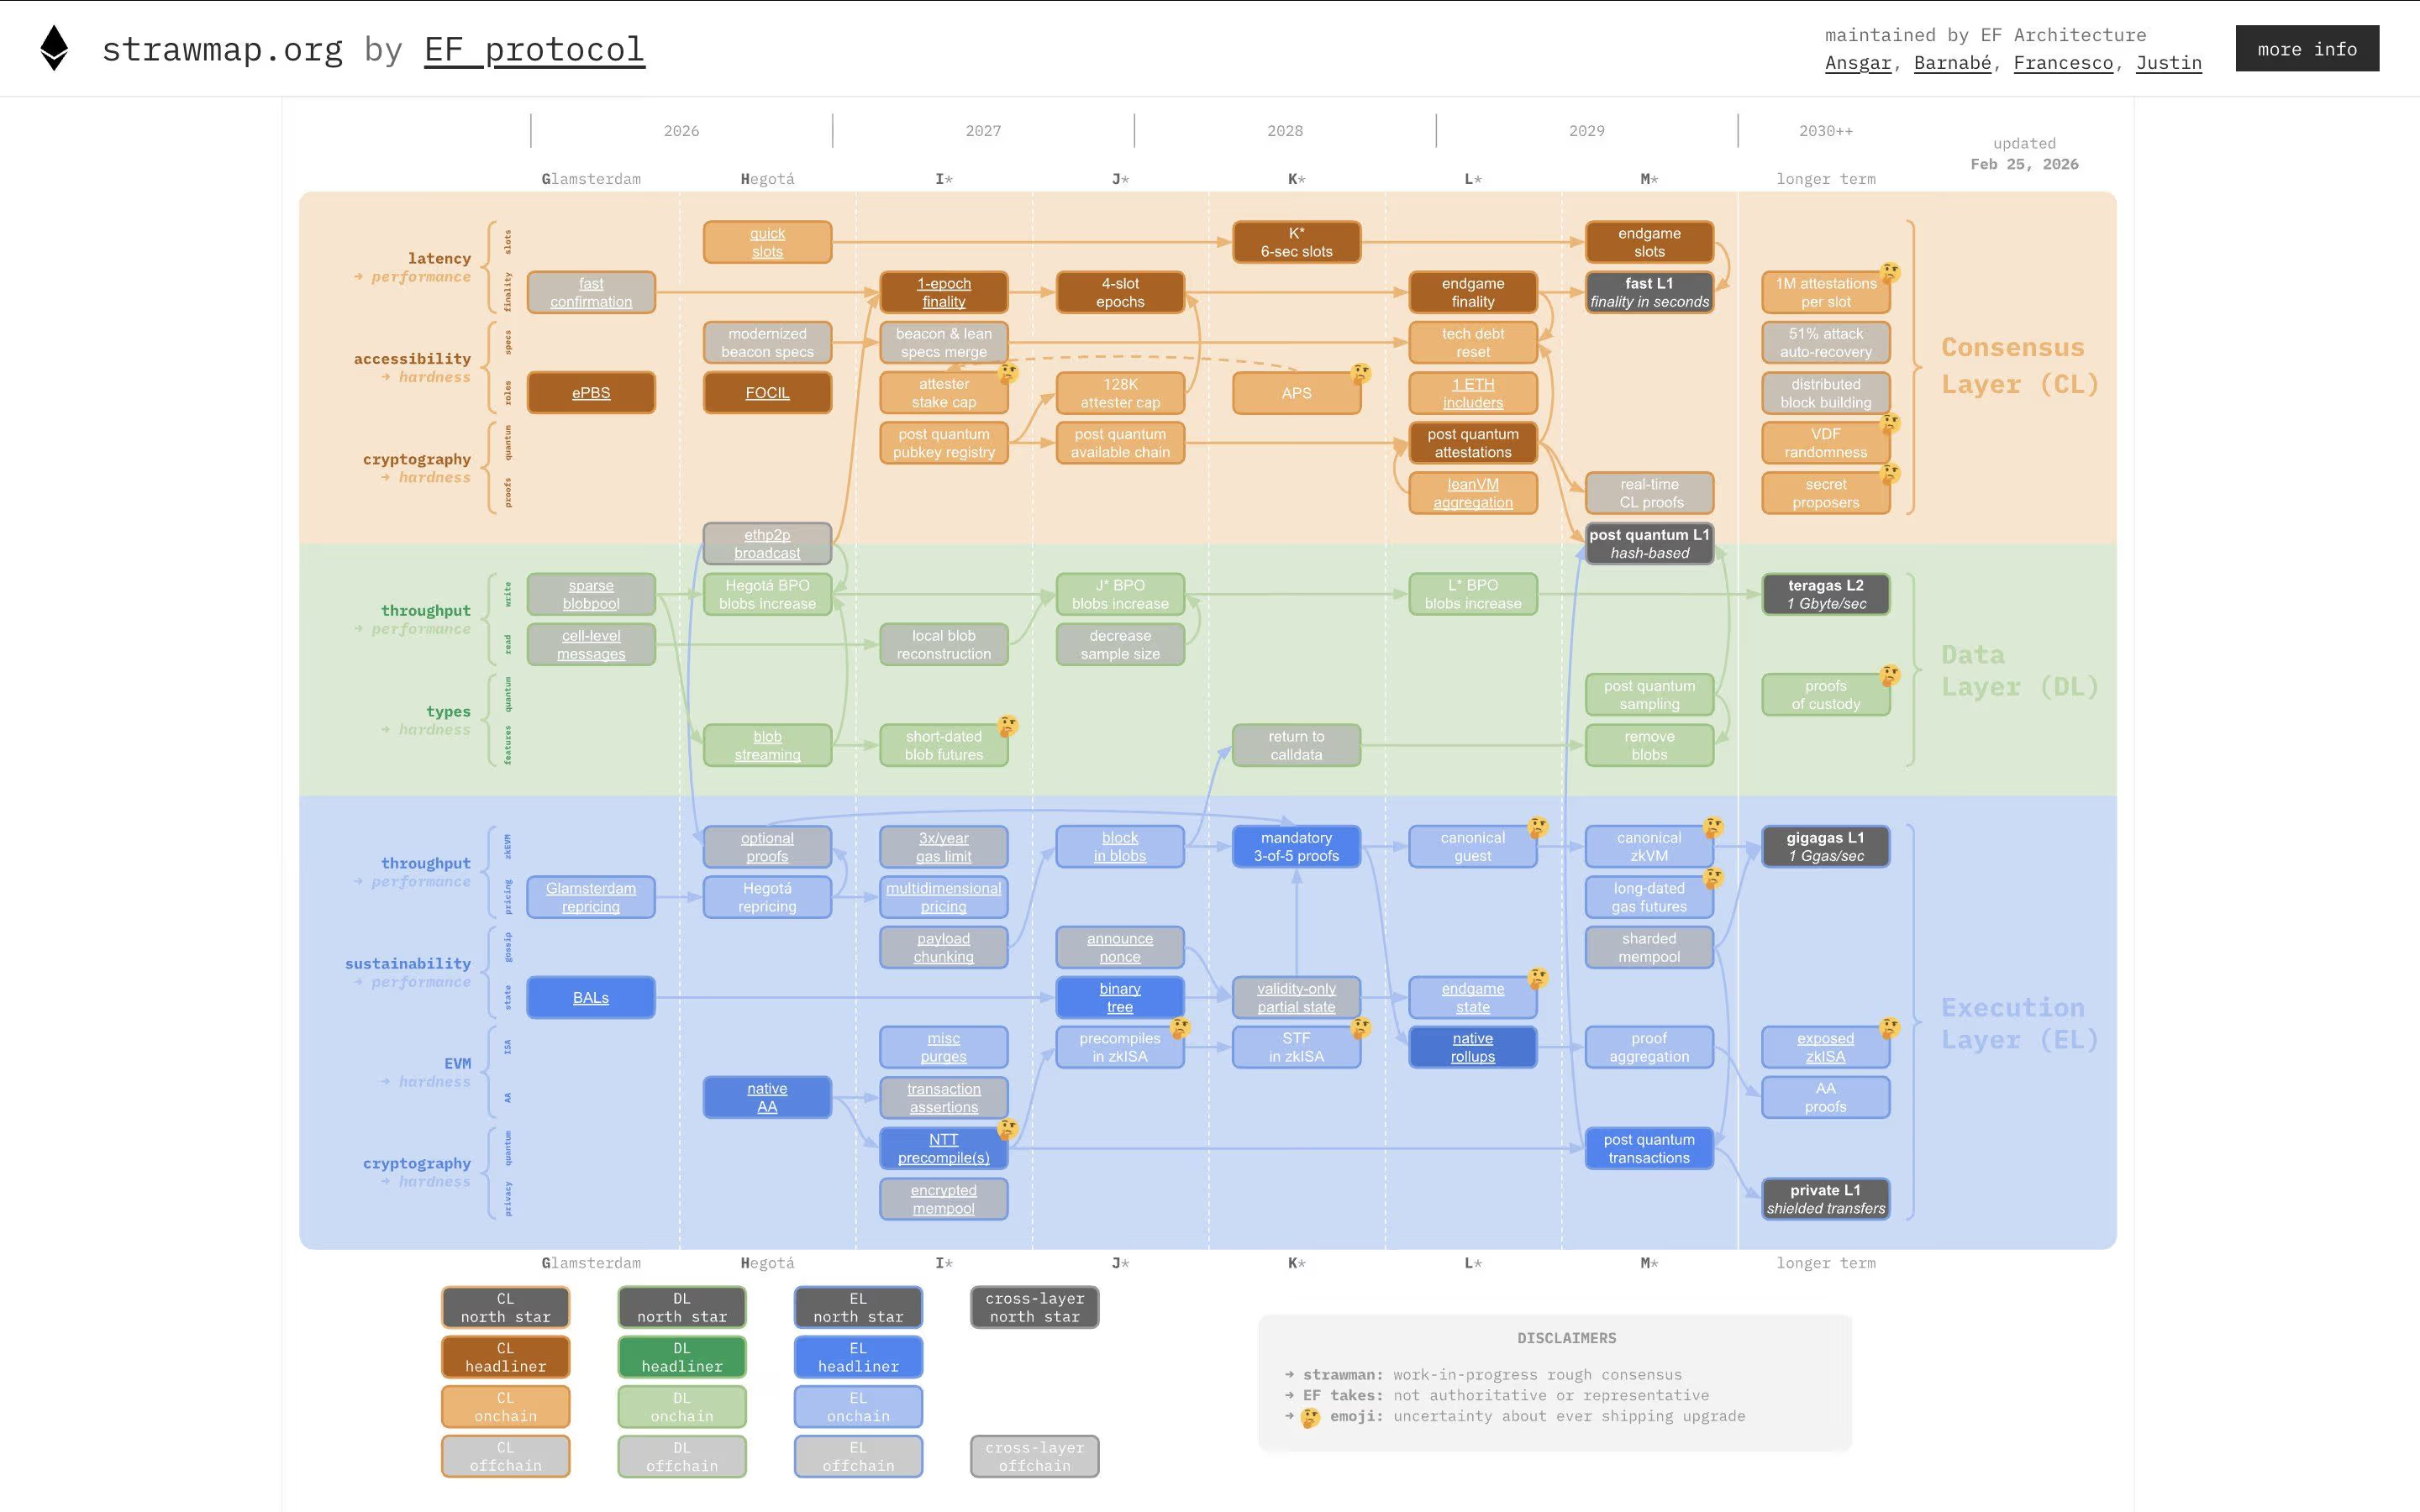
The Ethereum Foundation’s newly released “Strawmap” reads, at first glance, like something only a protocol researcher could immediately comprehend. It’s dense, diagram-heavy and packed with references to forks, zkEVMs and data availability sampling.
But beneath the technical language is a far simpler story: Ethereum — the second-largest blockchain with more than $200 billion market cap — is trying to decide what kind of infrastructure it wants to be by the end of the decade.
The ‘Strawmap’ — explicitly framed as a draft, not an official plan — sketches out Ethereum upgrades through 2029. It is not binding, but it signals where some of the network’s most influential researchers believe the base layer should head next.
“The Strawmap is largely independent from Ethereum governance… it’s a tool that helps inform R&D well ahead of Ethereum governance, potentially even years ahead,” Justin Drake, a prominent Ethereum Foundation researcher, told CoinDesk in an interview.
That direction has real consequences beyond core developers.

At the center of the document are five ambitions: near-instant transaction finality, dramatically higher throughput, built-in privacy, quantum-resistant cryptography and tighter integration between Ethereum’s base layer and its layer 2 ecosystem.
Stripped of jargon, the goal is straightforward: make Ethereum faster, more scalable, more private and durable enough to last a long time.
Today, Ethereum transactions are included in blocks quickly, but the point at which they are considered irreversible, known as finality, takes too long (roughly 16 minutes). For most casual users, that nuance is invisible. For exchanges, bridges and financial applications, it’s critical.
In a thread responding to the roadmap, Ethereum co-founder Vitalik Buterin laid out how that could change. “Today, finality takes 16 minutes,” he wrote, adding that the goal is to “decouple slots and finality” and move toward a system where “endgame finality time might be eg. 6–16 sec.”
Moving from minutes to seconds changes how comfortably large amounts of value can move across the network.
The Layer 2 debate
Earlier this month, Buterin argued that some of the assumptions behind the original layer 2 roadmap “no longer make sense” in their earlier form. Layer-2 networks were previously incorporated into Ethereum’s roadmap to scale the network by processing transactions off the main blockchain and settling them back to Ethereum, helping reduce congestion and fees.
However, as layer 1 or base layer scaling has improved and some rollups have taken longer than expected to decentralize, the idea that Ethereum would outsource most of its scaling burden entirely to L2s has become less clear-cut.
Instead, Buterin suggested a more balanced future — one where the base layer continues to strengthen while layer 2 networks evolve into more specialized roles, whether for privacy, specific applications or enhanced security models.
“Ultimately, we’re going to have finality in seconds,” Drake told CoinDesk, arguing that faster settlement will “help with bridging between the L2s” and improve user experience.
The Strawmap reflects that shift. It doesn’t necessarily say layer 2s will go extinct, but neither does it treat layer 1 as frozen. Instead, it builds on a stronger base layer, alongside improvements that enable significantly higher layer 2 capacity, which could be seen as a dual-track scaling strategy.
Privacy and quantum threat
Privacy marks another notable shift in the draft of the new roadmap.
Ethereum’s transparency has long been viewed as a positive, as every transaction is visible. But openness limits certain use cases. The Strawmap contemplates native “shielded” transfers at the base layer, which would allow ETH to move without exposing full transaction details publicly. For individuals, that’s a matter of financial discretion. For businesses, it could determine whether certain activities move onchain at all.
And then there’s the long game: post-quantum cryptography. Quantum computing remains a developing field, but if Ethereum is meant to secure trillions in value over decades, its security assumptions cannot remain static. The Ethereum Foundation recently brought together a post-quantum team, and the roadmap only shows that it continues to double down on these efforts.
For developers and businesses, the roadmap provides directional clarity. Ethereum has often been criticized for moving slowly or for perpetually delaying the timelines of upgrades. By publishing a multi-year sketch, researchers are signaling that the network’s next phase is not just about patching limitations.
Ethereum’s history, though, is full of ambitious timelines that are overstretched. Governance in a decentralized system ensures debate and revision. The Strawmap itself acknowledges it will evolve.
“For me, this is ultimately about Ethereum becoming the internet of value, and ether, the asset, becoming money for the internet,” Drake told CoinDesk.
Read more: Ethereum Foundation drops most ambitious roadmap in years, targets finality in seconds by 2029
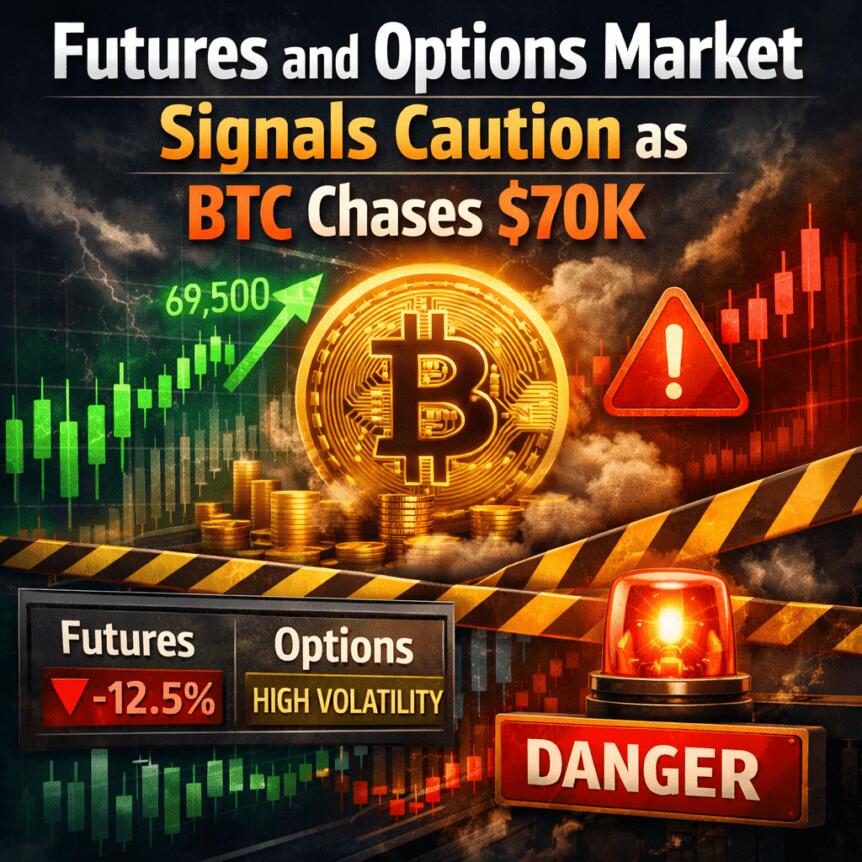
Bitcoin has inched back toward the $70,000 mark, but traders remain wary as derivatives signals fail to echo the price recovery. On Wednesday, the benchmark cryptocurrency briefly touched the round level after a Tuesday dip to around $62,500, a move that was supported by a fresh wave of inflows into U.S.-listed Bitcoin ETFs. Yet the mood in the derivatives market stayed guarded: the annualized futures premium versus the spot price hovered near 2%, well below a neutral readings range, and options markets showed a cautious stance despite the price rebound. The combination of a tepid cycle in bullish bets and lingering macro and liquidity concerns suggests that bulls may need a more durable catalyst before revisiting higher targets, such as $75,000. For context, Bitcoin has been trading in a choppy corridor as market participants weigh the near-term risk-and-reward dynamics.
Bitcoin has retested the $70,000 level amid a broader risk-off environment that has cooled some of the enthusiasm that followed the earlier rally. Official data indicates that inflows into U.S.-listed Bitcoin exchange-traded funds helped stabilize sentiment over a two-day window, with net inflows of $764 million, partially offsetting $1.2 billion of outflows observed over the prior eight trading sessions. In practice, this signals that institutional demand can surface when prices experience sharper pullbacks, even if momentum remains fragile. The underlying caution, however, is underscored by the futures market where traders appear reluctant to extend bullish exposure through leverage, a sentiment that has persisted since late January when BTC briefly relinquished a long-standing $85,000 support level.
Analysts tracking the options surface point to a more nuanced risk posture. The 30-day delta skew on BTC options, a proxy for appetite to buy protection versus chasing gains, showed a 14% premium on put options relative to calls on the most recent session, indicating that risk-off hedging remained a priority for many market participants. Although this measure has moved away from the distress levels seen earlier in the week, it remains outside a balanced range, suggesting that professional traders prefer downside protection even as the spot price paused near $70,000. Data from Laevitas.ch, cited in the market commentary, also highlights that the two-month futures annualized premium persists well below the neutral threshold of 5%, with readings around 2% on Thursday.
Beyond pure price mechanics, a spectrum of theories has circulated about what’s keeping Bitcoin under pressure. Some observers have pointed to a potential exogenous shock—quantitative trading activity and internal market dynamics at major venues—that could have contributed to the recent volatility, including episodes linked to well-known trading desks. In particular, a highly publicized line of inquiry has centered on the activities of a prominent quantitative trading firm and its relationship to other liquidity channels in the ecosystem. While those theories have triggered debate, there is no conclusive public evidence tying any single entity to the broader price weakness. The narrative has nonetheless fueled ongoing market chatter about liquidity risk and cross-venue arbitrage.
Is a single entity behind Bitcoin’s price weakness?
Over the past several weeks, a constellation of explanations has circulated for the price pullback from multi-year highs. Some narratives trace the decline to macro headlines and risk-off sentiment, while others hinge on perceived vulnerabilities within the crypto liquidity stack. The discussion intensified when a market-catalyzing event earlier in the year coincided with a broader shift in institutional posture toward risk assets. In parallel, discussions about long-term security risks—some tied to advancements in quantum computing—reappeared in market commentary, prompting blockchain developers to explore on-chain post-quantum cryptography enhancements (for example, proposals centered on upgrading cryptographic resilience).
Within this broader debate, the possibility that several market actors are reconfiguring leverage and hedging strategies has drawn attention. Recent filings from major trading firms in the context of public equity positions have sparked speculation about delta-neutral approaches and how those strategies might intersect with crypto exposure. One notable thread has involved the public disclosures of holdings that intersect with Bitcoin-related instruments, underscoring how large players may be combining on- and off-chain positions to manage risk.
Meanwhile, price action has occasionally mirrored shifts in benchmark technology equities, with macro-driven risk-off moves weighing on speculative bets. A notable signal came from a sector that often correlates with sentiment across growth and tech equities: a sharp daily decline in a leading semiconductor stock, historically viewed as a bellwether for risk appetite. The implication is not that Bitcoin’s trajectory directly mirrors that stock, but that broader risk sentiment remains a powerful driver of crypto price behavior in the near term.
On the regulatory and governance front, the crypto community has kept a close eye on proposals aimed at strengthening on-chain security and resilience. Proponents of post-quantum readiness have advanced technical ideas, including on-chain upgrades that could reduce future exposure to quantum-related risks. While the market remains in a wait-and-see mode, these technical conversations underscore the industry’s ongoing effort to harden infrastructure in the face of evolving threats.
Another strand of the discourse centers on the role of major exchanges and liquidity providers in shaping market outcomes. In the wake of high-profile liquidations tied to oracle pricing and latency issues, industry participants have emphasized the importance of robust risk controls and transparent pricing mechanisms to prevent cascading effects during periods of stress. While it is difficult to attribute BTC’s price dynamics to a single cause, the confluence of macro headwinds, hedging demand, and structural liquidity considerations appears to be anchoring sentiment at a cautious level as traders monitor the path to the next price milestone.
The conversation around Bitcoin’s price trajectory continues to be informed by a mix of on-chain indicators, derivatives signals, and macro context. While the price flirted with the $70,000 zone, the absence of a broad-based acceleration in bullish bets, coupled with persistent hedging interest, suggests that a sustained move into higher territory will require more than a momentary price bounce. Investors and traders will be watching whether this resilience can translate into a clean breakout or whether the market remains tethered to a diplomatic, risk-aware stance as the year progresses.
Why it matters
The ongoing tension between price action and derivatives signals matters for a wide range of market participants. For retail traders, the current environment underscores the importance of risk management and positioning beyond simple directional bets. For institutions, the pattern of ETF inflows and hedging activity highlights the appetite for crypto exposure when prices pull back, while also signaling caution about leverage-driven risk during periods of volatility. Miners and token issuers watch these dynamics closely because sustained price strength could influence capital expenditure plans and liquidity provisioning.
From a broader market perspective, the narrative around Bitcoin cycles—how price recovers against a backdrop of risk-off sentiment and evolving on-chain security considerations—helps frame the trajectory for other digital assets. The confluence of derivatives mood, ETF flows, and major macro indicators can serve as a guide to the potential impulse needed to push liquid markets back into a more constructive regime. In this sense, Bitcoin’s near-term path remains a useful proxy for assessing risk appetite within the crypto sector and for calibrating expectations around liquidity and institutional engagement in the months ahead.
What to watch next
- Upcoming ETF flow data and their potential to sustain or extend recent inflows, particularly if prices test or breach key levels such as $75,000.
- Public disclosures and 13-F filings from major market participants that could signal shifts in delta-neutral strategies or crypto exposure across portfolios.
- Regulatory or technical updates aimed at post-quantum security on-chain, including any formal governance proposals or implementation milestones.
- Bitcoin volatility and option markets around major expiries, which could amplify price moves if hedging demand surges or wanes.
- Key macro developments that influence risk sentiment and liquidity conditions across traditional and digital-asset markets.
Sources & verification
- Bitcoin price and futures premium data cited from Laevitas.ch, including the annualized premium around 2% and the 5% neutral benchmark.
- Bitcoin put-call delta skew data from Deribit via Laevitas.ch, showing a 14% premium for puts on the latest session.
- Net flows into US-listed Bitcoin ETFs, with $764 million in two days of inflows and prior $1.2 billion of outflows.
- Market commentary referencing on-chain security discussions and post-quantum cryptography proposals (e.g., BIP-360 concepts).
- Industry observations on liquidity dynamics, exchange risk controls, and the impact of large-scale trading activity on price moves.
Market reaction and key details
The near-term narrative remains one of cautious optimism rather than a decisive bullish breakout. While price action has managed to flirt with the $70,000 threshold, the lingering fear in derivatives markets and the absence of broad bullish momentum point to a more nuanced transition phase for Bitcoin. Investors will be watching whether upcoming ETF inflows persist and whether major options expiries bring a clearer signal about the direction of risk appetite. In the meantime, Bitcoin (CRYPTO: BTC) continues to function within a spectrum of hedging considerations and risk-management strategies as market participants weigh the evolving balance of incentives and constraints facing the crypto sector.
Tickers mentioned: $BTC, $NVDA
Market context: The current environment reflects cautious risk sentiment across both crypto and traditional markets, with liquidity conditions and hedging activity shaping short-term moves as macro factors and regulatory considerations continue to influence pricing.
Why it matters: The interaction between ETF flows, futures hedging, and security-focused on-chain proposals determines how quickly the market can transition from a risk-off stance to a more constructive rally, with implications for traders, institutions, and developers alike.
Circle reported strong fourth-quarter results, and it widened the measurable gap in the regulated stablecoin market. The company posted sharp revenue growth, and USDC circulation reached new highs. Meanwhile, Ripple’s RLUSD operates from a far smaller base, and the contrast highlights shifting scale dynamics in dollar-backed tokens.
USDC Expands Revenue Base and On-Chain Footprint
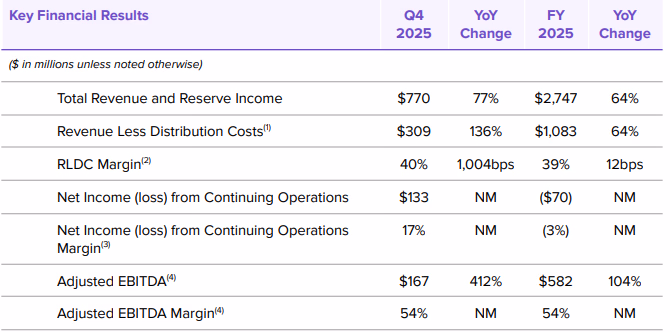
Circle Internet Group increased total revenue and reserve income by 77% year over year in the fourth quarter of 2025. The company generated $770 million, and reserve income accounted for $733 million of that figure. Moreover, reserve income rose 69% from the prior year, even as yields moderated.
USDC’s average circulation doubled during the period, and that expansion supported higher aggregate reserve balances. However, reserve yield declined to 3.8%, reflecting a 68 basis point drop. Even so, larger balances offset lower yields, and overall income continued to grow.
Distribution costs without revenue climbed 136% to $309 million, yet margins improved to 40%. Net income from continuing operations reached $133 million, and adjusted EBITDA rose 412% to $167 million. As a result, Circle strengthened its operating profile while scaling distribution.
USDC closed 2025 with $75.3 billion in circulation, marking a 72% annual increase. In addition, on-chain transaction volume hit $11.9 trillion in the fourth quarter alone. That figure represented a 247% surge, and it underscored rising usage across exchanges and payment channels.
Circle issues USDC as a regulated dollar-backed stablecoin, and it holds reserves in cash and short-duration instruments. The company positions USDC as a compliance-focused alternative within the stablecoin sector. Consequently, growth in circulation directly expands reserve income capacity and reported earnings power.
RLUSD Operates from Smaller Capital Base
Ripple introduced RLUSD to expand its stablecoin presence within global payments and exchange markets. However, RLUSD’s market capitalization stands at $1.56 billion. Daily trading volume remains around $124 million, and that scale limits reserve income potential compared with USDC.
Unlike Circle, Ripple remains privately held, and it does not publish detailed quarterly financial statements. Therefore, direct profitability comparisons remain limited by available disclosures. Even so, the difference in circulating supply creates a clear quantitative contrast.
Stablecoin economics rely on reserve balances and prevailing yields, and larger supplies generally produce higher income. Because RLUSD circulates at a fraction of USDC’s size, its reserve base remains smaller. As a result, operating leverage and reported earnings capacity trail behind USDC’s scale.
Ripple integrates RLUSD into its broader payments network, leveraging established exchange relationships. The company built its reputation on cross-border settlement infrastructure, and RLUSD extends that model into dollar liquidity. Nevertheless, current data show that adoption levels remain significantly lower than those of USDC.
Market observers previously speculated about potential consolidation within the stablecoin segment, including reports about possible acquisition discussions. However, no confirmed transaction has reshaped the competitive landscape. Instead, current standings reflect organic growth and differing starting points.
USDC’s dominance rests on circulation size, reserve economics, and transparent reporting metrics. Meanwhile, RLUSD operates within Ripple’s global framework but from a narrower capital base. The competitive gap, therefore, reflects measurable differences in supply and income rather than structural capability constraints.
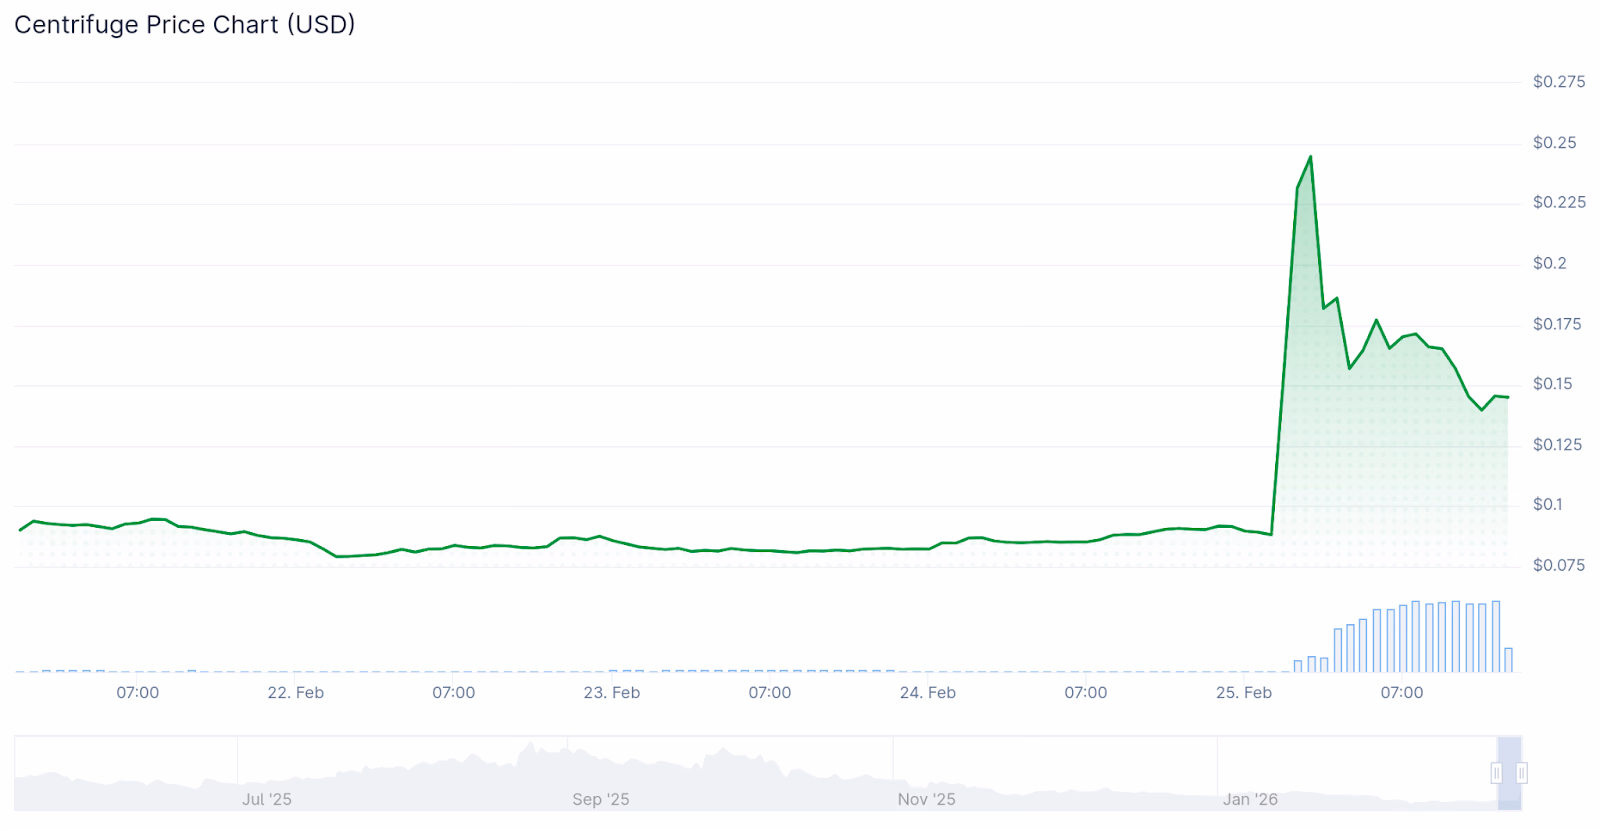
Centrifuge and Espresso experienced explosive moves after being listed on major Korean exchanges this week.
The Korean bid is becoming altcoin holders’ best friend these days, as Korean traders pile into new listings on the country’s leading centralized exchanges (CEXs).
Over the last week, South Korean CEXs Bithumb and UpBit listed two mid-sized altcoins, Centrifuge’s CFG and Espresso’s ESP, and both tokens surged. CFG rallied 177% from $0.088 to $0.24, and ESP jumped by 103% to $0.195.

The Bithumb and UpBit effects have become common at this point, and Korean CEXs have been responsible for plenty of one-time pumps in small- to mid-sized altcoins. While these CEX traders are happy to jump in and speculate on new listings, the effect usually wears off in a few days to weeks as volumes return to their pre-listing levels.
Korean CEX Bithumb also made headlines earlier this month after accidentally sending more than 200 users 2,000 BTC, worth $140 million at the time, instead of 2,000 WON.
The “airdrop” resulted in BTC dropping 18% below the actual market price on Bithumb as recipients rushed to sell the tokens and offramp the funds; however, the exchange successfully froze “most” of the accounts before funds could be withdrawn.

Crypto social isn’t dead, it’s just changing hands
New Browns HC Todd Monken reveals gift received from Shedeur Sander on 60th birthday

Plaintiffs took 'unsupported leap' in lawsuit Apple hopes to get dismissed


-

 Video7 days ago
XRP News: XRP Just Entered a New Phase (Almost Nobody Noticed)
-

 Politics5 days ago
Baftas 2026: Awards Nominations, Presenters And Performers
-

 Fashion6 days ago
Weekend Open Thread: Boden – Corporette.com
-

 Sports3 days ago
Women’s college basketball rankings: Iowa reenters top 10, Auriemma makes history
-

 Politics3 days ago
Nick Reiner Enters Plea In Deaths Of Parents Rob And Michele
-

 Business2 days ago
True Citrus debuts functional drink mix collection
-

 Politics2 hours ago
ITV enters Gaza with IDF amid ongoing genocide
-

 Crypto World3 days ago
XRP price enters “dead zone” as Binance leverage hits lows
-

 Business5 days ago
Mattel’s American Girl brand turns 40, dolls enter a new era
-

 Business4 days ago
Law enforcement kills armed man seeking to enter Trump’s Mar-a-Lago resort, officials say
-

 Tech2 days ago
Unsurprisingly, Apple's board gets what it wants in 2026 shareholder meeting
-

 NewsBeat1 day ago
Cuba says its forces have killed four on US-registered speedboat | World News
-
 NewsBeat1 day ago
Manchester Central Mosque issues statement as it imposes new measures ‘with immediate effect’ after armed men enter
-
 NewsBeat4 days ago
‘Hourly’ method from gastroenterologist ‘helps reduce air travel bloating’
-

 Tech4 days ago
Anthropic-Backed Group Enters NY-12 AI PAC Fight
-

 NewsBeat4 days ago
Armed man killed after entering secure perimeter of Mar-a-Lago, Secret Service says
-

 Politics4 days ago
Maine has a long track record of electing moderates. Enter Graham Platner.
-
 NewsBeat2 days ago
Police latest as search for missing woman enters day nine
-

 Business22 hours ago
Discord Pushes Implementation of Global Age Checks to Second Half of 2026
-

 Crypto World2 days ago
Entering new markets without increasing payment costs