Crypto World
Solana (SOL) Price Analysis: $90 Breakout or Further Decline Ahead?

Key Highlights
- SOL currently consolidates around $80 facing resistance near $87
- Technical indicators suggest potential move to $88–$90 using Fibonacci analysis
- Weekly timeframe maintains bullish scenario targeting $1,000
- Solana ETFs experienced withdrawals exceeding $17 million during the past week
- Derivatives market shows open interest dropping to $4.72 billion amid declining participation
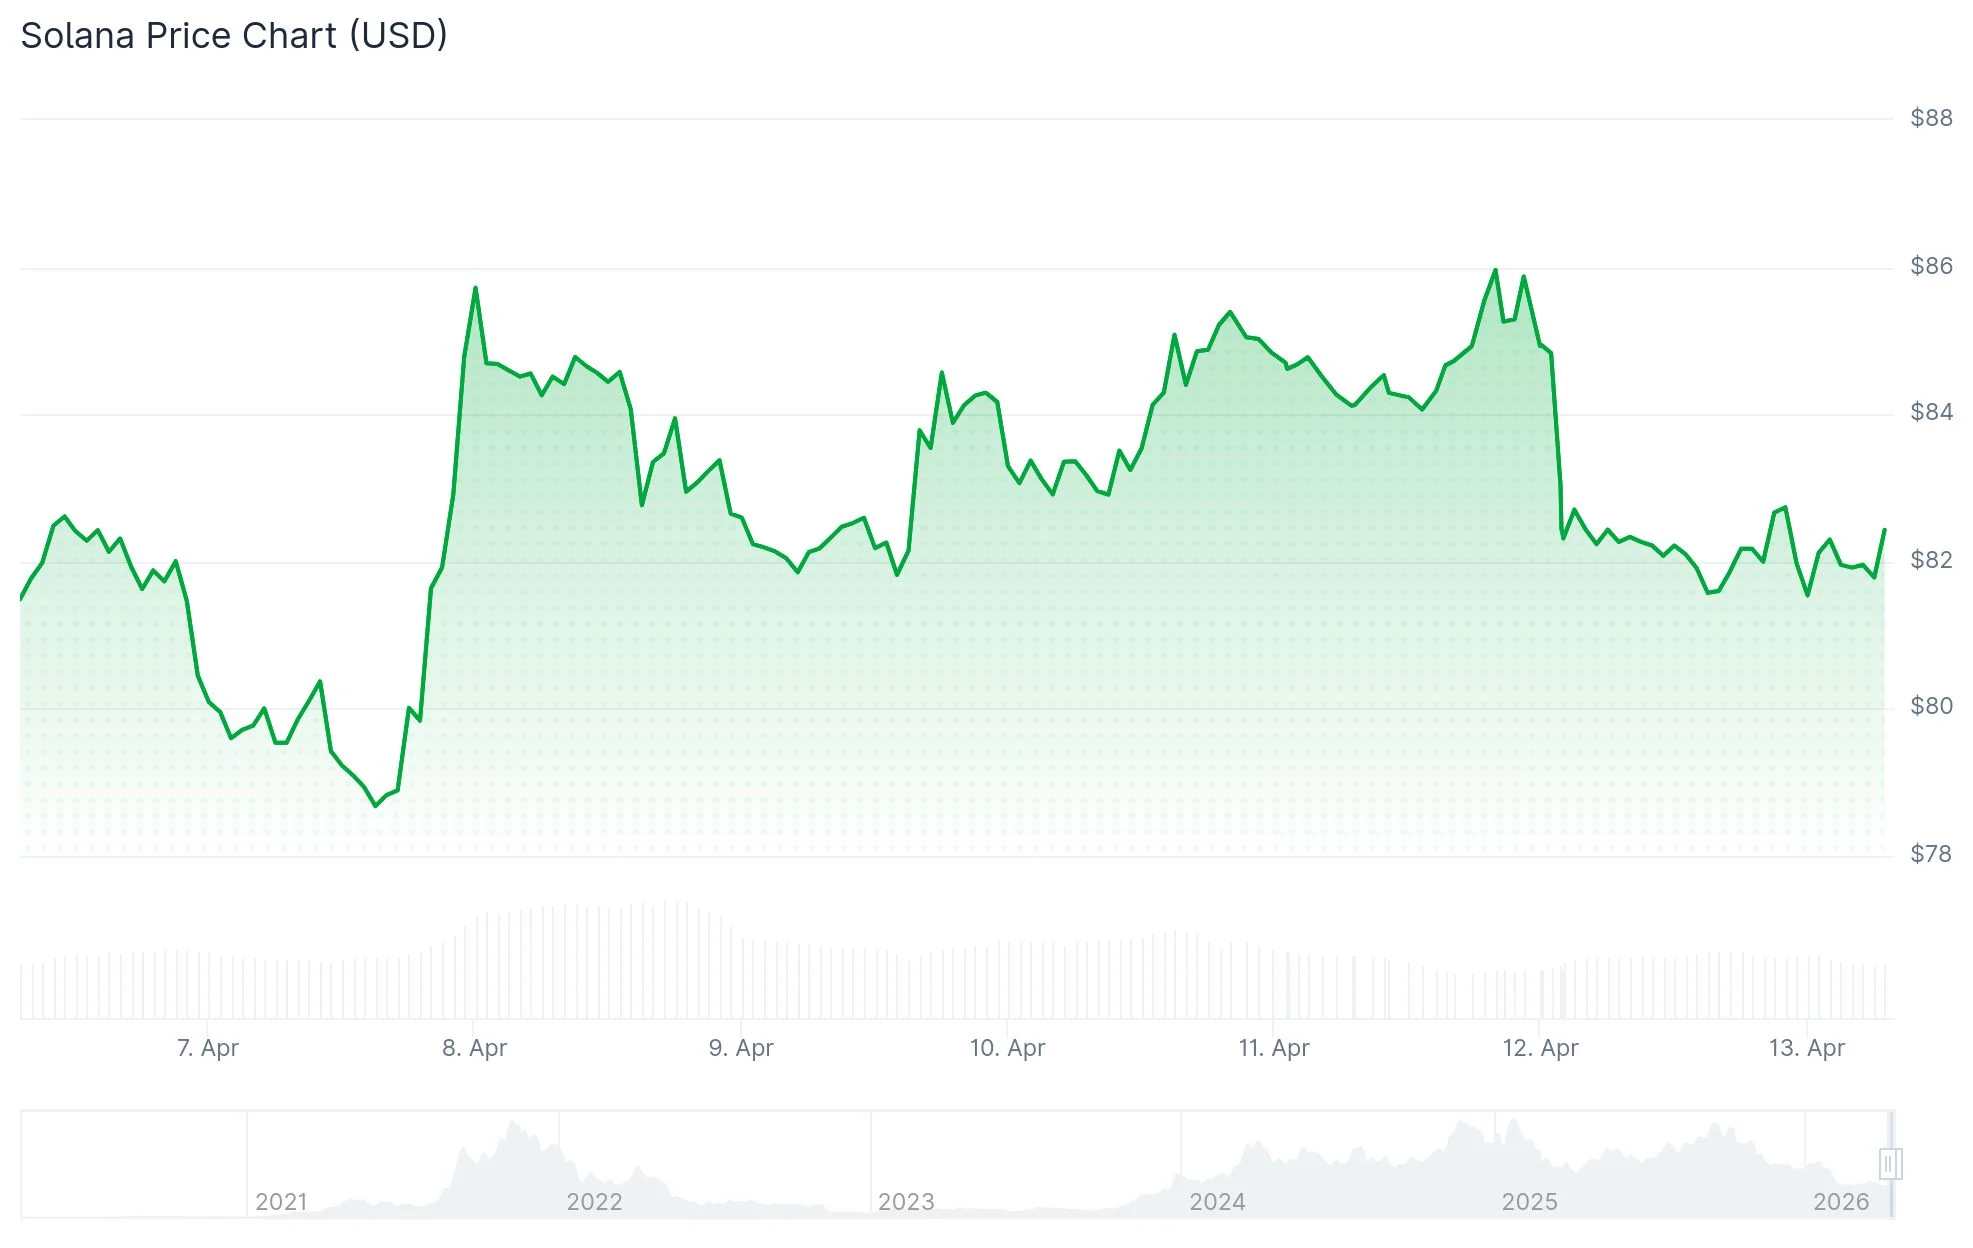
Solana maintains its position near the $80 threshold at the start of this week after experiencing a 4% decline on Sunday. This downward movement occurred in tandem with a widespread correction across cryptocurrency markets. Trading has remained confined within a defined range, as bullish momentum faces challenges breaking through critical overhead resistance.

The 50-day exponential moving average currently positions itself at $87.43, coinciding with a falling trendline. This technical level has consistently rejected bullish attempts. Additional resistance emerges from the 100-day EMA at $99.19 and the 200-day EMA at $118.32, creating multiple layers of overhead barriers.
Analyzing shorter timeframes, technical analyst MCO Global identifies a systematic progression toward a Fibonacci-derived target zone spanning $88.13 to $90.01. Multiple wave projections converge on this identical range, establishing it as the next logical upside destination should the current recovery pattern persist.
Downside protection exists between $71.92 and $77.92. The critical support floor rests at $77.60, corresponding to the February 5 low. Failure to maintain this level could trigger further weakness toward $67.50.
Institutional Withdrawals Weigh on Sentiment
Solana ETF products witnessed withdrawals surpassing $17 million throughout the week. A substantial redemption early in the period accounted for the majority of this total. Friday brought $11.45 million in fresh capital, reducing the weekly net outflow to $5.62 million.


This represents the third consecutive week of negative net flows for Solana exchange-traded funds. The pattern suggests diminishing institutional demand for SOL exposure at present valuation levels.
Derivatives metrics show open interest contracting to $4.72 billion on Monday from $4.88 billion previously. Funding rates maintain a marginally positive reading, indicating long positions continue to slightly outnumber short positions.
The Relative Strength Index registers below the neutral 50 level, signaling subdued buying pressure. While the MACD indicator trades beneath zero, preliminary signs suggest the bearish momentum may be losing intensity. However, no definitive reversal pattern has materialized.
Weekly Chart Preserves Higher Targets
Technical analyst James Easton highlights the weekly timeframe, suggesting the fundamental structure remains uncompromised. According to his assessment, Solana continues trading within an established ascending channel without violating the broader pattern.
He identifies an ambitious long-term bullish objective at $1,000, contingent upon SOL avoiding significant structural breakdown and ultimately recapturing positive momentum. Through this lens, the current price weakness appears consistent with consolidation rather than trend failure.
The weekly MACD continues displaying muted characteristics without evidence of upward momentum revival. This suggests the extended timeframe bullish scenario remains theoretically viable but requires continued patience from market participants.
Solana’s latest trading data confirms price stability just above $80, with market participants focusing attention on the $87–$90 resistance zone.


You must be logged in to post a comment Login