
Crypto World
S&P 500 Analysis: Index Falls to Year-to-Date Low
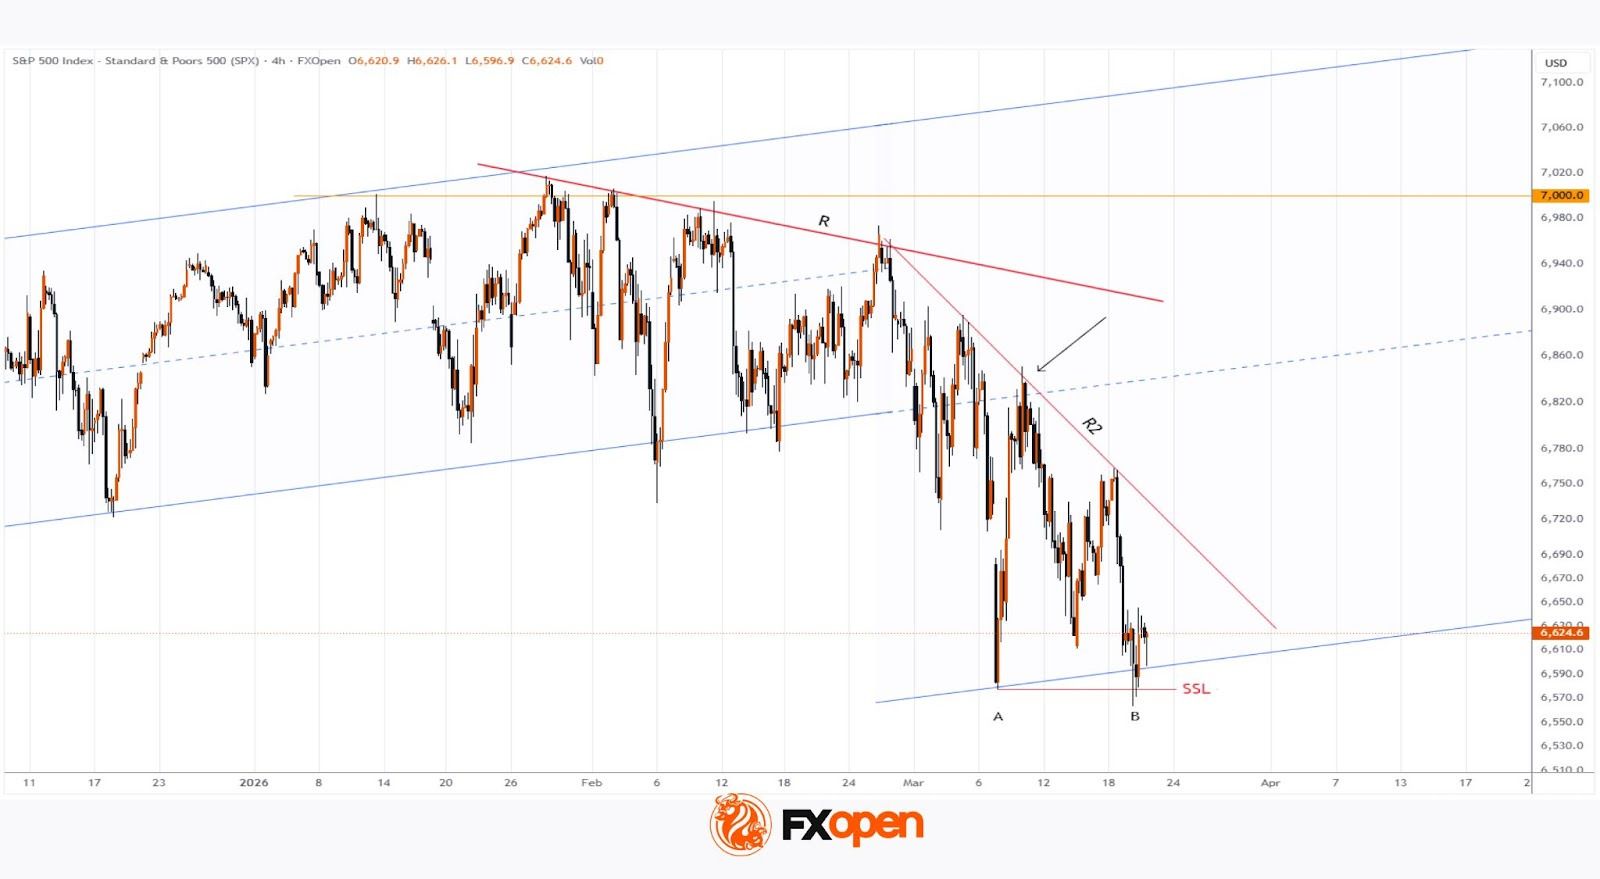
As the S&P 500 chart (US SPX 500 mini on FXOpen) shows, the index dropped below the 6,570 level yesterday for the first time in 2026. As a result, the equity market may be on track to post a fourth consecutive weekly decline, closing below its 200-day moving average.
Why Are Equities Falling?
Bearish sentiment is likely being driven by the ongoing military conflict in the Middle East:
→ Elevated oil prices are fuelling expectations of a renewed inflationary surge. This suggests the Federal Reserve will keep interest rates higher for longer (as reinforced by Powell’s remarks this week), putting pressure on both the economy and corporate performance.
→ Investors are also concerned that the United States could become drawn into a prolonged conflict with Iran, which may pose significant challenges for the country, despite efforts by officials to calm market sentiment.
According to Trading Economics:
→ US President Donald Trump stated that the US is not considering deploying ground troops to the Middle East;
→ Treasury Secretary Scott Bessent noted that the Iranian regime could face internal collapse;
→ Israeli Prime Minister Benjamin Netanyahu said Israel may refrain from further strikes on Iran’s energy infrastructure, suggesting the conflict could end sooner than expected.

Technical Analysis of the S&P 500
On 11 March, we analysed the index chart and noted that the lower boundary of the broader channel was acting as support (point A), while the median line served as resistance (as indicated by the arrow).
Since then, selling pressure has led to:
→ the formation of a steeper descending trendline (R2);
→ a move down to a new low at point B, below the previously mentioned channel boundary.
From a Smart Money Concepts perspective, it is reasonable to assume that price has entered a Sell-Side Liquidity zone. If so, traders should consider the possibility that the recent bearish breakout below the channel may prove to be false. In that case, the S&P 500 could stage a recovery in the coming sessions, potentially moving back towards the R2 trendline.
Trade global index CFDs with zero commission and tight spreads (additional fees may apply). Open your FXOpen account now or learn more about trading index CFDs with FXOpen.
This article represents the opinion of the Companies operating under the FXOpen brand only. It is not to be construed as an offer, solicitation, or recommendation with respect to products and services provided by the Companies operating under the FXOpen brand, nor is it to be considered financial advice.


- XRP price has slipped after failing to hold the $1.38 resistance level.
- Momentum stays weak as volume and buying pressure remain low.
- Price is compressed between $1.32 support and $1.39 resistance.
XRP slipped back after briefly pushing toward $1.38, marking another failed attempt to break higher.
Notably, XRP has spent the past several days moving between roughly $1.32 and the upper resistance zone near $1.35–$1.39.
But each push higher has struggled to attract enough buying pressure to sustain a breakout, and as a result, the market remains stuck in a tight range, with neither bulls nor bears fully in control.
Weak momentum keeps upside in check
One of the biggest issues for XRP right now is the lack of momentum.
Even with the impressive gains, the strength behind those gains is limited. Indicators are hovering around neutral levels, showing that buyers are not stepping in aggressively.
Volume has also been inconsistent, and in some cases, it has even declined during upward moves. That is usually a warning sign that the rally may not last.
This weakness becomes even more noticeable when compared to the broader market.
Bitcoin has been leading recent gains, lifting many altcoins along with it and while XRP has followed this trend, it has not shown much independent strength of its own.
That matters because externally driven rallies tend to be fragile.
If Bitcoin slows down or pulls back, XRP could quickly lose support and fall back into its lower range.
Without a strong internal catalyst, it is difficult for XRP to break away from this pattern.
A market in compression, not in trend
While momentum remains weak, there is another side to the story that cannot be ignored.
XRP’s supply on exchanges appears to be tightening, suggesting that more holders are choosing to keep their tokens rather than sell.

At the same time, there is very little leverage in the market. Traders are not taking large speculative positions, which reduces the chances of sudden, exaggerated moves in either direction.
This combination creates what would be termed a compression phase, since the price is not moving much, volatility is shrinking, and participation is relatively low.
XRP breakout potential vs downside risk
The current setup leaves XRP at a crossroads. On one hand, the tightening supply and improving broader sentiment suggest that a breakout is possible.
On the other hand, the lack of momentum and weak participation make it difficult to trust any move higher without confirmation.
If XRP manages to hold above the $1.28–$1.31 support zone, another attempt at testing the $1.35–$1.39 resistance zone is likely.

And a decisive push above $1.39, supported by stronger trading activity, could shift sentiment and push the price towards the multi-month resistance at $1.43.
However, the downside risk is just as important. A break below the $1.32–$1.33 support zone could lead to a quicker drop, with analysts highlighting $1.28 as the next support level to watch.
If selling pressure increases further, deeper support near $1.13 could come into focus.
For now, the market is not trending but rather preparing for its next move.
The pullback from $1.38 highlights the lack of strength, but it also reinforces how tightly price is coiling, and the longer XRP remains in this range, the more meaningful the eventual breakout or breakdown is likely to be.

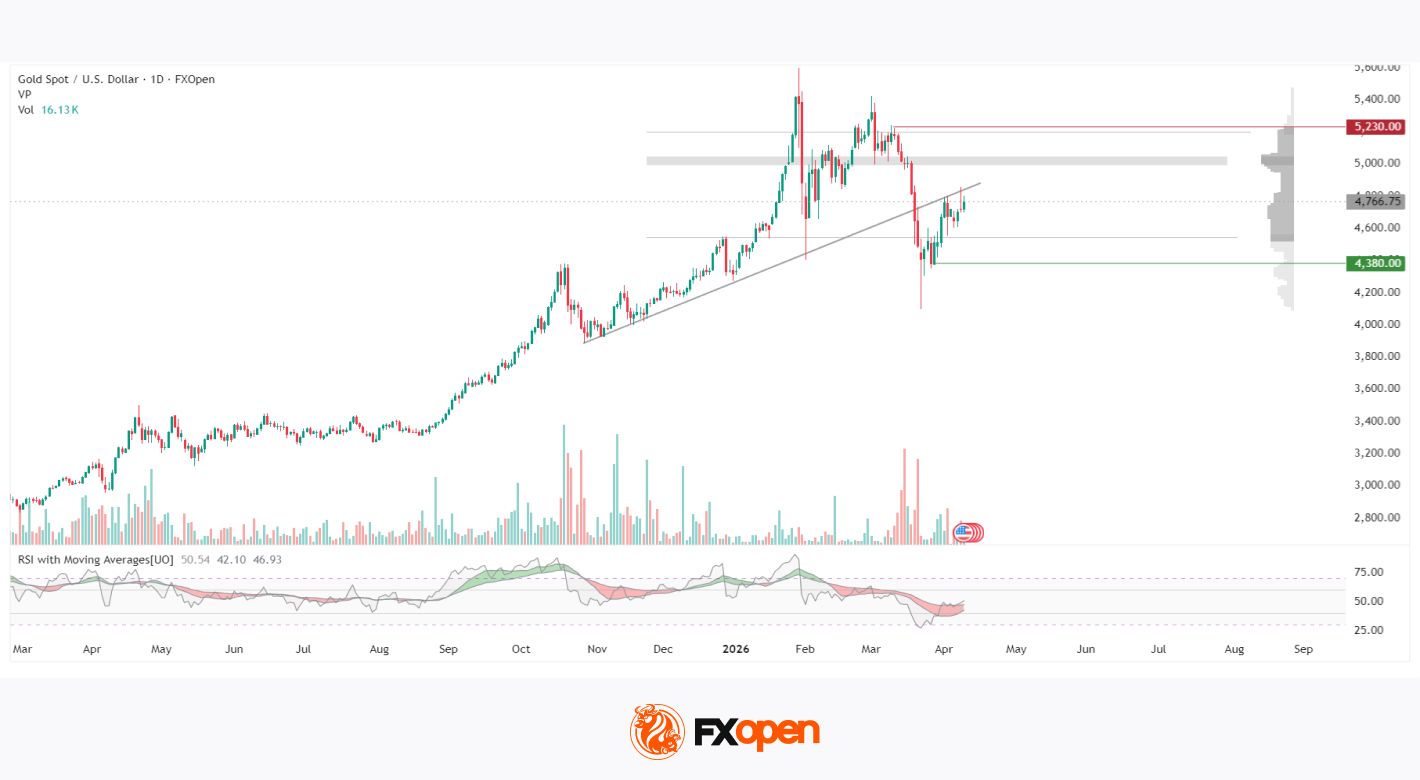
Geopolitical tensions in the Middle East had remained the primary macro driver for the gold market over recent weeks; however, on 8 April the situation shifted sharply as the United States and Iran agreed to a temporary two-week ceasefire, including the reopening of the Strait of Hormuz and a pause in military strikes. The easing of acute tensions triggered a sharp decline in oil prices and a return of risk appetite across global markets, weighing on demand for safe-haven assets. As a result, gold retreated from intraday highs near 4,850.
That said, the durability of the agreement remains uncertain. Reports of localised strikes in the region continue to keep market participants on edge, preventing a full dismissal of Iranian-related risks. Additional influence comes from macroeconomic data—particularly US inflation—whose interpretation in the context of Federal Reserve rate expectations continues to shape dollar dynamics. Structural support from central banks persists, with China continuing to increase its gold reserves, while Malaysia and South Korea have resumed purchases after an extended pause.
Technical Outlook
On the daily chart of XAU/USD, a clear two-phase structure is evident. An uptrend that began in March 2024 drove prices to a record high in the 5,595–5,600 range by late January 2026, followed by a sharp and impulsive decline. Notably, the peak in vertical volume occurred not at the price high, but during the subsequent sell-off in March 2026, indicating a climactic phase of selling rather than buying.
The low of that move was recorded near 4,100, from which price rebounded to current levels around 4,766. The horizontal volume profile reveals a dense cluster in the 4,990–5,050 zone, marking the point of control (POC) where trading activity has been most concentrated. This area acts as a natural resistance to further upside. The next significant level above lies at 5,230.
The ascending trend line originating from autumn 2025 was broken to the downside in March 2026 and no longer serves as support for buyers. It may now act as an additional resistance near the 5,000 level.
The lower boundary of the current range is located around 4,380. The RSI and moving averages stand at 50.54 / 42.10 / 46.93, with the RSI hovering near the neutral 50 level and remaining below both upward-sloping moving averages, signalling a lack of confirmed directional momentum.
Summary
Following the completion of an active corrective phase, gold has stabilised below the POC zone, while the RSI remains near neutral levels without a clear directional bias. The current trading range—4,380 on the downside and 5,230 on the upside—continues to define the market structure, as geopolitical developments and Federal Reserve rhetoric shape short-term price dynamics.
Start trading commodity CFDs with tight spreads (additional fees may apply). Open your trading account now or learn more about trading commodity CFDs with FXOpen.
This article represents the opinion of the Companies operating under the FXOpen brand only. It is not to be construed as an offer, solicitation, or recommendation with respect to products and services provided by the Companies operating under the FXOpen brand, nor is it to be considered financial advice.
Key Highlights
- Bittensor’s TAO token plummeted over 18% following Covenant AI’s departure announcement
- Sam Dare, Covenant AI’s founder, leveled accusations of centralized governance against Bittensor co-founder Jacob Steeves
- Claims include suspended emissions, revoked moderation privileges, and deprecated subnet infrastructure
- TAO currently hovers between $263 and $292, trading beneath its 200-day moving average with $250 as critical support
- Derivatives market shows nearly 1% decline in open interest to $392.59 million, with significant liquidations across major exchanges
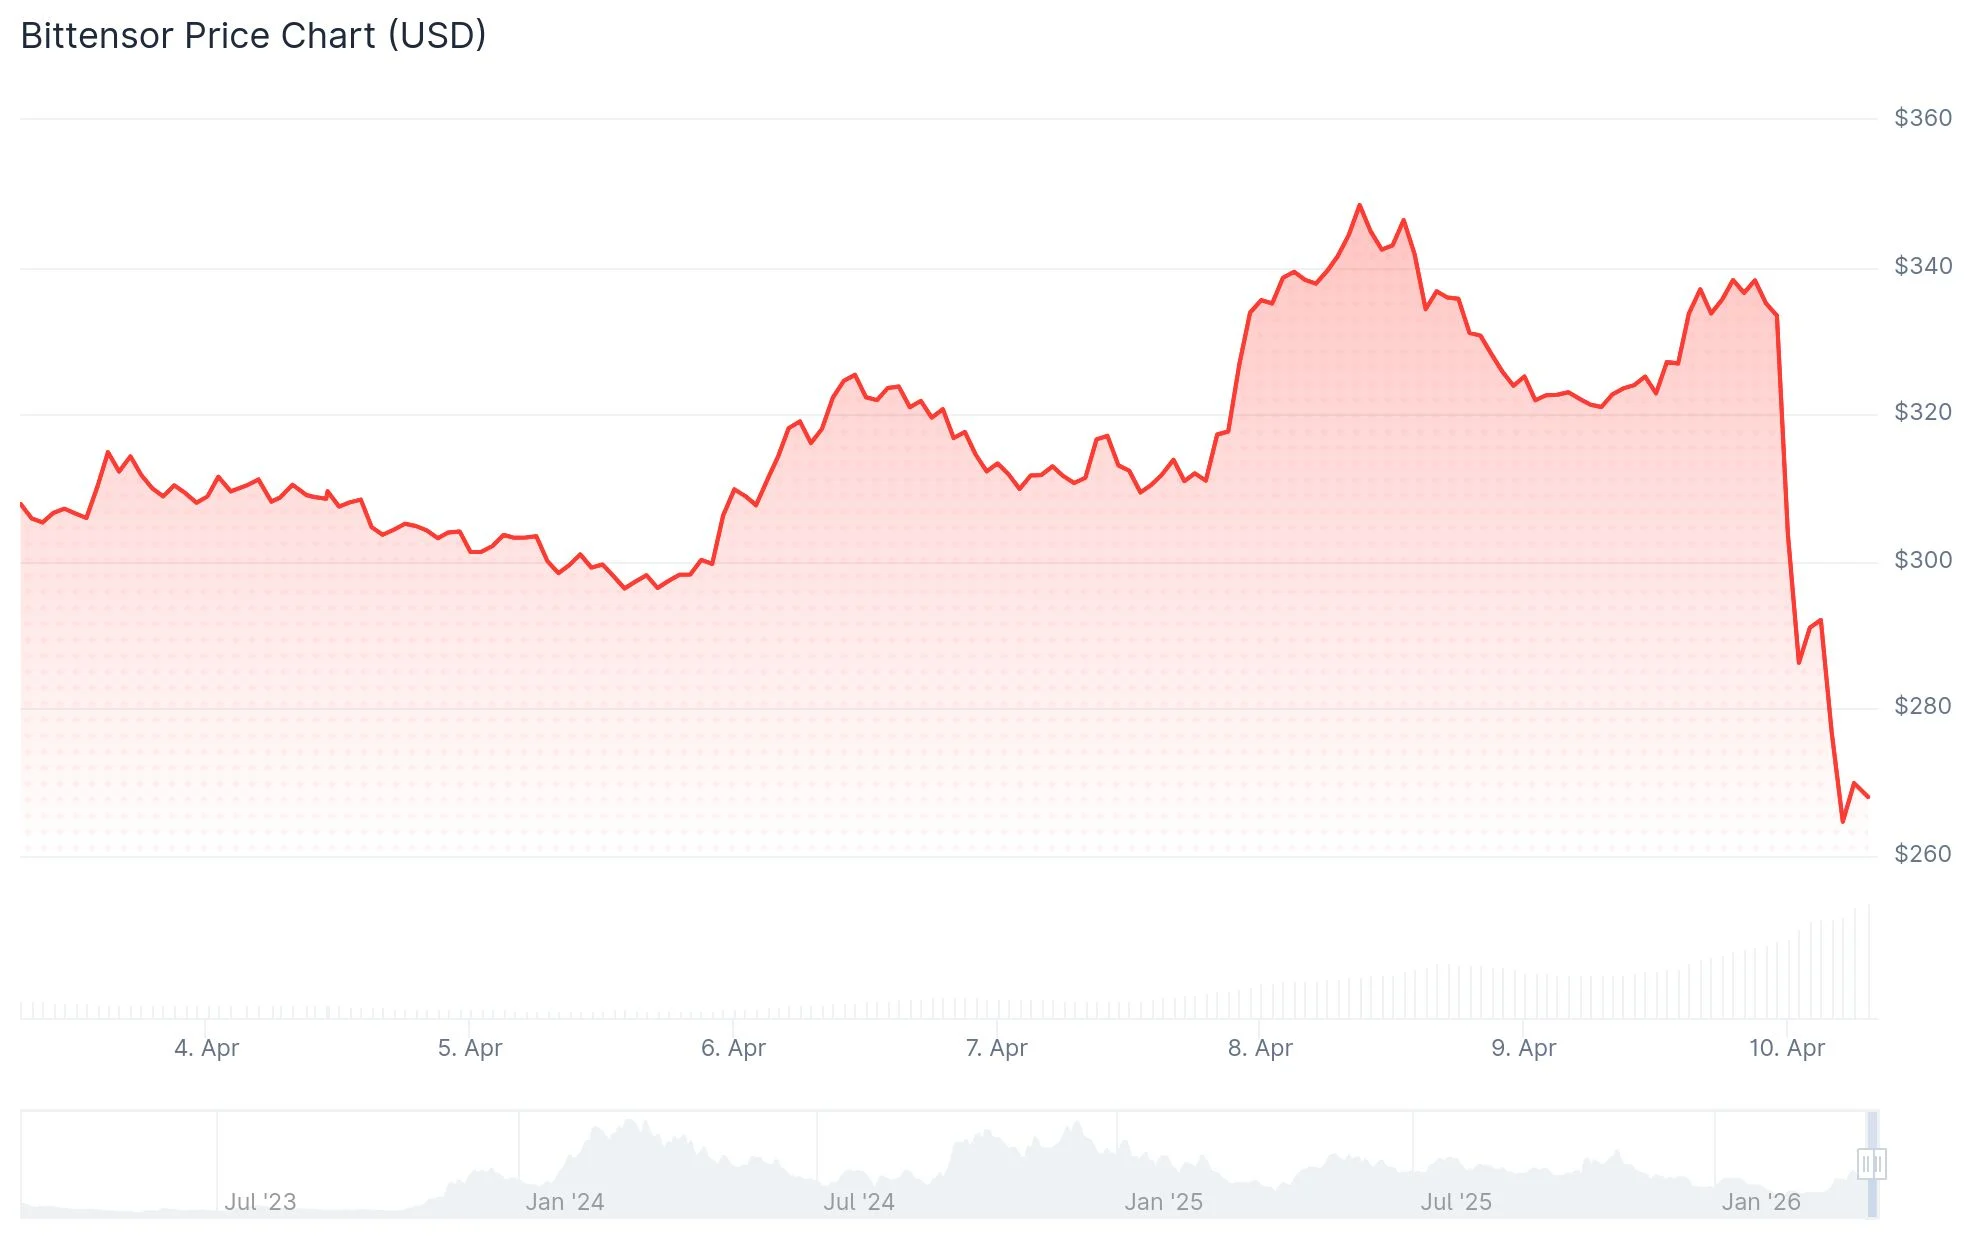
The Bittensor network experienced a significant blow on April 10, 2026, as its native TAO token shed more than 18% of its value within a single day. This dramatic downturn wiped out gains from a previous rally that had pushed prices up over 100%, with the catalyst being Covenant AI’s decision to withdraw from the ecosystem.

As one of the network’s most prominent participants, Covenant AI managed three distinct subnets: Templar (SN3), Basilica (SN39), and Grail (SN81). Their departure represents a substantial loss for the protocol’s operational infrastructure.
In a scathing public disclosure, Sam Dare, who founded Covenant AI, directly challenged the decentralization claims of Bittensor, specifically targeting co-founder Jacob Steeves for what Dare characterizes as autocratic network management.
“The network functions under a triumvirate framework—three people controlling the multisig for protocol upgrades. This is marketed as distributed governance to the community. That’s misleading. This is decentralization in name only,” Dare stated in his announcement.
According to Dare’s allegations, Steeves halted token emissions to Covenant’s operational subnets, removed their administrative access to community communication platforms, forcibly deprecated their subnet systems, and executed calculated token liquidations designed to create financial strain.
Steeves “wields ultimate authority over the triumvirate, opposes any substantive power-sharing arrangements, and implements protocol modifications at will, bypassing established procedures and collaborative decision-making,” Dare asserted.
Complete Liquidation of TAO Position
Following the announcement, Dare liquidated his entire position in the network. Blockchain analysis from taosats revealed he sold more than 37,000 TAO tokens from his personal wallet, creating immediate downward price pressure on the asset.
While severing ties with the [[LINK_START_2]]Bittensor[[LINK_END_2]] ecosystem, Covenant AI confirmed it would maintain its research division, proprietary models, and ongoing development efforts. The organization indicated forthcoming announcements regarding new initiatives. “Decentralized, permissionless artificial intelligence training isn’t exclusive to Bittensor. It represents a technological frontier our team remains committed to exploring,” the company stated.
At press time, TAO was fluctuating in the $263 to $292 range. Throughout the 24-hour period, the token reached a low of $262.51 and peaked at $341. Transaction volume surged by 156% during this timeframe.
Critical Price Levels Under Watch
Well-known market analyst Cheds Trading observed that TAO has broken below its 200-day moving average and is approaching the 50-day moving average positioned at $250. The Relative Strength Index (RSI) declined to 41, suggesting additional downward momentum could be imminent.
The Covenant-72B model developed by Covenant AI had previously served as a major catalyst for TAO’s bullish performance. When NVIDIA CEO Jensen Huang mentioned the model during an appearance on the All-In Podcast, the endorsement contributed to TAO’s subsequent 90% price surge.
Derivatives market data from CoinGlass indicated that Bittensor futures open interest contracted by nearly 1% to $392.59 million in just one hour. The most substantial selling activity occurred on OKX, Gate, Bitget, Hyperliquid, and LBank exchanges. At the time of analysis, neither Binance nor Bybit had reflected comparable adjustments.
Following Covenant AI’s withdrawal, TAO is currently priced around $263 with derivatives open interest standing at $392.59 million.


A new pricing mechanism for the x402 protocol will allow AI agents to pay for compute resources based on actual usage rather than fixed rates.
Summary
- Coinbase has introduced the “Upto” mechanism for the x402 protocol to enable usage-based payments for AI compute tasks.
- Coinbase Developer Platform confirmed the update replaces fixed-price models with a system where users only pay for actual resource consumption, like token counts or processing time.
According to a Thursday announcement on X by the Coinbase Developer Platform, the newly launched “Upto” scheme enables variable-cost services for tasks like data queries and large language model inference.
This update addresses a long-standing limitation in the protocol that prevented efficient payments for services where costs are not known upfront.
“Until now, x402 only supported exact, fixed-price payments. That works great for deterministic APIs. But it blocked an entire category of services where the cost depends on usage, such as token count, compute time, or query complexity,” the Coinbase Developer Platform stated.
The technical framework operates as an Ethereum Virtual Machine (EVM) implementation that supports all ERC20 tokens. To further streamline the process, the CDP Facilitator has been integrated to allow for transactions without gas fees.
Under this new arrangement, sellers set a maximum price while buyers authorize a spending limit for a specific task. Once the AI agent completes the request, the server calculates the precise cost and charges only for the resources consumed.
This prevents the previous issue where users frequently overpaid for simple tasks or underpaid for complex ones because the protocol could not adjust for fluctuating server-side demands.
Industry adoption of the x402 protocol has grown as companies prepare for the rise of agentic commerce, a sector that requires rapid, frictionless payments to handle high network demand.
While Coinbase originally developed the protocol, the company recently transferred ownership to the nonprofit Linux Foundation. Major technology players, including Google, Microsoft, and Amazon Web Services, now hold stakes in the protocol through the x402 Foundation.

Microsoft’s stock outlook for 2026–2030 remains broadly constructive, driven by continued growth in Azure, expanding AI monetisation through Copilot, and a $625 billion commercial backlog that provides unusual revenue visibility. The stock trades near $373 as of 8th April 2026, down roughly 33% from its July 2025 all-time high, with the forward P/E compressed to around 20x.
Base-case scenarios point to steady long-term appreciation as AI infrastructure spending begins converting into returns. However, the pace of any recovery depends on capex discipline, Copilot adoption rates, macro conditions and interest rate direction. Valuation sensitivity remains a key swing factor. Read on to learn more about key drivers and risks for MSFT stock price.
Analytical MSFT Stock Price Prediction: Quick Answer
MSFT trades near $373 as of 8th April 2026, down roughly 33% from its all-time high of $555.45 reached in July 2025. The 12-month analyst consensus averages approximately $582 across 34 analysts tracked by StockAnalysis, with targets ranging from $392 (Stifel) to $675 (Jefferies).
The stock trades at roughly 20x forward earnings on FY2027 Microsoft EPS forecast of ~$19.38, which assumes continued Azure momentum, gradual Copilot scaling and no further macro deterioration.
- Base view: Steady cloud and AI revenue growth supports a gradual recovery towards $500–$550 over 12 months.
- What must go right: Copilot adoption accelerates, capex-to-revenue conversion improves, and rate expectations stabilise.
- What could derail it: AI monetisation disappoints, capex keeps outpacing Microsoft revenue growth, or tariff and rate uncertainty deepens the selloff.
Recent Price History of MSFT
MSFT traded in a wide range over the past twelve months, falling from an all-time high of $555.45 in late July 2025 to around $357 by the end of March 2026. That represents a drawdown of over 35% from peak to trough. As of 8th April 2026, the stock is down approximately 23% year-to-date, on track for its worst annual performance in nearly two decades.
Several catalysts shaped the move. A strong AI narrative and accelerating Azure growth pushed MSFT above $500 through mid-2025, with the company briefly joining the $4 trillion market cap club in July and October 2025. The reversal began on 28th January 2026, when Q2 FY2026 earnings revealed $37.5 billion in quarterly capex. The stock fell 10% in a single session.
The sharp swings reflected two colliding forces. Through mid-2025, traders priced in AI as a margin expansion story. Once the true infrastructure cost emerged, the narrative flipped to a capital destruction story. Each earnings print and macro headline amplified moves in both directions as the market repriced how long the capex cycle would last.
What Could Drive Microsoft Stock Between 2026 and 2030?
The path for Microsoft stock price predictions through 2026-2030 hinges on a handful of measurable business drivers. Each connects directly to earnings power and how the market values the stock.
What Drives Microsoft Stock?
- Azure and cloud demand: The core earnings engine, currently growing 39% year-over-year.
- AI monetisation and Copilot uptake: 16 million paid seats, but attach rates and pricing power matter more than headlines.
- Capex, margins and cash-flow conversion: Spending pacing toward $145 billion annually, pressuring free cash flow.
- Valuation regime and interest rates: The forward P/E compressed from 33x to roughly 20x as rate expectations shifted.
Azure and Broader Cloud Demand
Intelligent Cloud delivered $32.9 billion in Q2 FY2026, up 29% year-over-year. Azure and other cloud services grew 39%, with AI workloads contributing an estimated 13 to 16 percentage points. Cloud now accounts for more than 60% of Microsoft’s total revenue and carries higher margins than legacy segments. The business remains capacity-constrained, with roughly $80 billion in unfulfilled Azure orders due to power and data centre limitations.
Microsoft AI Monetisation and Copilot Uptake
Microsoft 365 Copilot reached approximately 16 million paid seats by December 2025, up 160% year-over-year. At $30 per user per month, that implies a run rate of roughly $5.8 billion. But the M365 commercial installed base sits between 415 and 450 million, meaning penetration remains below 4%. A new premium E7 tier at $99 per month launches in May 2026. Enterprise renewal and usage rates climb from here matters.
Capex, Margins and Cash-Flow Conversion
Microsoft spent $37.5 billion on capex in Q2 FY2026 alone, up 66% year-over-year. Quarterly free cash flow fell to $5.9 billion. This spending funds the data centres and AI accelerators behind Azure and Copilot. Over time, it could produce strong returns if AI workloads scale. In the near term, it compresses free cash flow and raises the bar for what revenue growth needs to deliver.
Microsoft’s Valuation Regime and Interest Rates
MSFT’s forward P/E fell from roughly 33x in mid-2025 to around 20x by April 2026. The Fed holds rates at 3.50% to 3.75%, with only one further cut projected by year-end. Higher rates reduce the present value of future earnings, hitting growth stocks disproportionately. Even strong EPS growth may not lift the stock if the multiple keeps contracting.
Traders may track MSFT CFD price movements in FXOpen’s TickTrader platform.
Analytical Microsoft Stock Bull, Base and Bear Cases (12-Month / 2026 View)
In a base analytical Microsoft stock price prediction for 2026, Microsoft sustains mid-to-high-teens revenue growth, Copilot adoption scales steadily and the forward multiple stabilises near current levels. In a bull case, Azure reaccelerates above 40%, AI monetisation inflects meaningfully and rate expectations shift dovish, allowing the multiple to expand. In a bear case, capex continues to outpace revenue gains, Copilot uptake stalls and macro weakness compresses valuations further.
Price targets are based on publicly available 12-month analyst consensus data from StockAnalysis, accessed 8th April 2026 (34 analysts). Published values: average $582, high $675, low $392.
Other aggregators, including TipRanks and MarketBeat, show a broadly similar range, although exact figures vary due to differences in analyst coverage, sample windows, and update frequency.
Analytical Long-Term Outlook for Microsoft Stock (2027-2030)
It’s difficult for analysts to make accurate Microsoft stock forecasts four to five years out, especially when the company is mid-cycle on the largest infrastructure build in corporate history. A more practical approach is to identify what would need to happen for the stock to move materially higher or lower from current levels.
AI and Cloud Compounding
If Azure’s growth outlook remains positive, above 25% annually, and Copilot penetration climbs from below 4% towards 10–15% of the M365 installed base, the revenue mix shifts towards higher-margin recurring software. At that scale, the capex currently weighing on free cash flow starts to look like invested capital generating strong returns. Microsoft’s commercial backlog of $625 billion provides a foundation, but the conversion rate into recognised revenue is what matters.
Platform Expansion Beyond Current Products
Microsoft is positioning itself as a fully integrated AI-driven platform, rather than a collection of standalone products. This platform expansion is underpinned by investments in proprietary silicon (Maia 200 AI chip), cloud-scale AI infrastructure, and deeper integration across enterprise applications, enabling tighter control over both performance and cost structures. Core assets such as Microsoft Azure and Microsoft 365 are increasingly interconnected, supporting cross-product monetisation and higher client retention.
Valuation Context
MSFT has delivered strong profit growth over the past five years, averaging close to 19% per year. Even if this growth slows to around 12–15% annually through 2030, the current share price still leaves room for further gains, as profits alone could support higher valuations over time. In this case, stock performance would be driven mainly by continued business growth rather than investors paying a higher price for each dollar of earnings. However, if profit growth slows to single-digit levels, the stock may begin to behave more like a mature large-cap, with more limited upside and less investor enthusiasm.
How Trader Can Evaluate a Microsoft Stock Forecast
Traders typically break an MSFT analysis into a few core steps.
- Starting with Microsoft valuation and earnings: Traders check the trailing and forward Microsoft’s P/E ratio against five-year average and the broader S&P 500. A widening premium without an acceleration in EPS growth could alter risk/reward. At roughly 20x forward earnings, MSFT currently trades below its recent historical range of 28–33x.
- Tracking Azure and Copilot momentum: Azure’s quarterly growth rate and Copilot seat count are the two clearest signals of whether Microsoft’s AI investment is translating into revenue. Both figures appear in each quarterly earnings release.
- Watching the capex-to-free-cash-flow ratio: When capex consumed $37.5 billion in a single quarter against $35.8 billion in operating cash flow, the free cash flow margin collapsed. Monitoring whether this ratio improves or worsens quarter-over-quarter reveals how quickly infrastructure spending converts into returns.
- Factoring in macro and rate expectations: MSFT’s valuation is sensitive to interest rate direction. Fed policy shifts and inflation data move the multiple independently of company fundamentals, as the 2025–2026 drawdown demonstrated.
MSFT Risks: Factors That Could Limit Upside
There are risks that could negatively affect MSFT price.
- Slower Azure growth: If cloud demand softens or capacity constraints persist, the core earnings engine decelerates. Even a few percentage points of slower growth would pressure the multiple.
- Weak AI monetisation: Copilot penetration remains below 4%. If enterprises treat it as discretionary rather than a core workflow tool, renewal rates disappoint and the capex programme looks harder to justify.
- Competition from AWS and Google Cloud: Azure gained share through 2025, but Google Cloud is growing faster in percentage terms and neoclouds like CoreWeave are scaling rapidly in AI-specific workloads.
- Regulatory pressure: The EU’s Digital Markets Act investigations into Azure, the ongoing Teams antitrust case, and the UK CMA’s probe into Microsoft’s licensing practices could each constrain pricing power.
- Macro-driven multiple compression: At roughly 20x forward earnings, much of the valuation reset has already occurred. But if rates stay elevated or rise further, the multiple has room to compress again.
Final Thoughts
Microsoft enters the 2026–2030 period with a strong but complicated setup. Revenue growth is accelerating, the cloud and AI backlog provides unusual visibility, and the valuation has compressed to levels not seen in nearly a decade. But the capex cycle is unprecedented, AI monetisation remains early-stage, and the macro environment adds uncertainty around the pace of any recovery.
Contradictory market conditions can create an attractive trading environment. If you are looking to trade MSFT via CFDs without owning the underlying shares, you may consider opening an account with FXOpen.
FAQ
What Is the Microsoft Stock Price Prediction for 2026?
The 12-month analyst consensus averages roughly $582 across 34 analysts tracked by StockAnalysis, with targets ranging from $392 to $675. The wide spread in MSFT forecasts for 2026 reflects disagreement over whether AI capex translates into margin expansion or continued free cash flow pressure. The base case assumes steady Azure growth and gradual Copilot adoption at current valuation levels.
What Could Drive Microsoft Stock Higher by 2030?
Sustained Azure growth above 25%, Copilot penetration climbing from below 4% towards double digits, and a dovish shift in Fed policy could each support bullish Microsoft stock price prediction for 2030. If AI workloads scale with near-100% incremental margins and the forward multiple expands back toward 28–30x, the upside case strengthens significantly over a four-year horizon.
Will Microsoft Stock Reach $1000 by 2030?
It would require a market capitalisation of roughly $7.4 trillion. That implies EPS compounding at 15–18% annually to reach $28–33 by FY2030, combined with a 30–35x multiple. Such a bullish analytical Microsoft stock price prediction for 2030 is demanding but it can’t be ruled out if AI monetisation scales and cloud growth holds above 20%. Sustained margin expansion and continued buybacks would also need to contribute.
How Much Could Microsoft Stock Be Worth in 10 Years?
No reliable methodology exists for making 10-year Microsoft share price forecasts. Over the past decade, Microsoft has delivered strong profit growth of roughly 20–23% per year, and even if that pace slows significantly, earnings could still expand meaningfully over time. However, long-term outcomes depend on multiple uncertain factors, including valuation levels, interest rates, and competitive dynamics. As a result, any precise long-term price target should be treated as highly speculative rather than predictive.
How High Is MSFT Stock Expected to Go?
The highest published 12-month Microsoft stock outlook target is $675, from Jefferies. Beyond that, long-term scenario analyses from various sources place bull-case estimates in the $950–$1,150 range by 2030, assuming strong AI monetisation and moderate multiple expansion. Bear-case estimates cluster around $400–$500 if capex pressures persist and growth slows.
This article represents the opinion of the Companies operating under the FXOpen brand only. It is not to be construed as an offer, solicitation, or recommendation with respect to products and services provided by the Companies operating under the FXOpen brand, nor is it to be considered financial advice.
Binance co-founder Changpeng ‘CZ’ Zhao said he hopes that cryptocurrencies and blockchain will simply become an invisible part of daily infrastructure by 2031, much like the internet today.
Speaking on Scott Melker’s Wolf of All Streets podcast posted Thursday, Zhao said that while new use cases and advances will continue to emerge, he hopes talk of the technology will subside as it becomes part of everyday life.
“I’m hoping that we don’t talk about crypto as crypto in five years, just like we don’t talk about the internet anymore, we don’t talk about TCP/IP, we don’t talk about HTML, JavaScript, etc. We don’t talk about that stuff anymore. We just use it.”
“I think in five years, I’m hoping we’ll just use crypto,” he added. “There will be other use cases for the blockchain, for data storage, so there will be other cases, but I’m hoping in five years, we stopped talking about the technology, we are just using it and it will be used everywhere.”
Freedom of Money with CZ (AMA) https://t.co/ig5azu5ZcU
— The Wolf Of All Streets (@scottmelker) April 9, 2026
The optimistic vision for crypto in 2030
Global crypto adoption is steadily increasing. An estimated 559 million people worldwide use crypto in 2026, according to data and analytics firm DemandSage.
Industry insiders predicted last September that the sector may be just one market cycle away from full-scale mainstream adoption.
CZ isn’t alone in his lofty hopes for the future.
Cathie Wood’s ARK Invest predicted in a January report that by 2030, digital assets could grow into a $28 trillion market, while Tether co-founder Reeve Collins said last October he expects all currencies to become stablecoins in the same timeframe.
Meanwhile, blockchain analysis firm Chainalysis recently estimated that stablecoin volumes could hit $1.5 quadrillion by 2035, and a Citi survey of banks and asset managers last September found that most expect a tenth of the global post-trade market turnover to be handled through stablecoins and tokenized securities in less than five years.
AI could speed up blockchain development
Zhao added that blockchain technology could also get a boost in adoption and development thanks to AI.
“The speed of development, the speed of writing code is going to increase quite dramatically, and AI agents are going to use crypto a lot,” Zhao said, adding that “I’m hoping that blockchain, and I also kind of know blockchain will get there.”
In March, Zhao argued that AI agent developers should prioritize their intrinsic utility, not the launch of in-house native tokens to raise funds.
Countries that avoid AI and blockchain will fall behind
At the same time, Zhao said that countries that avoid blockchain technology and AI will be at a huge disadvantage in the future.
Related: CZ memoir revives feud with OKX founder Star Xu over contract forgery, Huobi arrest
“I think there’s really three big industries in my adult lifetime: the internet, blockchain and AI. Any country that misses one of them is going to be severely disadvantaged,” he added.
Customer onboarding platform Signzy ranked Switzerland as the most crypto-friendly country in its January blog. While Arkham flagged the country as one of the top innovating jurisdictions globally.
A January AI report from Microsoft, meanwhile, named the US as the leader in AI infrastructure and frontier model development, though it noted the country lags behind smaller, highly digitized economies like the United Arab Emirates in actual usage.

Magazine: Should users be allowed to bet on war and death in prediction markets?

Quick Overview
- Acquirers are reportedly interested in Gemini’s closed European and U.K. entities for their regulatory licenses
- Interest appears focused on specific business segments rather than a complete acquisition
- GEMI shares climbed approximately 9% following the CoinDesk coverage, finishing near $4.87
- Shares have plummeted more than 80% since the company’s $28 September 2025 IPO price
- The company’s COO, CFO, and CLO all exited in February, effective immediately
Shares of Gemini Space Station (GEMI) rallied nearly 9% on Thursday following a CoinDesk report indicating that potential acquirers are evaluating pieces of the Winklevoss brothers’ cryptocurrency exchange.
Gemini Space Station, Inc. Class A Common Stock, GEMI
The equity climbed from approximately $4.48 to finish the session around $4.87, touching an intraday peak of $5.18. Trading volume reached 5.5 million shares, significantly exceeding the typical 1.8 million average.
According to the report, this isn’t about a complete company acquisition. Sources familiar with the matter indicated to CoinDesk that interested parties are zeroing in on Gemini’s shuttered European and United Kingdom operations — particularly the regulatory permissions associated with those entities.
Last February, Gemini revealed plans to reduce its worldwide headcount by 25% while discontinuing services in the United Kingdom, European Union, and Australia. Management indicated the company would concentrate exclusively on its United States and Singapore markets moving forward.
These international operations possessed considerable regulatory worth. Within Europe, Gemini maintained a Markets in Crypto-Assets (MiCA) authorization, enabling the platform to service clients throughout the entire EU marketplace. In Britain, the exchange held registration with the Financial Conduct Authority (FCA) as an electronic money institution.
Obtaining such regulatory clearances independently can require multiple years. This shortcut represents the primary attraction for prospective purchasers.
Valuable Regulatory Credentials Attract Bidders
Under MiCA regulations, crypto authorizations don’t simply transfer during acquisitions. Regulatory bodies classify such transactions as a “change of control” and conduct fresh evaluations of incoming ownership — essentially treating them similarly to new applications. The FCA employs comparable procedures.
While the licenses themselves don’t transfer automatically, purchasing the already-registered corporate entity provides buyers with a substantial advantage versus starting the application process from the beginning.
Gemini has not issued any official statement regarding the CoinDesk coverage.
The February workforce reduction occurred simultaneously with the exit of three C-suite executives. COO Marshall Beard, CFO Dan Chen, and CLO Tyler Meade all departed immediately, according to regulatory filings. Beard additionally resigned from his board position. Management stated his departure wasn’t connected to any conflicts regarding company operations or strategic direction.
Steep Decline Following Public Debut
GEMI began trading publicly in September 2025 with an IPO price of $28 per share. On opening day, it surged above $37 and settled around $32, representing intraday appreciation exceeding 30%.
That initial enthusiasm proved short-lived. Shares have subsequently collapsed more than 80% from the debut price and were hovering near $4.36 prior to Thursday’s rally.
Short interest currently represents 15% of available shares, based on FactSet information.
The firm’s market capitalization presently stands at approximately $584 million. Its 52-week trading range extends from $3.91 to $45.89.
Gemini provides a comprehensive suite of services beyond basic trading capabilities. The platform offers institutional-grade custody solutions, staking services, yield-generating products, payment processing infrastructure, and a cryptocurrency rewards credit card.
Thursday’s price increase followed the publication of the CoinDesk article. Shares concluded trading up roughly 9%, although they continue trading substantially below the level where the company went public just seven months earlier.

Key Takeaways
- With approximately 150 billion tokens in circulation, Dogecoin maintains a market capitalization around $14.2 billion, securing its position among the top cryptocurrencies
- The network operates as a functional payment system, notably accepted by Tesla for specific merchandise transactions
- Daily network activity shows approximately 22,344 transactions processed over the past 24 hours, with minimal fees averaging just $0.038
- Unlike Bitcoin, DOGE features unlimited issuance, generating approximately 5 billion new tokens annually, resulting in perpetual inflation
- Concentration remains significant, with the top 100 addresses holding roughly 66.39% of total supply, presenting potential volatility concerns
What began as a satirical cryptocurrency project in 2013 has evolved into one of the most enduring digital assets in existence. More than ten years after launch, Dogecoin continues commanding attention, with CoinGecko data showing it maintains a position among the largest cryptocurrencies by valuation. Current figures indicate approximately 150 billion DOGE tokens exist, supporting a market capitalization near $14.2 billion.
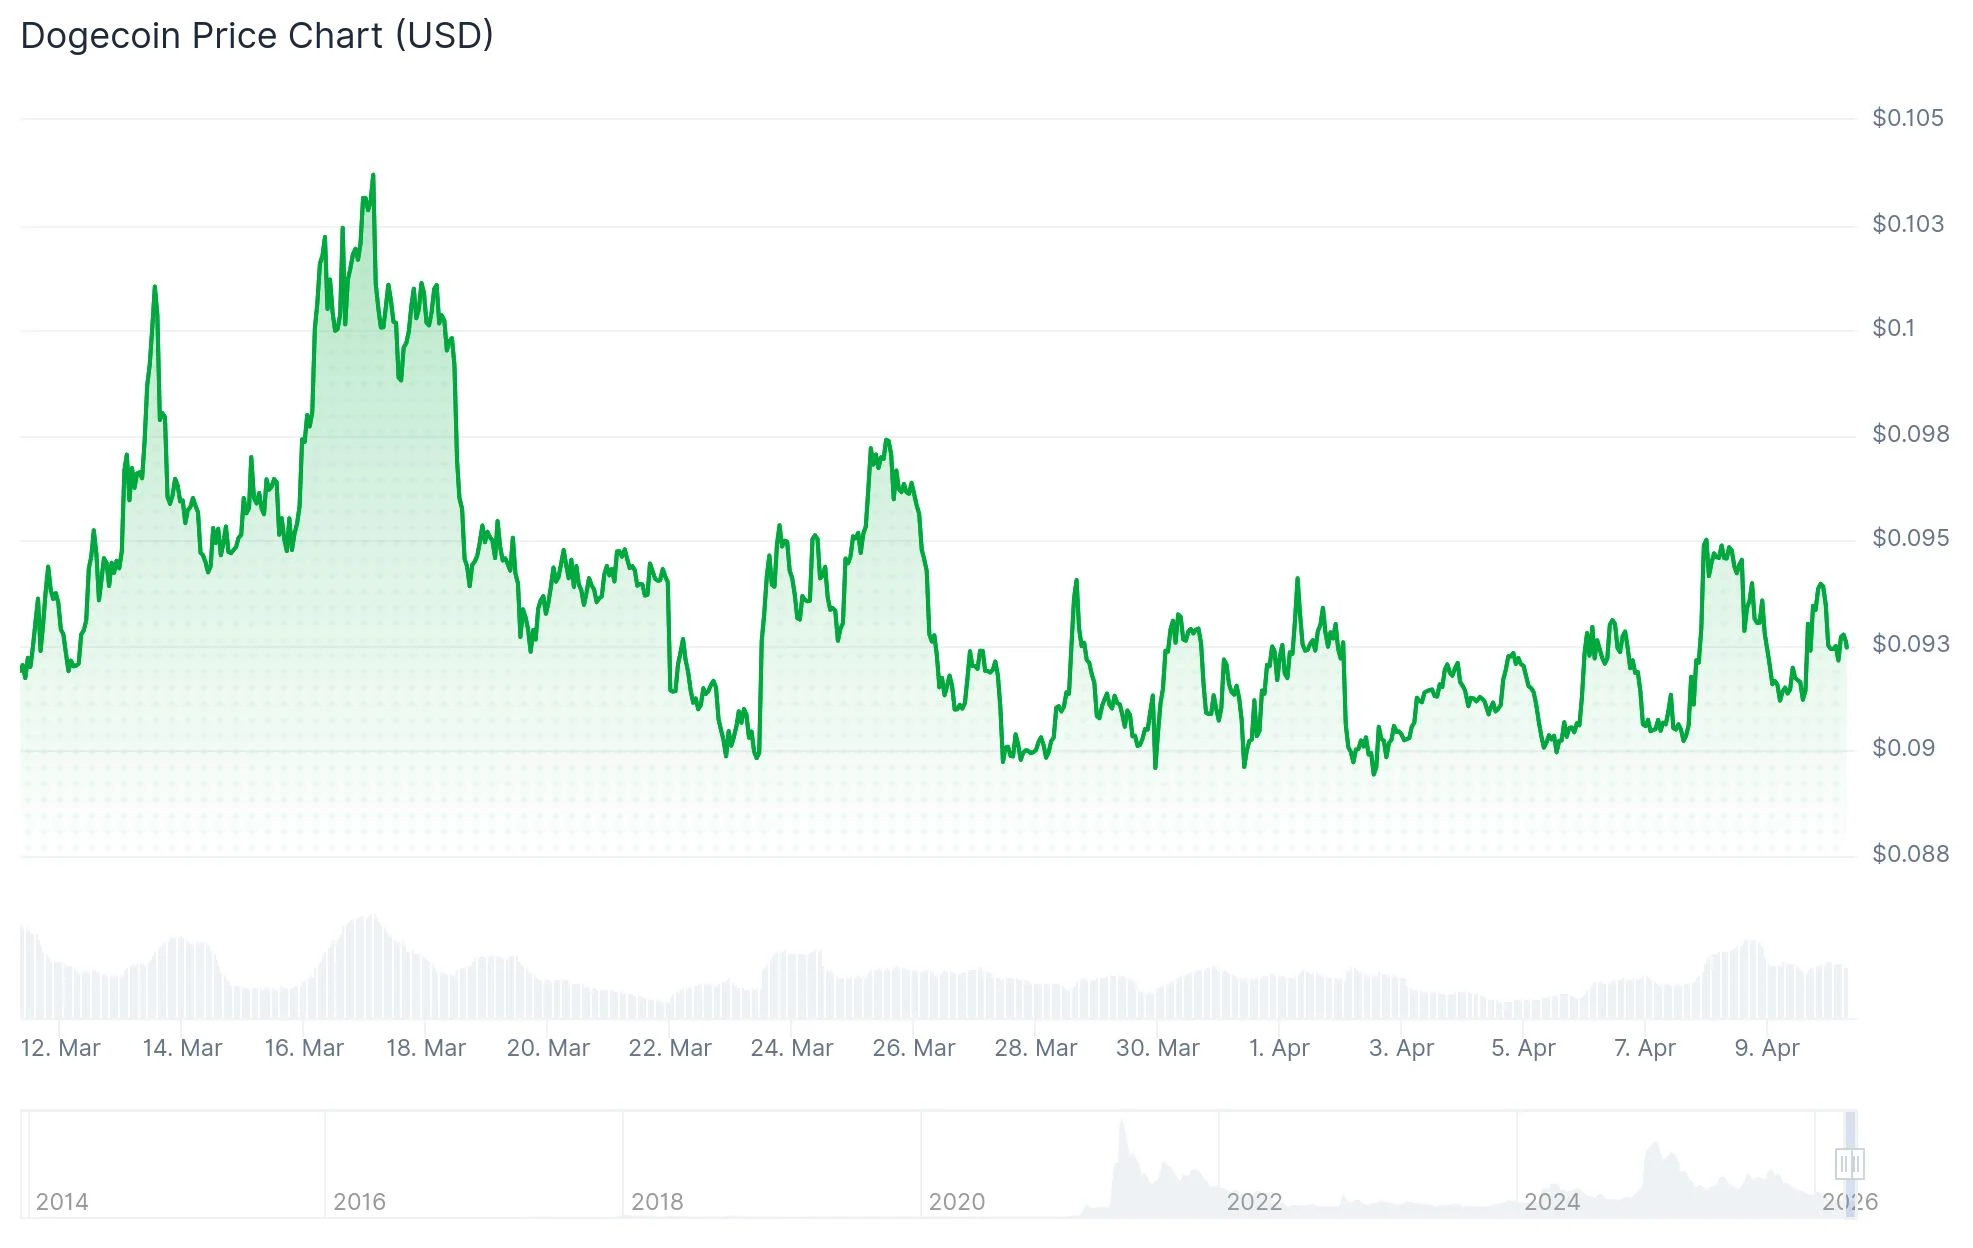
Within cryptocurrency markets, name recognition frequently converts to trading volume and market depth. This liquidity provides sustainability that extends asset lifespans beyond initial expectations.
Technically, Dogecoin operates on a Scrypt-based proof-of-work consensus mechanism. Rather than positioning itself as a smart contract platform, the project emphasizes its role as a straightforward digital payment solution. Development priorities outlined by the Dogecoin Foundation include initiatives like GigaWallet, designed to streamline merchant integration for DOGE acceptance.
Tesla’s official payment documentation continues recognizing Dogecoin as valid payment for select items. This represents tangible commercial adoption that distinguishes it from the vast majority of meme-based tokens.
Transaction Metrics and Network Performance
Blockchain data from BitInfoCharts reveals the network handled approximately 22,344 transactions during the preceding 24-hour period. Average transaction costs register at about $0.038, while median fees hover around $0.007. Active addresses during this timeframe exceeded 34,000.
These figures demonstrate the network maintains affordability and accessibility. For a cryptocurrency focused on payment functionality, these characteristics provide meaningful utility.
Yet transaction volume alone doesn’t guarantee value appreciation. Dogecoin lacks the extensive decentralized application ecosystem that generates fee revenue for platforms like Ethereum. The majority of DOGE holders participate primarily for brand familiarity or speculative positioning.
Tokenomics and Supply Concerns
Unlike cryptocurrencies with finite issuance schedules, Dogecoin implements unlimited token generation. The protocol releases 10,000 DOGE per block, with new blocks appearing approximately every minute. Annual calculations show roughly 5 billion new tokens entering the ecosystem.
While this mechanism incentivizes miners and maintains network security, it simultaneously creates continuous dilution for existing holders. For DOGE to appreciate, incoming demand must perpetually exceed the expanding supply.
Though the inflation rate decreases proportionally as total supply increases, it represents a fundamental obstacle for sustained price growth.
Ownership distribution introduces additional considerations. BitInfoCharts data indicates the top 100 addresses command approximately 66.39% of all circulating DOGE, with the largest 10 wallets controlling around 44.44%. Major exchanges and large holders maintain substantial influence over market dynamics.
Bottom Line
Dogecoin offers high liquidity, universal brand awareness, minimal transaction costs, and has weathered numerous market downturns. These attributes distinguish it from typical meme tokens. However, its investment thesis relies predominantly on sustained cultural relevance and speculative interest rather than fundamental economic mechanisms. Investing in DOGE essentially represents a wager that its brand recognition maintains market value over extended timeframes.

Key Takeaways
- Bank of America data reveals Kalshi controls 89% of U.S. prediction market trading volume
- Overall prediction market activity increased 4% weekly, though Polymarket experienced a 16% decline
- Federal agencies filed lawsuits against Arizona, Connecticut, and Illinois on April 2, 2026 regarding state-level gambling regulation
- A federal appeals court sided with Kalshi in New Jersey on April 6, 2026
- The resolution of these federal-state disputes will shape the industry’s regulatory landscape
The U.S. prediction market sector continues expanding, yet a jurisdictional conflict between federal authorities and state governments is reshaping regulatory control over the industry.
Recent Bank of America analysis indicates aggregate weekly trading activity climbed 4% compared to the previous week. Kalshi experienced 6% growth during this timeframe. Polymarket recorded a 16% decrease in trading volume during the identical period.
Kalshi currently commands approximately 89% of tracked U.S. prediction market activity. Polymarket accounts for 7% while Crypto.com represents 4%, based on Bank of America’s calculations.
The disparity between platforms stems from their regulatory approaches. Kalshi maintains registration with the Commodity Futures Trading Commission (CFTC) and positions its offerings as federally supervised derivatives. Polymarket operates through blockchain technology and has traditionally functioned beyond U.S. regulatory frameworks.
State governments have mounted resistance. Nevada and Massachusetts secured preliminary injunctions targeting Kalshi. Arizona escalated matters in March 2026 by pursuing criminal charges against the platform — marking the first criminal prosecution ever directed at a CFTC-registered entity.
Federal Agencies Launch Legal Action Against Three States
On April 2, 2026, the CFTC and Department of Justice initiated three distinct federal lawsuits targeting Arizona, Connecticut, and Illinois. The legal actions directly name state governors and regulatory officials.
The CFTC characterized this action as “unprecedented” and justified it as essential for defending its exclusive authority over event contracts under the Commodity Exchange Act.
Connecticut distributed cease-and-desist notices regarding sports-focused contracts. Illinois followed with similar enforcement actions. Arizona advanced to criminal prosecution.
CFTC Chairman Michael Selig stated: “The CFTC will continue to safeguard its exclusive regulatory authority over these markets and defend market participants against overzealous state regulators.”
State authorities remain defiant. Connecticut Attorney General William Tong characterized the contracts as “plainly unlicensed illegal gambling.” An Illinois representative argued these firms expose citizens to products lacking “basic consumer protections.”
Federal Appeals Court Rules for Kalshi
On April 6, 2026, the U.S. Court of Appeals for the Third Circuit issued a 2-1 decision favoring Kalshi. The ruling prevented New Jersey gaming authorities from enforcing state gambling regulations on Kalshi’s operations.
The court determined that Kalshi’s event contracts qualify as “swaps” under the Commodity Exchange Act, establishing the CFTC’s exclusive regulatory authority. This represents the first federal appellate decision addressing this jurisdictional question.
Kalshi CEO Tarek Mansour described it as “a big win for the industry.”
Should federal regulators succeed in pending litigation, platforms such as Kalshi could function under unified national regulations. Conversely, defeats could fragment the industry into a state-specific regulatory structure resembling online sports wagering.
Binance revealed on April 10, 2026 that it integrated a prediction markets capability into Binance Wallet, demonstrating sustained engagement from prominent cryptocurrency platforms in this sector.
The CFTC maintains an active public feedback window through the end of April concerning an Advanced Notice of Proposed Rulemaking for prediction markets.
The March Consumer Price Index (CPI) data, a measure of the cost of goods and services, lands today with a hot print expected amid Iran war-driven energy costs. A fragile ceasefire has offered reprieve, but uncertainty lingers. Crypto whales are already positioning.
BeInCrypto analysts tracking on-chain whale activity have identified three tokens showing sharp accumulation or selling ahead of the release.
Ethereum (ETH)
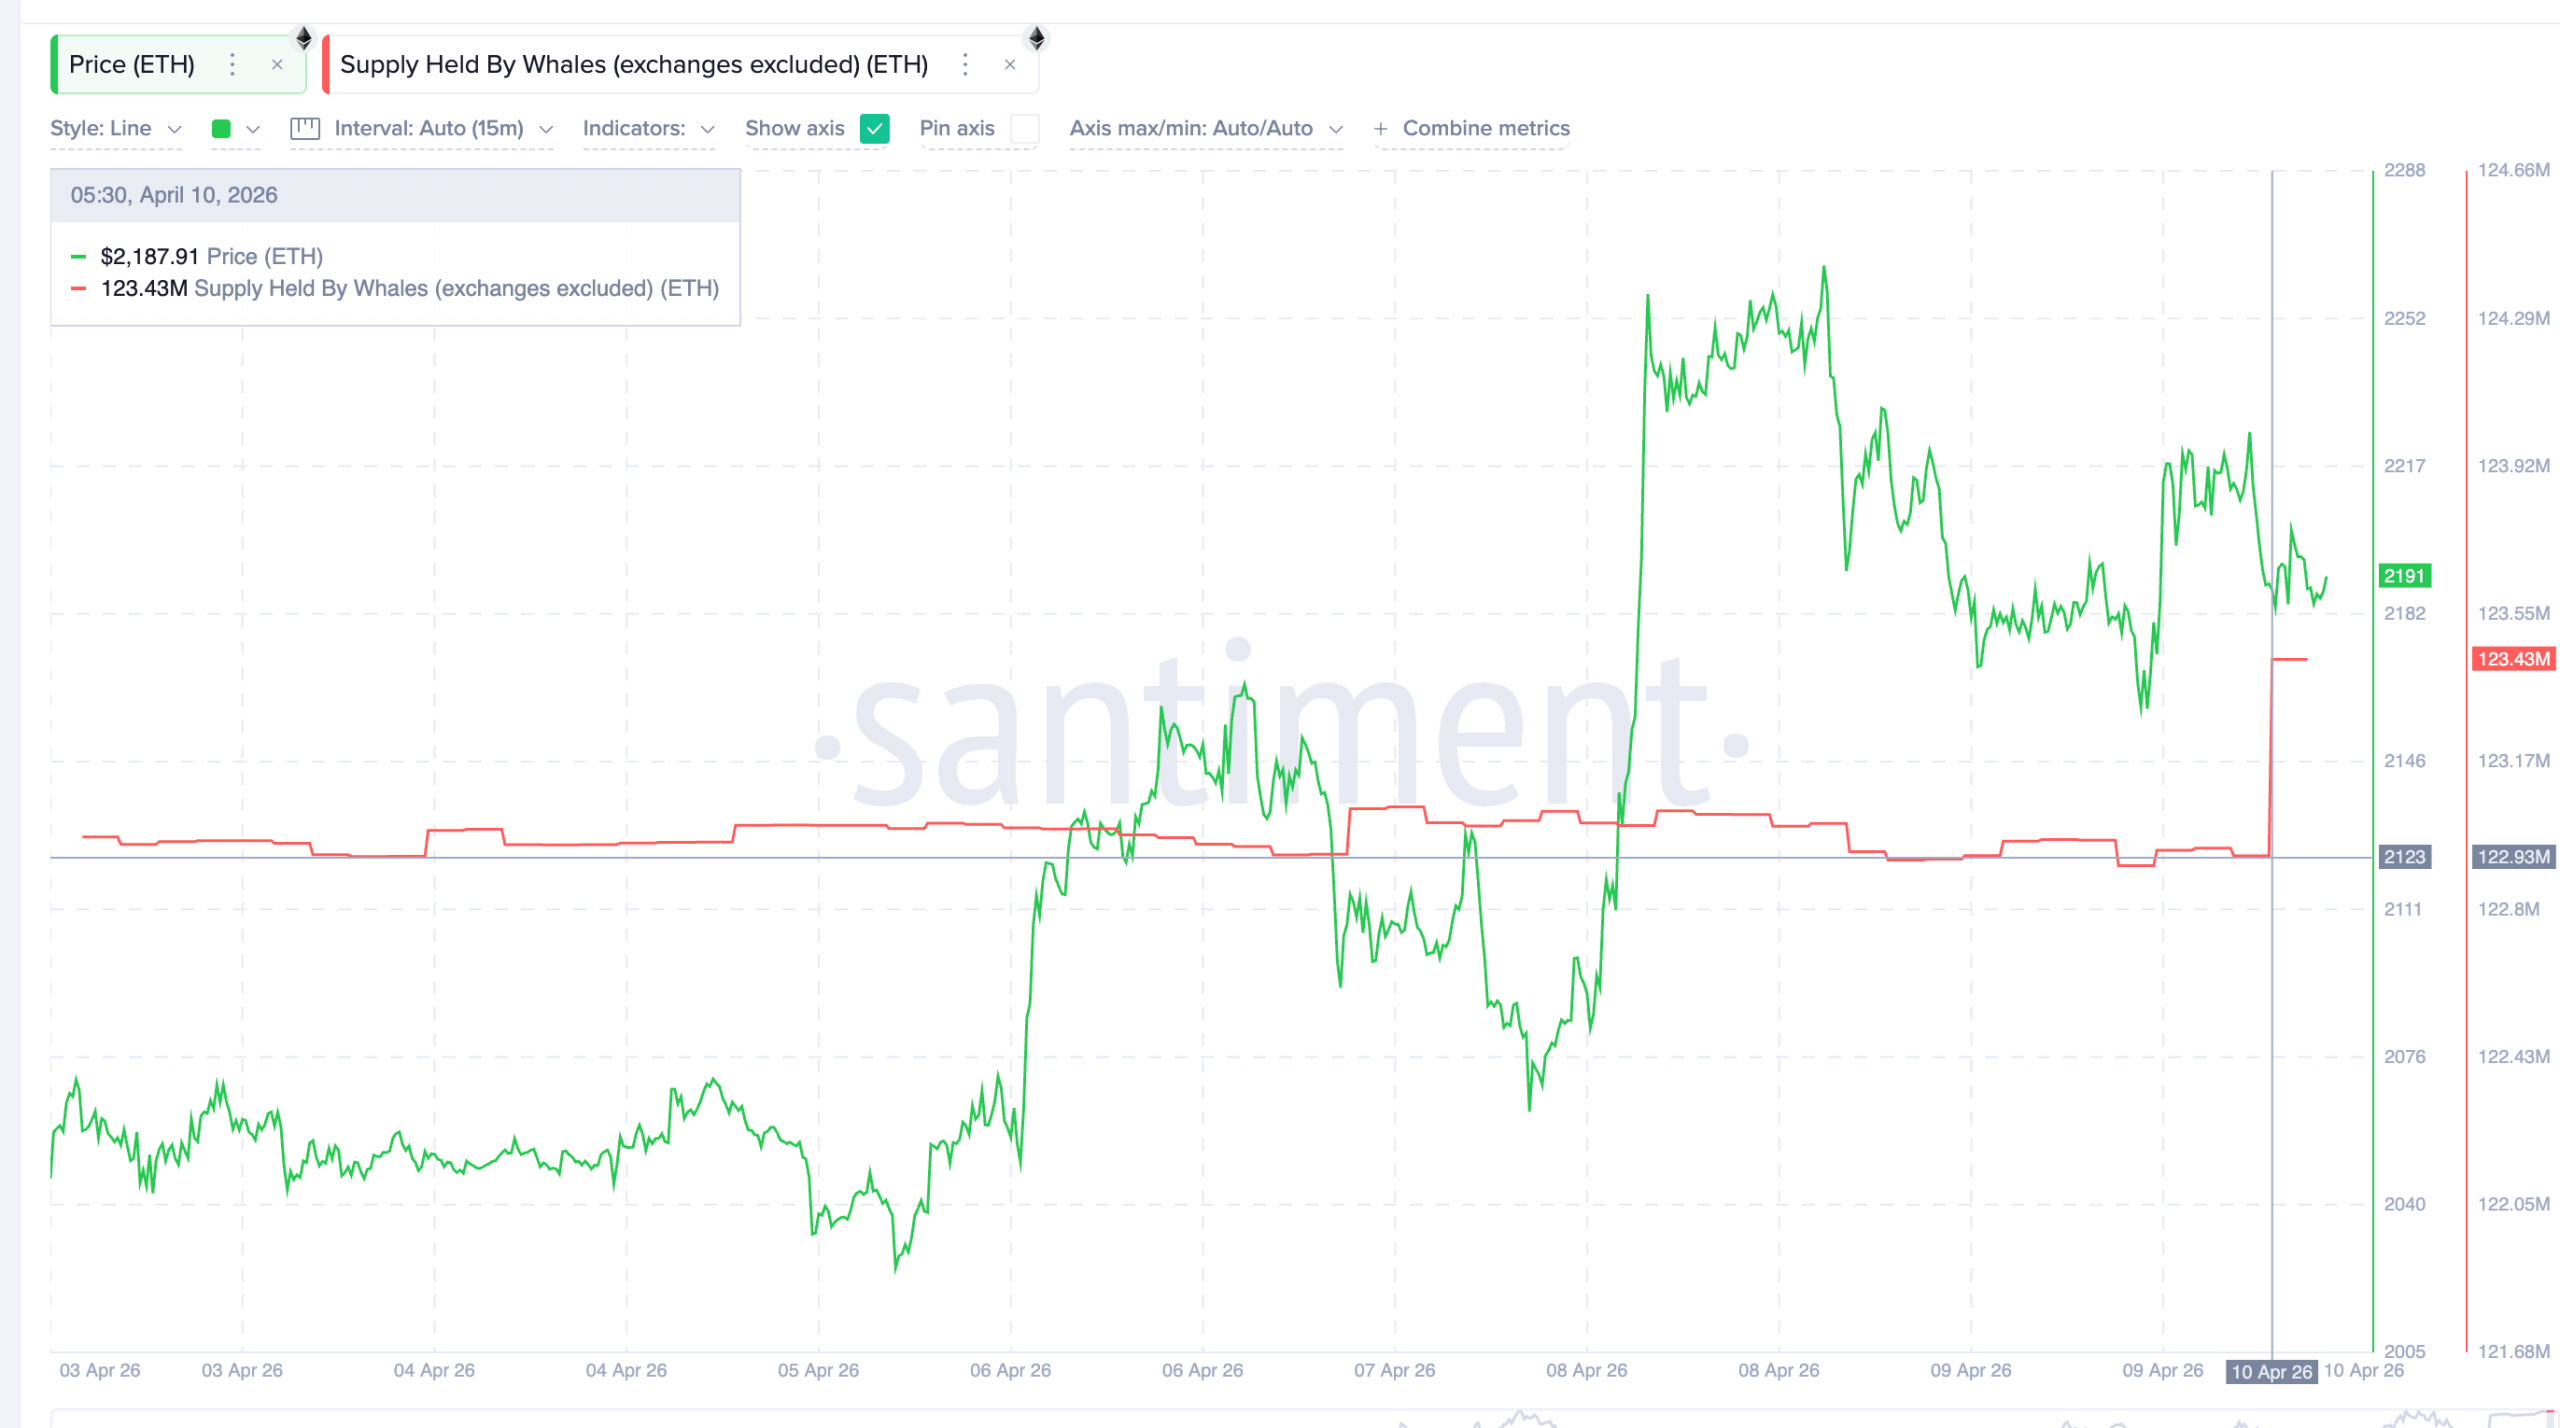
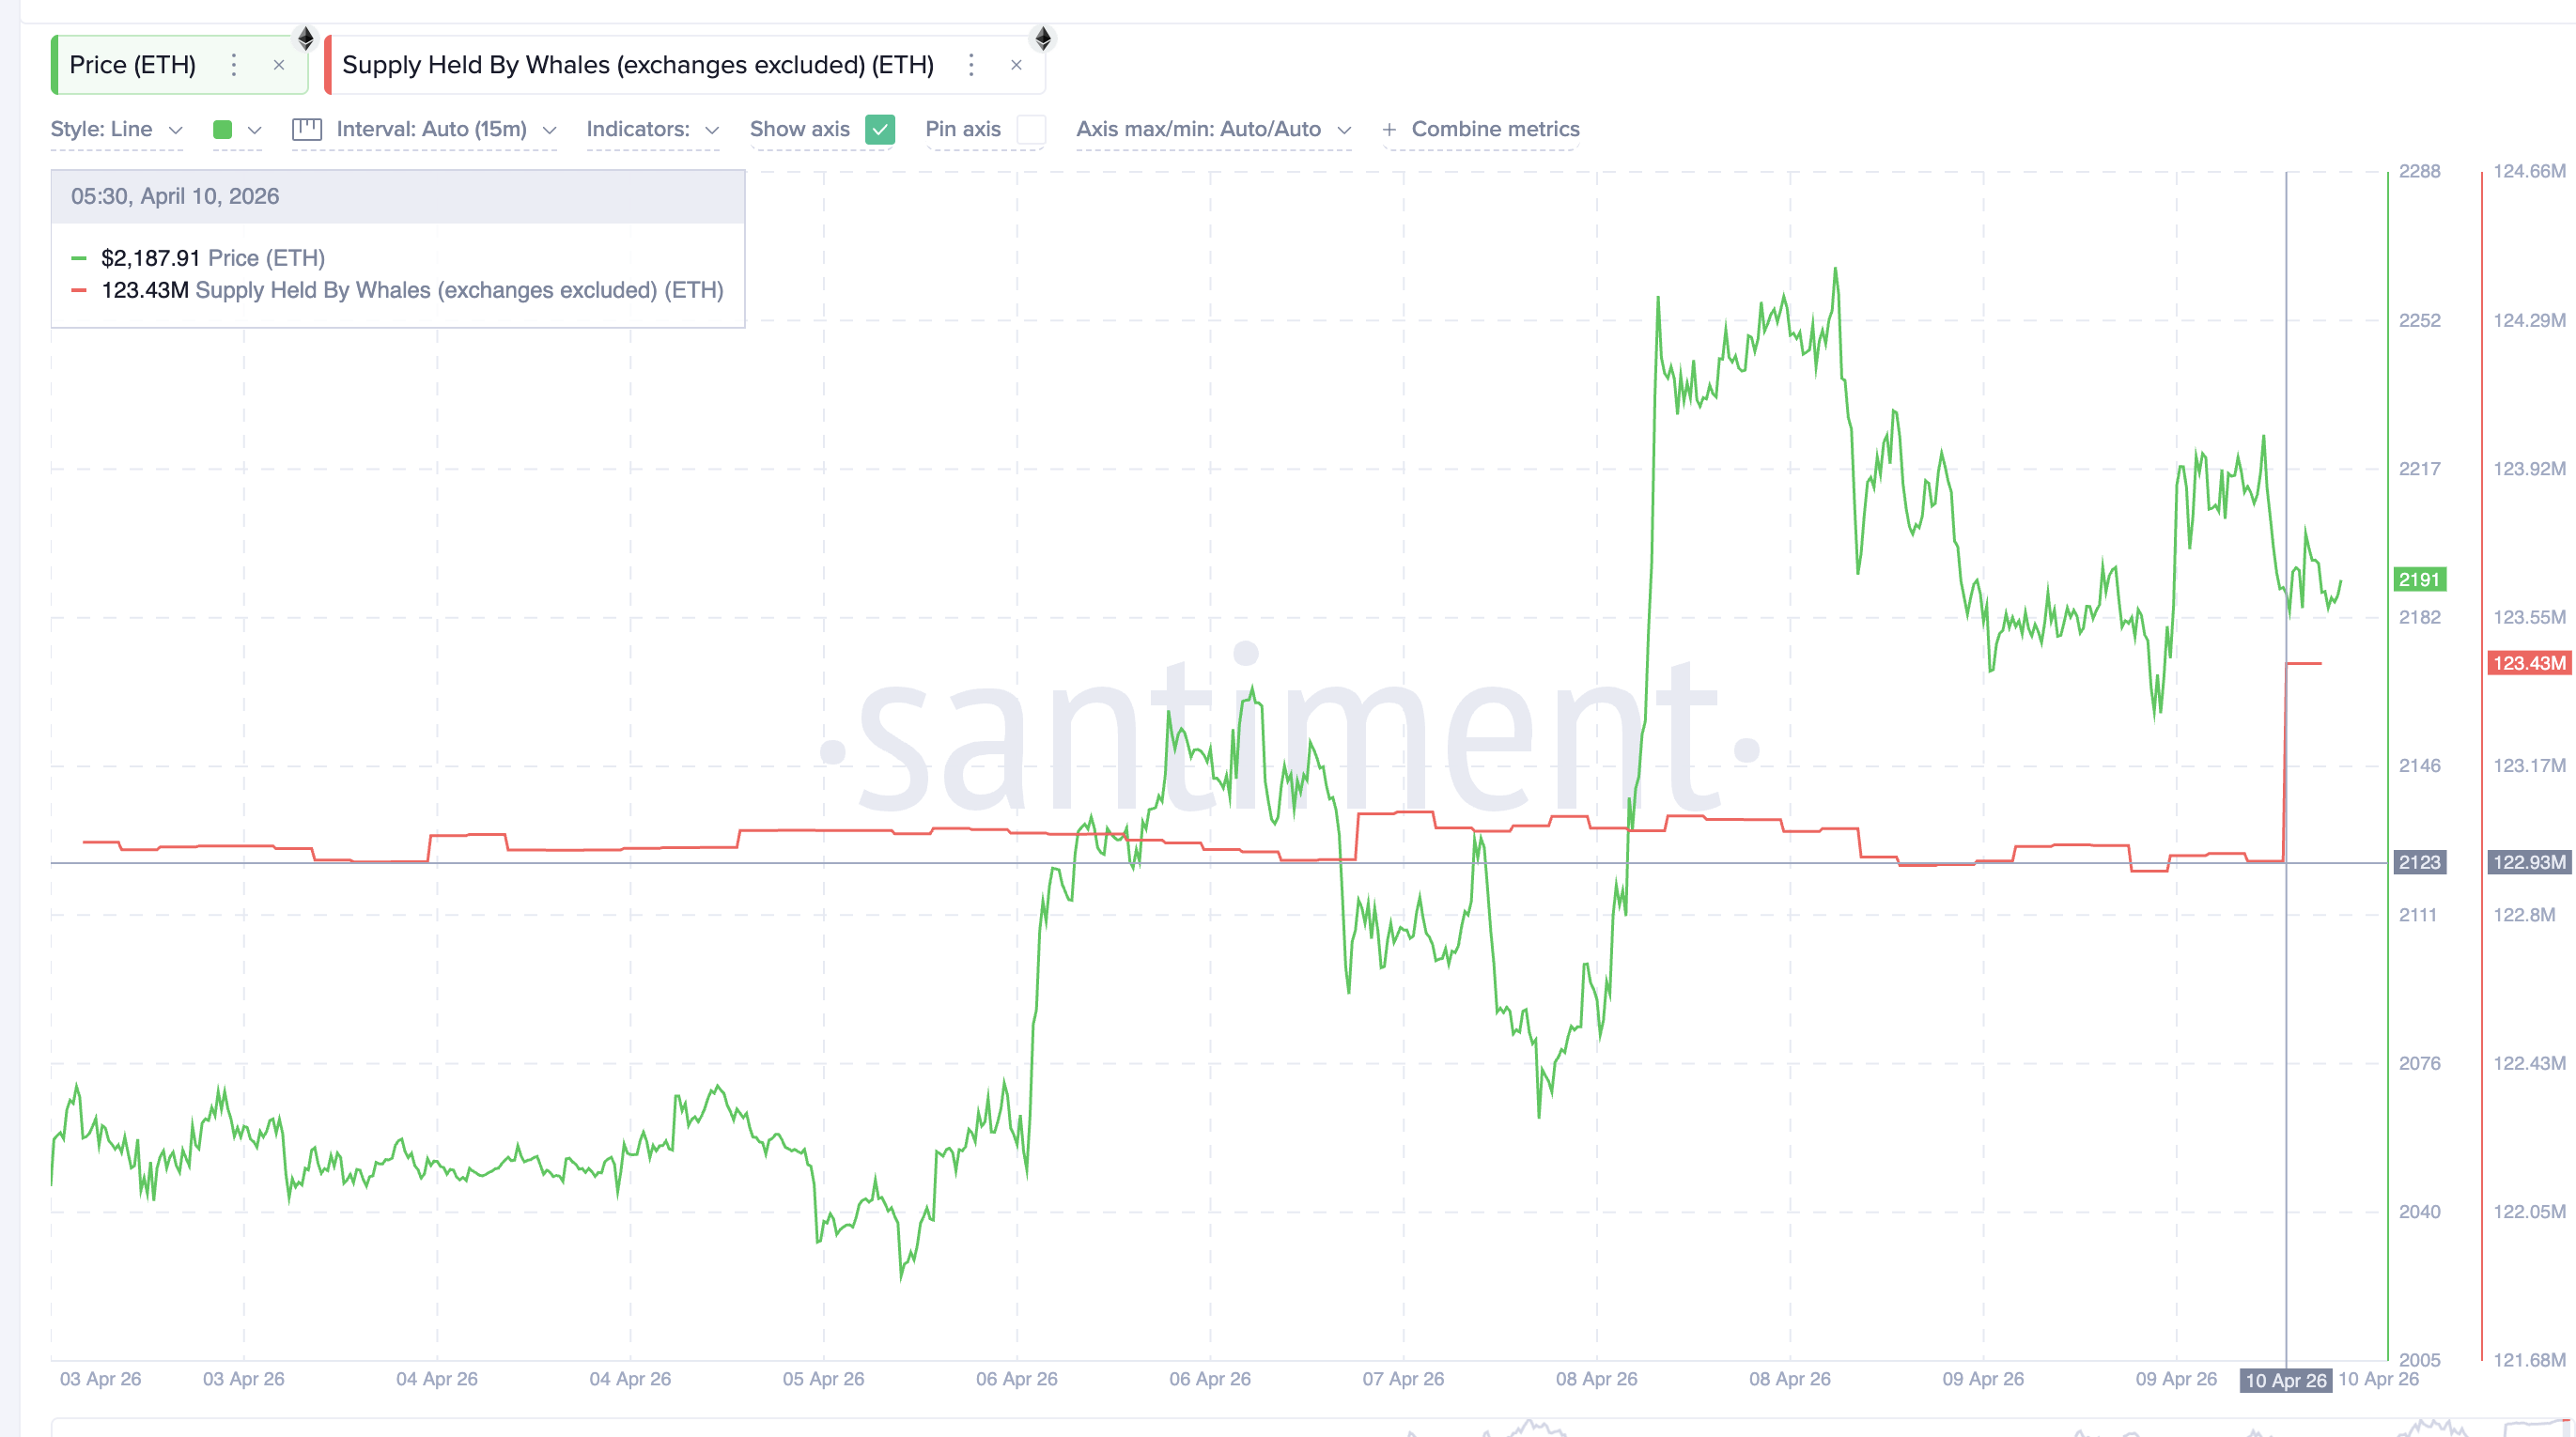
Among the tokens seeing heavy whale accumulation ahead of the April CPI print, Ethereum (ETH) stands out. Its positioning dwarfs all others.
Santiment data shows ETH crypto whale wallets surged from 122.93 million to 123.43 million tokens in hours. That 500,000 ETH increase translates to roughly $1.09 billion in fresh buying.
Want more token insights like this? Sign up for Editor Harsh Notariya’s Daily Crypto Newsletter here.
Headline CPI is expected to spike due to a 10.6% month-over-month jump in energy costs. However, core CPI inflation data is forecast at a softer 0.3% month over month. Large holders appear to be betting on that softer undertone sparking a relief rally.
Meanwhile, the Ethereum Foundation recently staked roughly 45,000 ETH to generate yield rather than sell. That structural shift reduces ongoing sell-side pressure from a major network entity and reinforces the bullish thesis.
On the daily chart, ETH is forming a cup-and-handle pattern inside a descending channel. The cup bottomed near $1,938 before curving higher. The handle’s upper boundary aligns with the channel neckline near $2,270. A single breakout could therefore confirm both structures simultaneously. A daily close above $2,231 would signal early strength.
A move through $2,270 followed by a clean reclaim of $2,300 would validate the pattern. That level aligns with the 0.618 Fibonacci level and would confirm renewed momentum.
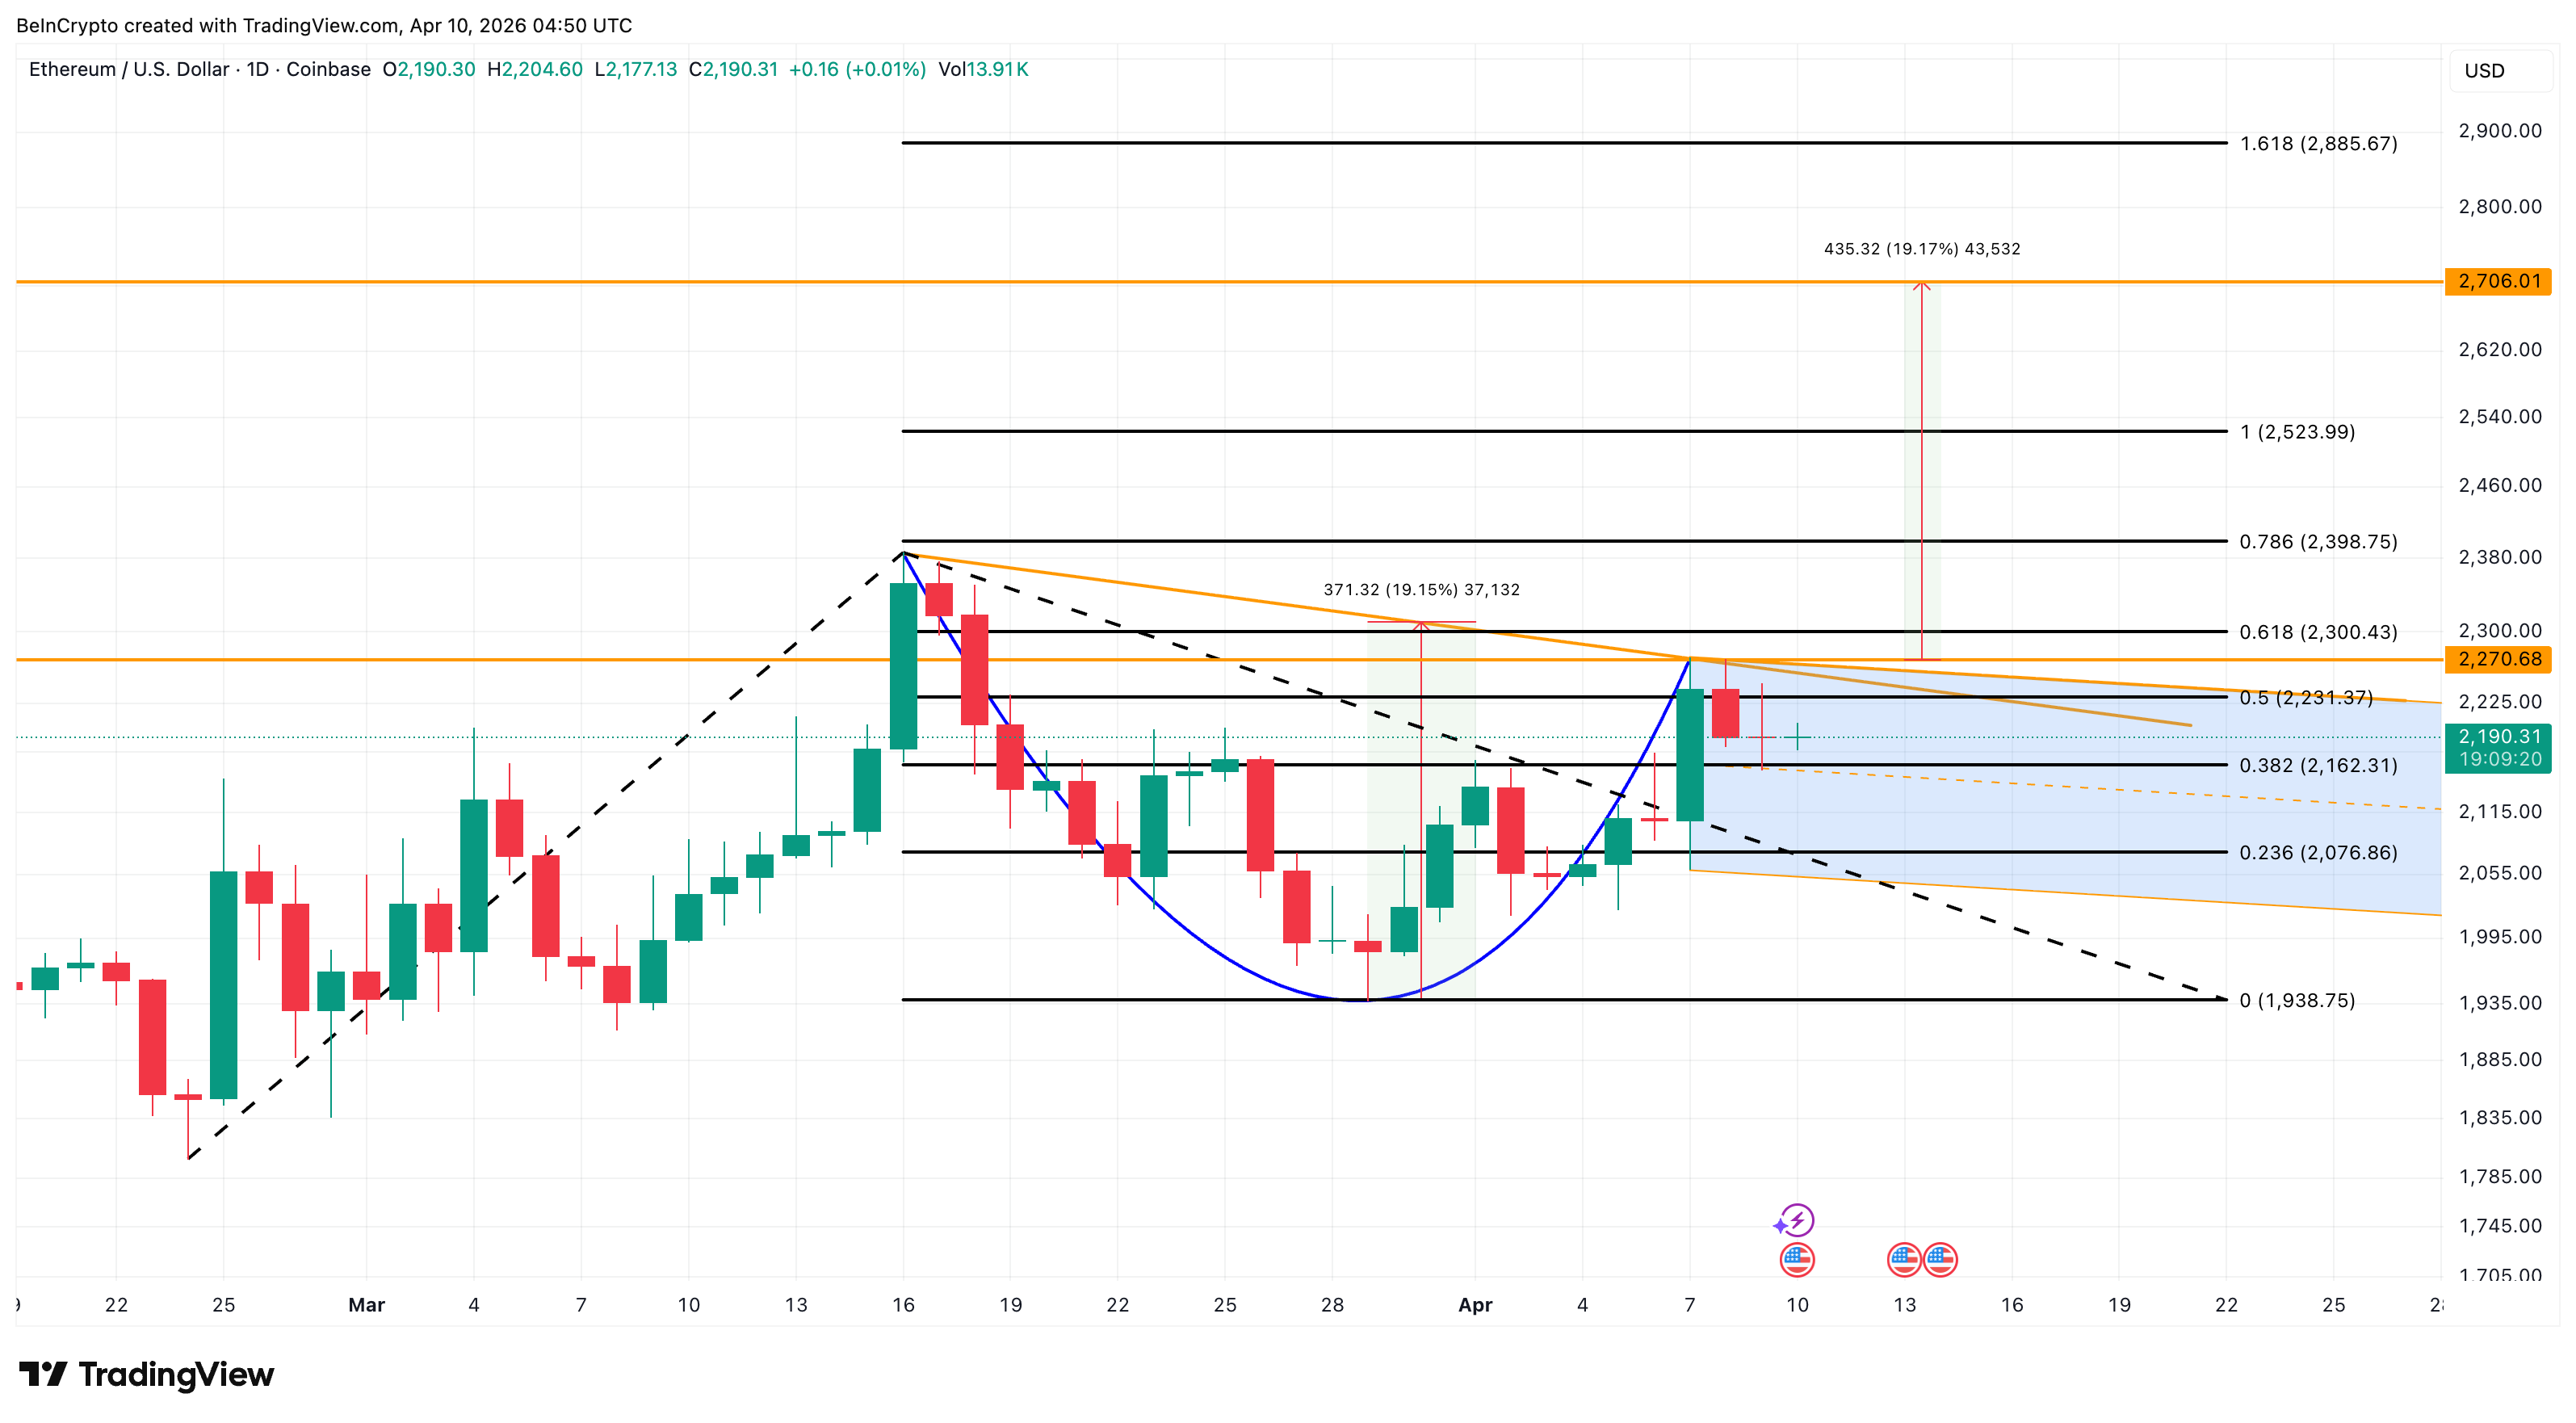
The projected upside sits near 19.15%, which could push ETH toward $2,706. However, a drop below $2,162 would weaken the setup. The pattern gets fully invalidated with a close under $1,938.
Uniswap (UNI)
While some crypto whales are loading up ahead of the CPI print, others are trimming DeFi exposure. In contrast to Ethereum’s $1.09 billion inflow, Uniswap (UNI) has seen consistent whale selling pressure over the past seven days.
Nansen data shows UNI whale wallets cut holdings by 2.48% over the past week. The stash now sits at 3.57 million tokens. That amounts to roughly 90,000 UNI sold, worth approximately $283,000 at the current price near $3.14. The selling aligns with broader DeFi profit taking as the sector trades mostly flat in the 7-day timeframe. Large holders appear to be de-risking ahead of a volatile CPI print rather than reacting to any UNI-specific catalyst.
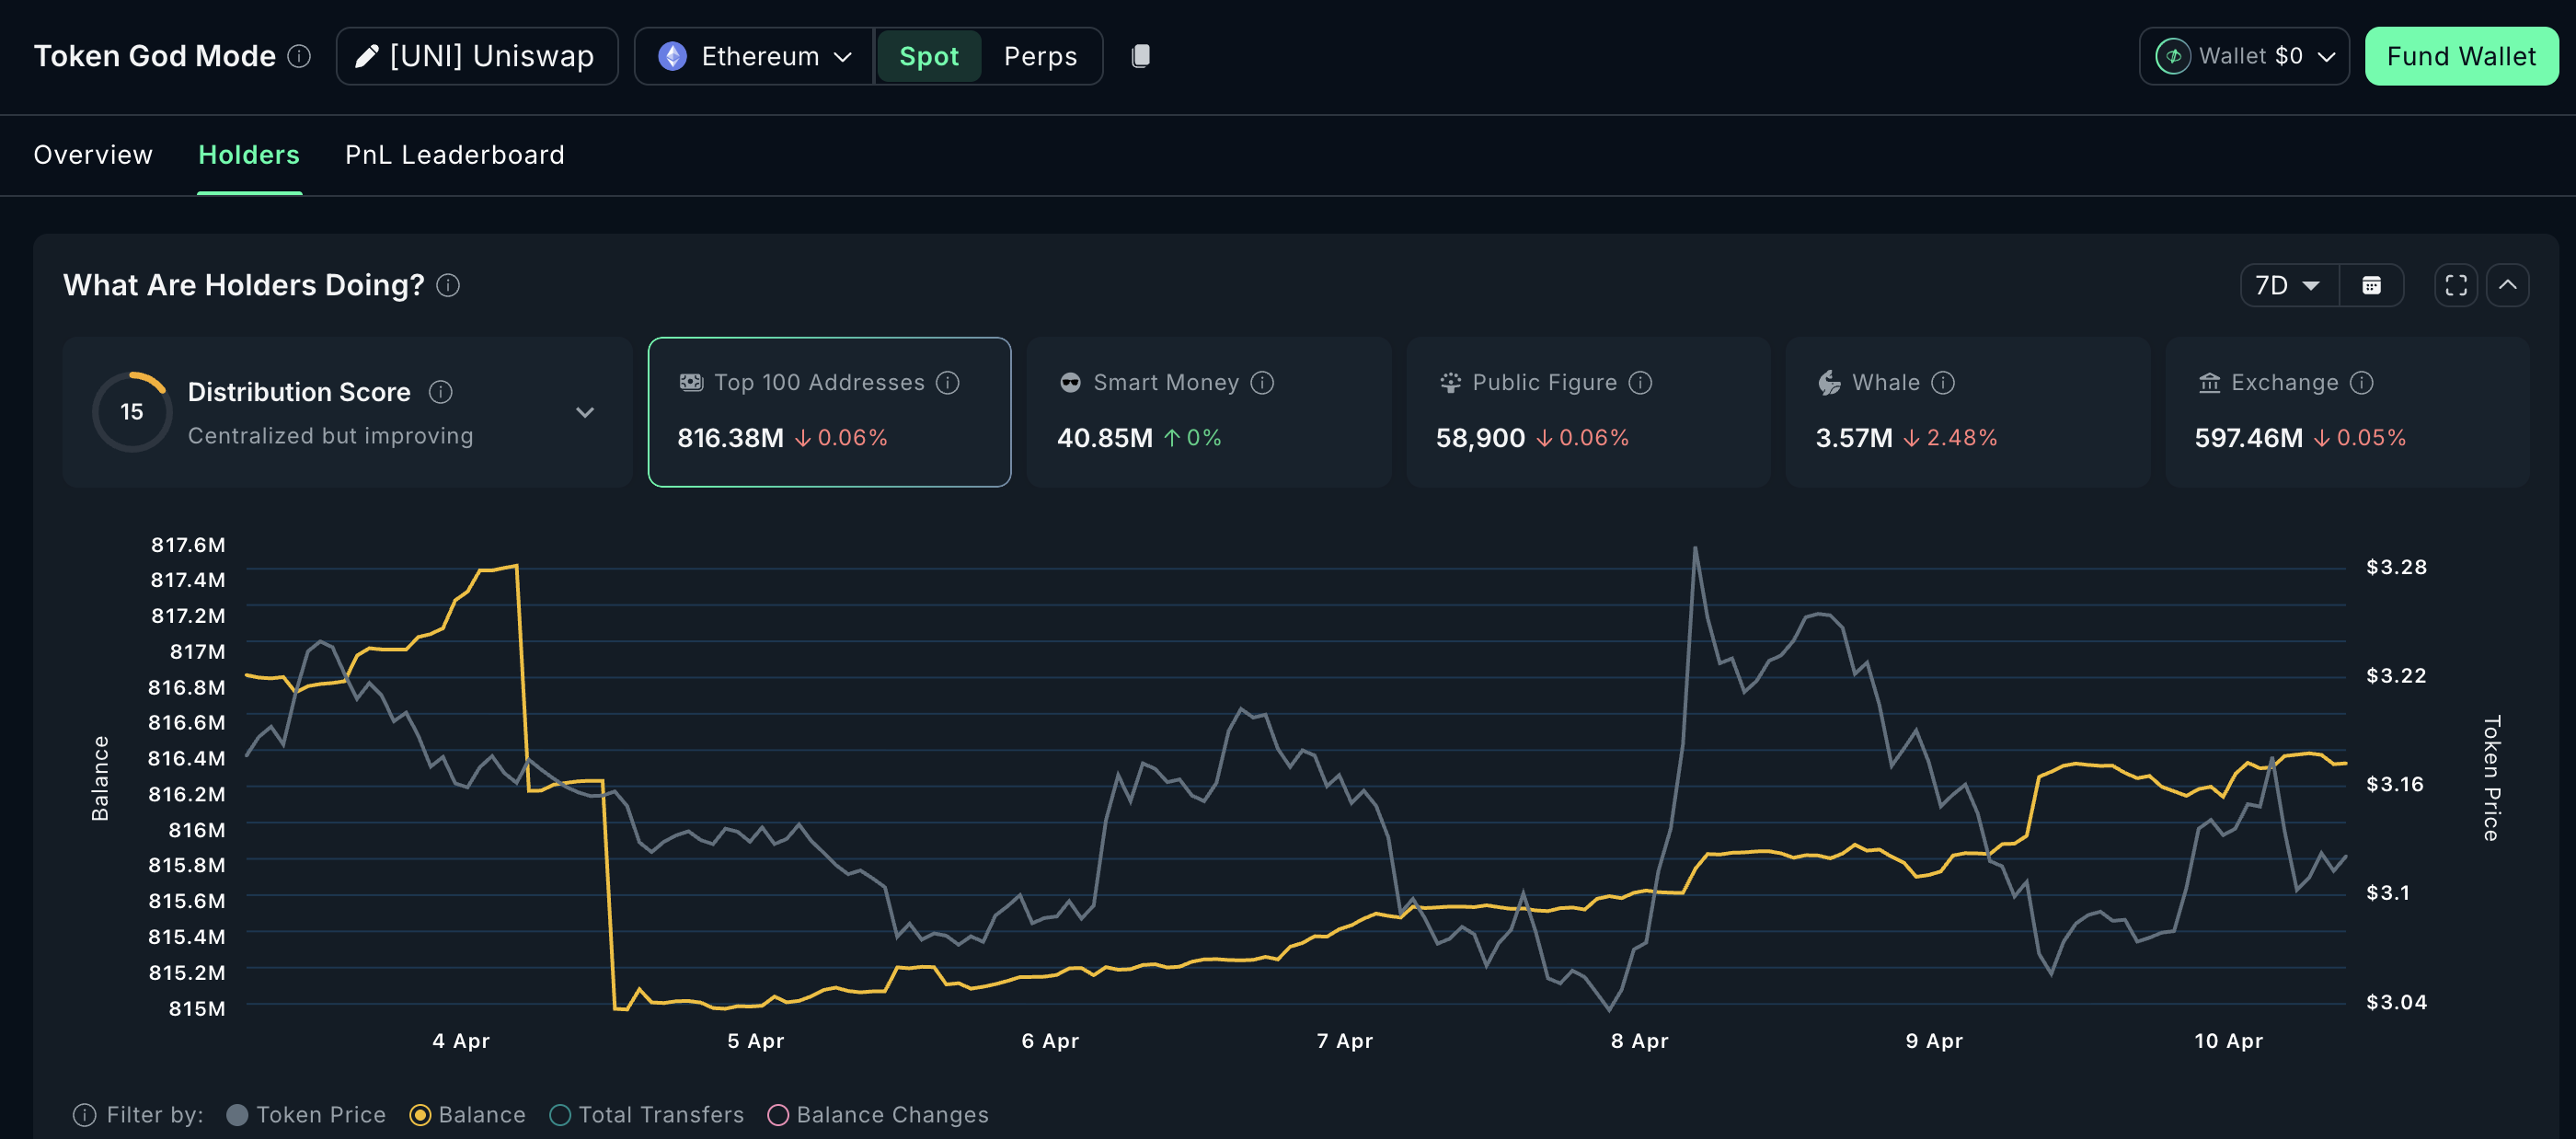
The daily chart supports the bearish tone. UNI has been trading inside a bear flag pattern since its March 13 high of $4.21. The flag’s lower boundary was tested near $3.01. UNI has since rebounded without reclaiming meaningful resistance. The 7-day whale distribution aligns with this bearish structure.
If that lower trendline breaks, the projected drop stands at roughly 28%. A daily close below $3.08, the 0.618 Fibonacci level, would start the trigger. Support levels at $2.92 and $2.72 could slow the decline. Yet the measured target sits near $2.20 if buyers fail to step in.
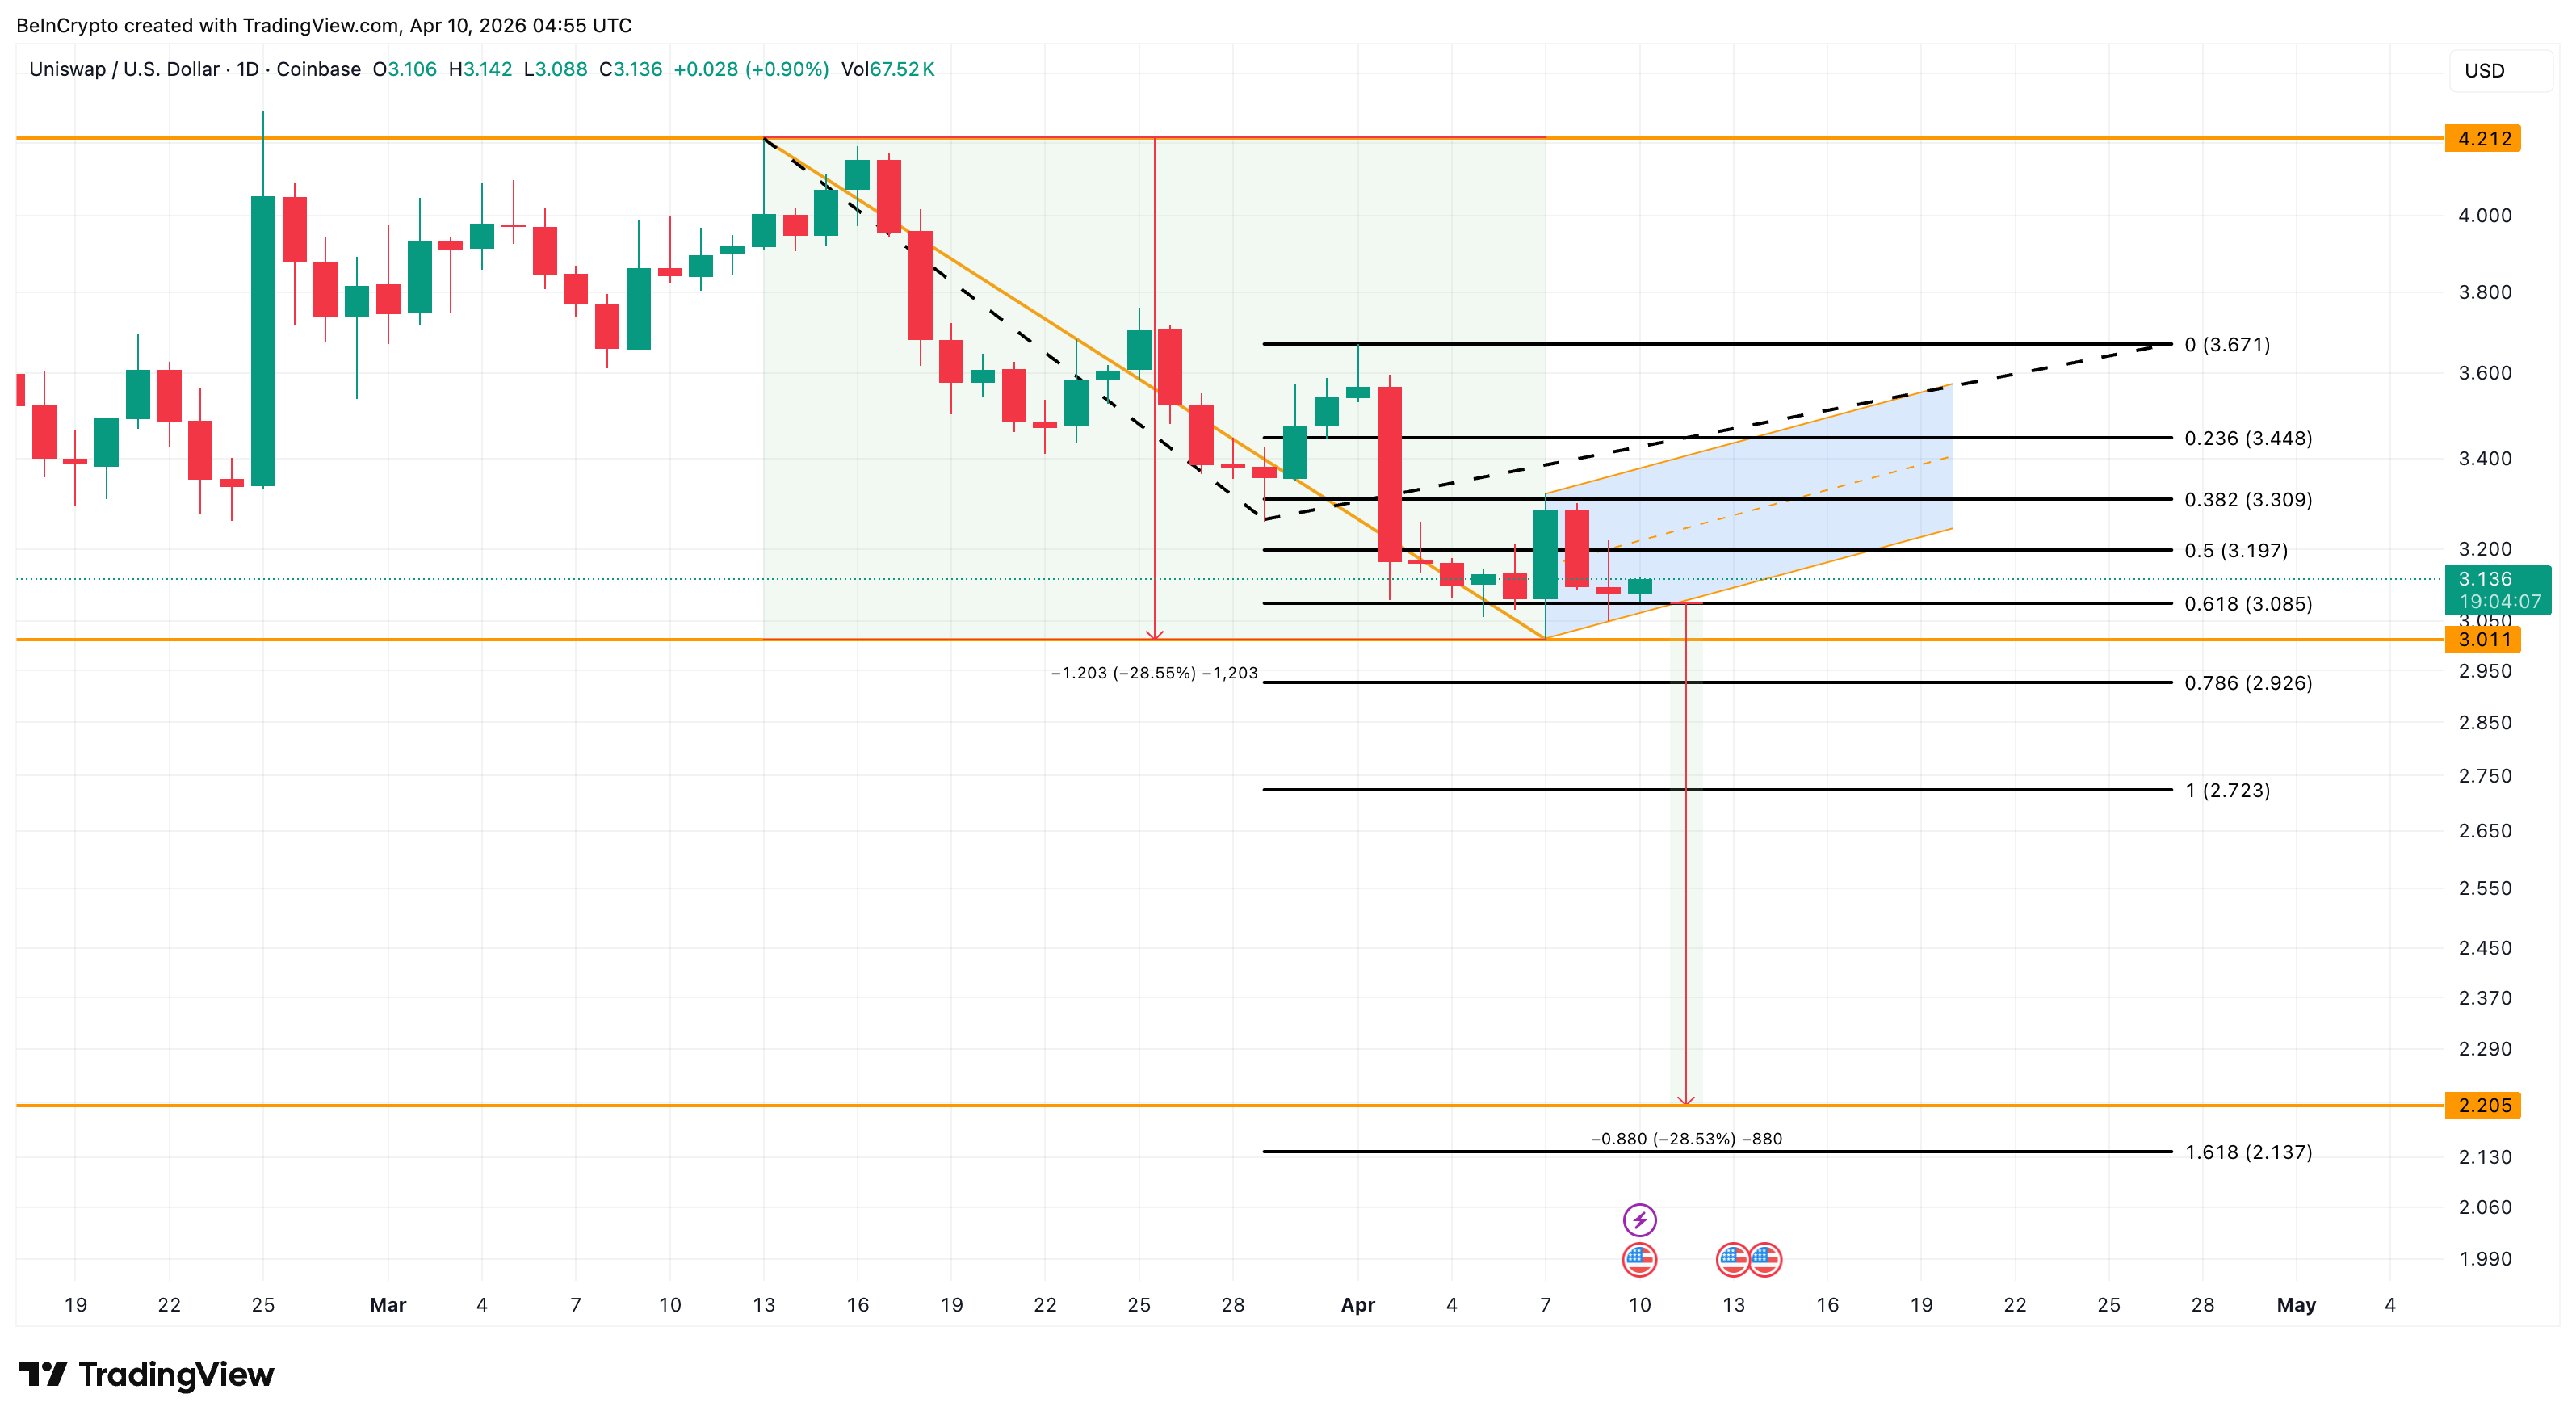
However, a push above $3.44 would challenge the bearish structure. A move beyond $3.67 would likely invalidate the bear flag entirely.
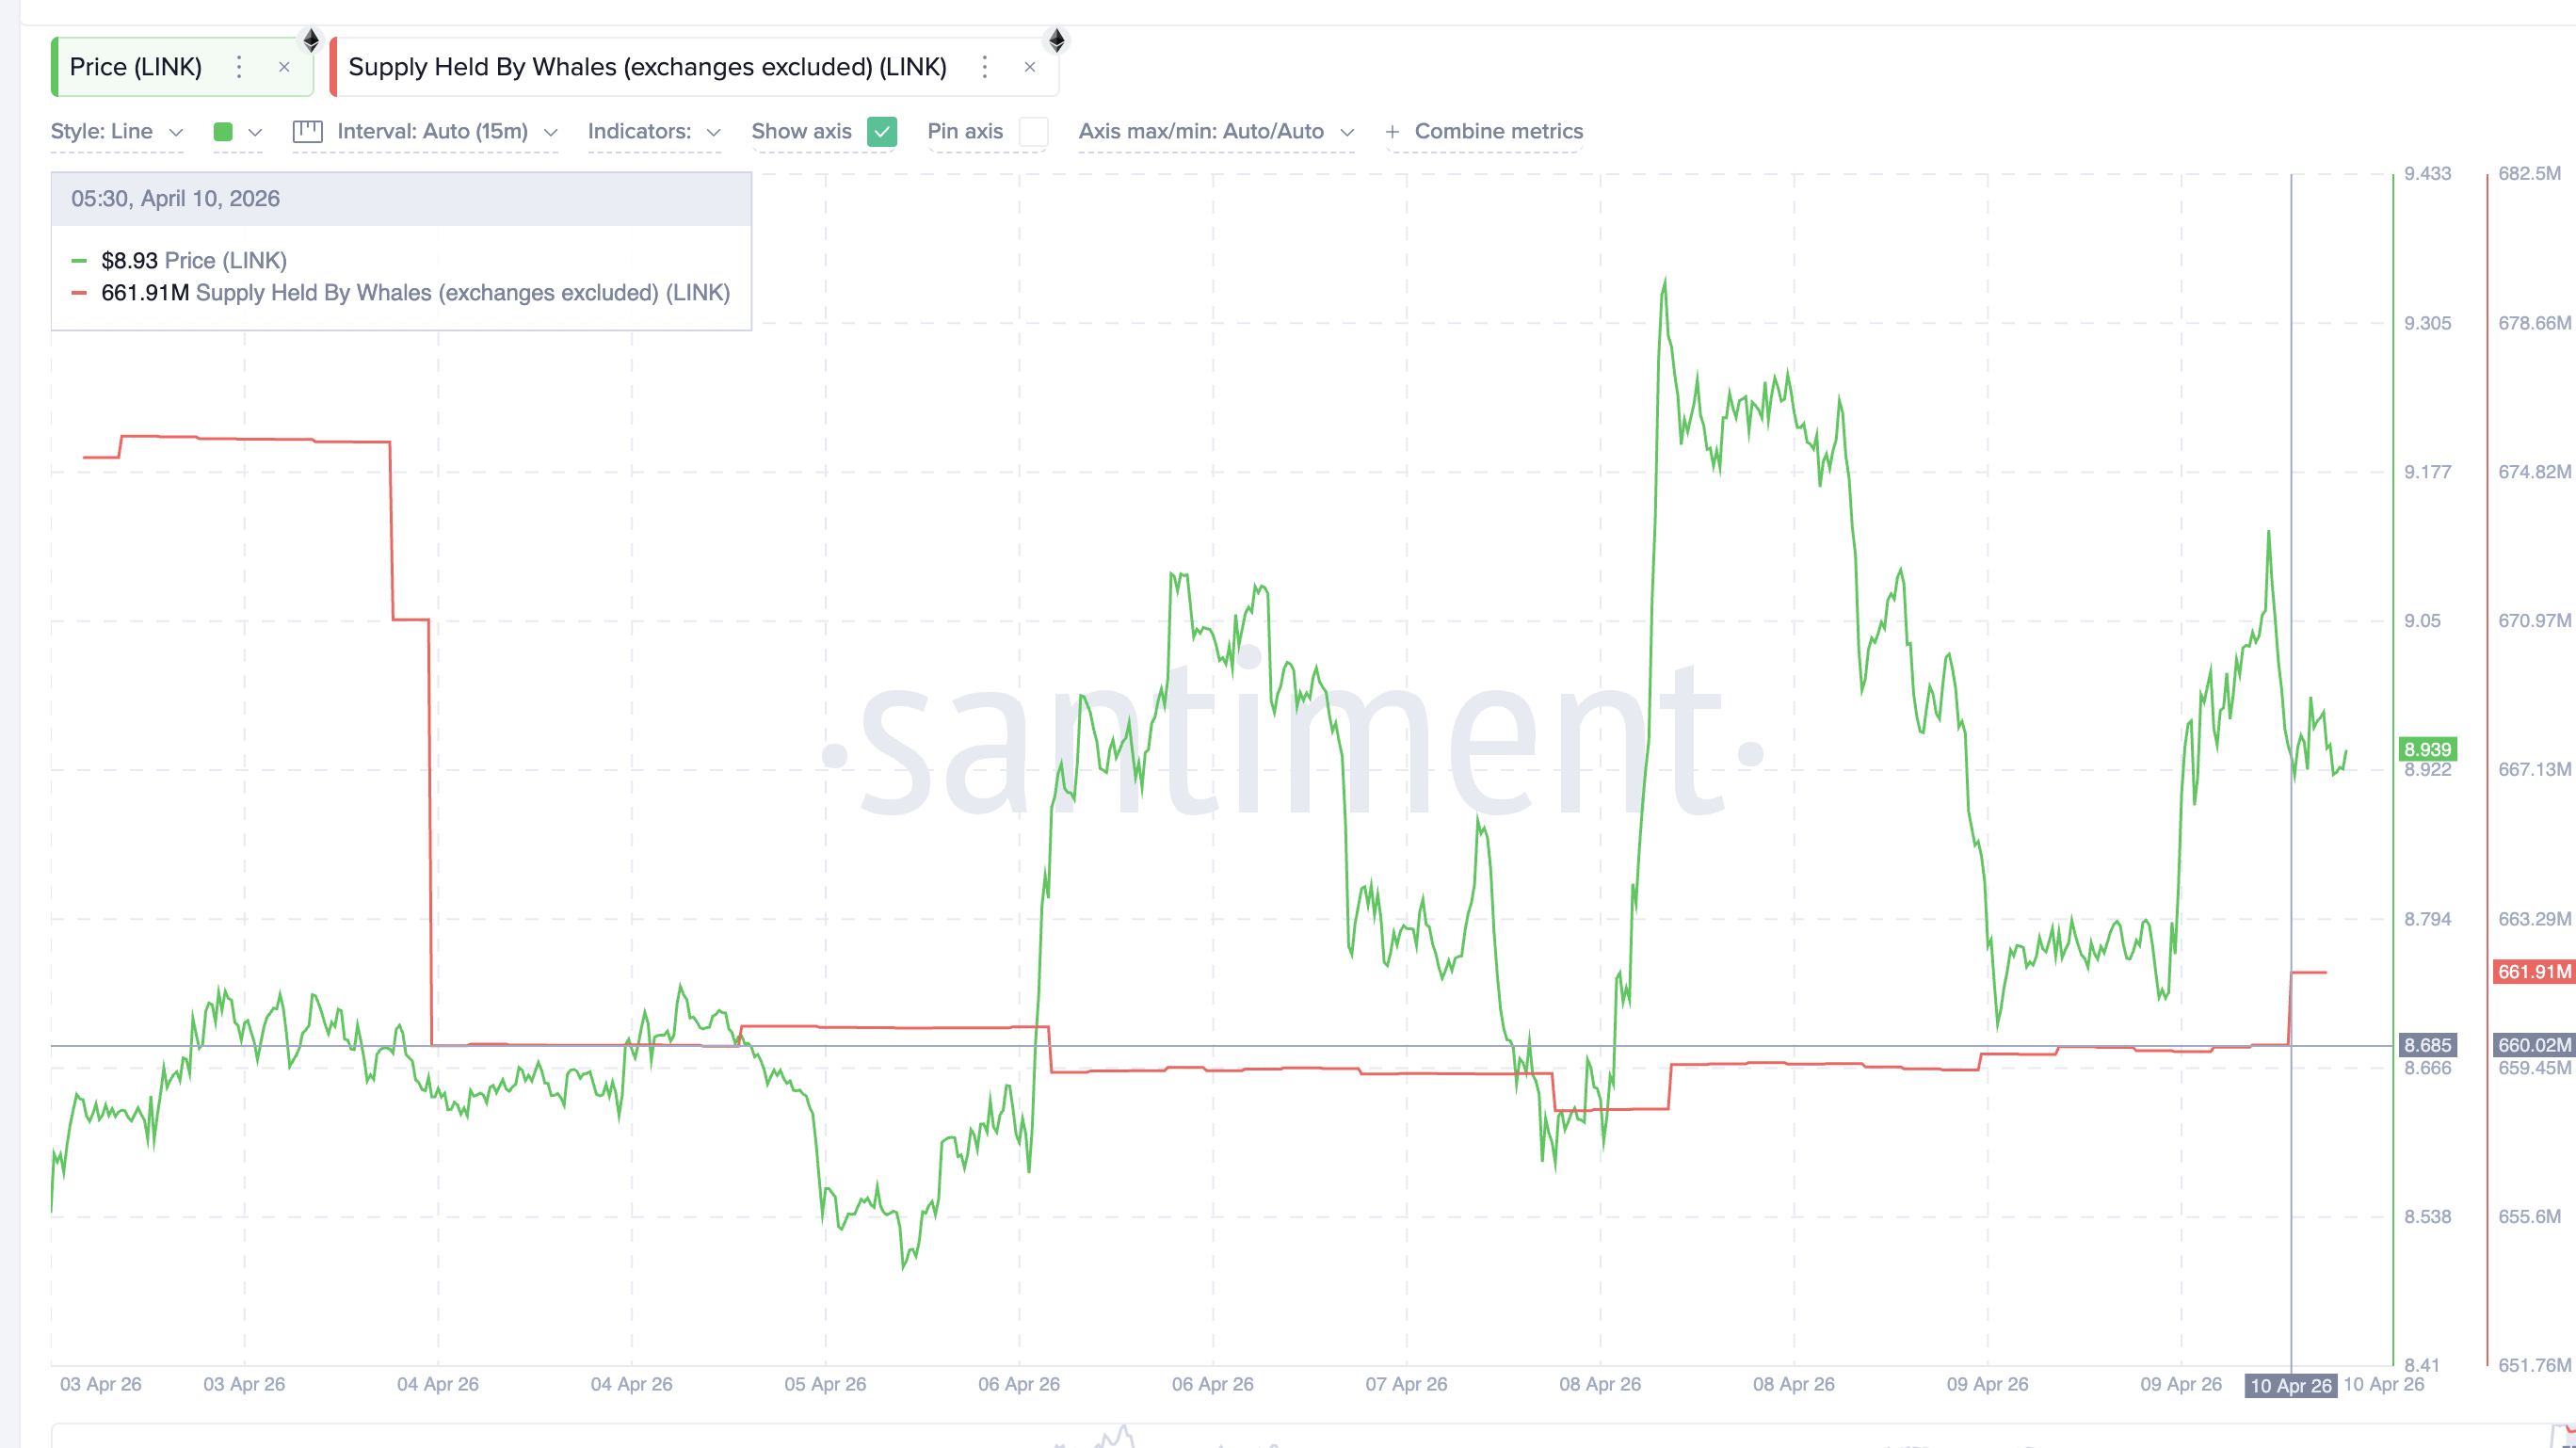
Chainlink (LINK)
Chainlink (LINK) rounds out the altcoin whale buying picture with a sudden surge in accumulation over the past few hours. Its oracle infrastructure feeds price data to DeFi protocols, positioning it to benefit from any activity uptick.
Santiment data shows LINK whale wallets climbed from 660.02 million to 661.91 million tokens. That 1.89 million LINK pickup translates to approximately $16.93 million in fresh buying. The accumulation mirrors the ETH whale pattern. Large holders appear to see the CPI print as a potential macro catalyst, provided a softer core reading surfaces.
On the daily chart, LINK is trading inside an inverse head-and-shoulders pattern. The right shoulder has locked into place, and the neckline sits near $9.43. From the head to the neckline, the measured target implies a 15.40% move higher. That could push LINK toward $10.82, above the psychological $10 mark.
A daily reclaim of $9.43 would confirm the breakout. From there, $9.63 and $9.89 serve as the first set of intermediate targets. However, $8.96 acts as the immediate floor. A slip below $8.68 would put the right shoulder under threat.
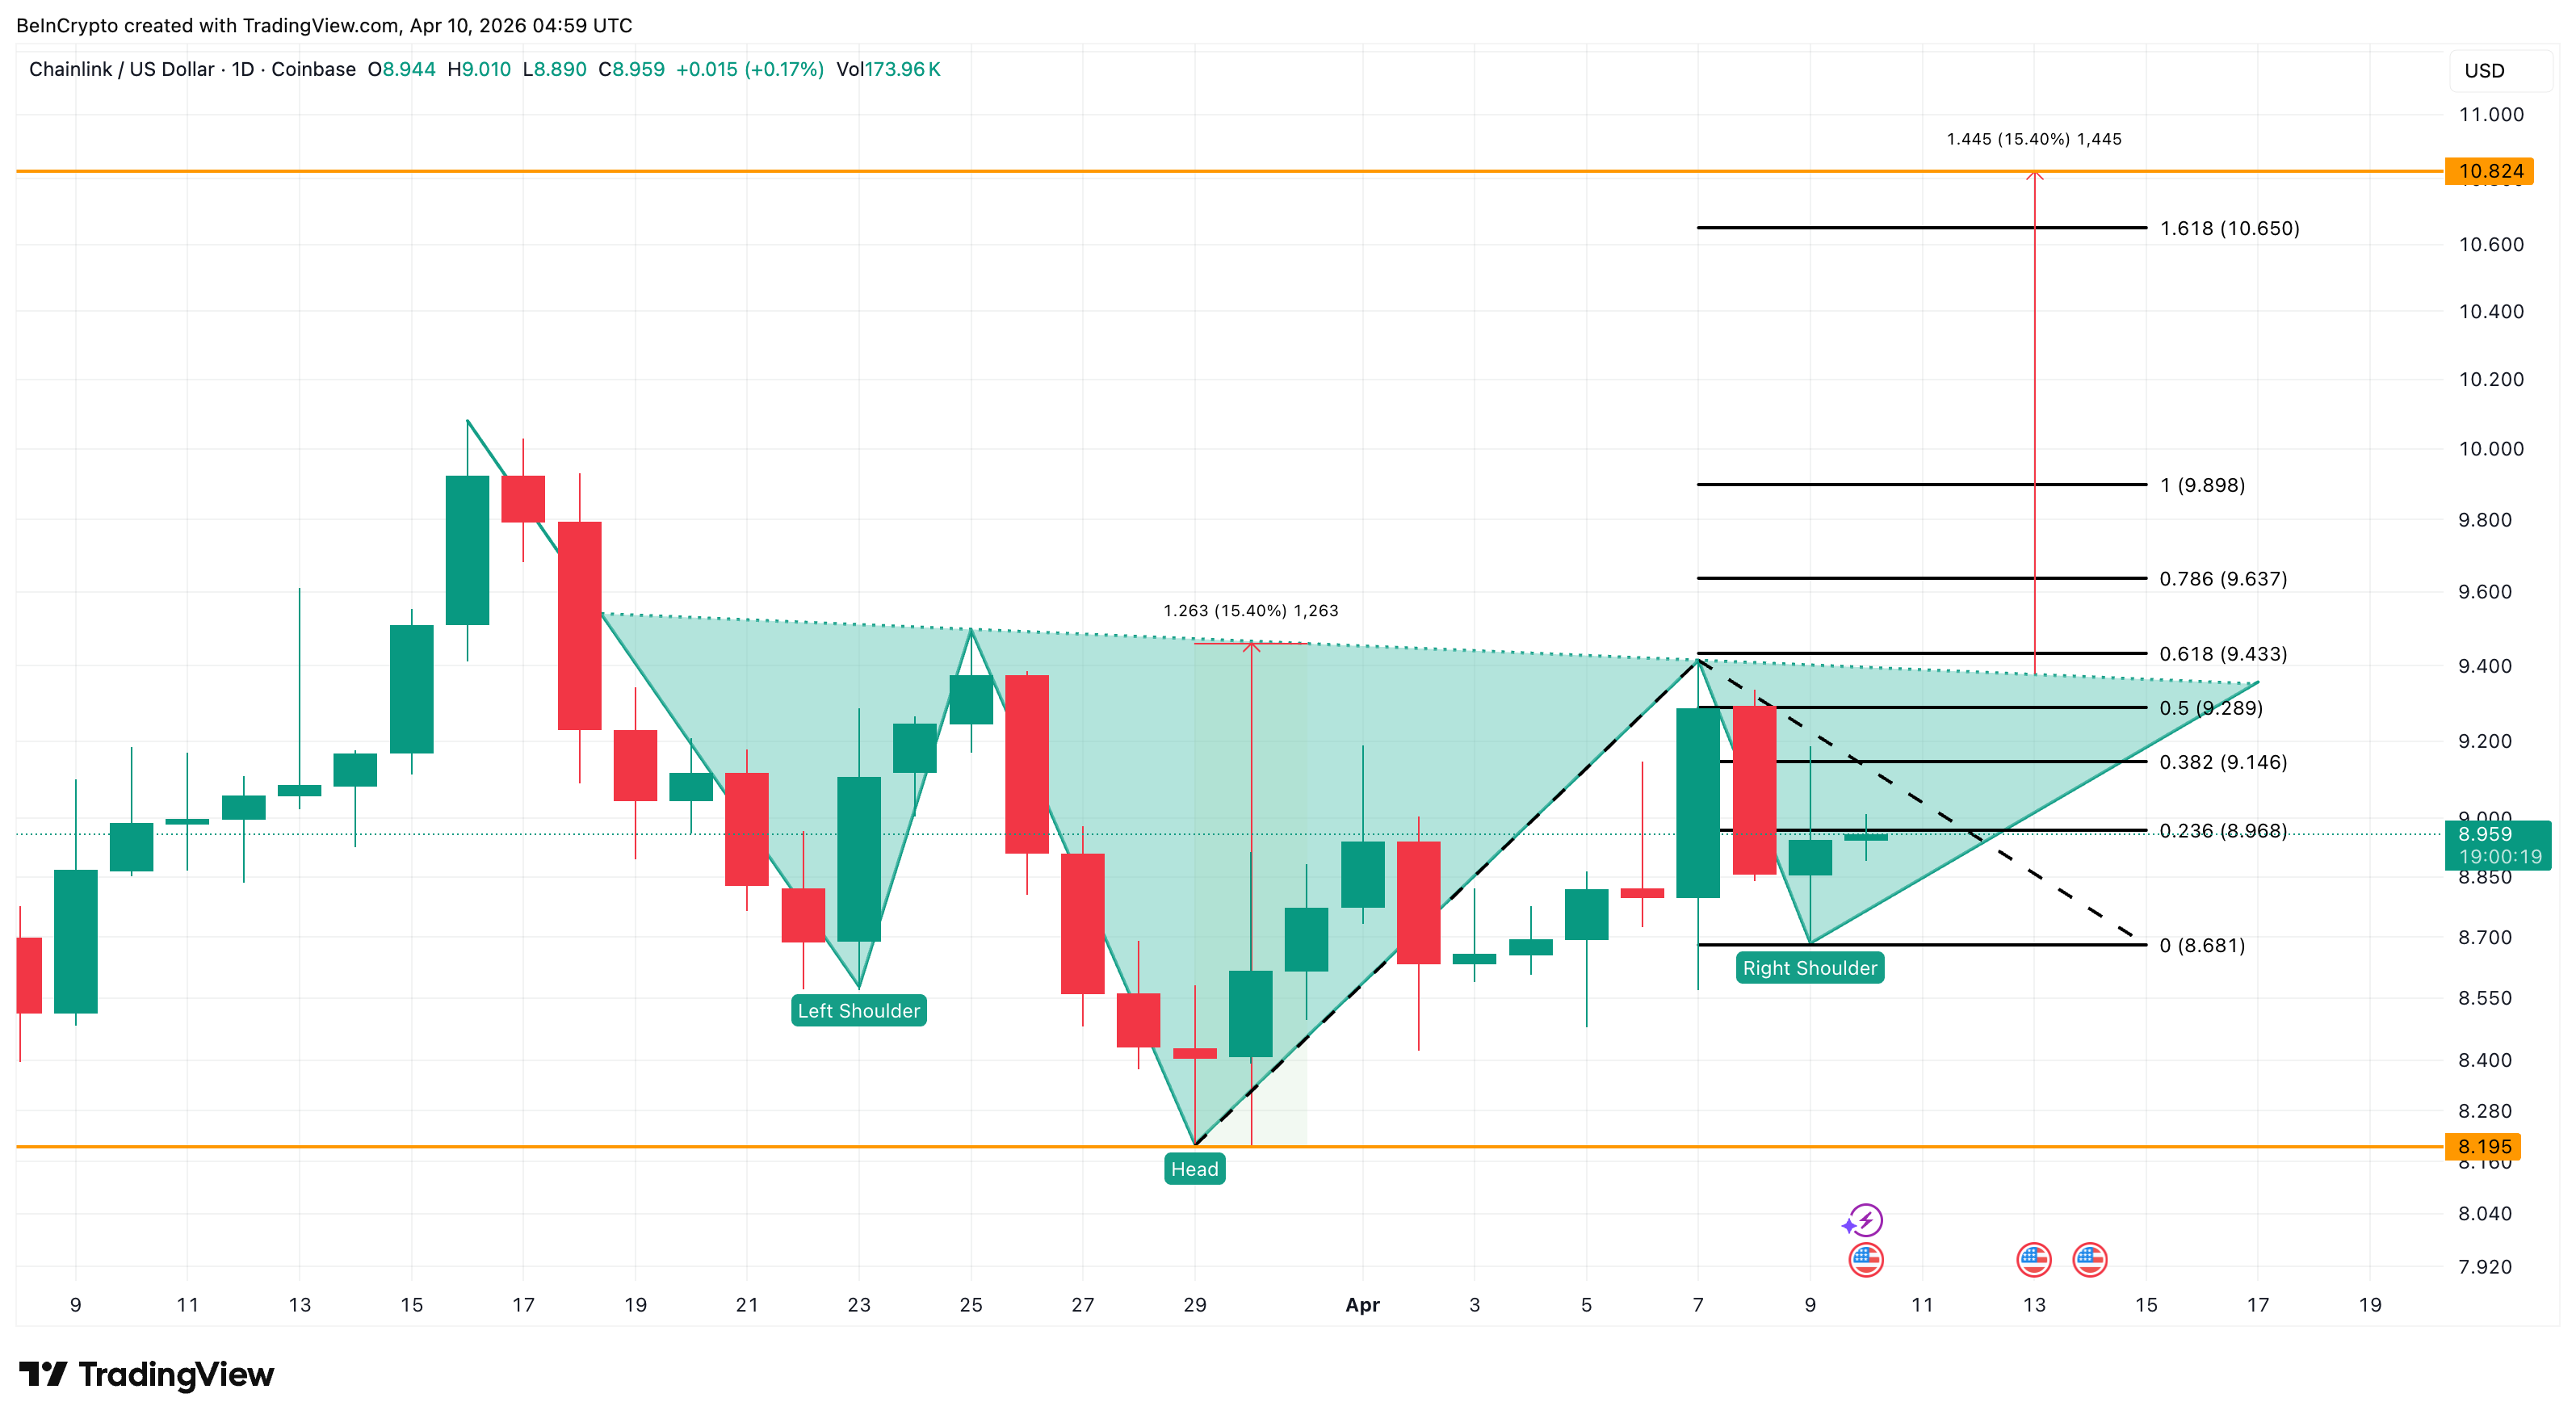
Yet the pattern retains its validity as long as LINK holds above $8.19, the head of the formation. Only a daily close below that level would fully invalidate the setup. Despite the macro uncertainty, that gives bulls a relatively wide margin of safety heading into the CPI release.
The post What Crypto Whales Are Buying and Selling Ahead Of The April US CPI Print appeared first on BeInCrypto.

Minimal Waits Across Terminals on April 10

XRP stalls below $1.38 as weak momentum keeps breakout at bay
‘Gone upstairs for lesser things’: KKR star fumes over umpiring blunder | Cricket News

Why Israel is blocking foreign journalists from entering

Bitcoin: We’re Entering The Most Dangerous Phase

Alan Cumming Brands Baftas Ceremony A ‘Triggering S**tshow’

XRP Ripple CEO, “Crypto Laws Launch June 2026!” Rocket Launch Soon!!

“Do Not Exit the Markets at All,” Finance Writer Monika Halan’s Advice to Investors | EP-404

This Chart PERFECTLY Predicted Bitcoin’s Last 300 Days. $50K Is Next.
-

 Fashion7 days ago
Weekend Open Thread: Spanx – Corporette.com
-

 Business4 days ago
Three Gulf funds agree to back Paramount’s $81 billion takeover of Warner, WSJ reports
-

 Sports5 days ago
India men’s 4x400m and mixed 4x100m relay teams register big progress | Other Sports News
-

 Business6 days ago
Expert Picks for Every Need
-

 Tech2 days ago
How Long Can You Drive With Expired Registration? What Florida Law Says
-

 Business5 days ago
No Jackpot Winner, Prize to Climb to $231 Million
-

 Fashion4 days ago
Massimo Dutti Offers Inspiration for Your Summer Mood Board
-

 Fashion3 days ago
Let’s Discuss: DEI in 2026
-
Politics7 days ago
Wings Over Scotland | The quality of mercy
-

 Crypto World2 days ago
Bitcoin recovers as US and Iran Agree a Ceasefire Deal
-

 Business5 days ago
Akebia Therapeutics, Inc. (AKBA) Discusses Pipeline Progress and Strategic Focus on Kidney Disease Treatments at R&D Day – Slideshow
-

 Crypto World20 hours ago
Canary Capital Files SEC Registration for PEPE ETF
-

 Fashion7 days ago
Frugal Friday’s Workwear Report: Hammered Metallic Button Sweater Vest
-

 Politics6 days ago
The UK should not pay a penny in slavery reparations
-

 Tech4 days ago
Haier is betting big that your next TV purchase will be one of these
-

 Fashion7 days ago
Tory Burch’s Spring 2026 Campaign Goes on a Getaway
-

 Fashion7 days ago
Weekly News Update, 4.3.26 – Corporette.com
-

 NewsBeat6 days ago
Kemi Badenoch talks ‘spring cleaning’ Reform defections
-

 Tech4 days ago
Samsung just gave up on its own Messages app
-
 Fashion7 days ago
Philip Jones Kids Jewellery collection – Genuine 925 sterling silver
You must be logged in to post a comment Login