
Crypto World
S&P 500 Analysis: Index Falls to Year-to-Date Low
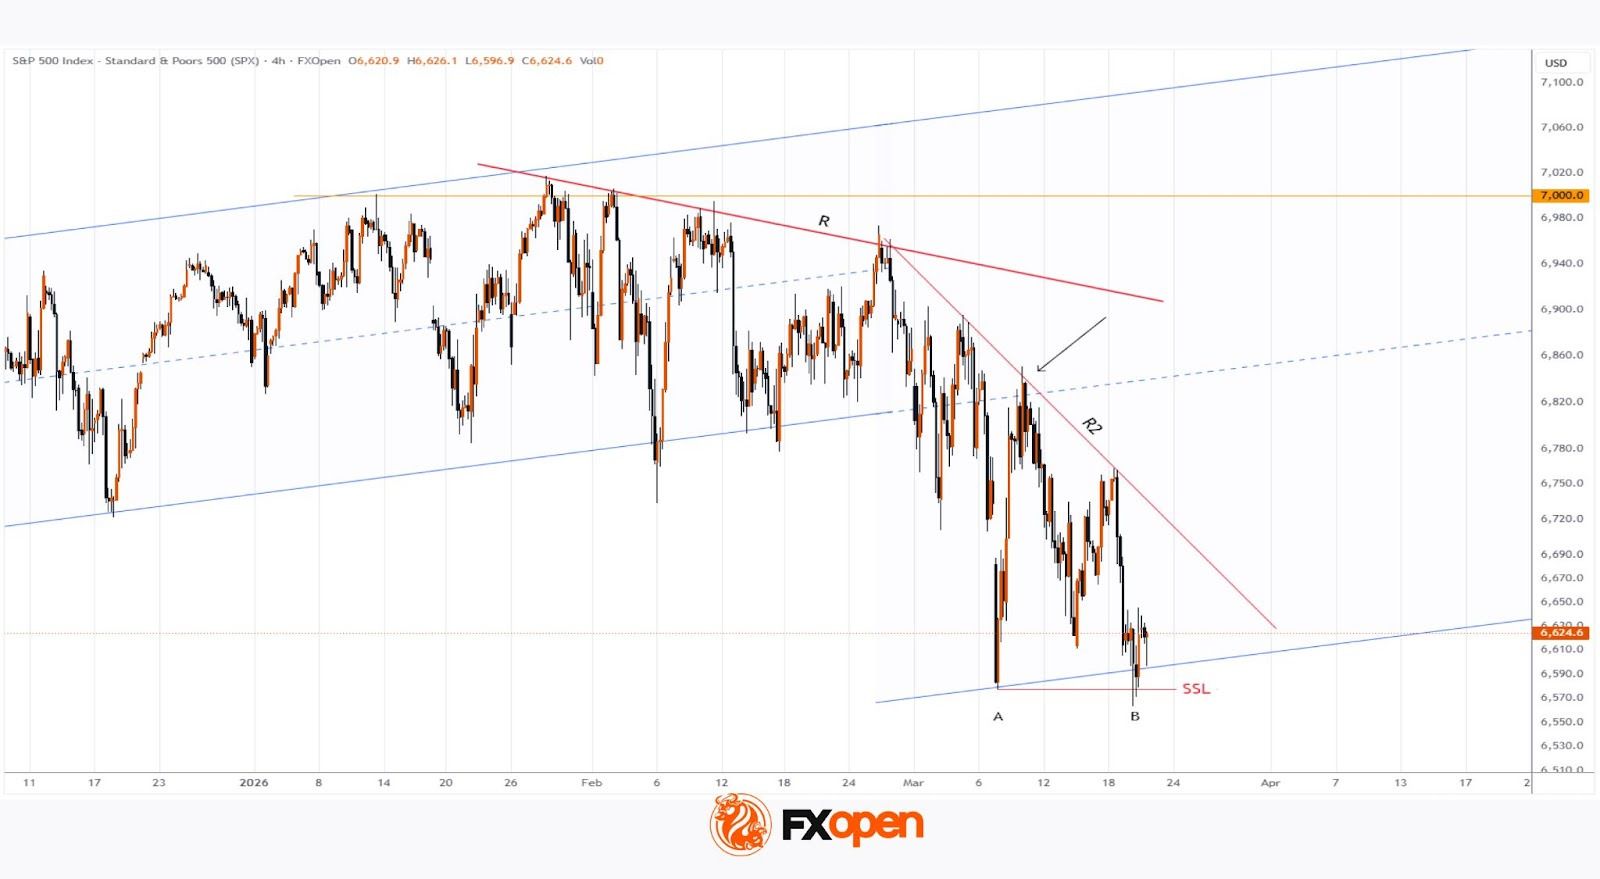
As the S&P 500 chart (US SPX 500 mini on FXOpen) shows, the index dropped below the 6,570 level yesterday for the first time in 2026. As a result, the equity market may be on track to post a fourth consecutive weekly decline, closing below its 200-day moving average.
Why Are Equities Falling?
Bearish sentiment is likely being driven by the ongoing military conflict in the Middle East:
→ Elevated oil prices are fuelling expectations of a renewed inflationary surge. This suggests the Federal Reserve will keep interest rates higher for longer (as reinforced by Powell’s remarks this week), putting pressure on both the economy and corporate performance.
→ Investors are also concerned that the United States could become drawn into a prolonged conflict with Iran, which may pose significant challenges for the country, despite efforts by officials to calm market sentiment.
According to Trading Economics:
→ US President Donald Trump stated that the US is not considering deploying ground troops to the Middle East;
→ Treasury Secretary Scott Bessent noted that the Iranian regime could face internal collapse;
→ Israeli Prime Minister Benjamin Netanyahu said Israel may refrain from further strikes on Iran’s energy infrastructure, suggesting the conflict could end sooner than expected.

Technical Analysis of the S&P 500
On 11 March, we analysed the index chart and noted that the lower boundary of the broader channel was acting as support (point A), while the median line served as resistance (as indicated by the arrow).
Since then, selling pressure has led to:
→ the formation of a steeper descending trendline (R2);
→ a move down to a new low at point B, below the previously mentioned channel boundary.
From a Smart Money Concepts perspective, it is reasonable to assume that price has entered a Sell-Side Liquidity zone. If so, traders should consider the possibility that the recent bearish breakout below the channel may prove to be false. In that case, the S&P 500 could stage a recovery in the coming sessions, potentially moving back towards the R2 trendline.
Trade global index CFDs with zero commission and tight spreads (additional fees may apply). Open your FXOpen account now or learn more about trading index CFDs with FXOpen.
This article represents the opinion of the Companies operating under the FXOpen brand only. It is not to be construed as an offer, solicitation, or recommendation with respect to products and services provided by the Companies operating under the FXOpen brand, nor is it to be considered financial advice.

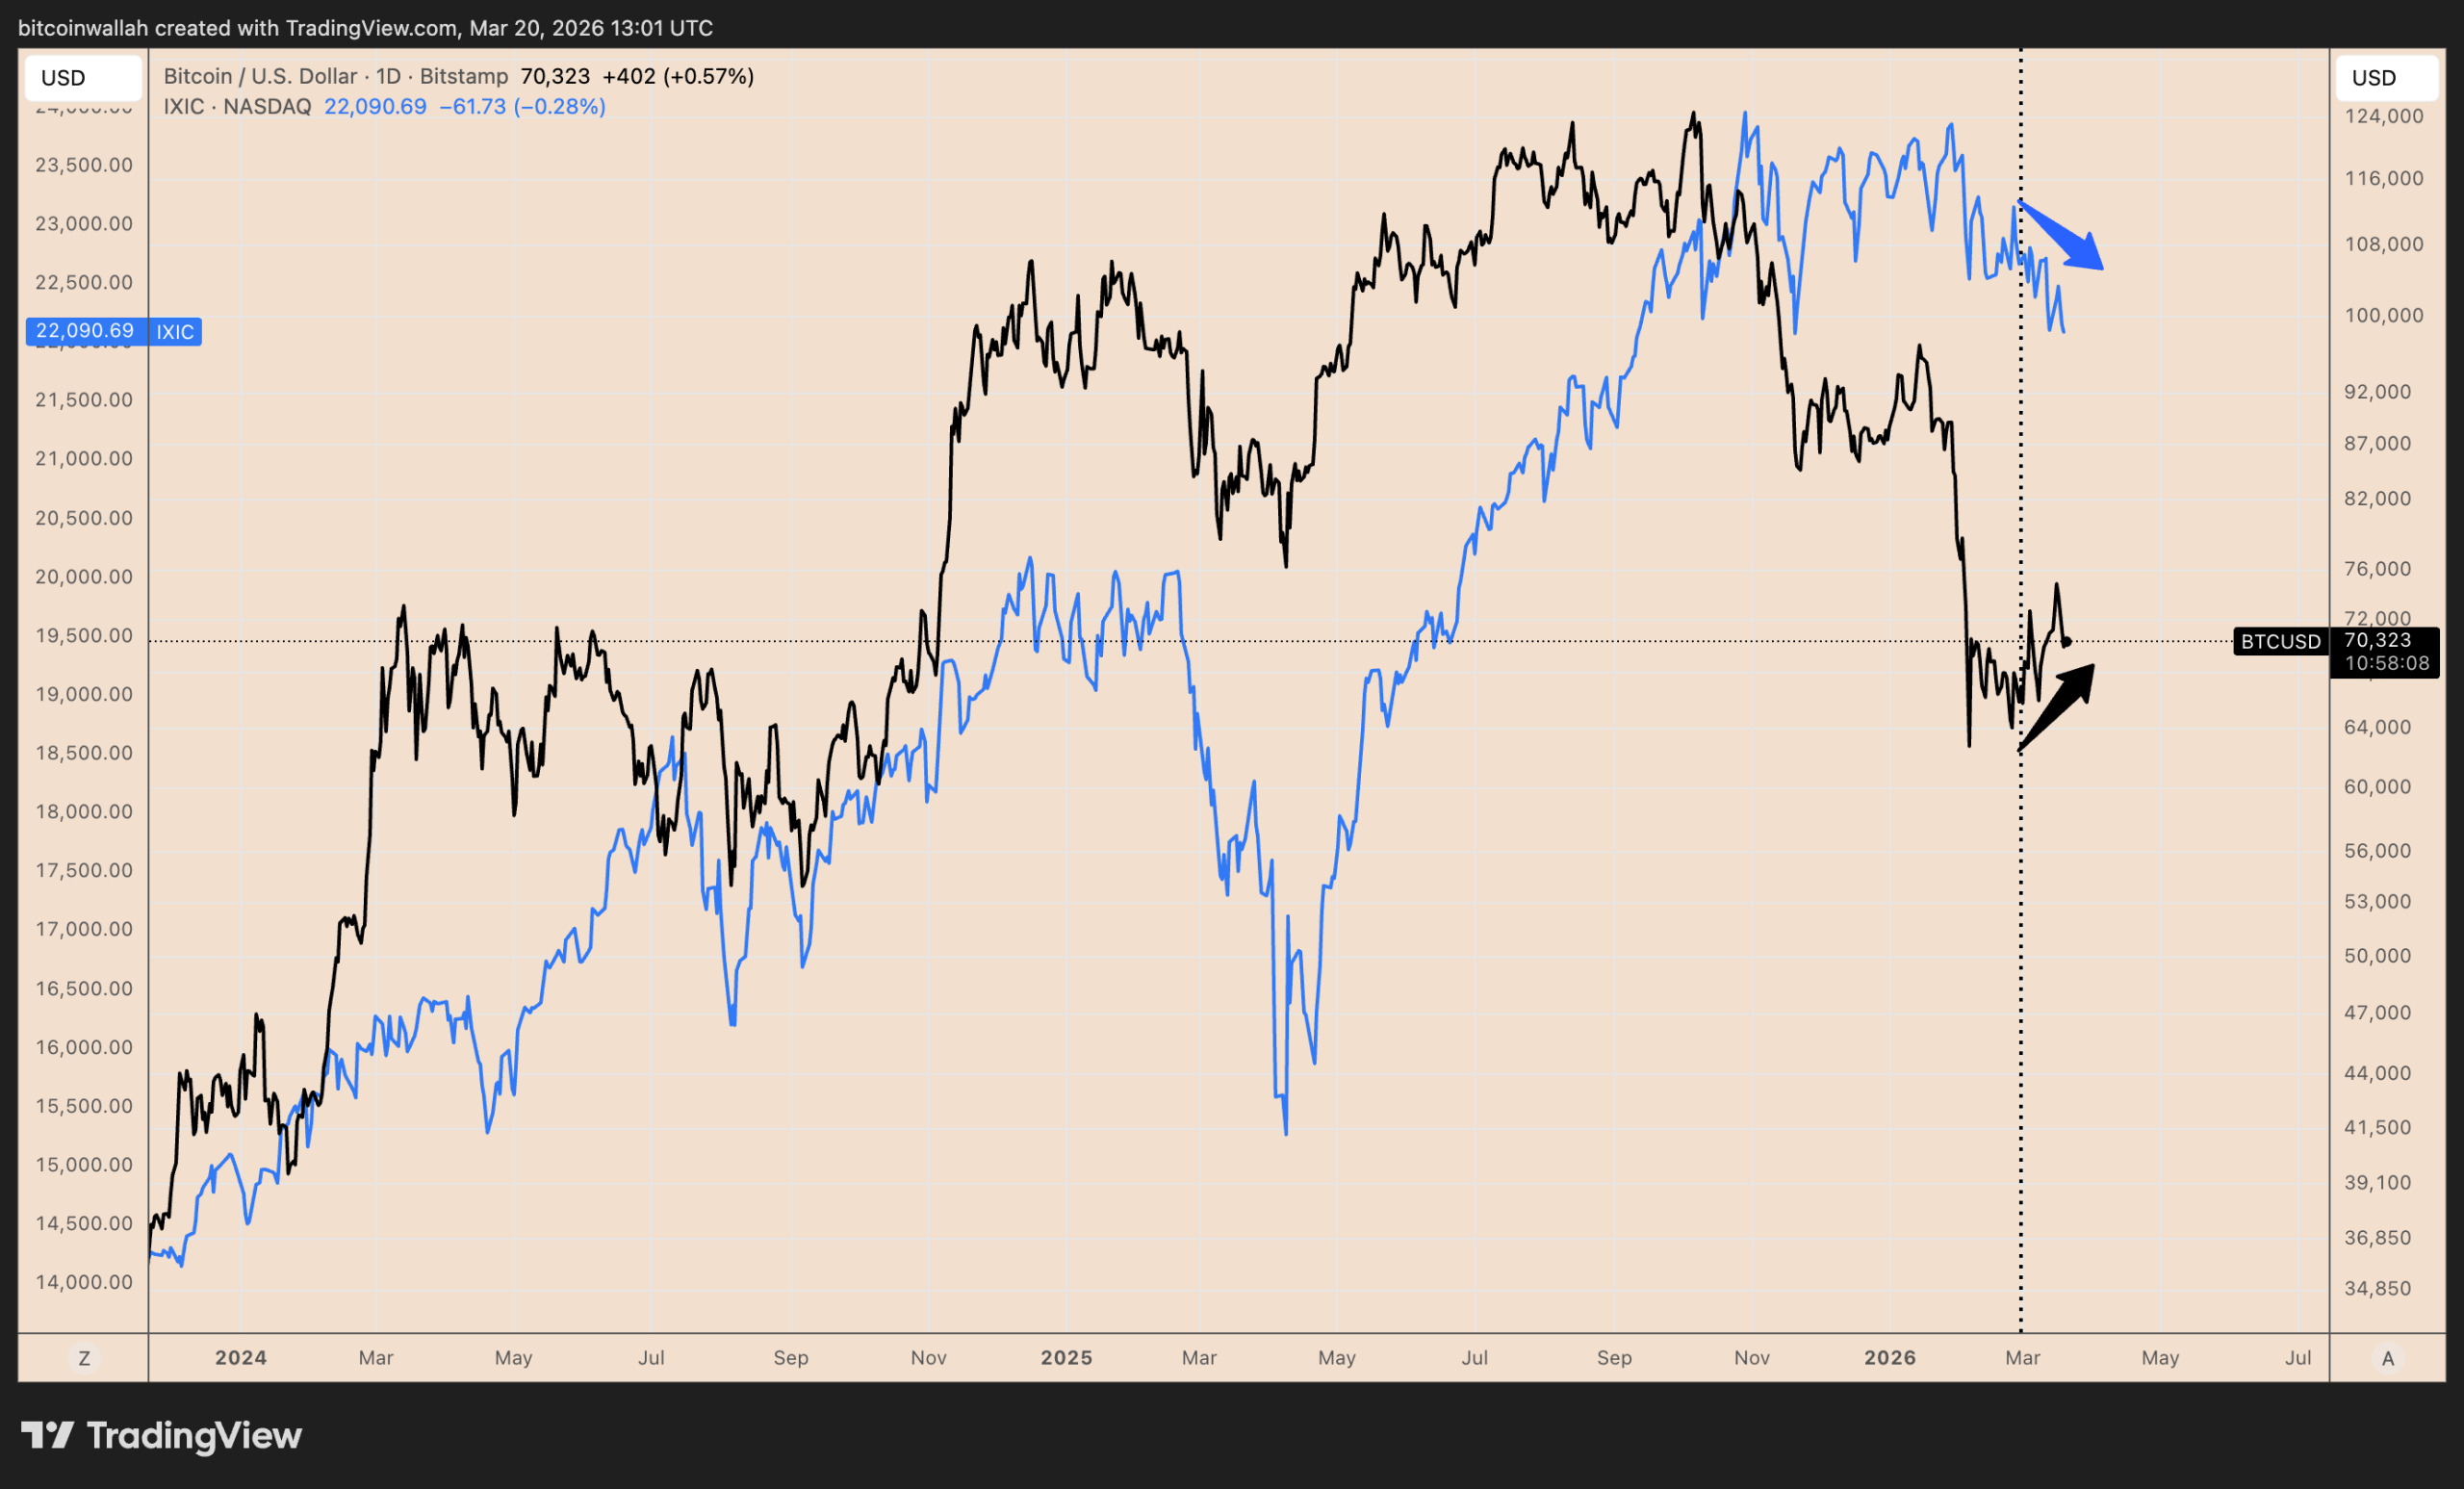
Bitcoin (BTC) has outperformed US equities and gold since the US and Israel’s attack on Iran on Feb. 28, underscoring its strength amid one of the year’s biggest geopolitical shocks.
However, BTC’s rally may face a serious challenge if oil prices spike toward $180 per barrel, a scenario some Saudi Arabian officials now see as plausible if Middle East supply disruptions persist beyond April.

Key takeaways:
-
US headline inflation may rise to 5% if oil supply shock persists, lowering rate cut odds in 2026.
-
Such macro headwinds risk sending the Bitcoin price to $51,000 in the coming months.
Oil boom may double US inflation and hurt Bitcoin
As of Friday, Brent crude was trading for around $105 per barrel, up roughly 50% since the US and Israel-Iran war started.

Oil transits through Iran’s Strait of Hormuz fell to 9.71 million barrels per day by mid-March from 25.13 million in February, according to Kpler data.

Vortexa, an energy data tracker, estimates a steeper drop to 7.5 million barrels per day, highlighting the scale of the Middle East supply shock and why experts anticipate oil to rise another 70%.
A 2023 US Federal Reserve study said that every 10% rise in crude price can add about 0.35–0.40 percentage points to US CPI.
By that measure, an extended oil rally could lift inflation by roughly 2.5–2.8 points, enough to push CPI well above its current 2.4% level and further above the Fed’s 2% target.
Markets are already adjusting to that risk.
Policy easing expectations have shifted more hawkish, with markets no longer pricing in a second rate cut in 2026 and the odds of the first cut now pushed further to October 2027.

Higher rates tend to keep borrowing costs high, tighten liquidity, and weaken investor appetite for risk assets such as Bitcoin and stocks.
Related: Trump ups pressure for Fed chair Powell to cut rates ‘right now’
Any signs of de-escalation in the conflict could quickly cool the oil rally.
Historically, such spikes have been short-lived, with prices normalizing over time and Bitcoin regaining strength as market fears fade.
Oil shock raises Bitcoin’s odds of hitting $51,000
The $180 oil warning appears as Bitcoin’s uptrend shows signs of fatigue.
BTC’s price has dipped 9.50% from its local high of nearly $76,000, trading under $70,000 as of Thursday. Its correction has painted a bear flag pattern with a $51,000–$52,000 measured downside target.

Bitcoin’s pullback also coincides with a complete halt in STRC-led BTC buying by Michael Saylor’s Strategy.
The firm did not buy Bitcoin this week, after purchasing 22,337 BTC in the week ending March 15 and 17,994 BTC the week before that.

That matters because Strategy had recently been absorbing supply at a pace equal to multiple weeks of global mining output. Its absence removes a major source of demand just as macro risks are building.
Coinbase premium has also turned negative, signaling softer US demand amid the ongoing oil supply shock.
This article does not contain investment advice or recommendations. Every investment and trading move involves risk, and readers should conduct their own research when making a decision. While we strive to provide accurate and timely information, Cointelegraph does not guarantee the accuracy, completeness, or reliability of any information in this article. This article may contain forward-looking statements that are subject to risks and uncertainties. Cointelegraph will not be liable for any loss or damage arising from your reliance on this information.
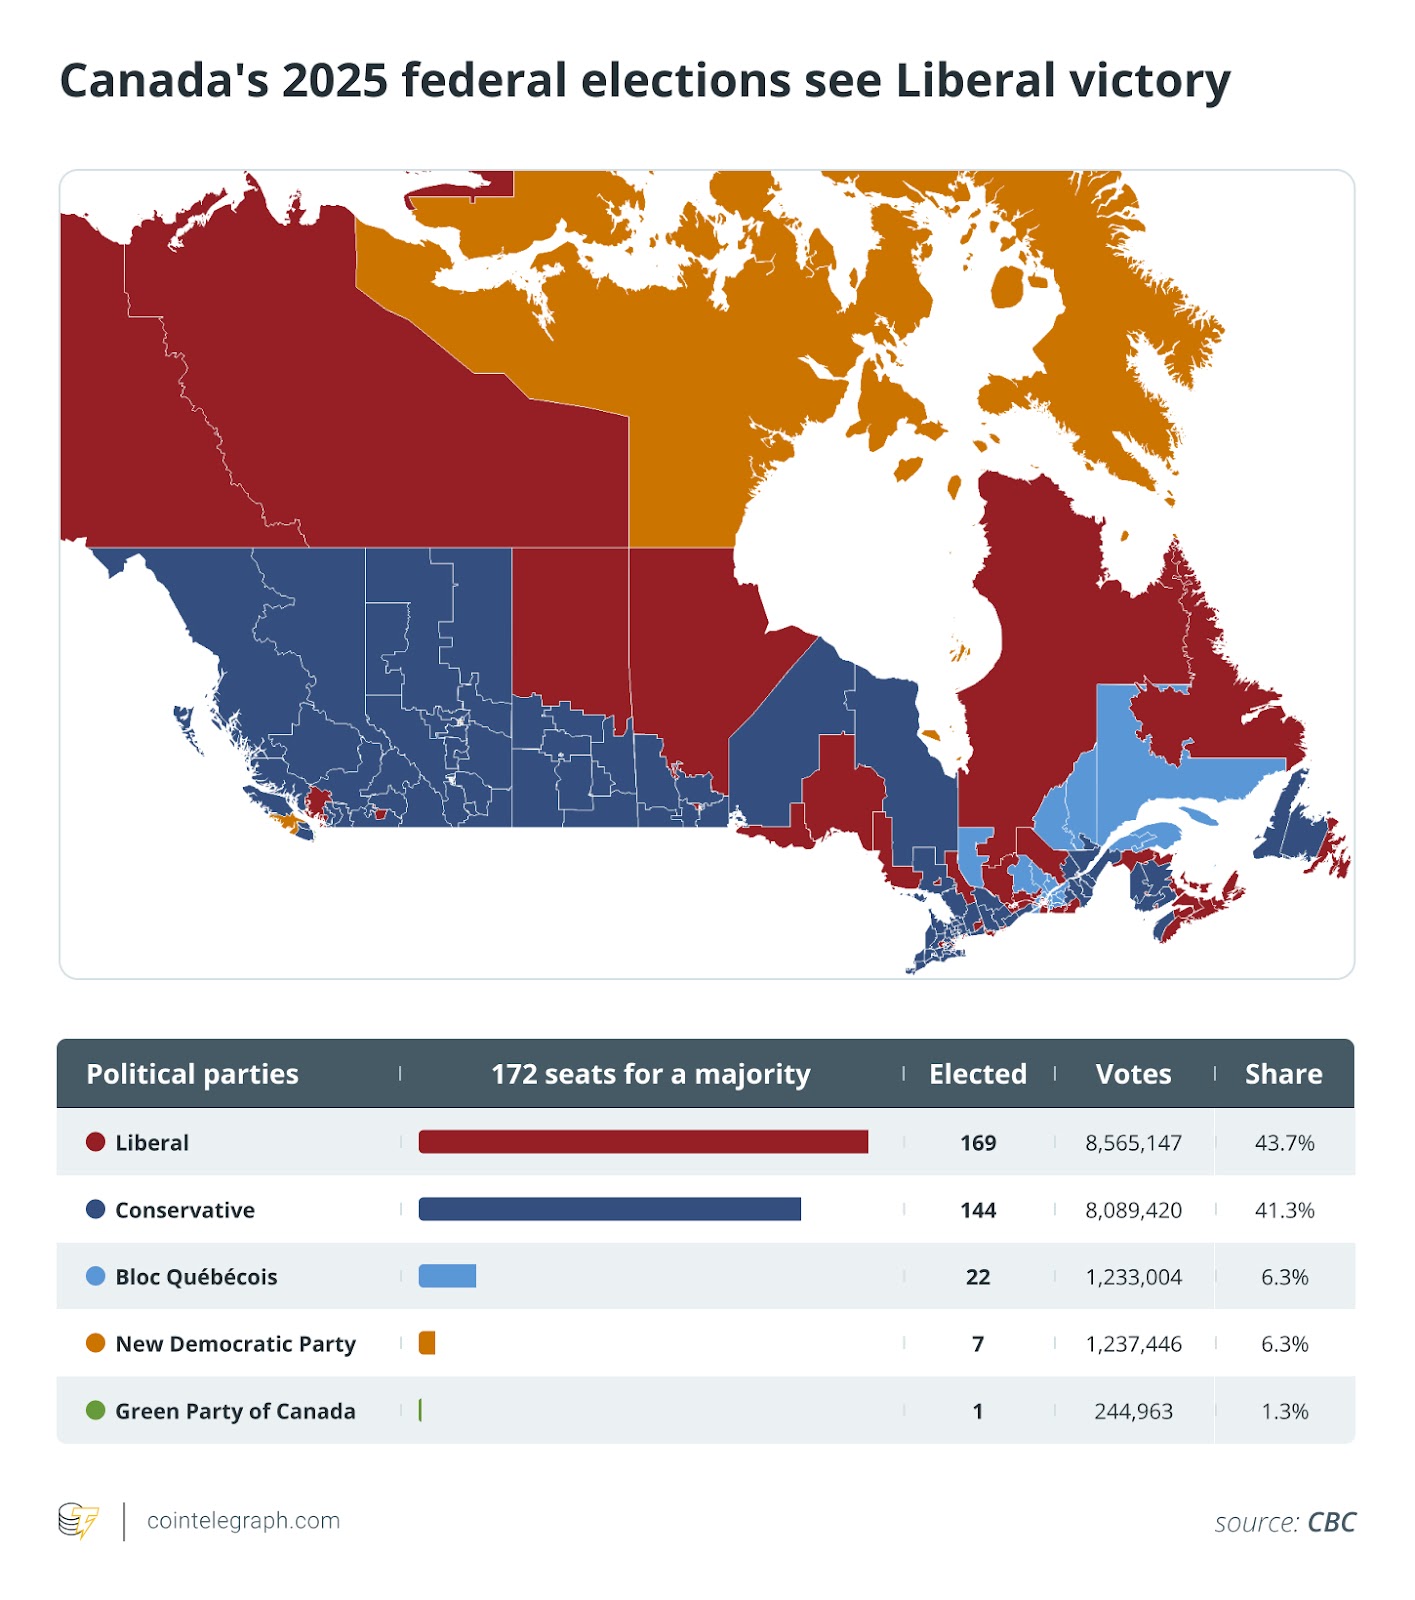
Cryptocurrencies and blockchain technology have increasingly become part of Canada’s core financial system over the past year.
In November, the country introduced stablecoin regulations as part of the Canada Stablecoin Act. Introduced as part of the budget, it gives the Bank of Canada the power to regulate stablecoins in the country.
Elsewhere, policymakers are finalizing amendments to laws for crypto asset funds, including those for cold wallets and custodians.
The changes highlight a pragmatic, but regulation-first approach to crypto, which observers have come to expect from Prime Minister Mark Carney’s government.
Increased scrutiny and new standards for crypto raise the bar
When Canadian Prime Minister Mark Carney assumed office last year, industry observers expected a cautious approach to crypto in Canada.
Carney had previously expressed skepticism about crypto. As Governor of the Bank of England, he said that “Cryptocurrencies act as money, at best, only for some people and to a limited extent, and even then only in parallel with the traditional currencies of the users. The short answer is they are failing.”
Still, he called for regulating the crypto space, and said that the underlying technologies could “improve financial stability; support more innovative, efficient and reliable payment services as well as have wider applications.”
In May 2025, Morva Rohani, executive director of the Canadian Web3 Council, said, “With Mark Carney at the helm of the Liberal Party, we anticipate a pragmatic but regulation-first approach to crypto and stablecoins.”

Focusing on regulation has led to increased scrutiny and higher standards for the cryptocurrency industry in Canada.
Naveen Maher, chief compliance officer of Canadian crypto exchange operator WonderFi, noted that the Canadian Securities Administrators (CSA) had closed off the “restricted dealer” registration category. The status was created for targeted firms that do not fit into traditional dealer categories, such as crypto trading platforms. Now they have to become full investor dealers through the CSA, and become members of the Canadian Investment Regulatory Organization (CIRO), a non-profit, national self-regulatory organization.
It led to some consolidation. “That’s a significant shift and it’s removed several players who were sitting in that interim status with a hope that the rules wouldn’t tighten further,” said Maher.
WonderFi “made the call early to get fully registered under CIRO” through its trading platform Coinsquare. This required significant investment and compliance, but now allows the firm to operate “under the highest available regulatory standard in Canada.”
“The firms that delayed that transition are now looking at a much steeper climb,” Maher said.
Policymakers are also finalizing amendments to National Instrument 81-102, the primary Canadian regulation investment funds and mutual funds, including those containing crypto.
“These rules raise the bar across the industry and favor established firms like ours, who already have the infrastructure to absorb them,” Maher said.
Ottawa is also moving to implement the Crypto Assets Reporting Framework from the Organisation for Economic Co-operation and Development. Implementation has been delayed until Jan.1, 2027, but according to Maher, “It will impose annual reporting obligations on every crypto service provider operating […] For other smaller or offshore players, this may be a real issue.”
Rohani told Cointelegraph on Friday that regulators are also enforcing registration requirements more visibly. On Monday, Canada’s Financial Transactions and Reports Analysis Centre (FINTRAC) revoked the money services businesses (MSB) registrations of 47 crypto businesses.
“Industry reaction has been that this is a counterparty risk moment, if your partners are not fully compliant, your own operations are exposed,” she said.
Crypto industry and regulators still have different priorities
Standards for crypto in Canada may have come closer to those governing the rest of the financial industry, but the policymakers and the blockchain industry are still apart on certain issues.
For the government, the big one was stablecoins, according to Maher. “Once the US moved on stablecoin legislation, Ottawa followed.” After stablecoins, everything else points in the same direction, which is bringing crypto into the traditional financial system, on regulators’ timeline,” she said.
Rohani said that “Canada is beginning to treat parts of crypto as closer to the core financial system rather than purely peripheral, but the primary lens is still risk management.”
The stablecoin legislation was part of this latter concern. “This shift is being driven by Carney in response to rapid developments in the US, particularly frameworks like the GENIUS Act, which are viewed as a geopolitical risk.”

Furthermore, the government is “focused on stability, consumer protection, and ensuring that new digital instruments do not introduce systemic risk,” said Rohani.
The industry, meanwhile, is seeking more “clear, workable” rules concerning stablecoins, custody and asset tokenization.
Per Maher, the crypto sector needs harmonization. “Right now, you have FINTRAC, the CSA, CIRO, the CRA [Canada Revenue Agency], and provincial regulators all touching different parts of the same business. The coordination is improving but it’s still fragmented.”
She also noted issues of product access. Stating that Canadians can’t hold crypto in their registered retirement savings plans or their tax-free savings accounts “in any straightforward way.”
Some policymakers still not sold on crypto
In 2018, Carney said that the “underlying technologies” behind crypto “are exciting.” This separation of blockchain from crypto still continues and is visible in the Canadian government’s regulatory approach.
Rohai said, ”There is still a clear distinction. Policymakers are more comfortable with blockchain as infrastructure.” This is exemplified with Project Samara, where Export Development Canada issued a $100 million Canadian dollar bond on Hyperledger.
Policymakers, “remain cautious on crypto assets themselves, which are still viewed primarily through a risk and investor protection lens.”
Maher said that the blockchain/crypto split is “not subtle,” stating that Carney has a preference for central bank digital currencies over decentralized assets.
“This view shapes the administration’s posture which is comfortable with digital assets as a regulated investment category and considerably less comfortable with anything which sits outside that box,” she said.
Financial products which “map cleanly on the existing frameworks” like Bitcoin exchange-traded funds move forward. “DeFi, self-custody, on-chain settlement sits in a different category, and the industry is aware of it.”
Magazine: Are DeFi devs liable for the illegal activity of others on their platforms?
Since draining Japanese crypto platform UXLINK six months ago (and losing a chunk of the proceeds), the hacker behind the attack has been trying to hit it big on-chain.
It’s not going great.
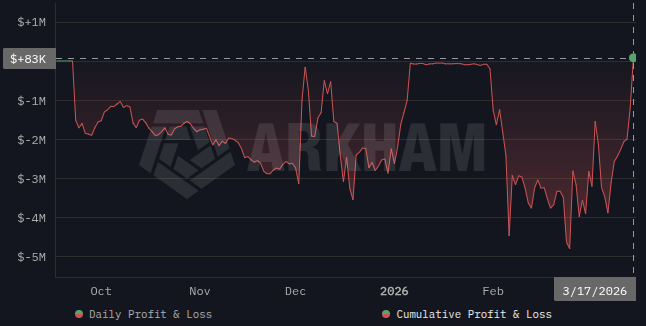
Blockchain analytics platform Arkham has been tracking the hacker’s trading history, highlighting recent ETH sales which brought them back to breakeven.
But given the market over the past six months, one could argue that breakeven is nothing to be sniffed at.
Read more: UXLINK goes from bad, to worse, to weird after hacker loses stolen tokens
The September attack unfolded in two stages. First, UXLINK’s multi-signature wallet was compromised and drained for $11 million worth of assorted crypto tokens.
Hours later, the project’s token contract, which had also been compromised, minted a billion tokens, with a theoretical dollar value in the nine figures.
The drama didn’t stop there, however. While dumping the UXLINK tokens, and cratering its price as liquidity depleted, the hacker fell for a phishing link, losing half the freshly-minted tokens.
Trading with house money
Since then, the hacker’s trading history shows swaps made mainly between the stablecoin DAI and WETH or WBTC.
Arkham’s profit and loss (PnL) calculations put the hacker’s cumulative PnL at $83,000 in the green.
While the gains are small, just 0.2% of the $36.6 million held in the wallets, it’s currently performing better than at any time since the hack.
PnL has been down-only, aside from brief periods of clawing back close to breakeven. But recent weeks have seen a sudden recovery from an all-time low of -$4.8 million in late February.

Read more: Venus Protocol hacker lost $4.7M after nine months of planning
Easy come, easy go
Hackers trading stolen funds have had mixed results in recent years.
Members of North Korea’s Lazarus Group traded the proceeds of 2024’s $50 million Radiant Capital attack, ending up $40 million in profit by last summer.
In October last year, a hacker who previously stole 400 bitcoins from a Coinbase user “panic sold” ether which they had bought with the ill-gotten gains.
During two crypto market crashes, a week apart, they realized a total of $10 million in losses.
Read more: Outdated algorithm caused $650M excess losses on Hyperliquid, report
A slightly more unsettling incident saw Lazarus-linked addresses liquidated for $500,000 on Hyperliquid in late 2024.
While some were happy to see the bad guys get wiped out, others were concerned the activity was testing for a potential future exploit.
Also on Hyperliquid, a wallet linked to the $30 million zKasino “rug pull” in April 2024 suffered a $27 million liquidation a year later.
Got a tip? Send us an email securely via Protos Leaks. For more informed news and investigations, follow us on X, Bluesky, and Google News, or subscribe to our YouTube channel.


Only weeks ago, the interest rate debate in the U.S. centered on just how many Federal Reserve rate cuts there would be in 2026. But as the economy shows only faint signs of slowing, inflation remains above the central bank’s 2% target, and oil prices are up 50% in three weeks, rate traders are beginning to contemplate a rate hike as soon as April.
According to CME FedWatch, the chances of the Fed tightening policy at its next meeting in April have risen to 12%. That’s up from 0% one week ago and an even sharper reversal from two months ago, when the conventional wisdom said a rate cut was likely that month.
February data showed annual headline inflation running at 2.4% and core at 2.5%. And those numbers were prior to the Iran war and subsequent 50% surge in oil prices.
The long end of the bond curve has sold off sharply alongside, with the 10-year U.S. Treasury note up another 10 basis points on Friday to 4.38% versus under 4% at the start of March.
The bond selloff is global. In the U.K., 10-year gilt yields have jumped above 5%, up 15% in the past month, and are at their highest since 2008.
Bitcoin ahead of the curve?
The major stock market averages haven’t made any loud moves since the war began, but the selling is beginning to add up. Down another 0.9% today, the S&P 500 is on track for a fourth straight weekly decline and now lower by more than 5% since late February. The Nasdaq is down similarly, including a 1.2% drop on Friday.
Precious metals — which ran massively higher in the weeks ahead the war — have sold off since. Trading at about $5,500 per ounce at the start of the month, gold on Friday was priced at $4,569. Silver has crumbled to $69.50 per ounce from $95.
“Bitcoin has once again acted as the canary in the macro coal mine,” said Andre Dragosch, European Head of Research at Bitwise. “At current levels, bitcoin is already pricing a recession, while many traditional assets are not,” he added.
Bitcoin continues to hover around $70,000, and — up modestly since the start of March — remains one of the best-performing assets since the war began.
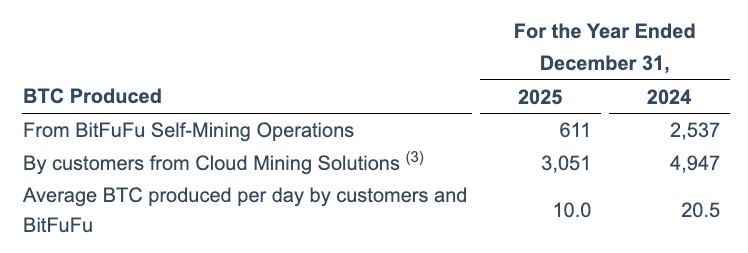
BitFuFu’s 2025 results showed a sharp shift in its business mix, with cloud mining overtaking self-mining as the company’s main revenue driver.
The Singapore-based Bitcoin (BTC) miner reported $475.8 million in revenue for 2025, up 2.7% from a year earlier.
Its self-mining output fell to 611 BTC from 2,537 BTC in 2024, a drop of 76%, while its Bitcoin holdings edged up to 1,778 BTC from 1,720 BTC a year earlier.
The company attributed the change to weaker Bitcoin earnings per terahash, higher mining difficulty and a reduced share of hashrate allocated to self-mining, as it leaned more heavily on cloud-mining products.
BitFuFu said it reallocated hashrate from self-mining to cloud mining following a 52% decline in daily Bitcoin earnings per terahash, driven by higher mining difficulty and a 47% reduction in hashrate allocated to self-mining. Rising Bitcoin prices partially offset the impact.

The company said it shifted hashrate away from self-mining to improve capital efficiency and make revenue more predictable.
Revenue from self-mining fell about 60% to $63.1 million in 2025 from $157.5 million a year earlier.
Cloud mining overtakes self-mining
Cloud mining revenue accounted for around 74% of BitFuFu’s revenues in 2025, amounting to $350.6 million. In contrast, cloud mining accounted for 58.5% of revenue in 2024, when the segment generated $271 million.
The company reported 3,662 BTC in combined annual production across its self-mining operations and customer cloud-mining activity, including 611 BTC from self-mining and 3,051 BTC produced by cloud-mining customers.

BitFuFu said it also increased mining equipment sales, which rose 76% year over year to $53.7 million.
BitFuFu outlines 2026 priorities
Although BitFuFu increased its Bitcoin holdings by just 58 BTC last year, the company said it remains committed to expanding its BTC treasury in 2026.
“Looking ahead to 2026, we will scale our cloud mining business, expand hashrate and power capacity with discipline, and continue building our Bitcoin treasury,” the company said in a statement on X.

BitFuFu CEO Leo Lu said that the company will focus on acquiring mining infrastructure in 2026 and will keep reviewing potential partnership opportunities as part of its vertical integration strategy.
Magazine: The debate over Bitcoin’s four-year cycle is over: Benjamin Cowen


Afroman, the crypto token launched by “Because I Got High” rapper Afroman, has skyrocketed in price after police in Ohio failed to sue him over a series of music videos he made mocking officers who raided his home.
A jury sided with the rapper — real name is Joseph E. Foreman — on Wednesday, concluding a three-year defamation lawsuit launched by police in Adams County.
The legal action stemmed from a police raid on Foreman’s home back in 2022 that resulted in a broken door, confiscation of cash, and a search that failed to find any evidence of suspected drug trafficking and kidnapping.
The Pump Fun cryptocurrency “Afroman,” (ticker symbol $FRO) was launched six months ago, right before Foreman promoted the token on his Instagram account.
Read more: Snoop Dogg quits ‘smoke’ amid NFT, edibles launch rumors
A livestream that showed Foreman dining out was uploaded alongside the crypto token. It pumped to a market cap of $38,000 before falling back to $12,000 on the day of its launch.
However, across the two days leading up to Foreman’s defamation trial victory, the crypto’s market cap pumped 4,685% to a high of $335,000. FRO’s market cap is now over $175,000.
Lawsuit called music videos ‘humiliating’
Foreman was able to capture footage of the raid with his home security cameras, and in response, he created a series of music videos mocking the police deputies in various outlandish ways.
One song called “Lemon Pound Cake” mocked an officer who was recorded looking for a split second at Foreman’s lemon pound cake on the kitchen counter.
“Why You Disconnecting My Video Camera” focused on, if you hadn’t already guessed, the officers disconnecting his cameras during the raid.
“They ran up my driveway with guns and hate, to steal my buns, they just couldn’t wait, I know you want me dead, or in the slammer, but why you unhooking my video cameras?” Afroman sang.
Others were more graphic. One titled “Randy Walters Is A Son Of A Bitch” joked about Afroman sleeping with the wife of one of the officers, and how the officer wouldn’t pay to repair his broken door.
Read more: Crypto rapper Razzlekhan lands new job despite facing 25 years in prison
The officers claimed the videos caused them “humiliation, ridicule, mental distress, embarrassment and loss of reputation.”
In deposition footage, one officer claimed the videos partly caused his ex-wife to leave him. However, when his ex-wife testified in court as the only defense witness brought by Foreman, she said the music videos never affected her marriage or her life.
He also argued that the officers wouldn’t pay for the damages they caused during the raid, and so he created the music videos in an attempt to recoup those losses.
Foreman also argued his right to free speech while dressed in a red, white, and blue suit adorned with the American flag.
After the verdict was handed down, Foreman filmed himself celebrating and shouting, “Yeah! We did it America!… Freedom of speech! Right on, right on, god bless America!”
The rapper had already uploaded a song before the trial’s last few days, singing his own rendition of “The Battle Hymn of the Republic.”
His version is called the “Batteram Hymn Of The Police Whistle Blower.”
It goes, “Mine eye has seen the corruption of the Adam county cops. Stealing money, stealing cake, when they make their traffic stops. First they screw you, then they sue you, play games, then dismiss your claims. The proof’s on the internet.”
Protos has reached out to Foreman for comment and will update this piece should we hear anything back.
Got a tip? Send us an email securely via Protos Leaks. For more informed news and investigations, follow us on X, Bluesky, and Google News, or subscribe to our YouTube channel.

BitFuFu, a Singapore-based Bitcoin mining operator, reported a pronounced shift in its 2025 business mix, with cloud mining eclipsing self-mining as the primary revenue driver. The unaudited full-year results show revenue of $475.8 million, up 2.7% from 2024, while the company’s self-mining output collapsed and its Bitcoin treasury edged higher.
Self-mining output dropped to 611 BTC in 2025 from 2,537 BTC a year earlier, even as holdings rose to 1,778 BTC from 1,720 BTC. BitFuFu attributed the shift to weaker earnings per terahash, higher mining difficulty, and a reduced share of hashrate allocated to self-mining as the company leaned more heavily into cloud-mining products. The firm noted a 52% decline in daily earnings per terahash and a 47% reduction in the portion of hashrate devoted to self-mining, with higher Bitcoin prices partially offsetting the impact. The results were announced in a GlobeNewswire release covering BitFuFu’s unaudited 2025 full-year figures.
BitFuFu said the reallocation of hashrate aimed to improve capital efficiency and revenue predictability as it shifted toward cloud mining.
For context, the company reported total revenue of $475.8 million for 2025, up 2.7% from 2024. The 2025 results come with a notable rebalancing of the company’s production mix, underscoring how operators are adapting to a tougher mining environment while looking to scalable, revenue-stable channels.
Cloud mining overtakes self-mining
Cloud mining emerged as BitFuFu’s dominant revenue stream in 2025, accounting for about 74% of total revenue — roughly $350.6 million — up from 58.5% in 2024, when cloud-mining revenue reached $271 million.
BitFuFu reported combined annual BTC production across its self-mining operations and cloud-mining activity of 3,662 BTC, with 611 BTC produced by self-mining and 3,051 BTC generated by cloud-mining customers. The equipment sales side of the business also surged, rising 76% year over year to $53.7 million.
2026 priorities and strategy
On the treasury front, BitFuFu added 58 BTC to its balance sheet in 2025, bringing holdings to 1,778 BTC. The company reiterated its commitment to expanding its Bitcoin treasury in 2026, even as it pursues a broader industrial strategy. In a statement on X, BitFuFu said it would scale its cloud mining business, expand hashrate and power capacity with discipline, and continue building its Bitcoin treasury.
CEO Leo Lu outlined a plan to focus on acquiring mining infrastructure in 2026 and to evaluate partnership opportunities as part of a broader vertical integration strategy. The company’s emphasis on infrastructure growth and strategic collaborations signals an intent to diversify revenue streams while reinforcing its core mining capabilities.
As BitFuFu navigates the ongoing dynamics of mining economics, investors will be watching how the cloud-mining business scales, how quickly capacity and power can be expanded responsibly, and how effectively the treasury strategy is executed amid evolving Bitcoin prices and network difficulty.
BitFuFu’s unaudited 2025 full-year financial results were released publicly, with the company outlining these shifts and its 2026 roadmap in statements accompanying the earnings disclosure. For further details and exact figures, readers can consult the press release on GlobeNewswire.
Watch next for how BitFuFu balances capital expenditure with treasury growth, and whether cloud-mining demand sustains its lead as the primary revenue engine as market conditions continue to evolve.
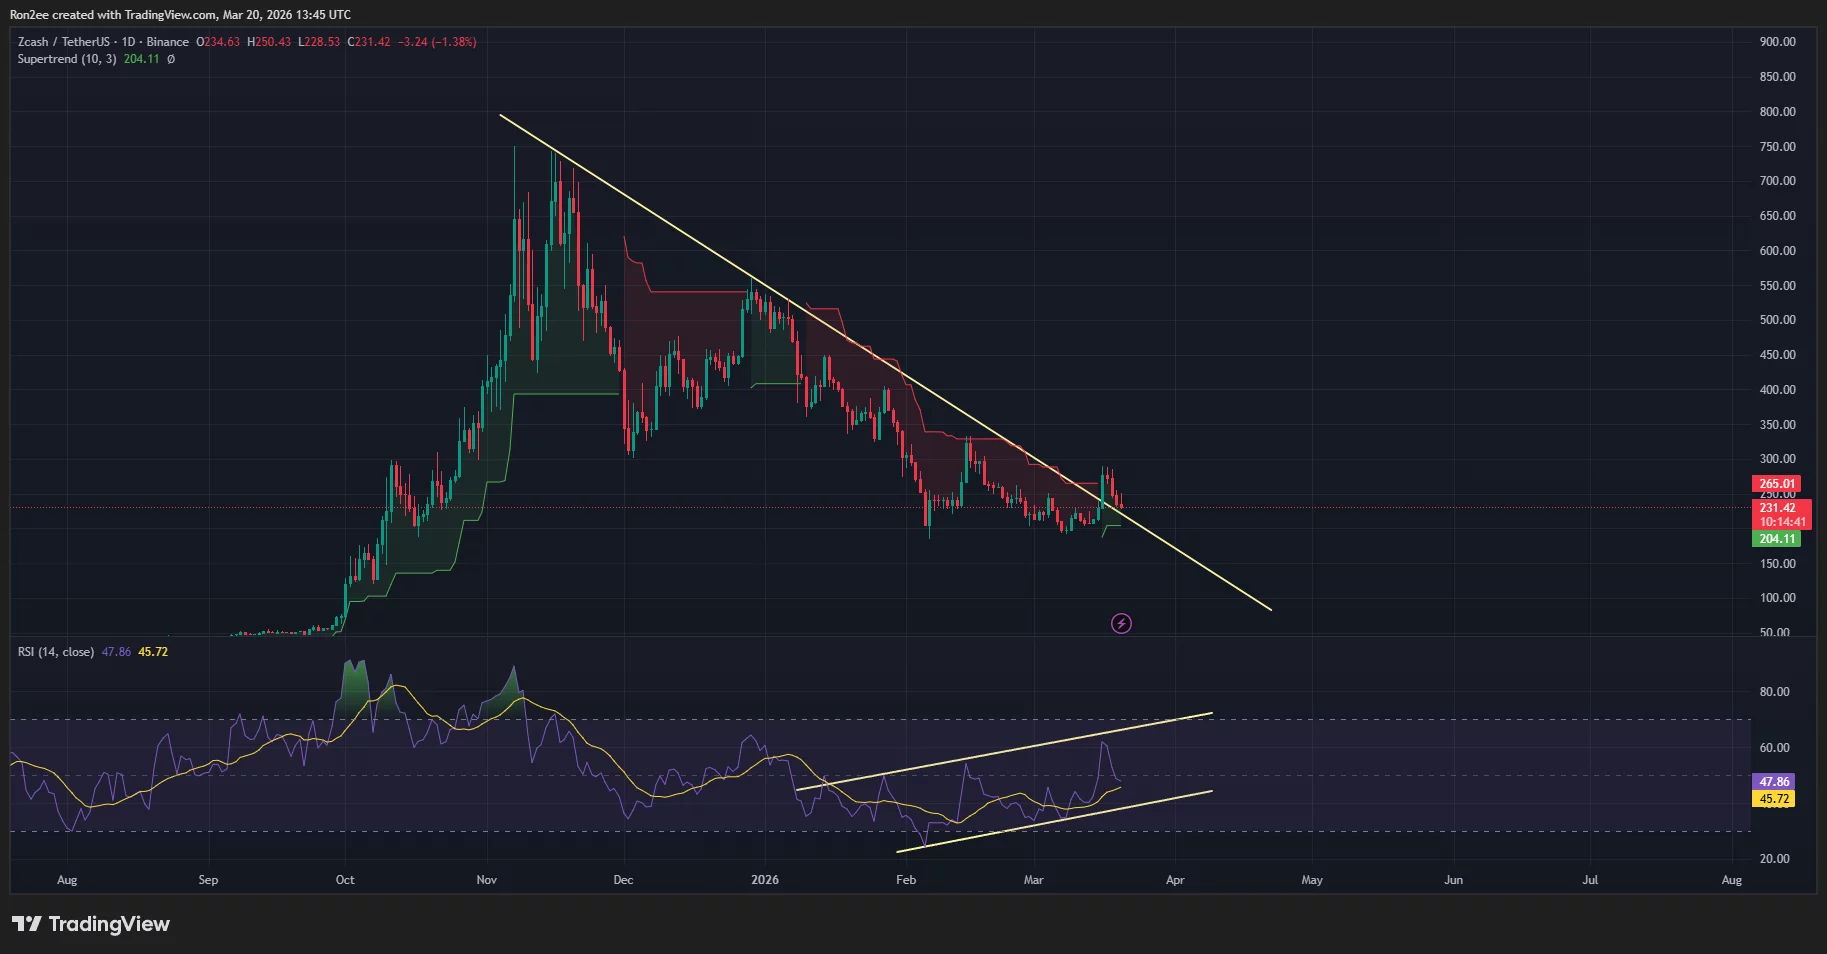
Zcash price fell over 18% from its weekly high to $232, a level that aligns with a key trendline support that could determine whether the current pullback stabilizes or extends further.
Summary
- Zcash pulled back over 18% from a recent high to $232, now testing key trendline support after a broader market-driven selloff.
- Technical indicators, including a green Supertrend and bullish RSI divergence, suggest weakening selling pressure and potential for a rebound toward $265 and $300.
- Rising shielded pool usage and upcoming network upgrades provide fundamental support, though a break below $230 could expose downside toward $200.
According to data from crypto.news, Zcash (ZEC) price shot up to a monthly high of $284 on Tuesday before falling back to $232 at the time of writing.
Zcash price dipped along with the entire crypto market amid a confluence of geopolitical and macroeconomic uncertainty arising from the U.S.-Iran war and the Federal Reserve’s hawkish tone for interest rate cuts for this year, as it points to persistent inflation as a major concern.
Following the recent drop, the second-largest privacy coin by market cap has consolidated near a descending trendline that it had turned into support following its breakout above it this week. If the token manages to hold the line, it could bounce back to test earlier highs. However, failure to hold above the dynamic support could lead to a deeper correction.

Looking at additional technical indicators gives a more grounded view of the possible outlook for the privacy-focused asset. The Supertrend indicator, which helps traders identify prevailing trend directions, has flipped green since Tuesday, a sign that the underlying momentum is shifting in favor of the bulls.
On top of this, the RSI line has formed a bullish divergence with Zcash price since early January this year. A bullish divergence occurs when the price makes lower lows while the indicator makes higher lows. It means that the downward selling pressure is losing its grip despite the falling prices.
Hence, Zcash will likely bounce from the $230 support to $265, the current position of the super trendline, and then to the psychological resistance at $300 if bullish momentum remains strong.
However, if the bearish sentiment prevailing in the broader market latches on to the token’s price action and it loses the $230 support, a drop to $200 becomes a very real possibility.
Zcash price has a few fundamental catalysts lined up that could support the technical recovery.
First, the total amount of Zcash held in shielded pools currently accounts for over 30% of the total circulating supply. A surge in this metric means that a greater number of traders are now engaging with the core functionality of the network. This could attract more institutional interest as privacy becomes a more sought-after feature in the digital asset space.
Additionally, the 2026 roadmap for Zcash includes the Crosslink project, which is a move towards a hybrid Proof of Stake model. This transition is expected to lower sell-side pressure from miners and align the network with institutional ESG standards, potentially opening the door for new capital inflows.
Disclosure: This article does not represent investment advice. The content and materials featured on this page are for educational purposes only.


- Chainlink price hovered near $9.00 on Friday, March 20, 2026.
- LINK spot ETFs recorded their second‑highest inflow day with $3.34 million.
- Bulls could ride fresh optimism to target $14.
Chainlink (LINK) is trading near $9.11 as bulls attempt to hold onto recent gains, with momentum likely to strengthen amid fresh inflows into US spot LINK ETFs.
Data shows exchange-traded fund products tied to the oracle network recorded their second-strongest day of institutional inflows on March 19, 2026.
This came as prices touched lows of $8.90, a move that mirrors the sharp decline in Bitcoin price amid broader market jitters.
LINK spot ETFs record second‑highest inflow day
According to on-chain data provider SoSoValue, US spot ETFs tracking Chainlink (LINK) recorded net inflows of $3.34 million on March 19, 2026.
While modest in absolute terms, the inflows are notable as they represent the second-largest single-day inflow for these products.
The figure trails only the $4.05 million recorded on January 20. Cumulatively, LINK-linked ETFs have attracted nearly $98 million in net inflows.
Analysts say the latest inflows point to renewed institutional appetite for exposure to Chainlink.
Among individual products, Grayscale’s GLNK drew $1.52 million, while Bitwise’s CLNK led with $1.81 million in inflows.
Such spikes in inflows are often associated with improving price sentiment and stronger on-chain liquidity for the underlying asset.
The inflows also come as Chainlink’s infrastructure gains traction.
Amundi, which manages more than €2.3 trillion in assets, recently launched a tokenised mutual fund, SAFO, on the Chainlink network.
𝗟𝗜𝗩𝗘: Europe’s largest asset manager Amundi (€2.3 trillion AUM) & Spiko launch new tokenized mutual fund (SAFO) powered by Chainlink.
Chainlink is how the world’s leading institutions & tokenization platforms are unlocking the issuance & distribution of tokenized funds. pic.twitter.com/2GQshwqCrC
— Chainlink (@chainlink) March 19, 2026
LINK price outlook
The surge in spot ETF demand offers a bullish structural backdrop for LINK’s price.
As noted, fresh capital deployment signals persistent institutional accumulation outside the traditional spot and futures markets.
LINK sits near the upper end of its recent trading range, with the token currently changing hands near $9.00.
This means that further ETF‑driven buying could accelerate a move above key resistance levels.
From a technical perspective, LINK’s daily Relative Strength Index (RSI) hovers in neutral territory near 48.
This suggests that the market is indecisive.

On the upside, bulls retain room for another spike before hitting exhaustion.
Elsewhere, the Moving Average Convergence Divergence (MACD) remains in a consolidating phase, with the histogram flattening.
This shows that momentum is stabilising rather than reversing, and a breakout could materialise.
This aligns with a bull‑flag or ascending channel pattern visible on the daily chart.
The 50-day and 100-day EMAs offer immediate resistance at $9.50 and $10.18 levels. Momentum could bring $14.21 into play.
In the opposite direction, bears could target channel support around $7.78.


Web3 has always been cyclical, yet it has never stopped building. Markets rally and retrace, narratives rotate and evolve, but founders continue to ship products and search for their moment to be seen.
In an ecosystem where launching a protocol or token can happen quickly, standing out is harder than ever. That is where CoinDesk PitchFest has found its role within Consensus.
CoinDesk PitchFest does not replace due diligence, nor does it guarantee funding. What it offers is structured exposure to investors, operators, and ecosystem leaders who are actively shaping the industry. Over the past few years, judges have included representatives from Dragonfly, Fabric Ventures, CoinFund, Borderless Capital, The Spartan Group and Outlier Ventures — firms that have backed some of Web3’s most significant companies.
For early-stage founders, that kind of room matters.
Progress Beyond the Stage
At Consensus Austin 2023, Rise presented a clear proposition: compliant global payroll and payment rails for distributed teams operating across fiat and crypto. The company addressed a practical challenge facing Web3-native businesses navigating cross-border employment.
Since then, Rise has expanded support across more than 90 local currencies and 100 cryptocurrencies, strengthened its compliance capabilities and secured seed funding. Consensus was not an endpoint; it was an early platform in a longer growth trajectory.
That same cohort featured Neuromesh, which later pivoted and re-emerged as AMMO AI, leaning further into the AI x Web3 intersection. Nodepay, a semifinalist, has continued developing its decentralized compute ambitions and expanding within its ecosystem. Early exposure often accelerates refinement.
At Consensus Hong Kong 2025, TransCrypts won PitchFest with its digital identity and fraud mitigation platform. As AI-driven impersonation risks gained attention, the company moved beyond that stage to a significant milestone, closing a $15 million seed round led by Pantera Capital.
Consensus Toronto 2025 introduced ChainPatrol, focused on AI-powered phishing detection and brand protection. While not defined by splashy announcements, the company continues operating across multiple ecosystems, addressing security challenges that grow more complex as platforms scale.
Most recently, zkMe Technology won PitchFest at Consensus Hong Kong 2026 with its zero-knowledge identity verification framework. zkMe had previously closed a $4 million funding round in 2024, reflecting early confidence in privacy-preserving compliance systems. Finalists, including Coinbax, Onchain Labs and Hubble AI, demonstrated the range of ideas competing for attention in Hong Kong.
Across these cohorts, the sectors differ — fintech rails, AI integration, identity systems, fraud mitigation, decentralized compute — but the opportunity remains consistent: a curated environment where investors are listening.
Where Exposure Becomes Momentum
Web3 remains crowded. Tools to launch are accessible; credibility is harder to earn. Breaking through often requires more than a whitepaper or a strong online community. It requires direct access to decision-makers who can evaluate substance.
Consensus brings together early-stage founders, venture investors, exchanges, infrastructure providers, institutional participants and media in one place. Within that ecosystem, CoinDesk PitchFest provides a defined arena for early-stage teams to present clearly and competitively.
The stage does not build the company; the founders do, but the right audience can accelerate progress.
A New Layer: Agentic Commerce and the One-Person Startup
Alongside the core competition, Consensus Miami will introduce a new CoinDesk PitchFest “side mission” exploring early signals at the edge of agentic commerce.
A different kind of founder is beginning to emerge: building with AI agents, emerging protocols such as OpenClaw, and experimental payment standards like x402. What once required teams and capital can now, at least in early stages, be launched, tested and in some cases monetized by a single operator.
These are not traditional startups. They are fast, narrow and increasingly capable, from agent-powered tools to pay-per-call APIs designed to transact as easily with machines as with users. In some cases, products are reaching revenue within weeks, compressing the path from idea to market to a degree previously unattainable.
It is still early. The tooling is evolving, standards are not yet set, and most of these experiments will not scale. But the trajectory is clear, and the pace is accelerating.
For CoinDesk PitchFest, this presents an opportunity to engage with the category as it forms, rather than after it matures. The “side mission” is designed to surface these builders before they resemble venture-backed companies, and to understand which of these early experiments remain niche, and which begin to take on the characteristics of infrastructure.
If the last cycle was defined by protocols, the next may be shaped by what is built on top of them, smaller, faster and increasingly autonomous.
Consensus Miami is where that shift starts to come into focus.
Looking Toward Consensus Miami
Consensus Miami 2026 will once again gather the industry’s full spectrum. For startups under five years old with funding below $5 million, PitchFest offers a practical entry point into that broader marketplace.
It provides exposure to active investors, feedback from experienced operators and visibility through CoinDesk’s global platform. For some teams, it will validate years of work. For others, it will open conversations that define their next chapter.
Web3 continues to move quickly. Founders who want to shape its future need rooms where serious business happens.
Consensus Miami is one of those rooms. CoinDesk PitchFest is where the next wave of builders steps forward.

What Happens to Bitcoin Price if Oil Hits $180 Per Barrel?
“Beauty in Black” actor Xavier Smalls calls LGBT people an 'abomination' that 'God doesn't tolerate' in resurfaced video

Paul Smith + Castore Golf Collaboration Early Access


-
 Crypto World6 days ago
HYPE Token Enters Net Deflation as HyperCore Buybacks Outpace Staking Rewards
-

 Tech5 days ago
Your Legally Registered ‘Motorcycle’ Might Not Count Under Proposed US Law
-

 Fashion7 days ago
Weekend Open Thread: Addict Lip Glow
-
 Tech3 days ago
Are Split Spacebars the Next Big Gaming Keyboard Trend?
-
Sports6 days ago
Why Duke and Michigan Are Dead Even Entering Selection Sunday
-

 Business5 days ago
Search for Savannah Guthrie’s Mother Enters Seventh Week with No Arrests
-

 Business6 days ago
US Airports Launch Donation Drives for Unpaid TSA Workers as Partial Government Shutdown Enters Fifth Week
-
Crypto World6 days ago
Coinbase and Bybit in Investment Talks: Could Bybit Finally Enter the US Crypto Market?
-

 Business4 days ago
Australian shares drop as Iran war enters third week
-

 Business6 days ago
Country star Brantley Gilbert enters growing non-alcoholic beer market
-

 Crypto World4 days ago
Crypto Lender BlockFills Enters Chapter 11 with Up to $500M in Liabilities
-

 Sports7 days ago
College Basketball Best Bets: Conference Tournament Semifinal Picks
-

 Politics2 days ago
The House | The new register to protect children from their abusers shows Parliament at its best
-

 News Videos2 days ago
RBA board divided on rate cut, unusually buoyant share market | Finance Report | ABC NEWS
-

 Fashion4 days ago
25 Celebrities with Curly Hair That Are Naturally Beautiful
-

 Tech11 hours ago
inKONBINI Lets You Spend Summer Days Behind the Register
-

 Crypto World2 days ago
Canada’s FINTRAC revokes registrations of 23 crypto MSBs in AML crackdown
-
 Politics3 days ago
Real-time pollution monitoring calls after boy nearly dies
-

 Crypto World6 days ago
Crypto Losses Drop 87% in February, But Hackers Are Now Targeting People, Not Code
-
 NewsBeat2 days ago
Residents in North Lanarkshire reminded to register to vote in Scottish Parliament Election


You must be logged in to post a comment Login