
Crypto World
Speculative demand keeps Bitcoin under $68.7K

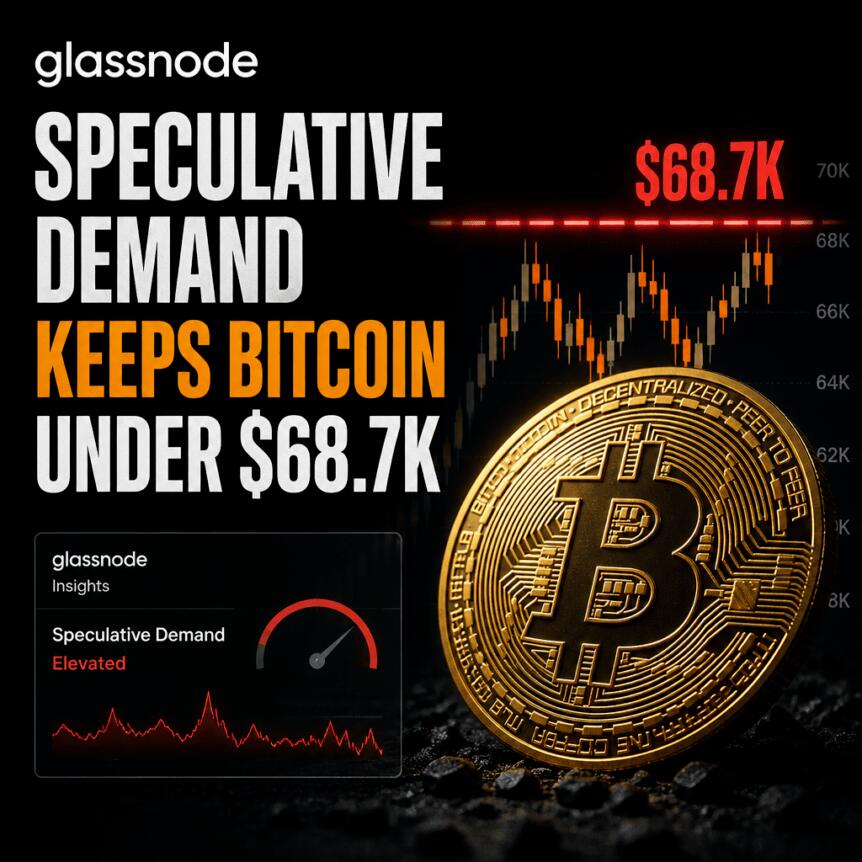
Bitcoin has remained trapped in a tight trading band since early June, and on-chain data suggests the latest pressure is coming from short-term holders trying to exit around levels where they’re closest to breakeven. Glassnode’s latest weekly on-chain analysis points to realized-price “resistance” formed by speculative investors who bought within the past six months, while Bitfinex Alpha highlights how a concentrated supply slice is repeatedly flipping between profit and loss as spot trades inside the range.
With BTC/USD stuck between roughly $58,000 and $68,000, the market appears to be working through a recurring pattern: rebounds are being met by holders looking to reduce exposure, even as long-term participants continue to absorb repeated tests from below. For traders, the key question is whether the speculative selling pressure can finally be exhausted—or whether the range simply persists.
Key takeaways
- Glassnode estimates Bitcoin short-term holders are about 7.2% underwater overall, with an average realized cost basis near $68,700 acting as a notable resistance level.
- Glassnode frames the “cost-basis ladder” as a structural reason price struggles to break out, citing the median realized price near $63,000 as a level that has absorbed repeated upward attempts for weeks.
- Bitfinex Alpha says a large tranche of supply—1,794,308 BTC—currently sits in the $62,000 to $65,000 cost-basis band, reinforcing stubborn range boundaries.
- As BTC trades within the same $3,000 band, the largest concentration of holders keeps moving between profit and loss, increasing turnover and reinforcing the range dynamic.
Why short-term holders are pushing back at range highs
In its latest weekly edition, Glassnode focused on the behavior of short-term holders (STHs)—investors who acquired BTC within the last six months. The firm reports that this cohort remains roughly 7.2% underwater in aggregate, based on its cost-basis measure (realized price). Glassnode places that realized cost basis at $68,700, a level it describes as central to why price is stalling around the upper part of the current range.
Glassnode also points to how realized-price “rungs” map into the market’s ongoing stalemate. The analytics firm notes that spot prices are sitting just above the median realized price (around $63,000), which it characterizes as the midpoint dividing coins’ cost bases into higher and lower halves. That same median level, according to Glassnode, has “absorbed every test from above for more than a month,” even as broader range conditions have persisted.
“The cost-basis ladder frames the stalemate. Spot sits just above the Median Realized Price at $63.0K, the level that splits every coin’s cost basis down the middle, and below the Short-Term Holder Cost Basis at $68.7K, the average entry of the market’s most recent buyers.”
“That cohort is underwater, which historically makes it quick to sell into recoveries, while the median level has absorbed every test from above for more than a month.”
In other words, the market’s upper breakout attempts are meeting sellers who are not yet fully “whole,” but who still have incentives to lighten exposure during recoveries—especially as they approach their average cost basis. This dynamic can slow or prevent sustained upside momentum, particularly when buyers and sellers are evenly matched across a narrow price corridor.
BTC/USD stuck in a June-to-present range
Glassnode’s analysis aligns with the broader price picture. BTC/USD has been boxed in a near three-month range between approximately $58,000 and $68,000 since the start of June. Cointelegraph previously described the ongoing tug-of-war inside this corridor, noting that technical factors have helped keep price contained.
A separate theme in current commentary is the idea that downside resolution may be increasingly likely in bear-market-style conditions. Cointelegraph cited a 50-month trend line near $65,800 as a factor contributing to tighter constraints in the trading range.
More recently, trader and analyst Rekt Capital warned that $63,000 appears to be weakening as local support, with each rebound from that level reportedly gaining less traction. While such technical commentary cannot determine direction on its own, it reinforces what Glassnode’s on-chain framing implies: repeated attempts to move upward may be repeatedly checked, while key levels near the middle of the range are not strengthening decisively.
Supply concentration in the $62,000–$65,000 band reinforces resistance
Beyond holder psychology, Bitfinex Alpha argued that the “stubborn” boundaries of the range are also tied to ownership distribution on-chain. In a Wednesday report, Bitfinex Alpha pointed to a distinct cost-basis concentration using the UTXO Realised Price Distribution (URPD) framework. According to Bitfinex Alpha, the $62,000 to $65,000 band holds 1,794,308 BTC at that cost basis—equivalent to 8.93% of circulating supply.
URPD tracks the price at which coins last moved on-chain, offering a way to visualize where large amounts of BTC are “anchored” by prior transaction activity. Bitfinex Alpha highlights that the largest holdings within this narrow band sit around $63,800.
“With price trading inside this band, the largest concentration of holders across any narrow $3,000 range keeps moving between profit and loss and a large volume of coins changes hands as a result,” Bitfinex added.
The implication for spot action is straightforward: when a large share of BTC is concentrated in a relatively tight realized-cost window, small price moves can shift many holders’ positions from paper gains to paper losses and back again. That can produce a market that repeatedly churns—active enough to avoid a clean bottom, but structured enough to limit breakouts.
What to watch next: the $68,700 and $69,400 thresholds
Glassnode’s analysis places the short-term holder realized cost basis near $68,700 as a key level for any upside attempt to clear. Meanwhile, Bitfinex Alpha notes that immediately above the current STH cost basis is a psychologically significant marker: Bitcoin’s old all-time high of $69,400 from November 2021.
For investors and active traders, the immediate watch is whether price can build momentum through the $68,700 area without quickly being met by STH-led supply. If it fails, the odds favor continued range behavior—particularly given how the $62,000–$65,000 cost-basis concentration encourages frequent position flipping. If BTC does manage to reclaim and hold above those thresholds, the market would need to demonstrate not just a rebound, but an ability to convert the speculative cohort’s behavior from selling pressure into net demand.


Four years ago, Gregory Robinson wanted nothing to do with what might be the greatest spacecraft ever built. It didn’t, at the time, seem like it would ever actually become what it was promised to be: a machine that would take images from space, return them to Earth, and gobsmack the public with their clarity and depth and sheer celestial beauty—the kind of beauty that could, even briefly, stop a fraught and fractious species like ours from the daily messes we make of our world and leave us thinking, just once, You know what? When we try, we can do something truly grand.
What the spacecraft did seem like at the time was a massive white elephant, one that a man in Robinson’s position would not want to go near. For one thing, it was grossly over budget—with a sticker price that had risen from an initial estimate in 1995 of just $500 million to $8.8 billion. For another thing, it was years behind schedule. Its launch was originally set for 2007, and here it was the spring of 2018 and still nobody could say exactly when it would leave the ground. And finally, Robinson, who was at the time NASA’s deputy associate administrator of programs, liked the job he had just fine—overseeing no fewer than 114 NASA spacecraft either already flying or in the development pipeline.
And now, here came his boss, NASA associate administrator Thomas Zurbuchen, offering him a dog of an assignment: give up all of those fine spacecraft with their fine missions, and take over as program director of the James Webb Space Telescope—a generational project, yes, but with many blown deadlines and bloated costs and all the headaches that came with them. The telescope’s launch, at the time, was set for less than half a year away—October 2018—and once again it looked as if it would miss its target.

“We have some major challenges,” Robinson recalls Zurbuchen saying to him. “We’re starting to realize we may not make our launch date.” Zurbuchen then got to his point, asking—more like insisting, as Robinson recalls it—that he take over the reins of the project. “You’re the right guy to do it,” Zurbuchen said. “We’ve looked at a lot of different people, and you’re the right guy.”
Zurbuchen was impressed not just by Robinson’s technical acumen, but also his skills with a workforce. “The majority of problems we encountered with Webb during its [previous] six years were people and team problems,” Zurbuchen said in an email to TIME. “Technically, most issues had been resolved, but the team had struggled to come together and execute seamlessly. This is where Greg’s strengths really lie. He can walk into a meeting or launch room and walk out knowing what the energy of the team is, and also what hinders their progress.”
All the same, Robinson resisted the Webb offer for weeks before ultimately relenting to Zurbuchen’s entreaties. Four years on, the decision looks like an eminently good one. The seven-ton James Webb Space Telescope, with its prodigious 6.5-m (21.3 ft.) main mirror, is now situated in space 1.6 million km (1 million miles) from Earth, peering deeper into the universe, and thus further back in time, than any other space observatory ever built. If the Hubble Space Telescope has been NASA’s astronomical workhorse for more than 30 years, the Webb is the newer, grander, more powerful racehorse.
“Until Webb, Hubble was the best in the business,” says Robinson. “But to see the clarity, the differences in the images we’re getting now, it just blows my mind.”
The public’s awed reaction has mirrored Robinson’s own; the Webb telescope has come to represent something larger and grander than all of us. The long effort to get the spacecraft built, the mission it was assigned—searching for clues to the very origins of the universe—have worked a certain transcendent good. From the hands of a team of thousands of researchers, engineers, and factory-line workers came a ship that, if it doesn’t exactly kick open the doors to the secrets of the cosmos, at least parts the curtain. “This beautiful machine,” says senior project scientist John Mather, “has worked in every way that it was supposed to work.”
That beautiful work Webb is doing is a function of the wavelength in which its mirror sees the universe. Hubble scans space principally in the visible spectrum—the same wavelength with which the human eye sees. That allows it to peer 13.4 billion light-years away, seeing light that has been traveling to us for 13.4 billion years—or just 400 million years after the Big Bang. But Hubble is blind to what happened in that critical earlier phase of the universe’s infancy, because visible light from so far away can’t penetrate the intervening dust of interstellar space.
Infrared radiation, however, cuts right through the dust, allowing a telescope that, like Webb, detects energy in that frequency to see as far as 13.6 billion light-years distant. The additional 200 million years seems like a small difference, but it’s not.
“The difference between what Hubble and Webb [see] is not like comparing someone who’s 70 years old to somebody who’s 71 years old,” said Scott Friedman, an astronomer with the Webb team, in a conversation with TIME last year. “It’s like comparing a baby who’s 1 day old to a baby who’s 1 year old.”
Hubble, launched in 1990, had been in space for no more than five years before NASA began drawing up plans for an infrared observatory that was then called the Next Generation Space Telescope. The idea was a bold one, but it seemed snakebit from the start. Nobody had ever built a telescope like this before, and the research and development process was slow and painstaking, with the original half-billion price tag climbing steadily over the years—to $1 billion in 2000; $2.5 billion in 2004 (by which point the telescope had been renamed in honor of former NASA administrator James Webb); $4.5 billion in 2006; $8 billion in 2011; and $8.8 billion when Robinson took over in 2018.

That made Robinson’s job a potentially thankless one, but he was not working alone. At the time he took command of the project, NASA had already empaneled an independent review board to help set Webb to rights at last. Working with the board, Robinson improved the project’s efficiency rating—a ratio of scheduled tasks to completed tasks—from 55% to 95%. He also made the process more transparent, holding regular meetings with the White House Office of Management and Budget as well as appropriations committees in both houses of Congress.
And Robinson made it a point to tell some hard truths: Webb, he frankly conceded, was going to be later still—not launching until the end of 2021—and would cost more still, with a final price tag of $10 billion. But those would be the drop-dead limits.
“I tried to be a little more realistic,” Robinson says. “We tend to come into these things with a hero syndrome, and that can get you into trouble. I tried to institute better schedules, better milestones. Our rule was ‘Go fast, but don’t rush.’”
On Christmas Day 2021, the James Webb Space Telescope at last left the ground, aboard a European Space Agency (ESA) Ariane 5 rocket launched from Kourou, French Guiana, in South America. Hitching a ride with the ESA was a necessity because of the Webb’s size—which is too big for any rocket in the American fleet. Only the Ariane 5’s 5.4-m (17.7 ft.) fairing could accommodate it.
Launching from French Guiana came with its own challenges. Robinson and the rest of the NASA team were on-site for three weeks before liftoff as the telescope was loaded into the rocket and countdown rehearsals were run again and again. The jungle environment required the crew to take anti-malarial pills, tolerate ants in the hotel rooms, and stay alert to the stray jaguar that would appear on or around the launch site.
“One night, one of our engineers came back to his hotel and found a 6-ft. snake in his room,” says Bill Ochs, Webb’s now retired project manager.
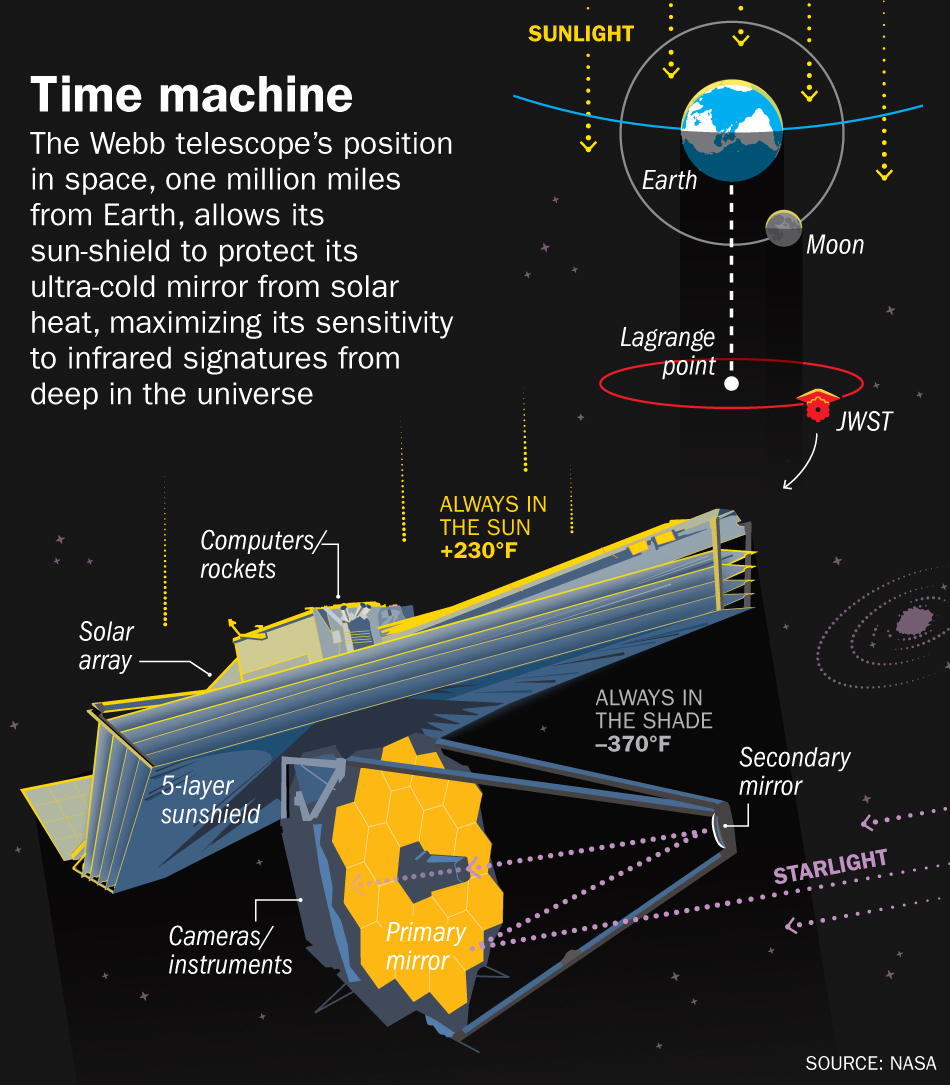
Once in space, the telescope required three months before it could unfold its mirror and bring all of its observation instruments online. The process required successfully overcoming 344 so-called single-point failures—a pulley or actuator or switch that, if it went awry, could all by itself doom the mission. The biggest challenge involved unfurling the Webb’s tennis-court-size sunshield—a structure made of five layers of foil-like Kapton that keeps the temperature of the telescope’s mirror and instruments at a frigid –223°C (–370°F). That bitter temperature is necessary to prevent stray heat from distorting Webb’s infrared images the way stray light can ruin optical pictures. All 344 single-point failures worked perfectly and at last, in March 2022, the telescope switched on its 6.5-m eye and captured its initial image.
For that first picture, engineers at Webb’s mission-control center at the Space Telescope Science Institute (STScI) in Baltimore turned the telescope toward an entirely unremarkable star that goes by the decidedly technical name TYC 4212-1079-1. The choice was a practical one: TYC 4212-1079-1, some 2,000 light-years from Earth, has no nearby neighbors, allowing Webb to focus on it alone.
At first the image was a mess, with all 18 of the mirror segments capturing their own image of the star. “Imagine an a cappella chorus where everyone has their own key and their own song,” says Webb’s operations project scientist Jane Rigby. But over the course of several days the team focused the mirror, adjusting the position of each segment on the order of nanometers—less than the width of a human hair—until the 18 blurred images resolved into a single, impossibly bright and sharp one, with hundreds of galaxies photobombing it in the background.

“I can tell you that I’ve worked with geeks my whole life, and there was no better scene,” says Robinson, who was at the STScI at the time. “To see a bunch of people just falling over themselves with joy, it was a beautiful thing. I’m glad I was a part of it.”
In July, the whole world got to experience a similarly sublime moment when the Webb team unveiled four eye-popping images, including a field of galaxies known as SMACS 0723; the Carina Nebula—one of the cosmos’ great nurseries for new stars—located 7,600 light-years from Earth; and Stephan’s Quintet, a cluster of five galaxies first imaged by more primitive telescopes in 1877. The big reveal took place at a White House event attended by multiple members of the Webb team.
“These images are going to remind the world that America can do big things, and remind the American people—especially our children—that there’s nothing beyond our capacity,” President Joe Biden said during the event. “We can see possibilities no one has ever seen before. We can go places no one has ever gone before.”
With that early hoopla passed, the telescope has now entered its operational phase and is settling down to do more than just deliver eye candy. Astronomers from around the world who want to conduct research on the telescope are invited to submit proposals for observation time, and the Webb team expects to receive 1,000 such pitches per year—with only enough telescope time available to accommodate about 200 of them.
Despite that selectivity, Robinson—who has since retired, calling Webb the “capstone” of his career—sees the telescope as very much a democratic instrument. It may be owned and operated by NASA, but, Robinson says, “29 states in the U.S., 14 countries, and over 10,000 people touched this telescope.”
Write to Jeffrey Kluger at jeffrey.kluger@time.com.
Bitcoin price analysis shows the asset trading at $62,852.52 today, down 0.89% over the past 24 hours, a pullback that puts the market’s recent optimism to the test. There’s more beneath the surface than the headline number suggests, and it involves an increasingly stubborn divergence between macro data and the actual flow of institutional money.
Thursday’s PPI print came in cold: flat month-over-month against an expected 0.2% gain, with the annual rate at 4.7%. Jobless claims ticked up to 209,000 from a revised 200,000.
Combined with the softer July CPI, the data pushed September rate-hike odds down to roughly 32-35% from 41% the day prior, textbook bullish fuel for risk assets. BTC shrugged it off anyway. That’s the tell.
US spot Bitcoin ETFs posted a second straight day of net outflows, $131.1M on August 13 following $61.1M the day before, with Fidelity’s FBTC, ARKB, and GBTC among the biggest bleeders. Options positioning has also skewed toward the defensive, with implied volatility clustering around $60,000 downside strikes ahead of the August expiry, a sign that traders are hedging rather than chasing.
Bitcoin Price Analysis: Can BTC USD Hit $64,000 This Week?
BTC is pinned inside a $62,000–$66,000 consolidation band, with TradingView’s technical panel reading a flat-out sell signal, RSI at 47, and price sitting both the 10-day EMA ($63,948) and SMA ($64,198) below.
Immediate support sits near $62,250; a break there opens the door toward $61,000-$60,000. On the flip side, reclaiming $64,400 would flip momentum and put the $66,000 resistance zone back in play.
Bull case: ETF outflows stabilize, BTC reclaims the mid-$64k zone, and short covering drives a push toward $66,000.
Base case: continued chop inside the range while flows stay net-negative.
Bear case: a decisive break below $62,250 accelerates toward $60,000, especially if large custodial transfers add fresh supply pressure.
Notably, long-term holder supply fell for the first time in 2026 even as wallets holding 1,000+ BTC hit a yearly high, a split market, not a unified one. Worth watching before committing capital either direction.
EXPLORE: Your Market Calls Are Worth Something. Start With Free $25 on Kalshi
LiquidChain Targets Early Mover Upside as Bitcoin Tests Key Levels
BTC bulls keep getting handed favorable macro data and keep failing to capitalize; that pattern is starting to look less like noise and more like fatigue.
For traders sitting on spot BTC through this chop, the frustration is real: even a clean bounce off $62,250 support is likely to cap out well below prior highs, given Bitcoin’s market cap. Diminishing returns at scale is the tradeoff for holding the market leader.
LiquidChain ($LIQUID) is pitching a different bet entirely, a Layer 3 infrastructure play that fuses Bitcoin, Ethereum, and Solana liquidity into a single execution environment.
The presale sits at $0.0149 per token, with $939,039.33 raised so far. Its “deploy-once” architecture lets developers build once and reach all three ecosystems natively, backed by what the team calls verifiable settlement and single-step execution.
DISCOVER: Everyone’s Got a Take. Get Free $25 to Actually Trade Yours
The post Bitcoin Price Analysis: Can BTC Hit $64K This Weekend? appeared first on Cryptonews.
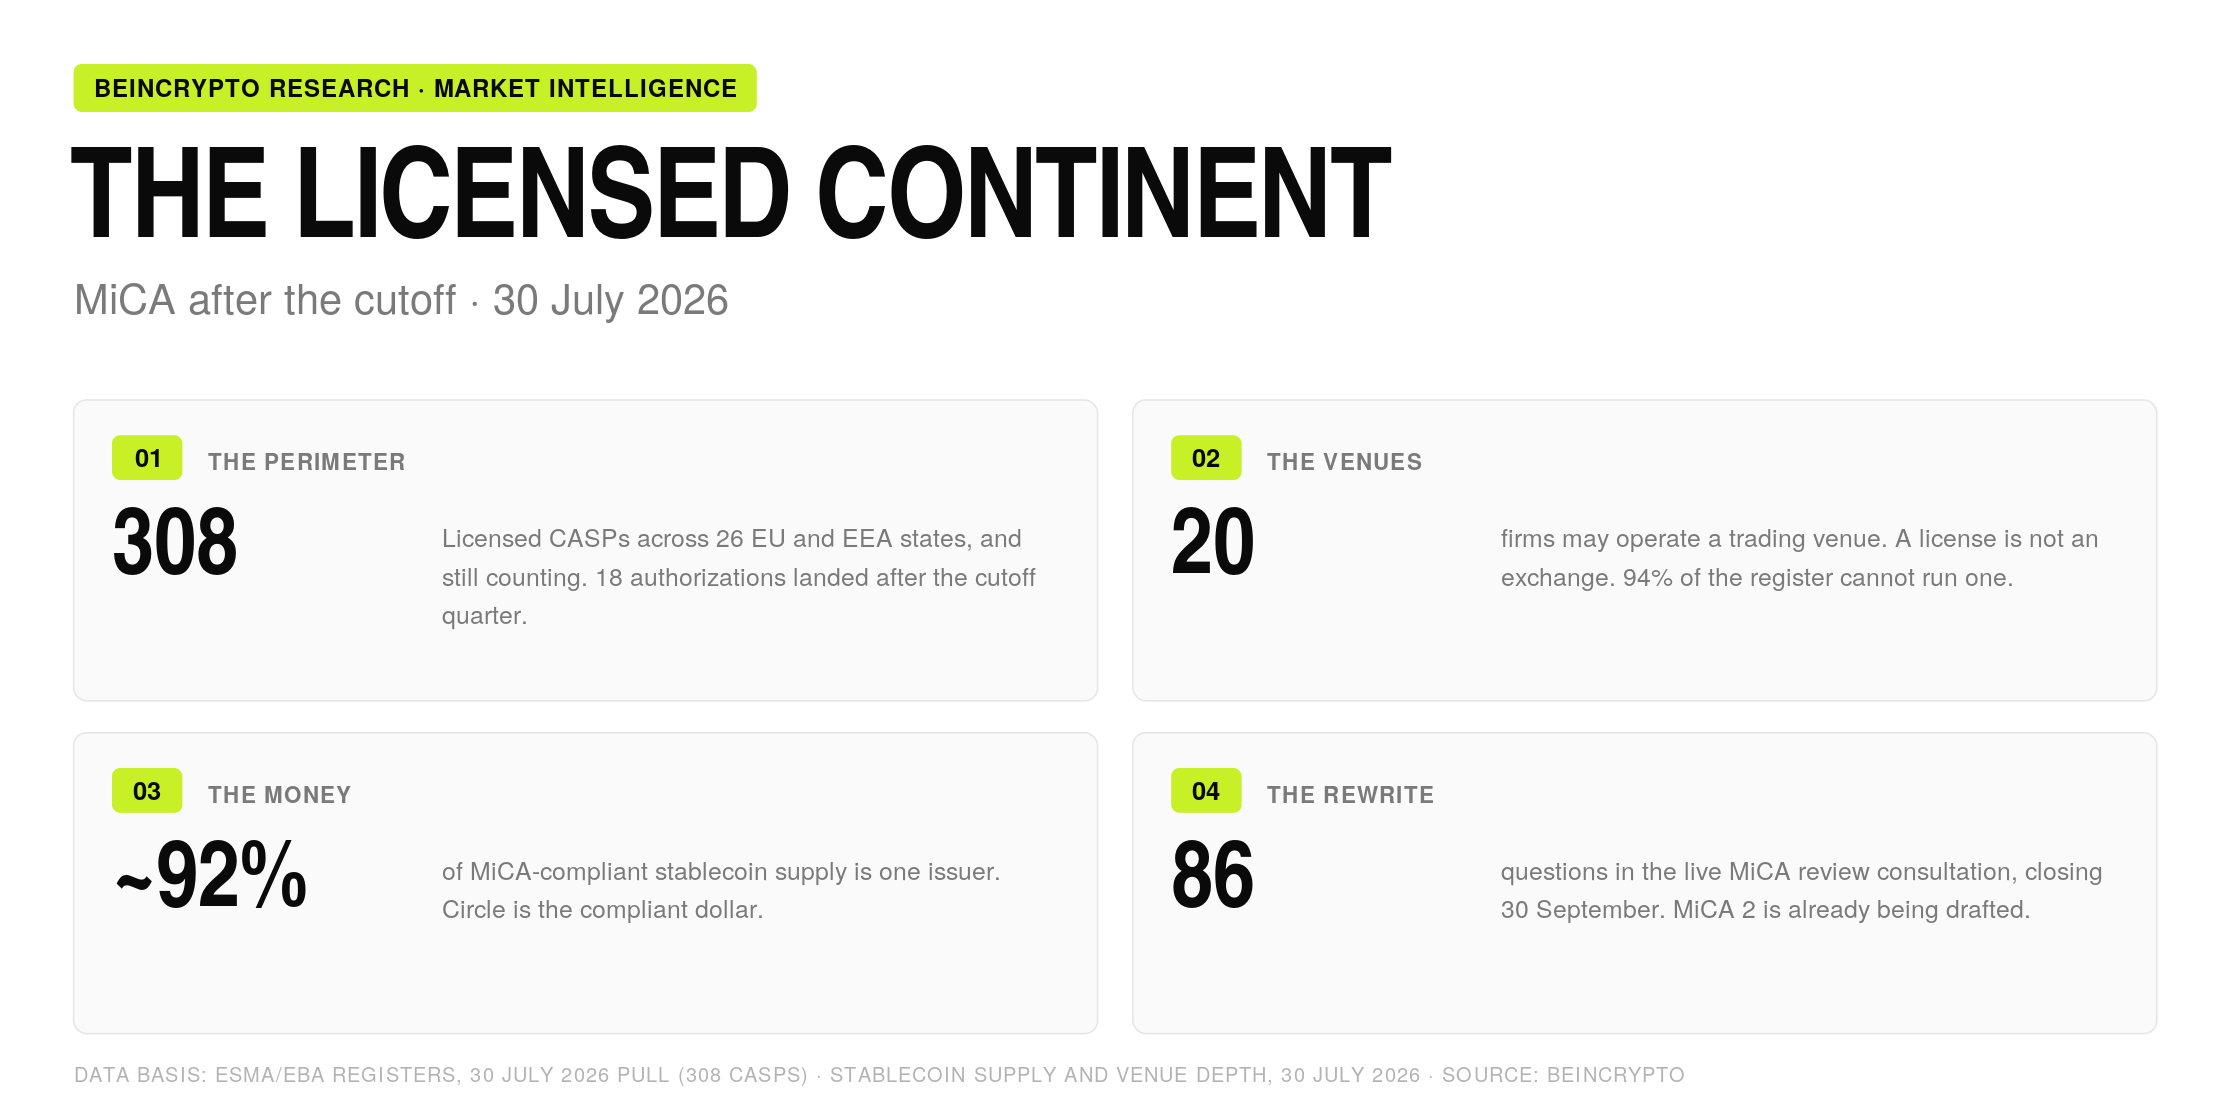
BeInCrypto’s review of Europe’s licensing register finds a market led by custody firms and banks. Trading-venue permissions remain rare, Circle dominates compliant stablecoin supply, and enforcement is concentrated in one country.
Europe’s crypto transition period ended on 1 July 2026. Roughly forty days later, the licensed market is still taking shape.
The European Securities and Markets Authority register, updated on 12 August, contains 329 authorization rows. They represent 324 identifiable legal entities because several firms appear more than once when permissions are added, or records are duplicated.
That distinction changes how the market should be read. Europe has created a sizeable regulated perimeter. The practical market inside it is much narrower. Only 21 entities can operate a trading venue, while custody and transfer permissions dominate.

The later register also confirms the larger finding from BeInCrypto’s original research. Banks secured a meaningful share of the licenses.
Circle supplies about 92% of the tracked MiCA-compliant stablecoin market. National regulators have applied the same EU rulebook in sharply different ways.
Data note: The graphics preserve BeInCrypto’s original 30 July snapshot, when the register contained 308 rows. The article text incorporates the ESMA update published on 12 August. ESMA publishes weekly and relies on submissions from national authorities. One German row carries a future authorization date of 28 August and was excluded from time-series comparisons.
The Register Lists 324 Firms, and Only 21 Can Run a Trading Venue
MiCA replaced national registration systems with a common authorization. A firm approved in one European Economic Area state can notify other markets and serve them without applying for a full license again.
The license covers ten separate crypto services. BeInCrypto normalized the latest ESMA service descriptions, which are not formatted consistently across national submissions.
Custody is the largest category, held by 218 of the 324 legal entities. Transfer services follow with 203. A total of 181 can exchange crypto for government-issued money, while 168 can execute orders for clients.
The permission to operate a trading platform sits near the bottom. Only 21 entities hold it, equal to 6.5% of the licensed market. The other 303 entities may provide services such as custody or brokerage, but they cannot run an order book that matches buyers and sellers.

This is why the headline license count can mislead. A crypto app may be authorized to exchange assets with customers from its own inventory while lacking permission to operate an exchange venue.
The market also splits between domestic specialists and firms seeking the full passport. In the latest file, 142 entities notified at least 27 target markets, about 44% of the register.
“Most of those authorizations are for narrower services: custody, brokerage, transfer, portfolio management and advice. In practice, EU spot liquidity is going to sit with a handful of names,” said Vyara Savova, senior policy lead at the European Ethereum Institute.
Most Old VASP Registrations Did Not Become MiCA Licenses
MiCA authorization is much heavier than the previous Virtual Asset Service Provider, or VASP, registrations. The old systems focused mainly on anti-money-laundering checks. MiCA adds scrutiny of capital, management, custody controls, and operational resilience.
BeInCrypto’s industry estimates place the initial legal and advisory work at €40,000 to €150,000. Compliance build-out can add €20,000 to €80,000. Technology work linked to the EU’s Digital Operational Resilience Act can cost a further €30,000 to €80,000. Recurring annual costs can reach €150,000 to €500,000.

James Harris, CEO of MiCA-authorised institutional asset manager Tesseract Group, said the fixed compliance burden falls hardest on smaller firms.
“A twenty-person firm has to build the same DORA, Travel Rule and AML stack as a three-thousand-person exchange. Authorisation as a CASP is something like ten to fifteen times harder than operating as a VASP,” said James Harris, CEO of MiCA-authorised institutional asset manager Tesseract Group.”
Europe’s wider VASP population once approached 2,700 registrations. Industry estimates place the active pre-MiCA market closer to 1,200. Those figures are different populations and cannot produce one precise conversion rate. Compared with 324 licensed entities today, they indicate that roughly three-quarters to almost nine-tenths of the previous market did not enter the new regime.
Authorizations arrived in deadline-driven waves. The original dataset recorded 81 in the fourth quarter of 2025 as Germany approached its earlier national cutoff.
Another 102 arrived in the second quarter of 2026. The August register contains 34 entities with authorization dates on or after 1 July, although some were reported to ESMA later than their approval date.

The 1 July deadline therefore closed the legal transition without freezing the register. National authorities are still approving firms and sending older decisions to ESMA.
Binance Remains Outside The Register
Most large global platforms found a European base. Kraken authorized through Ireland. Coinbase and Bitstamp chose Luxembourg. OKX, Crypto.com, Gate, and Gemini appear through Malta. KuCoin and Bybit appear through Austria.
Binance remains absent from the 12 August CASP file. The company entered 1 July without a visible EU authorization and still has no matching register entry.

The names also illustrate the difference between a service license and a venue license. Kraken and Bitstamp hold the trading-platform permission. Several other well-known platforms appear with custody or exchange permissions and no authority to operate a MiCA trading venue.
Absence from the register does not by itself prove that a company is serving EU customers illegally. It shows that ESMA’s published records contain no matching MiCA authorization.
Three Countries Now Hold 41% of the Licensed Market
The passport created one legal perimeter, while licenses clustered in a small number of national hubs.
The 12 August register contains 70 German legal entities, 34 French entities, and 29 Dutch entities. Together they account for 133 of 324, or 41% of the market. Using raw register rows gives a similar result: 137 of 329.

Greece, Hungary, Poland, and Romania still have no authorized CASP in the ESMA file. Portugal left that group in July when its first entity appeared. Poland’s position reflects a stalled domestic implementation process, which has pushed local firms to seek authorization elsewhere and passport back into the market.
Token disclosures form a different map. ESMA now lists 960 white papers for crypto-assets other than stablecoins. Ireland accounts for 362, Malta for 159, and Germany for 146. A white paper is a disclosure filed by the offeror or issuer; ESMA states that national authorities have not reviewed or approved the documents.

Germany shows how the authorization threshold changed the mix of firms. In BeInCrypto’s 30 July classification, 29 of 63 German register entries were bank-named entities. The latest file contains 23 regional cooperative banks, up from 16 in that original snapshot.

Banks entered through custody and execution
Across Europe, BeInCrypto’s original classification identified 49 bank-named entities among 308 register rows. The group included Commerzbank, DekaBank, CACEIS, and Clearstream. CaixaBank and KBC were also present.

Their permissions point toward asset servicing. Banks entered through custody, transfers, and client-order execution. Very few operate a crypto trading venue.
Germany’s cooperative banks make the change easier to see. These are regional institutions serving local customers. Their entry suggests that crypto custody is moving into ordinary banking infrastructure.
Sabina Liu, managing director at KuCoin EU, said banking relationships are becoming a measure of operational maturity because regulated institutions require strong governance and controls from their partners.
“Strong banking partnerships are a reflection that you have met the standards expected by regulated financial institutions, including around governance and controls”, said Sabina Liu, managing director at KuCoin EU.
The shift also changes the competitive question. Crypto-native firms still supply most consumer-facing products. Banks now control more of the custody and settlement infrastructure that those products need to operate inside the regulated market.
Circle Supplies about 92% of MiCA-Compliant Stablecoins
The 1 July cutoff had little visible effect on global stablecoin supply. The main market adjustment happened earlier, when European venues removed or restricted non-compliant tokens during 2024 and early 2025.
BeInCrypto’s 30 July classification tracked $78.9 billion issued under MiCA-compliant arrangements and $193.1 billion without an EU authorization. Circle’s USDC and EURC supplied about $72.7 billion of the compliant total, close to 92%.

That concentration remains broadly intact. DefiLlama data retrieved on 14 August placed USDC near $72.0 billion and EURC at €463.6 million. USDG stood near $3.41 billion.
USDT remained much larger globally at about $183.0 billion, even though it lacks a matching MiCA issuer authorization.

The original 90-day sample found USDG growing 34% while several larger compliant coins contracted. Its smaller starting base explains part of that rate.
USDG accounted for roughly 4% of the compliant pool, so the growth signaled diversification without threatening Circle’s lead.

The euro segment continues to grow. The four largest tracked euro coins, EURC, EURCV, EURI, and EURe, held about €694 million on 14 August, worth roughly $800 million at current prices. The original 30 July snapshot placed the rail near $773 million.

The latest ESMA file contains 43 e-money-token white papers from 23 named issuers and no authorized asset-referenced token issuer. An e-money token tracks one official currency. An asset-referenced token can track a basket of currencies or other assets and faces a higher regulatory threshold.
The issuer list is deeper than the live market. It includes bank-backed projects and specialist electronic-money firms, yet supply remains concentrated in a few established tokens. The register measures permission to issue; circulation data shows whether a token has found users.
MiCA-compliant tokens now dominate the tracked euro market. A residual €4.8 million of Tether’s EURT remains visible in DefiLlama data, so the on-chain supply has not fallen completely to zero.
A License Does Not Create a Liquid Market
Trading permission gives a venue legal access to the market. Liquidity still depends on users, market makers and connected order flow.
BeInCrypto’s 30 July snapshot found $386.6 million of spot order-book depth within 2% of the market price on Kraken. That was greater than Coinbase, Crypto.com and Bybit EU combined in the same dataset. Only four licensed venues showed measurable perpetual-futures depth.

Order-book depth at selected licensed venues. Source: BeInCrypto analysis using DeFiLlama data; 30 July snapshot.
The result matches the licence register. Europe has hundreds of authorized service providers and a small venue market. Liquidity is concentrated even within that smaller group.
MiCA Leaves DeFi and Custody Questions Unresolved
MiCA covers centralized service providers and excludes services delivered in a fully decentralized manner without an intermediary. The difficult cases sit between those positions.
An identifiable operator can bring a project into scope. Control of an interface, an upgrade key, or a fee switch may show that a company still manages the service. The legal outcome depends on the facts of each project.
The latest register contains 56 entities with portfolio-management permission, about 17% of the licensed market. That is the most direct route for firms offering regulated products that use decentralized finance.

Tesseract uses separate on-chain vaults for each client and manages them as discretionary portfolios. Harris said the compliance model is built into the product structure rather than added after deployment.
Custody creates a separate legal test. Article 75 of MiCA requires client crypto-assets to be legally and operationally segregated from the custodian’s own estate. The rule is designed to keep client assets away from the custodian’s creditors.

MiCA does not harmonize national insolvency law or require a separate blockchain address for every individual client. Omnibus wallets remain possible. A licensed custodian failure would therefore test how the EU segregation rule interacts with local insolvency procedure and record-keeping in practice.
No major insolvency of a MiCA-authorised custodian has produced that precedent since the transition ended.
Brussels is Reviewing the Law as Enforcement Remains Uneven
The European Commission opened a targeted MiCA review on 20 May. Its 86 questions cover stablecoins and CASP rules. The paper also asks about DeFi, staking, and other activities outside the current perimeter.
The response deadline is 30 September 2026. The review report is due to the European Parliament and Council by 30 June 2027.

Savova expects the stablecoin debate to remain tied to European monetary sovereignty. She also sees a risk that political pressure produces rules that push smaller firms offshore.
The current enforcement data shows why calibration matters. ESMA’s 12 August file lists 167 public alerts for non-compliant entities. Italian regulator CONSOB issued 165. The Dutch AFM and the National Bank of Slovakia issued one each.

ESMA told unauthorised providers in June to stop onboarding EU customers and begin an orderly wind-down after 1 July. The public-alert register shows little visible action outside Italy so far.
Harris said authorization becomes a durable commercial advantage only when supervisors act against unlicensed providers targeting European customers. Savova expects a licensed core to coexist with a smaller grey market until several visible cases set the standard.
The licensed firms are carrying the full cost of authorization. Their commercial advantage depends on national supervisors applying the perimeter to competitors serving European customers.
The First 40 Days Produced a Licensed Core
BeInCrypto made six calls before the transition ended. Three held: licenses clustered in national hubs, compliant stablecoins gained functional importance, and the ART register stayed empty. The expectation that every major exchange would secure a license failed because Binance remains absent.
The attrition forecast needed a wider range because the historical VASP count and the active-market estimate measure different populations. The timetable for a MiCA review also proved faster than expected.

The market now has a visible center. It consists mainly of custodians, brokers, and banks. Twenty-one entities can operate trading venues, and liquidity is concentrated among a smaller set. Circle remains the main compliant settlement issuer.
The next test is enforcement. Visible action beyond Italy would strengthen the licensed market. Continued inaction would leave authorized firms paying for a regulatory perimeter that offshore competitors can still reach.
MiCA has built the register and the passport. The next year will show how much market power they carry.
The post 40 Days After MiCA: What Europe’s Crypto Market Looks Like appeared first on BeInCrypto.


Securitize shares fell 16% from Wednesday’s close after the tokenization platform’s $14.4 million second-quarter revenue missed Wall Street estimates.
Meta just delivered a genuinely strange quarter: revenue beat, earnings missed, and the market couldn’t quite decide how to feel about it. Q2 revenue came in at $60.8 billion, above the $60.22 billion consensus and up 28% year-over-year, yet EPS landed at $6.18 against $7.19 expected, sending shares down roughly 3.4% in the immediate aftermath.
The real story sits beneath the headline numbers. Free cash flow collapsed 91% year-over-year to just $784 million, a direct consequence of Zuckerberg’s aggressive AI buildout, with capex alone hitting $31.1 billion in the quarter as part of a planned $130-145 billion for the full year. The company is betting big on what it calls “personal superintelligence,” recently launching new Muse AI models to back that ambition, while its Family of Apps still reached 3.6 billion daily active people in June, proof the core business remains formidable.
Adding to the pressure, fresh privacy scrutiny in Europe and mounting US legal challenges around youth safety have kept sentiment cautious. With shares down roughly 11% year-to-date and trading well below their 52-week high near $796, the market is clearly still weighing whether this AI bet will pay off.
Technical Analysis of Meta Platforms
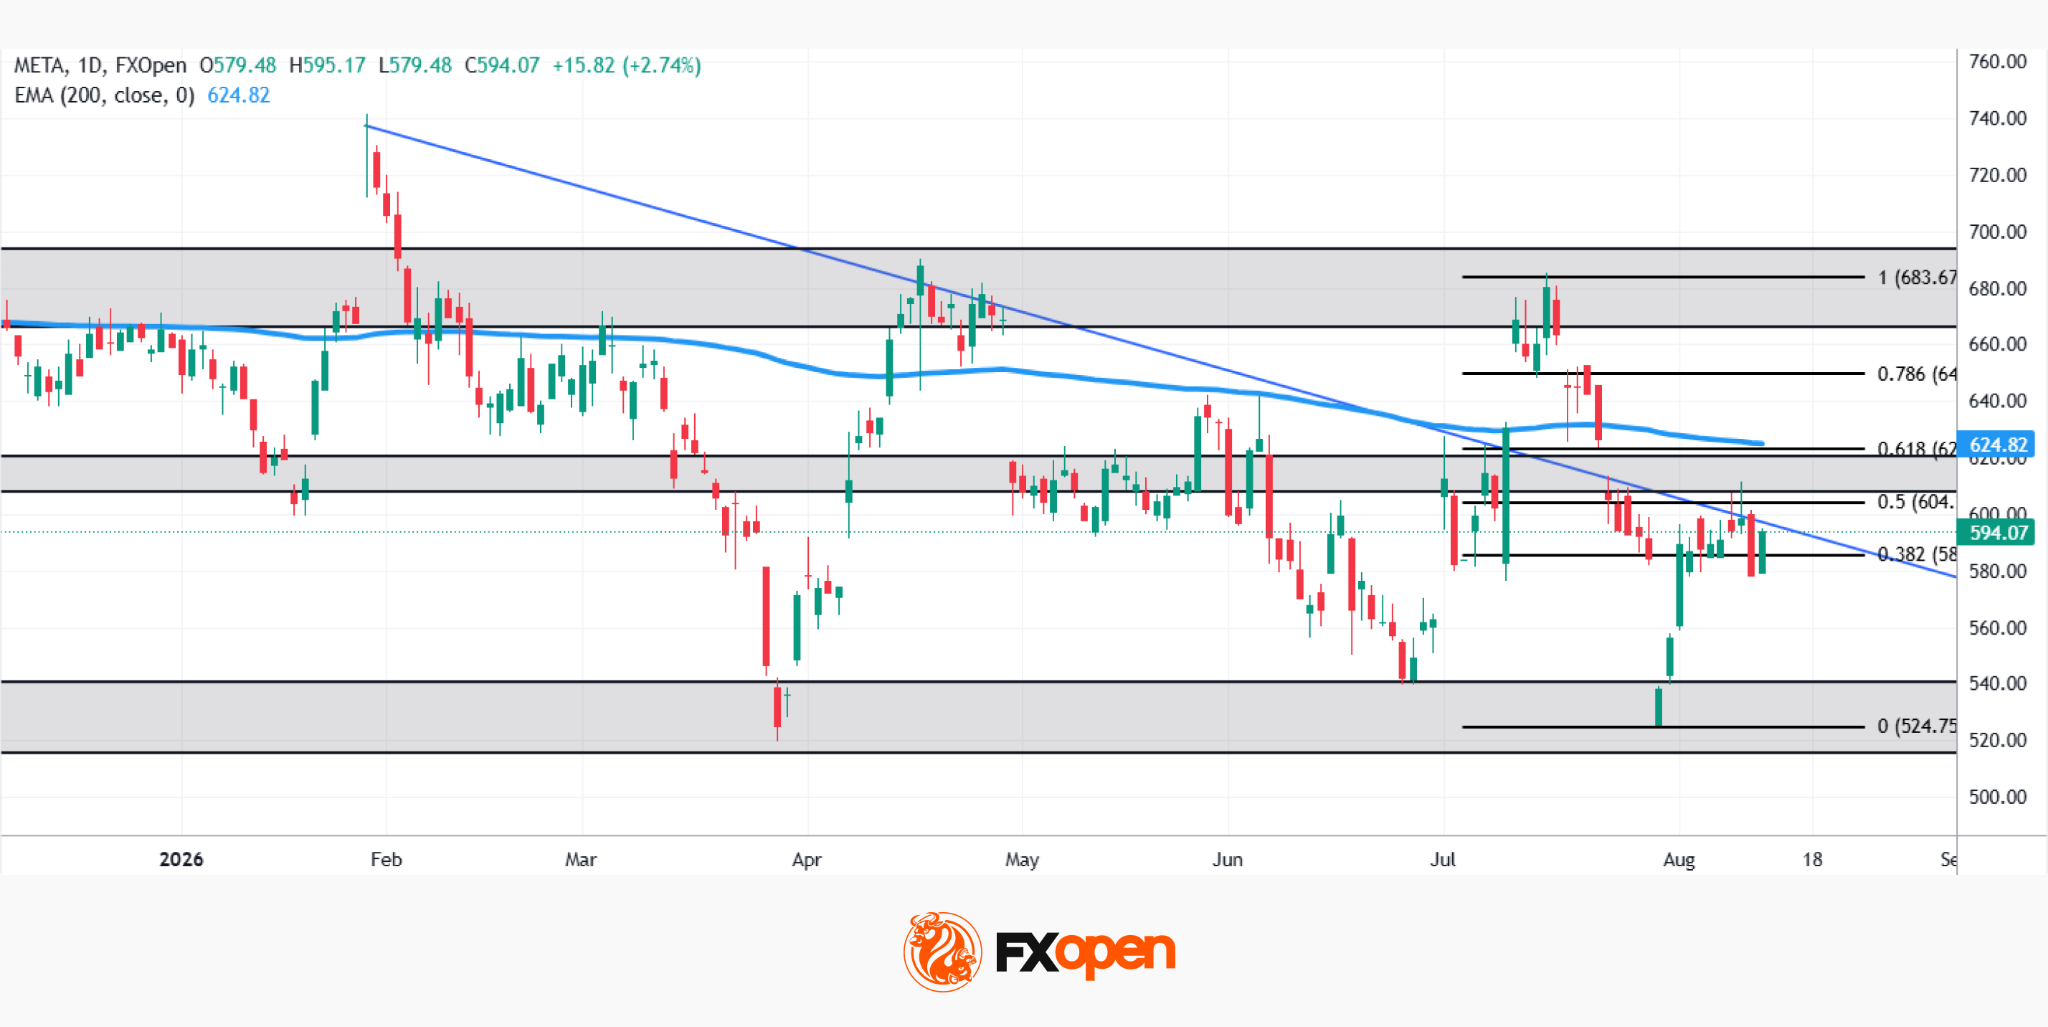
As the daily chart shows, META has been trading within a broader descending trendline since January’s highs near $740, with price recently rebounding sharply off the post-earnings low near $524.75 before running into a wall of resistance at the confluence of the 200-day EMA, the 0.618 Fibonacci retracement near $622.96, and the descending trendline itself around $600. That rejection has since pulled price back toward the 0.382 retracement near $585.46.
Bullish Scenario
Should buyers defend the 0.382 support and stage another push higher, the real test remains that same trendline-EMA-Fibonacci confluence near $605-$625. A confirmed break above this zone would be a genuinely significant technical shift, opening the path toward the 0.786 retracement near $649.66, and eventually the 1.0 level at $683.67.
Bearish Scenario
Conversely, a break below the 0.382 support at $585.46 would signal renewed weakness, exposing the 0.5 retracement near $604 as a lesser hurdle already cleared, but more importantly risking a full retest of the $524.75 low that marked the post-earnings capitulation.
With price wedged between a defended support and a stubborn multi-month trendline, META’s next move looks set to determine whether this rebound has real legs, or whether the broader downtrend since January is still very much in control.
Buy and sell stocks of the world’s biggest publicly-listed companies with CFDs on FXOpen’s trading platform. Open your FXOpen account now or learn more about trading share CFDs with FXOpen.
This article represents the opinion of the Companies operating under the FXOpen brand only. It is not to be construed as an offer, solicitation, or recommendation with respect to products and services provided by the Companies operating under the FXOpen brand, nor is it to be considered financial advice.
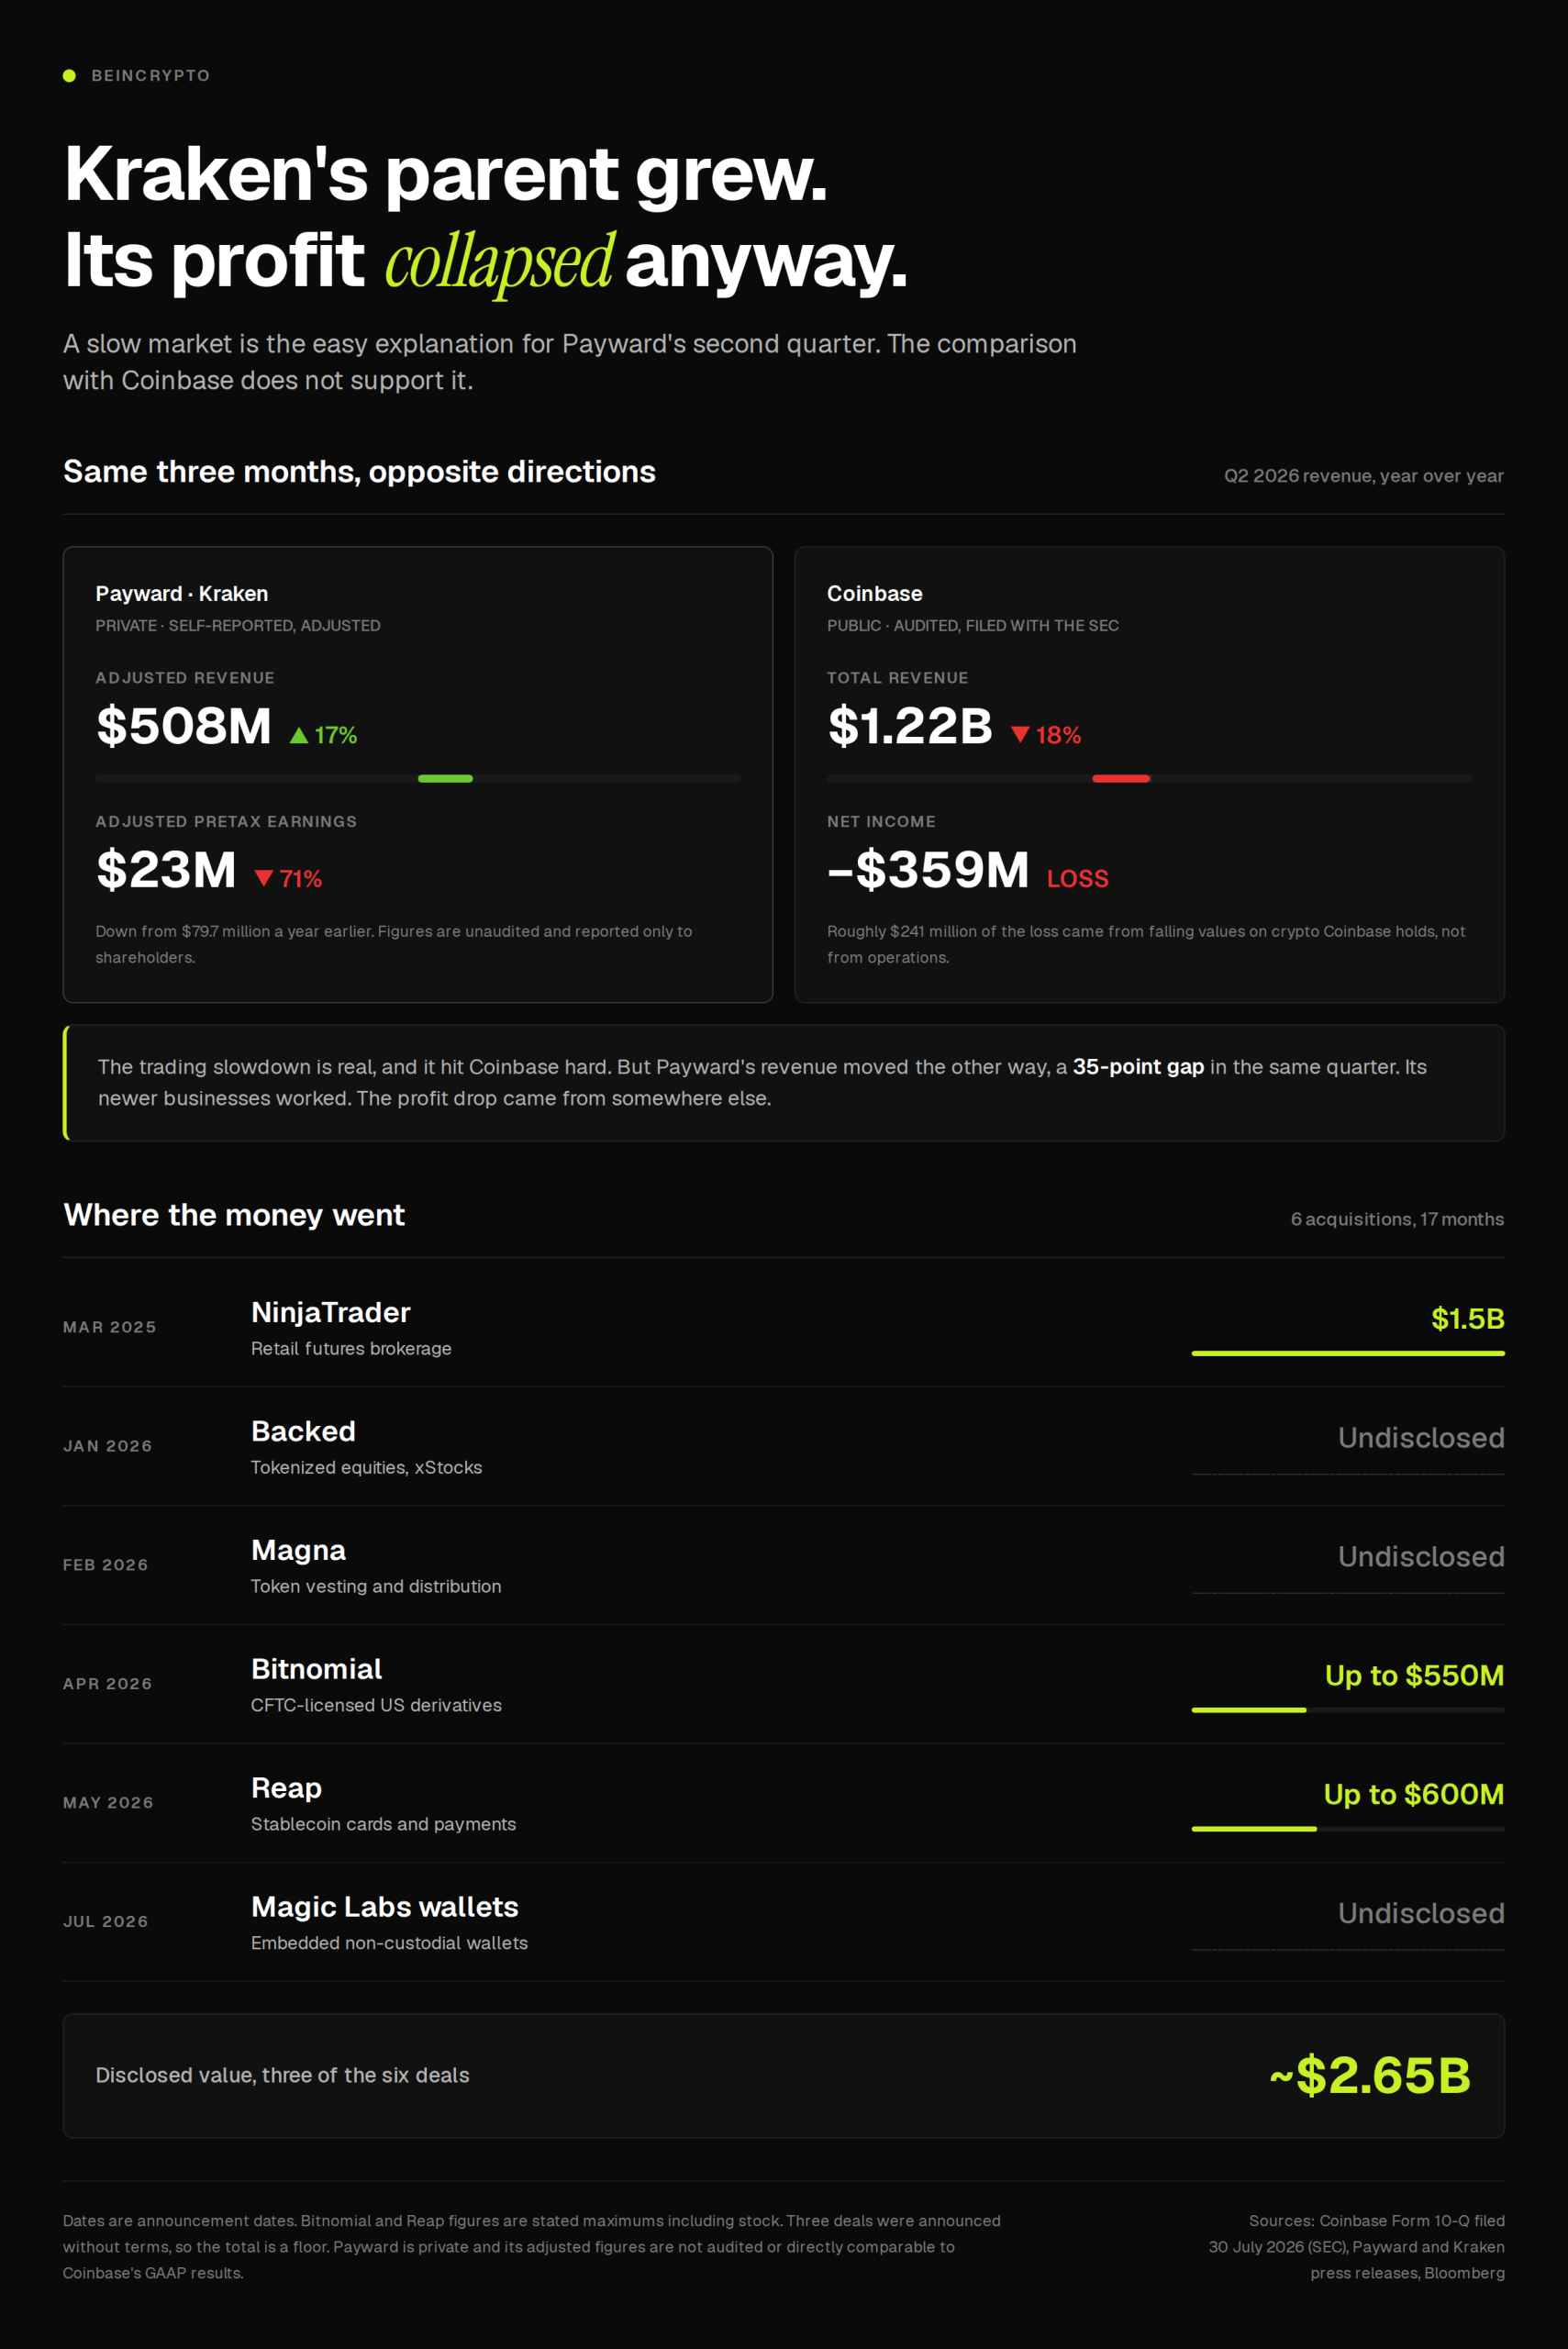
Payward, the parent of crypto exchange Kraken, made just $23 million in adjusted pretax profit last quarter. That is 71% less than a year earlier, according to a shareholder letter seen by Bloomberg.
The easy explanation is a crypto slump. The numbers say otherwise. Payward’s revenue rose 17% to $508 million while its largest rival got smaller.
Coinbase Shrank, Payward Grew
Coinbase files full accounts with the US Securities and Exchange Commission (SEC) every quarter. Its report for the same three months shows revenue of $1.22 billion. That is down 18% from a year earlier.
So the two exchanges moved in opposite directions. One lost nearly a fifth of its revenue. The other added nearly a fifth. Coinbase also booked a $359 million net loss. Most of that came from the falling value of crypto it holds.
The read is awkward for the simple story. Trading fees fell across the industry. Payward’s newer businesses covered the gap. A slow market does not explain why its profit almost vanished.
The Bill for $2.65 Billion of Shopping
Payward has been buying companies for 18 months. It paid $1.5 billion for futures broker NinjaTrader in March 2025. In April this year it agreed to buy derivatives platform Bitnomial for up to $550 million.
Three weeks later came Reap, a stablecoin payments firm, for up to $600 million. Three further deals carried no public price. Backed in January. Token manager Magna in February. The wallet arm of Magic Labs in July.
The disclosed total is roughly $2.65 billion. The true figure is higher.

None of this was an accident. Co-CEO Arjun Sethi said as much in the first-quarter release, when profit had already thinned to $18 million.
“Where others pulled back, we leaned in – because our conviction hasn’t wavered, and we believe the investments we’re making will define our competitive position for years to come,” Sethi, quoted in a Payward statement.
Follow us on X to get the latest news as it happens
What Payward Will Not Show You
Payward is private, so it chooses what to publish. The letter gave two adjusted figures and stopped there. Adjusted numbers are not audited. Coinbase’s are.
The letter skips integration costs. It skips cash burn. It skips the split between revenue Payward built and revenue it bought.
That last gap is the one that counts. The 17% rise is the entire case for the strategy. Nobody outside the company can test it.
Payward filed confidentially for a US listing in November 2025. It then raised $800 million at a $20 billion valuation. Jane Street and DRW Venture Capital backed the round. It paused the listing in March. It cut 150 jobs in May and kept buying.
Those investors hold a $20 billion mark and no way to check it. The S-1 will show everything. Until it lands, they are asked to read a 71% drop as an investment.
The post Kraken is Growing Faster Than Coinbase, Yet Its Profits Crashed 71% appeared first on BeInCrypto.
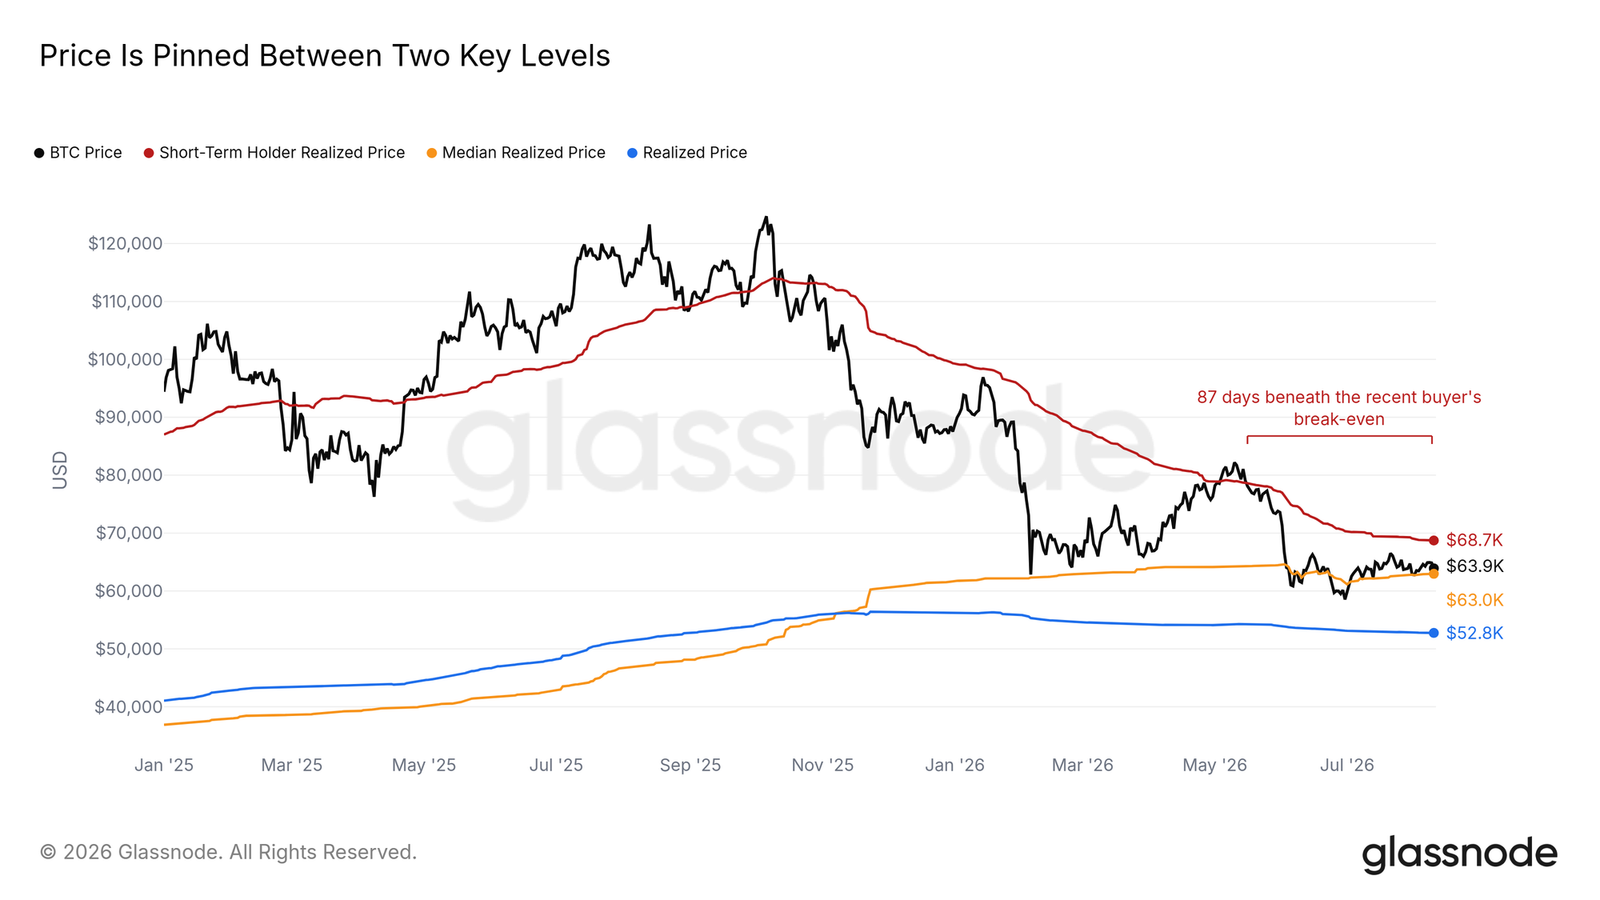
Bitcoin (BTC) recent buyers are the latest hurdle to a breakout from a stubborn trading range in place since June.
Key points:
- Bitcoin short-term holders are keen to sell into range highs as they seek to break even on their investment.
- BTC price action remains stuck in its near three-month range as a result, Glassnode suggests.
- Nearly 9% of the BTC supply has a cost basis between $62,000 and $65,000.
Bitcoin short-term holders seeking breakeven exit
In the latest edition of its weekly newsletter, crypto analytics platform Glassnode highlighted the ongoing significance of Bitcoin’s speculative investor base.
Short-term holders (STHs) — those holding BTC acquired within the past six months — are currently around 7.2% underwater on their investment in aggregate. The cohort’s cost basis, also known as realized price, which Glassnode calculates at $68,700, thus forms a key resistance level to clear.
“The cost-basis ladder frames the stalemate. Spot sits just above the Median Realized Price at $63.0K, the level that splits every coin’s cost basis down the middle, and below the Short-Term Holder Cost Basis at $68.7K, the average entry of the market’s most recent buyers,” it wrote.
“That cohort is underwater, which historically makes it quick to sell into recoveries, while the median level has absorbed every test from above for more than a month.”
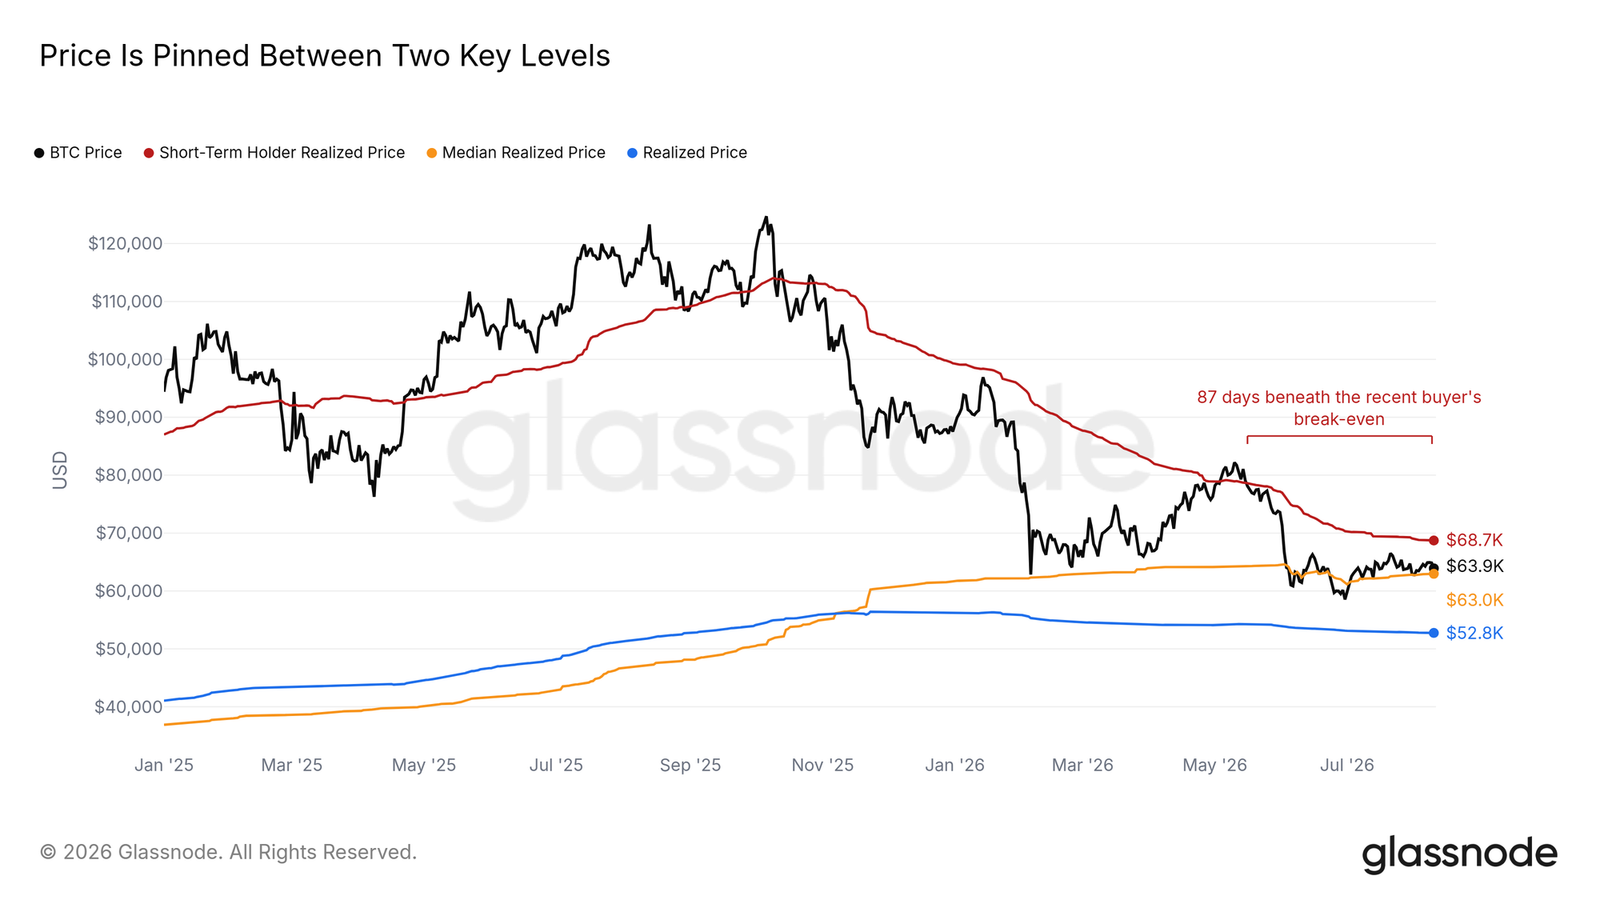
Bitcoin realized price data. Source: Glassnode
BTC/USD has been wedged in a narrow range between $58,000 and $68,000 since the start of June. As Cointelegraph reported, a separate battle between buyers and sellers continues within that range, with a 50-month trend line near $65,800 now keeping price even more constricted. Analysis sees this as a classic phenomenon during Bitcoin bear markets, with a downside resolution increasingly likely.
This week, trader and analyst Rekt Capital additionally warned that $63,000 was weakening as local support, with price gaining progressively less ground with each rebound from that level.
BTC supply dynamics add weight to current spot range
Bitfinex Alpha, the research arm of crypto exchange Bitfinex, noted that a significant portion of the BTC supply has moved onchain during the range-bound period.
Related: Bitcoin miners earn under 0.7% of revenue from fees in new 10-year low
“The reason the boundaries are so stubborn is due to ownership. The $62,000-$65,000 band holds 1,794,308 BTC at this cost basis, 8.93% of circulating supply per the UTXO Realised Price Distribution (URPD), with the largest holdings at ~$63,800,” it reported on Wednesday.
URPD records the price at which coins last moved onchain, with the 1.79 million BTC tranche equal to approximately 8.9% of the total circulating supply.
“With price trading inside this band, the largest concentration of holders across any narrow $3,000 range keeps moving between profit and loss and a large volume of coins changes hands as a result,” Bitfinex added.
Immediately above the current STH cost basis lies another psychologically significant level — Bitcoin’s old all-time high of $69,400 from November 2021.
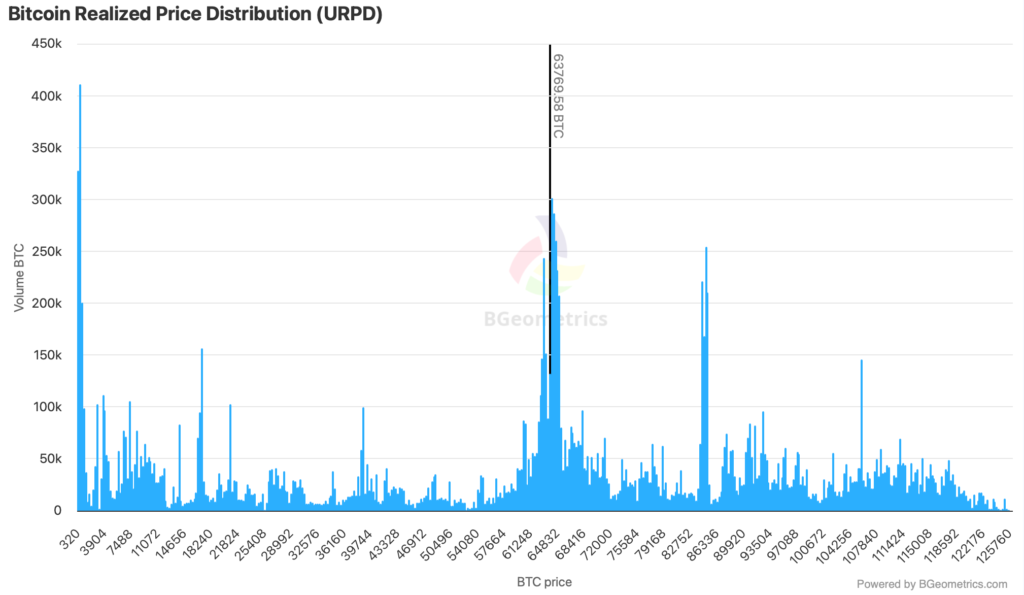
Bitcoin URPD chart. Source: Bitfinex Alpha
Bitcoin (BTC) long positions are “facing liquidation” as volatility shows signs that a range breakout is finally coming.
Key points:
- Bitcoin long positions face multiple threats as BTC price action heads toward new August lows, analyst warns.
- The correlation between Binance open interest and price reached 0.25 on Thursday as both fell.
- The Bitcoin bull market is not ready to make a comeback, CryptoQuant CEO Ki Young Ju says.
Bitcoin longs feel the squeeze as price drops
Insights published on onchain analytics platform CryptoQuant by community analyst “BorisD on Thursday said that leveraged long BTC positions are being flushed out as BTC/USD targets month-to-date lows.
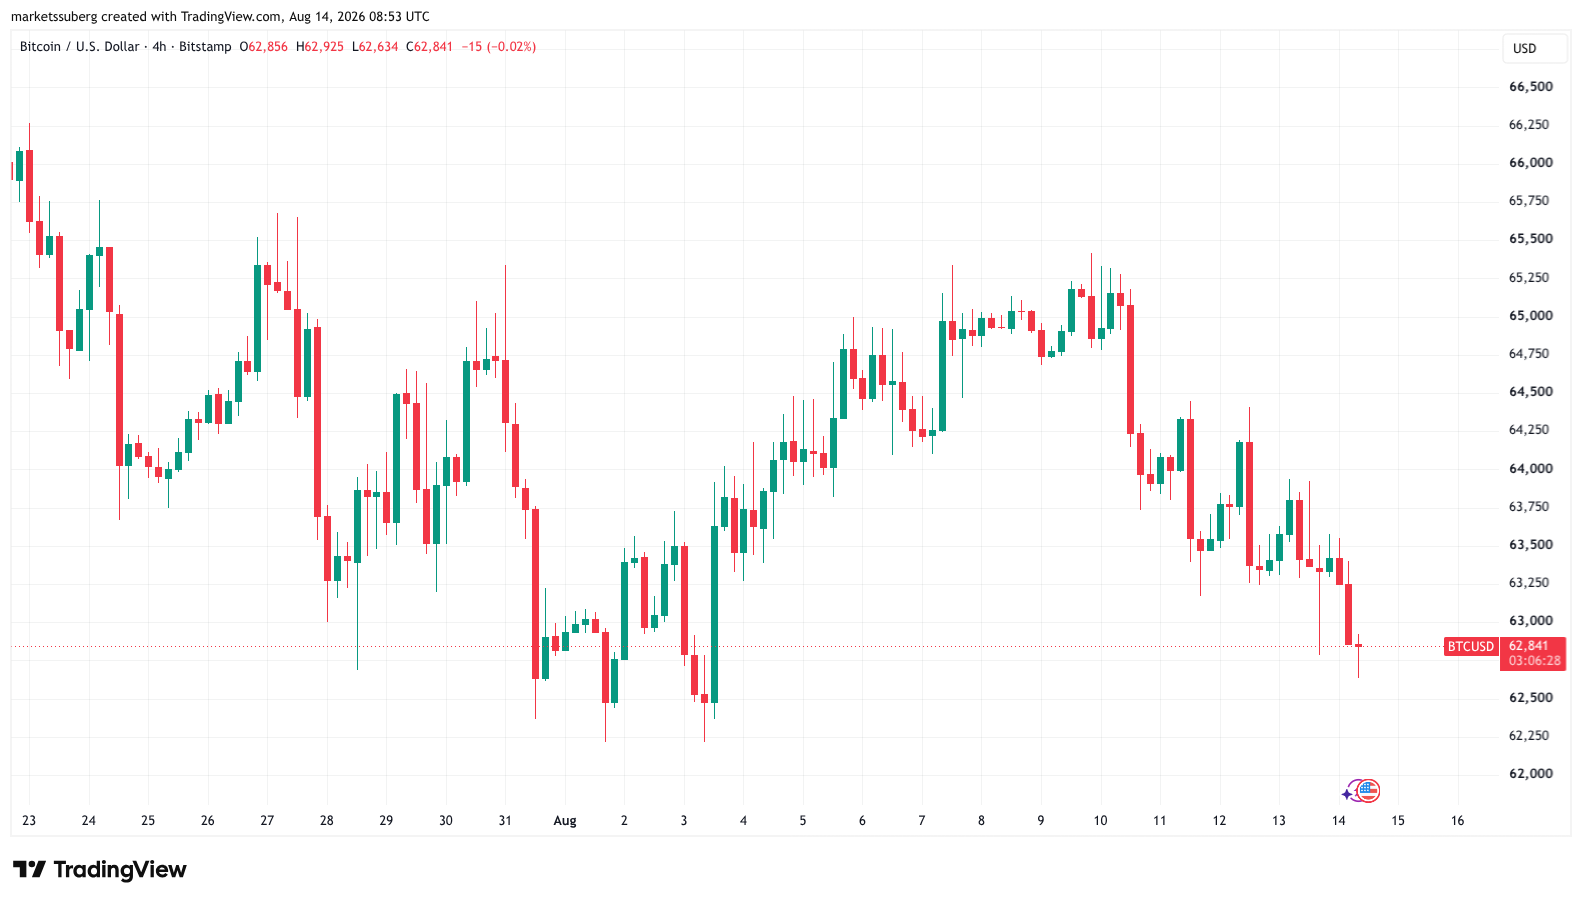
BTC/USD one-hour chart. Source: Cointelegraph/TradingView
The analysis focuses on the relationship between price and open interest (OI) on Binance. OI represents total active derivative positions, both long and short, and reflects capital commitment in a given market.
While price has traded in a narrow range since June, CryptoQuant data show that Binance OI has gradually increased, reaching $8.15 billion on Wednesday as futures increasingly steer the market while spot traders sit on the sidelines.
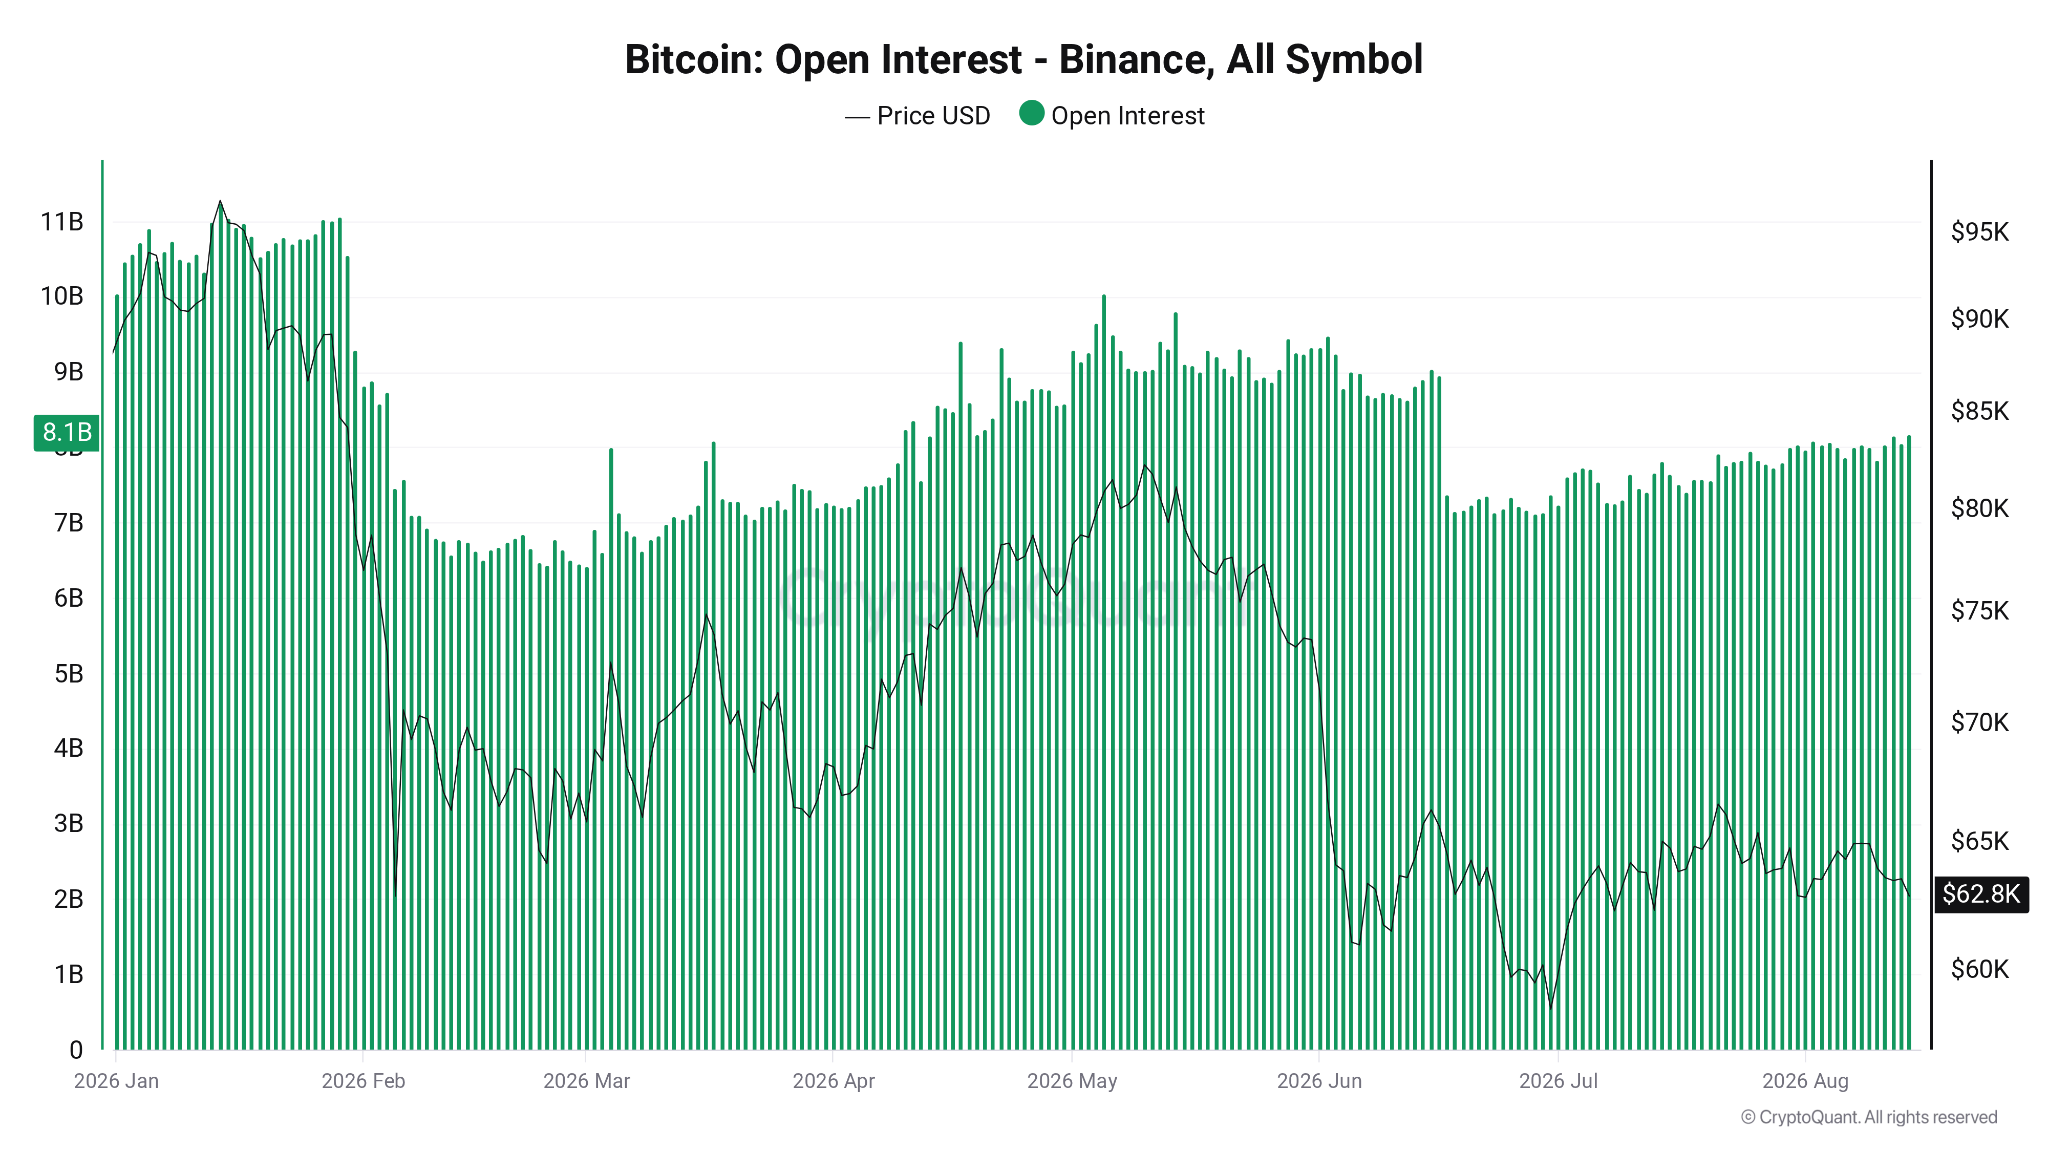
Bitcoin open interest on Binance. Source: CryptoQuant
With price now seeing downside volatility on lower time frames, the correlation between price and OI has entered a state of flux, potentially squeezing long positions that have built up in the low $60,000 zone.
“In the Bitcoin market, the Binance Open Interest (OI) Correlation and liquidation warning signals clearly reveal the process of leveraged positions being flushed out. Initially, as the price fell, the correlation shifted to the negative side, indicating that OI was rising despite declining prices,” the analyst wrote.
“This showed a double-sided squeeze and [an] increasingly complex liquidity structure — driven by long positions trying to buy the dip on one end, and additional short positions entering the market on the other.”
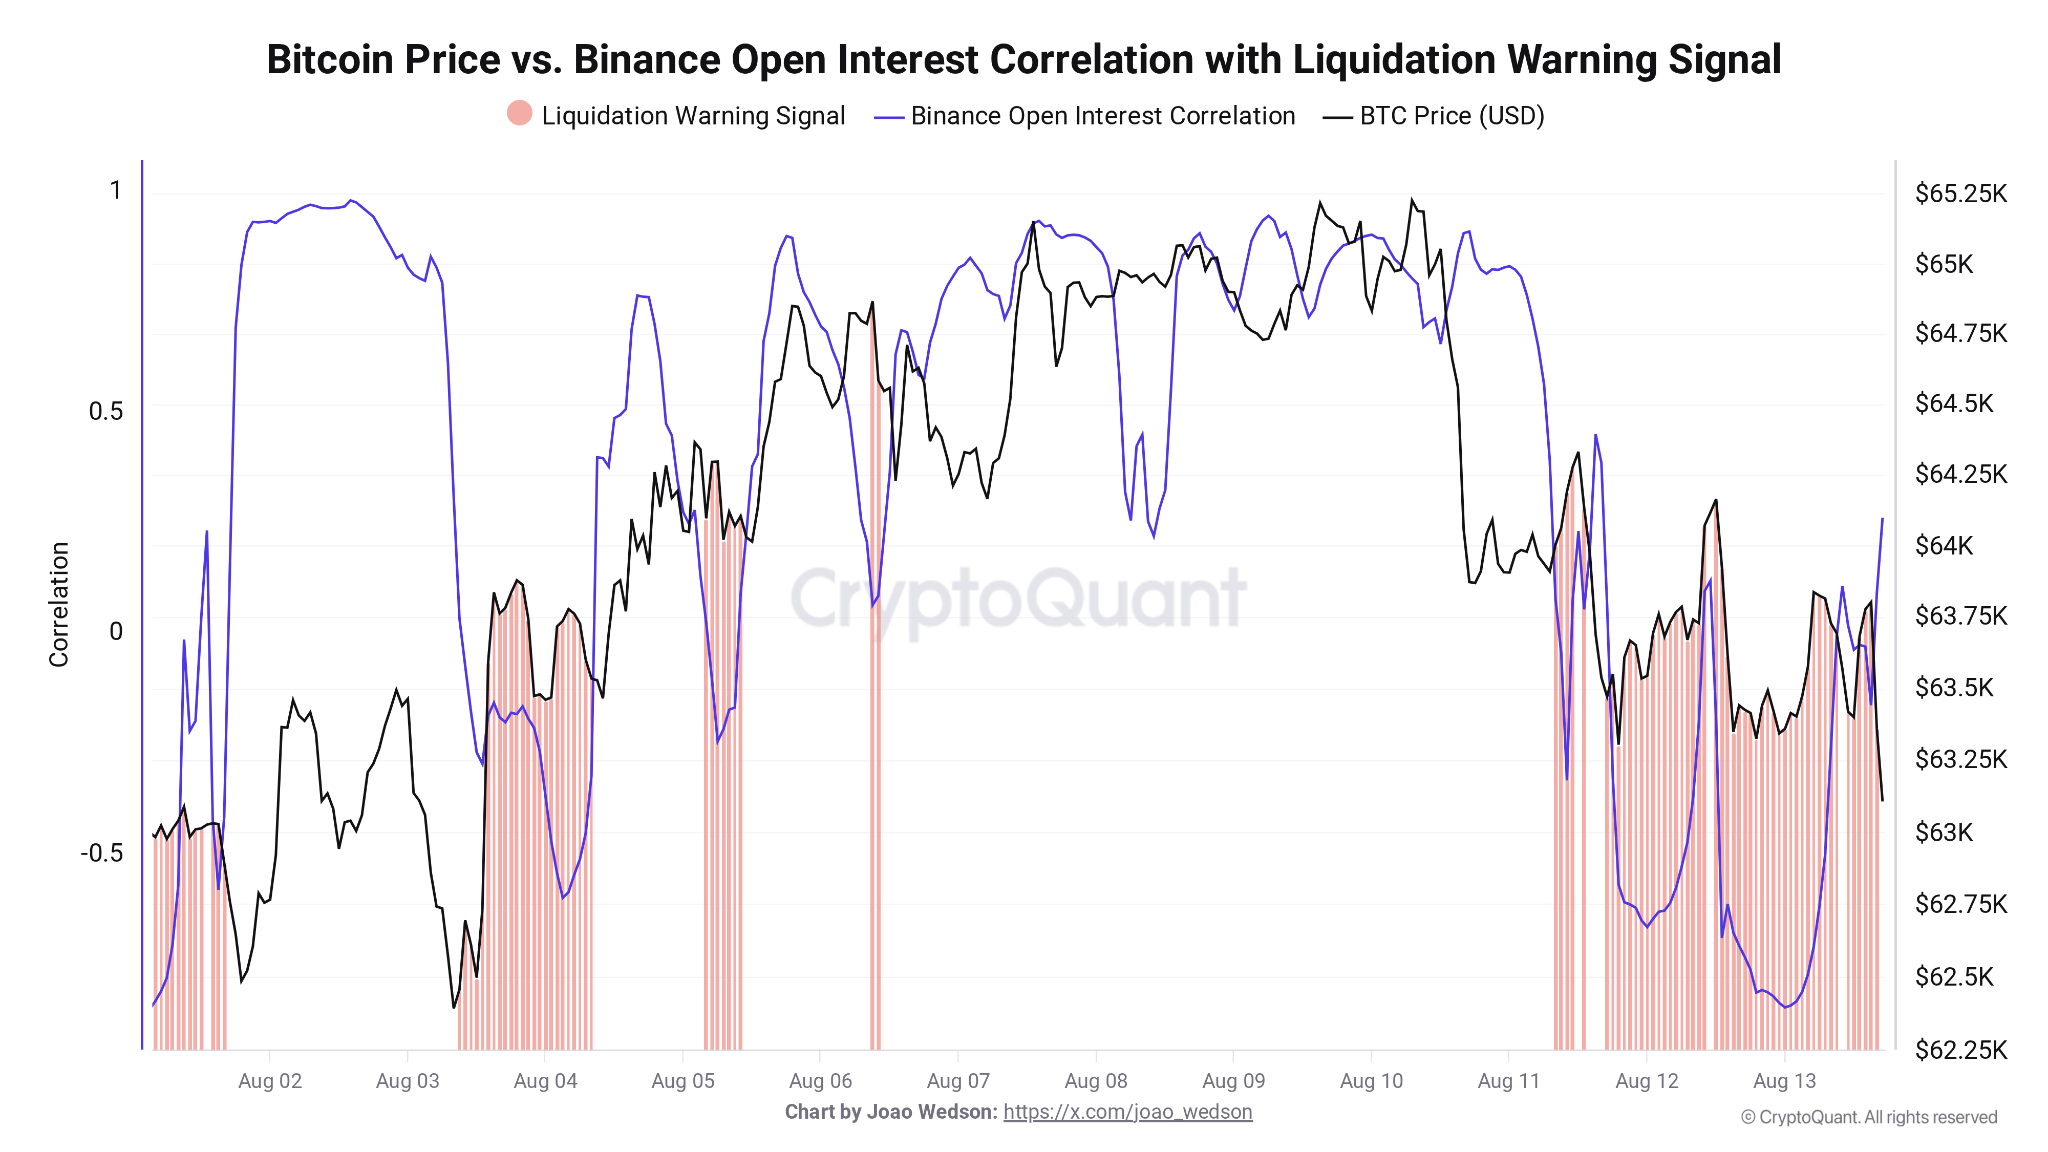
BTC/USD vs. Binance OI data. Source: CryptoQuant
The latest correlation data showed a reading of 0.25, a number that the analyst said reflects declining long positions as price continues to fall, suggesting the “anticipated cleanout has begun.”
“The simultaneous drop in both price and OI indicates that leveraged long positions are giving up, getting stopped out, or facing liquidation,” the analyst continued.
Data from CoinGlass put total 24-hour cross-crypto liquidations at $236 million at the time of writing.
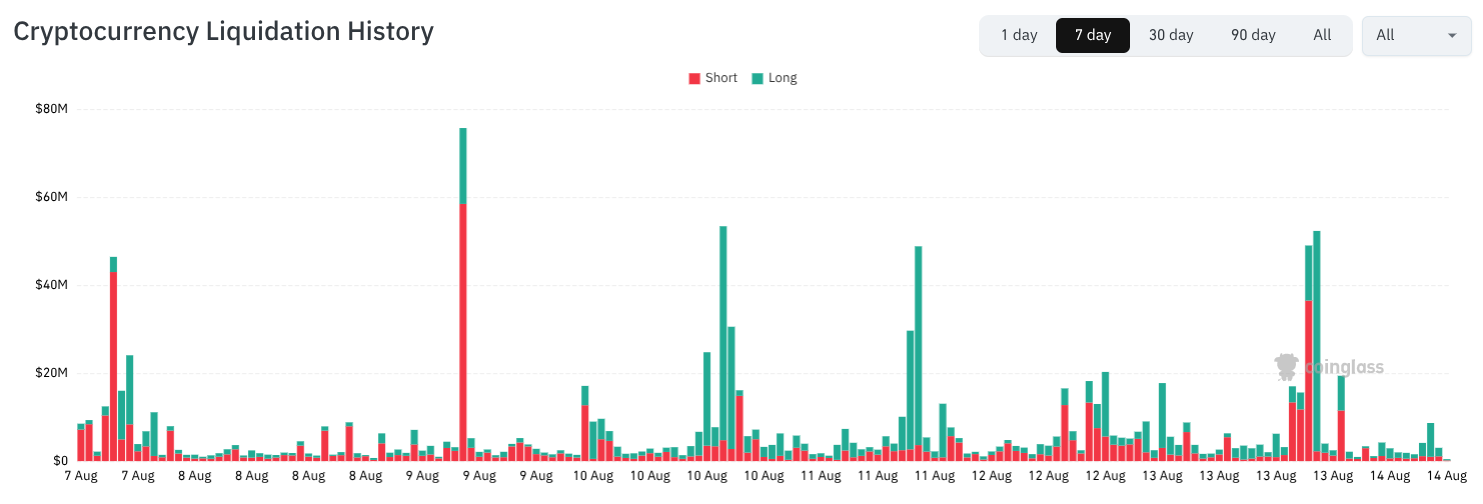
Crypto liquidation history (screenshot). Source: CoinGlass
CryptoQuant CEO: “Stars haven’t aligned” for Bitcoin bull market
In his latest market commentary, CryptoQuant CEO Ki Young Ju said conditions for a renewed Bitcoin bull market have yet to emerge.
Related: Bitcoin speculators keep BTC price ‘pinned’ below $68.7K: Glassnode
“The stars haven’t aligned for a Bitcoin bull run just yet,” he wrote on X alongside a basket of onchain indicators still in “bear” territory.
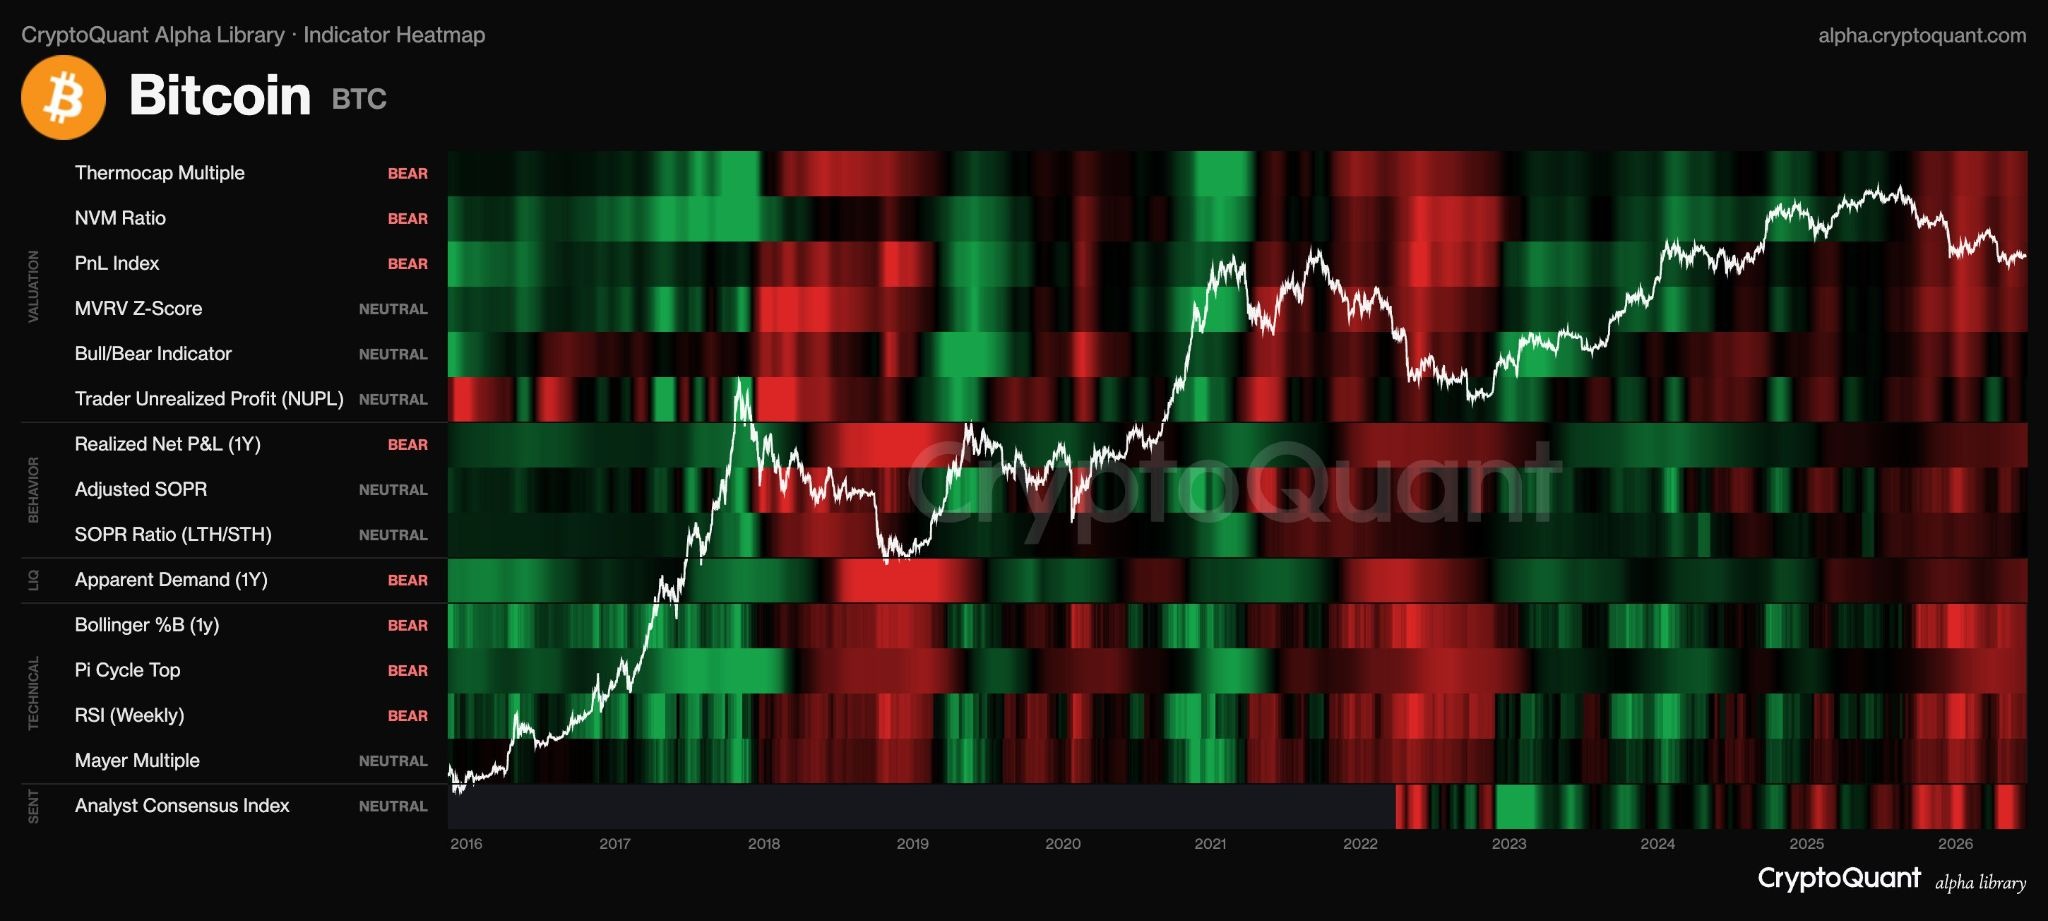
Bitcoin onchain indicator heatmap. Source: Ki Young Ju on X.com
Cointelegraph has previously reported on several composite onchain indicators reaching similar conclusions about the current stage of the BTC price cycle. One of them, from onchain analytics platform Glassnode, is currently in its longest “capitulation” phase since the end of Bitcoin’s last bear market in 2022.
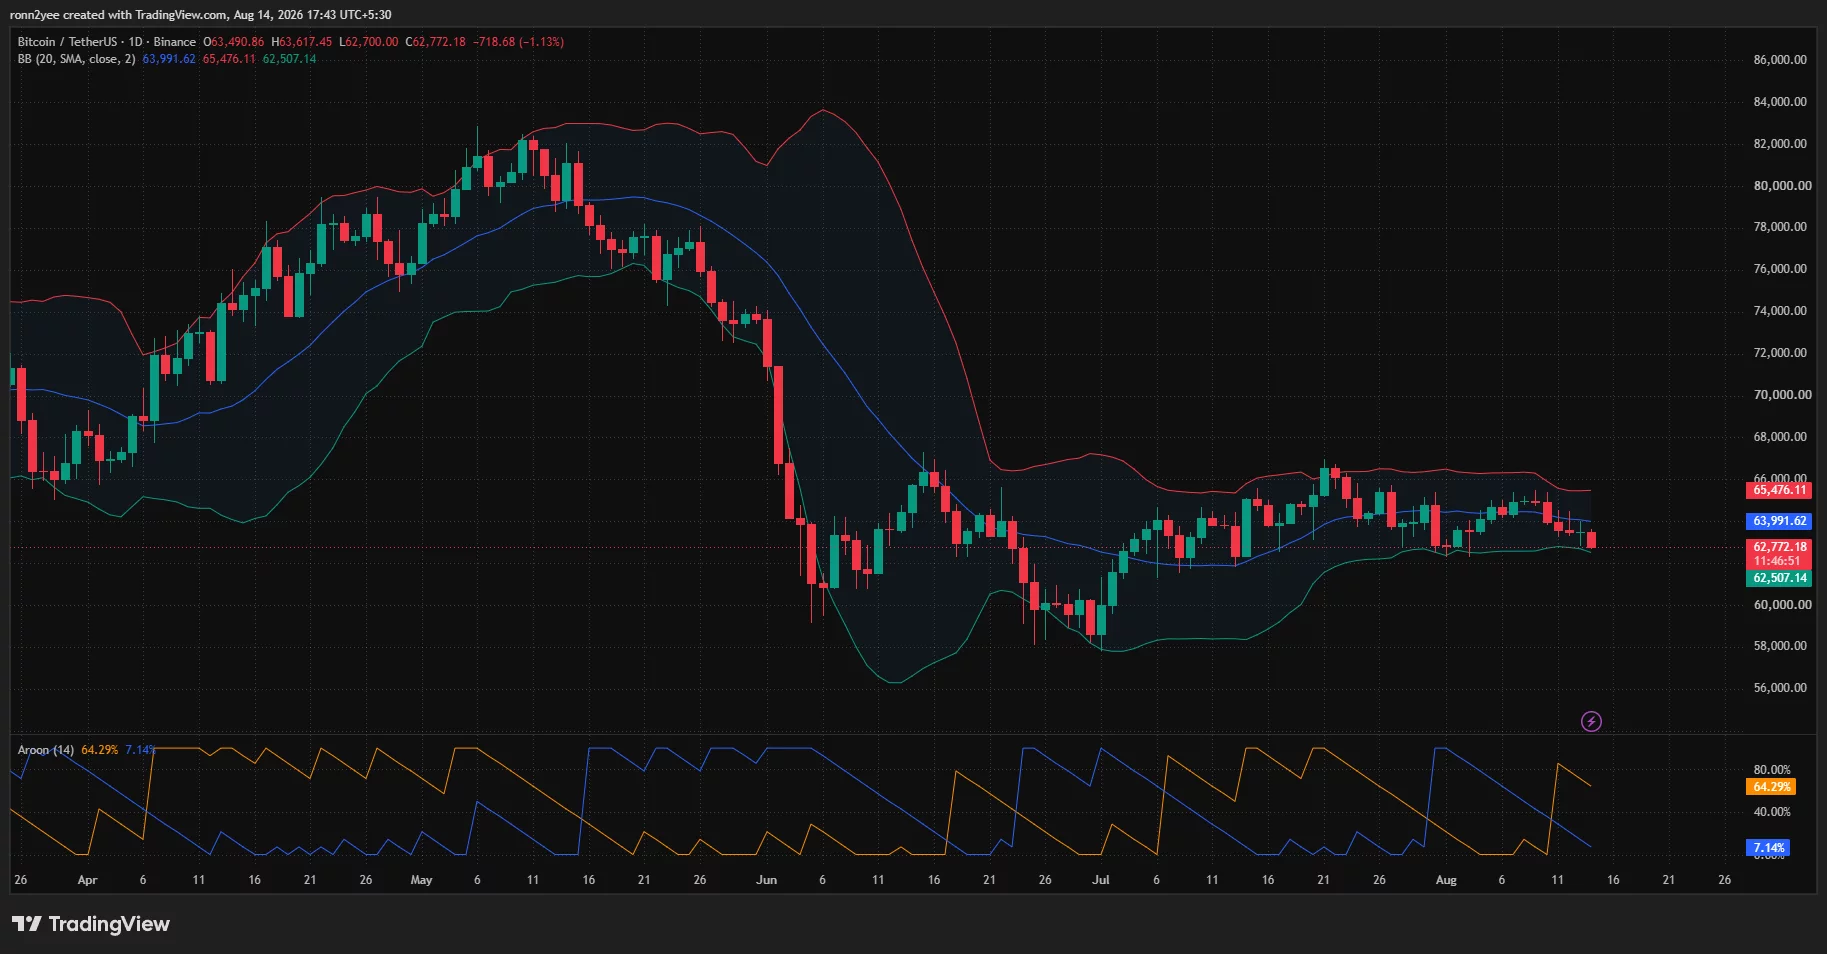
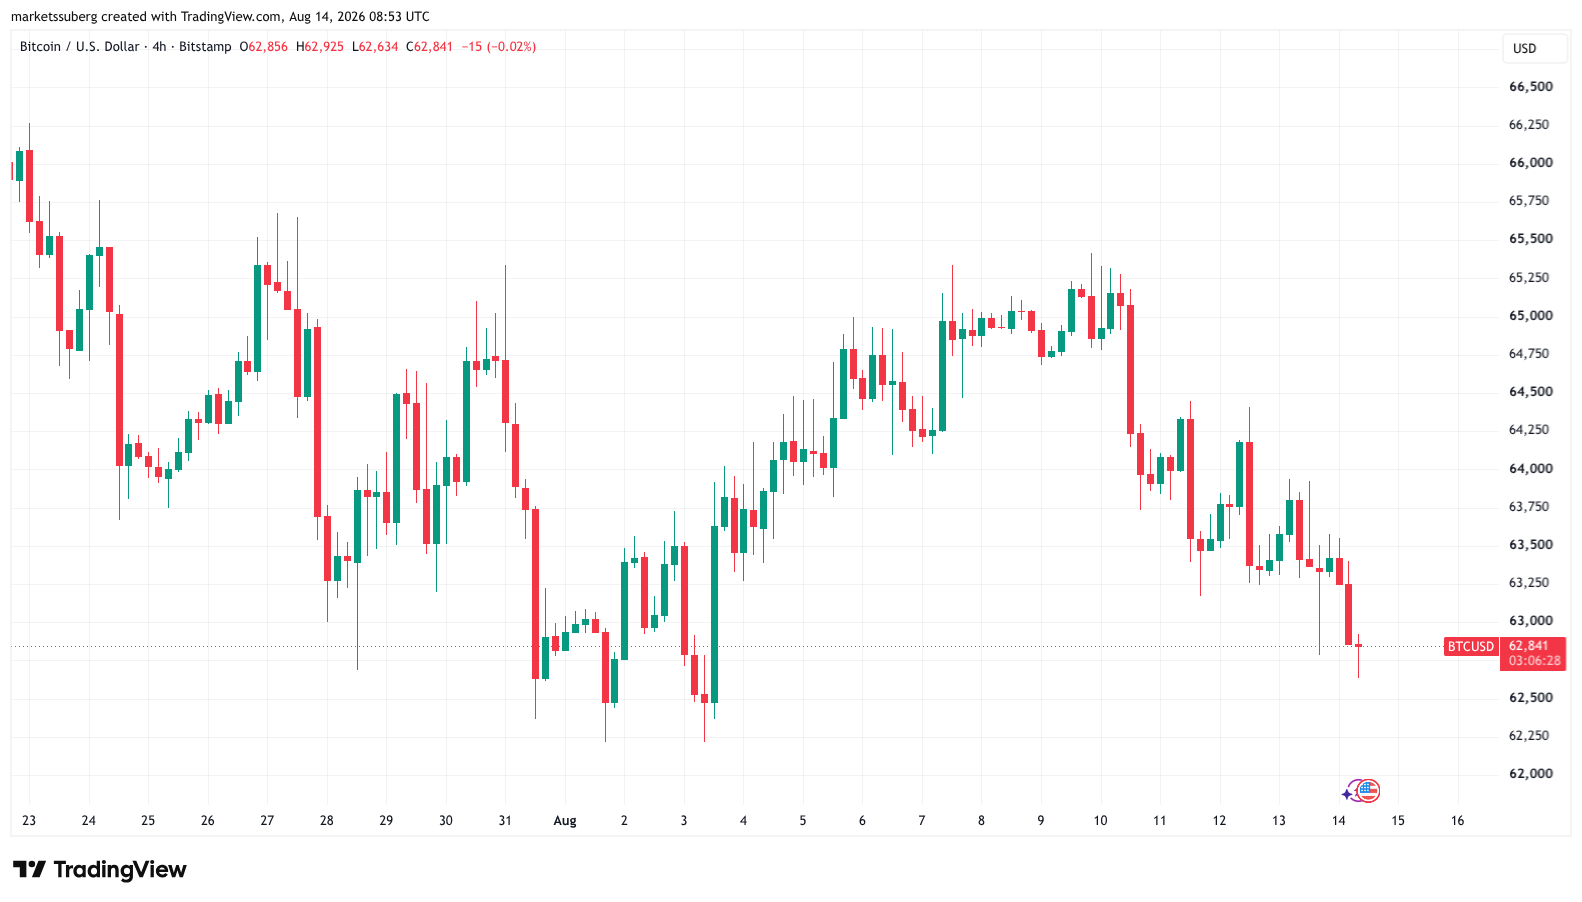
Bitcoin price has fallen 2% from $63,895 to an intraday low of $62,667 on Aug. 14 as spot selling, a $125 million whale short, and weak derivatives demand pushed the price toward a key support zone.
Summary
- Bitcoin price fell below $63,000 and approached its lower daily Bollinger Band at $62,507.
- A whale increased a Bitcoin short to 1,900 BTC, worth about $125 million.
- The 4-hour Supertrend remains bearish, while the Chaikin Money Flow stands at -0.08.
- Liquidation clusters sit near $62,200 below the price and between $64,000 and $64,700 above it.
Bitcoin price action today points to seller control
According to data from crypto.news, Bitcoin (BTC) price was trading near $62,772 at the time of writing, down 1.13% since the daily open at $63,491. The price had reached a session high of $63,617 before falling as low as $62,700 on Binance.
Measured from an earlier intraday level of $63,895 to the low near $62,667, the decline reached roughly 2%. The move broke the psychological $63,000 level and placed Bitcoin just above the lower daily Bollinger Band at $62,507.
Bitcoin has remained trapped in a relatively narrow range since early July, with buyers repeatedly appearing near $62,000 and sellers limiting rallies between $65,000 and $66,000. The latest decline followed another rejection from the upper part of that range, extending a series of lower highs visible since the July 21 peak near $66,700.
The daily Bollinger Band midpoint now stands at $63,992. Trading below that level places the immediate advantage with sellers, while the upper band at $65,476 defines the next major resistance area if buyers recover.
Aroon data also showed a bearish imbalance. The Aroon Down reading stood at 64.29%, compared with an Aroon Up reading of 7.14%, indicating that a recent low carries more weight than any recent high.
What is driving the Bitcoin decline?
On-chain analyst Ai Yi reported that a large trader added 258 BTC to an existing short position, lifting the trade to 1,900 BTC with an average entry price of $63,582. The position was worth about $125 million and carried an unrealized profit of approximately $1.79 million at the time of the update.
The short does not prove that one trader caused the entire decline. However, the position added to bearish derivatives exposure while Bitcoin was already losing short-term support. Selling below $63,000 then placed pressure on leveraged buyers whose trades depended on the level holding.
Institutional demand has also weakened. According to data from SoSoValue, U.S. spot Bitcoin exchange-traded funds recorded two consecutive sessions of net withdrawals totaling $192 million. Reduced ETF demand removed one source of buying that could absorb coins sold during volatile sessions.
Strategy added to the cautious mood earlier in the week when it disclosed the sale of 1,690 BTC for nearly $109 million. The company used the proceeds to repurchase preferred stock after going seven weeks without adding Bitcoin to its treasury. The disposal was Strategy’s fourth Bitcoin sale since June.
Outside crypto, higher oil prices and elevated bond yields kept pressure on risk assets. Brent crude traded above $87 as tensions around Iran and the Strait of Hormuz raised concerns about energy supplies, while the 10-year U.S. Treasury yield remained near 4.66%. Higher Treasury yields can reduce demand for assets such as Bitcoin because government debt offers investors a yield without the same level of price volatility.
Softer U.S. wholesale inflation provided limited support. July’s headline Producer Price Index was unchanged, while core PPI increased 0.2%, according to Charles Schwab. Bitcoin still lagged U.S. equities, showing that crypto-specific selling and weak market liquidity outweighed the immediate benefit of the inflation data.
Bitcoin faces support at $62,200–$62,500
The 4-hour chart confirmed that short-term momentum remains bearish. Bitcoin traded below the 4-hour Supertrend level at $64,094, which has acted as resistance since the price lost the indicator on Aug. 10.
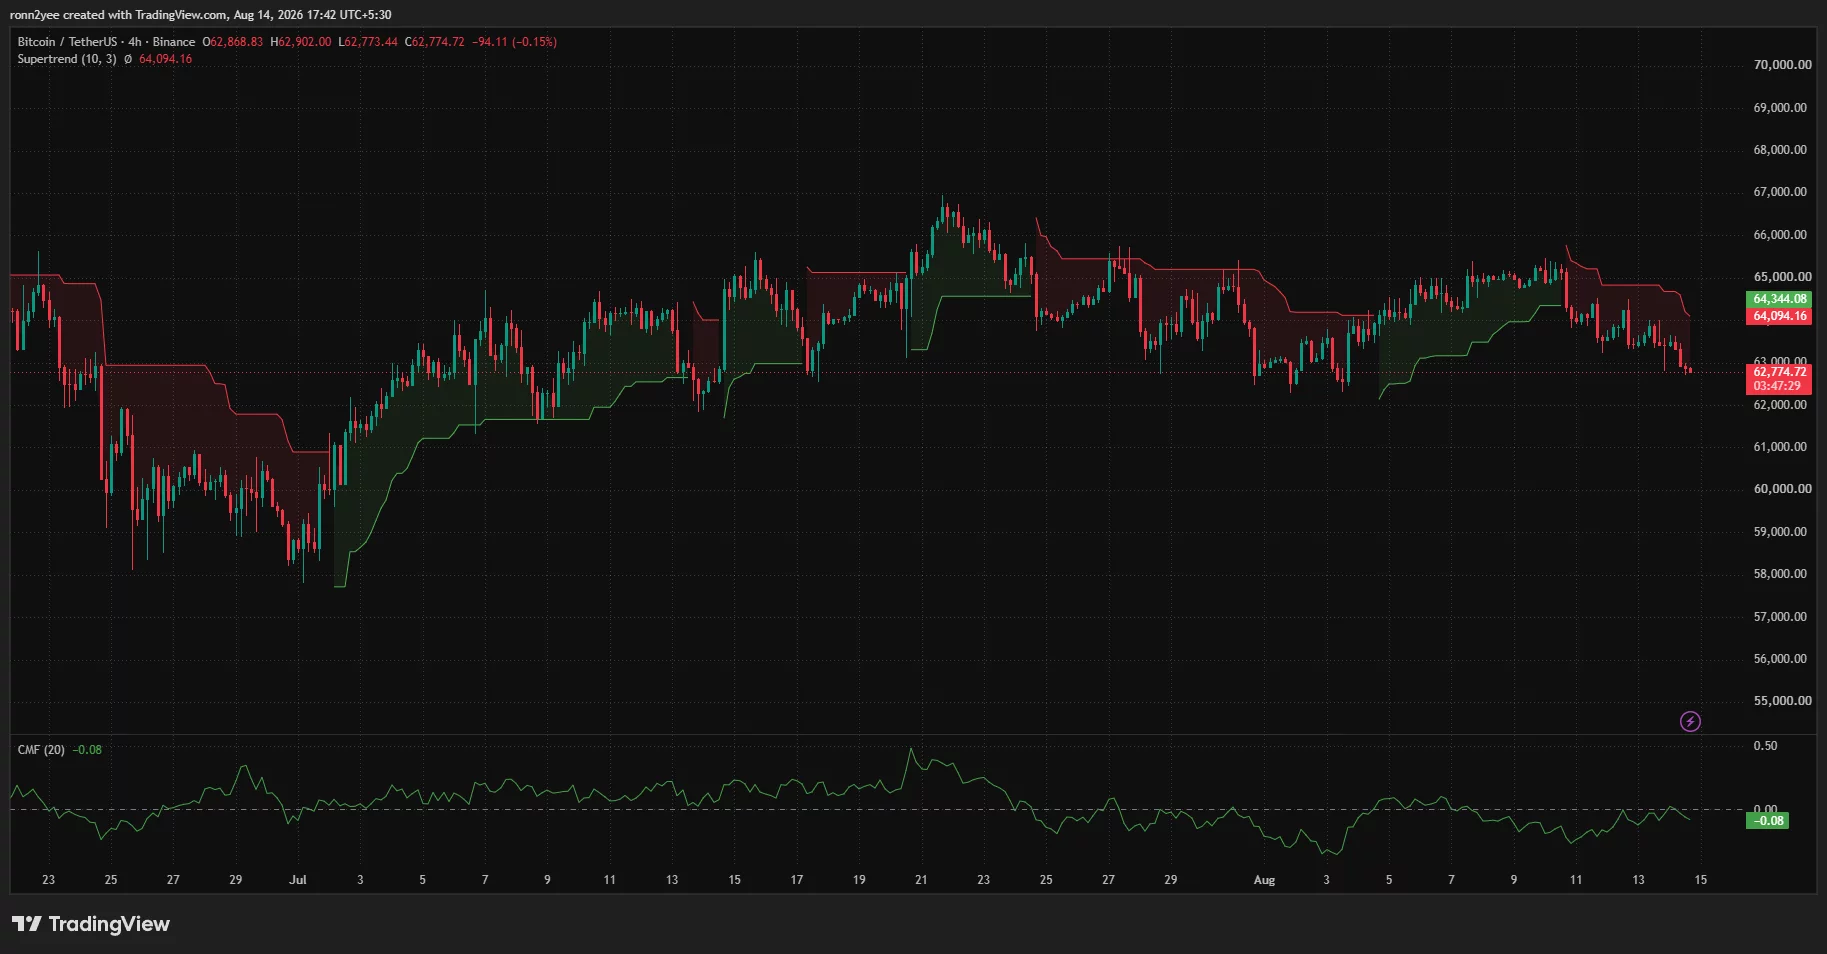
Chaikin Money Flow stood at -0.08 on the same timeframe. A reading below zero indicates that selling volume has outweighed buying volume over the indicator’s 20-period window, supporting the weakness shown by the price.
Immediate support sits between $62,500 and $62,700, combining the daily lower Bollinger Band with the latest intraday low. A close below that region would place $62,200–$62,300 in focus, followed by the round-number support at $62,000.
The one-week CoinGlass liquidation heatmap showed a concentration of leveraged positions around $62,200. A fall into that area could trigger another group of long liquidations, although the same liquidity zone may attract buyers after leveraged positions are cleared.
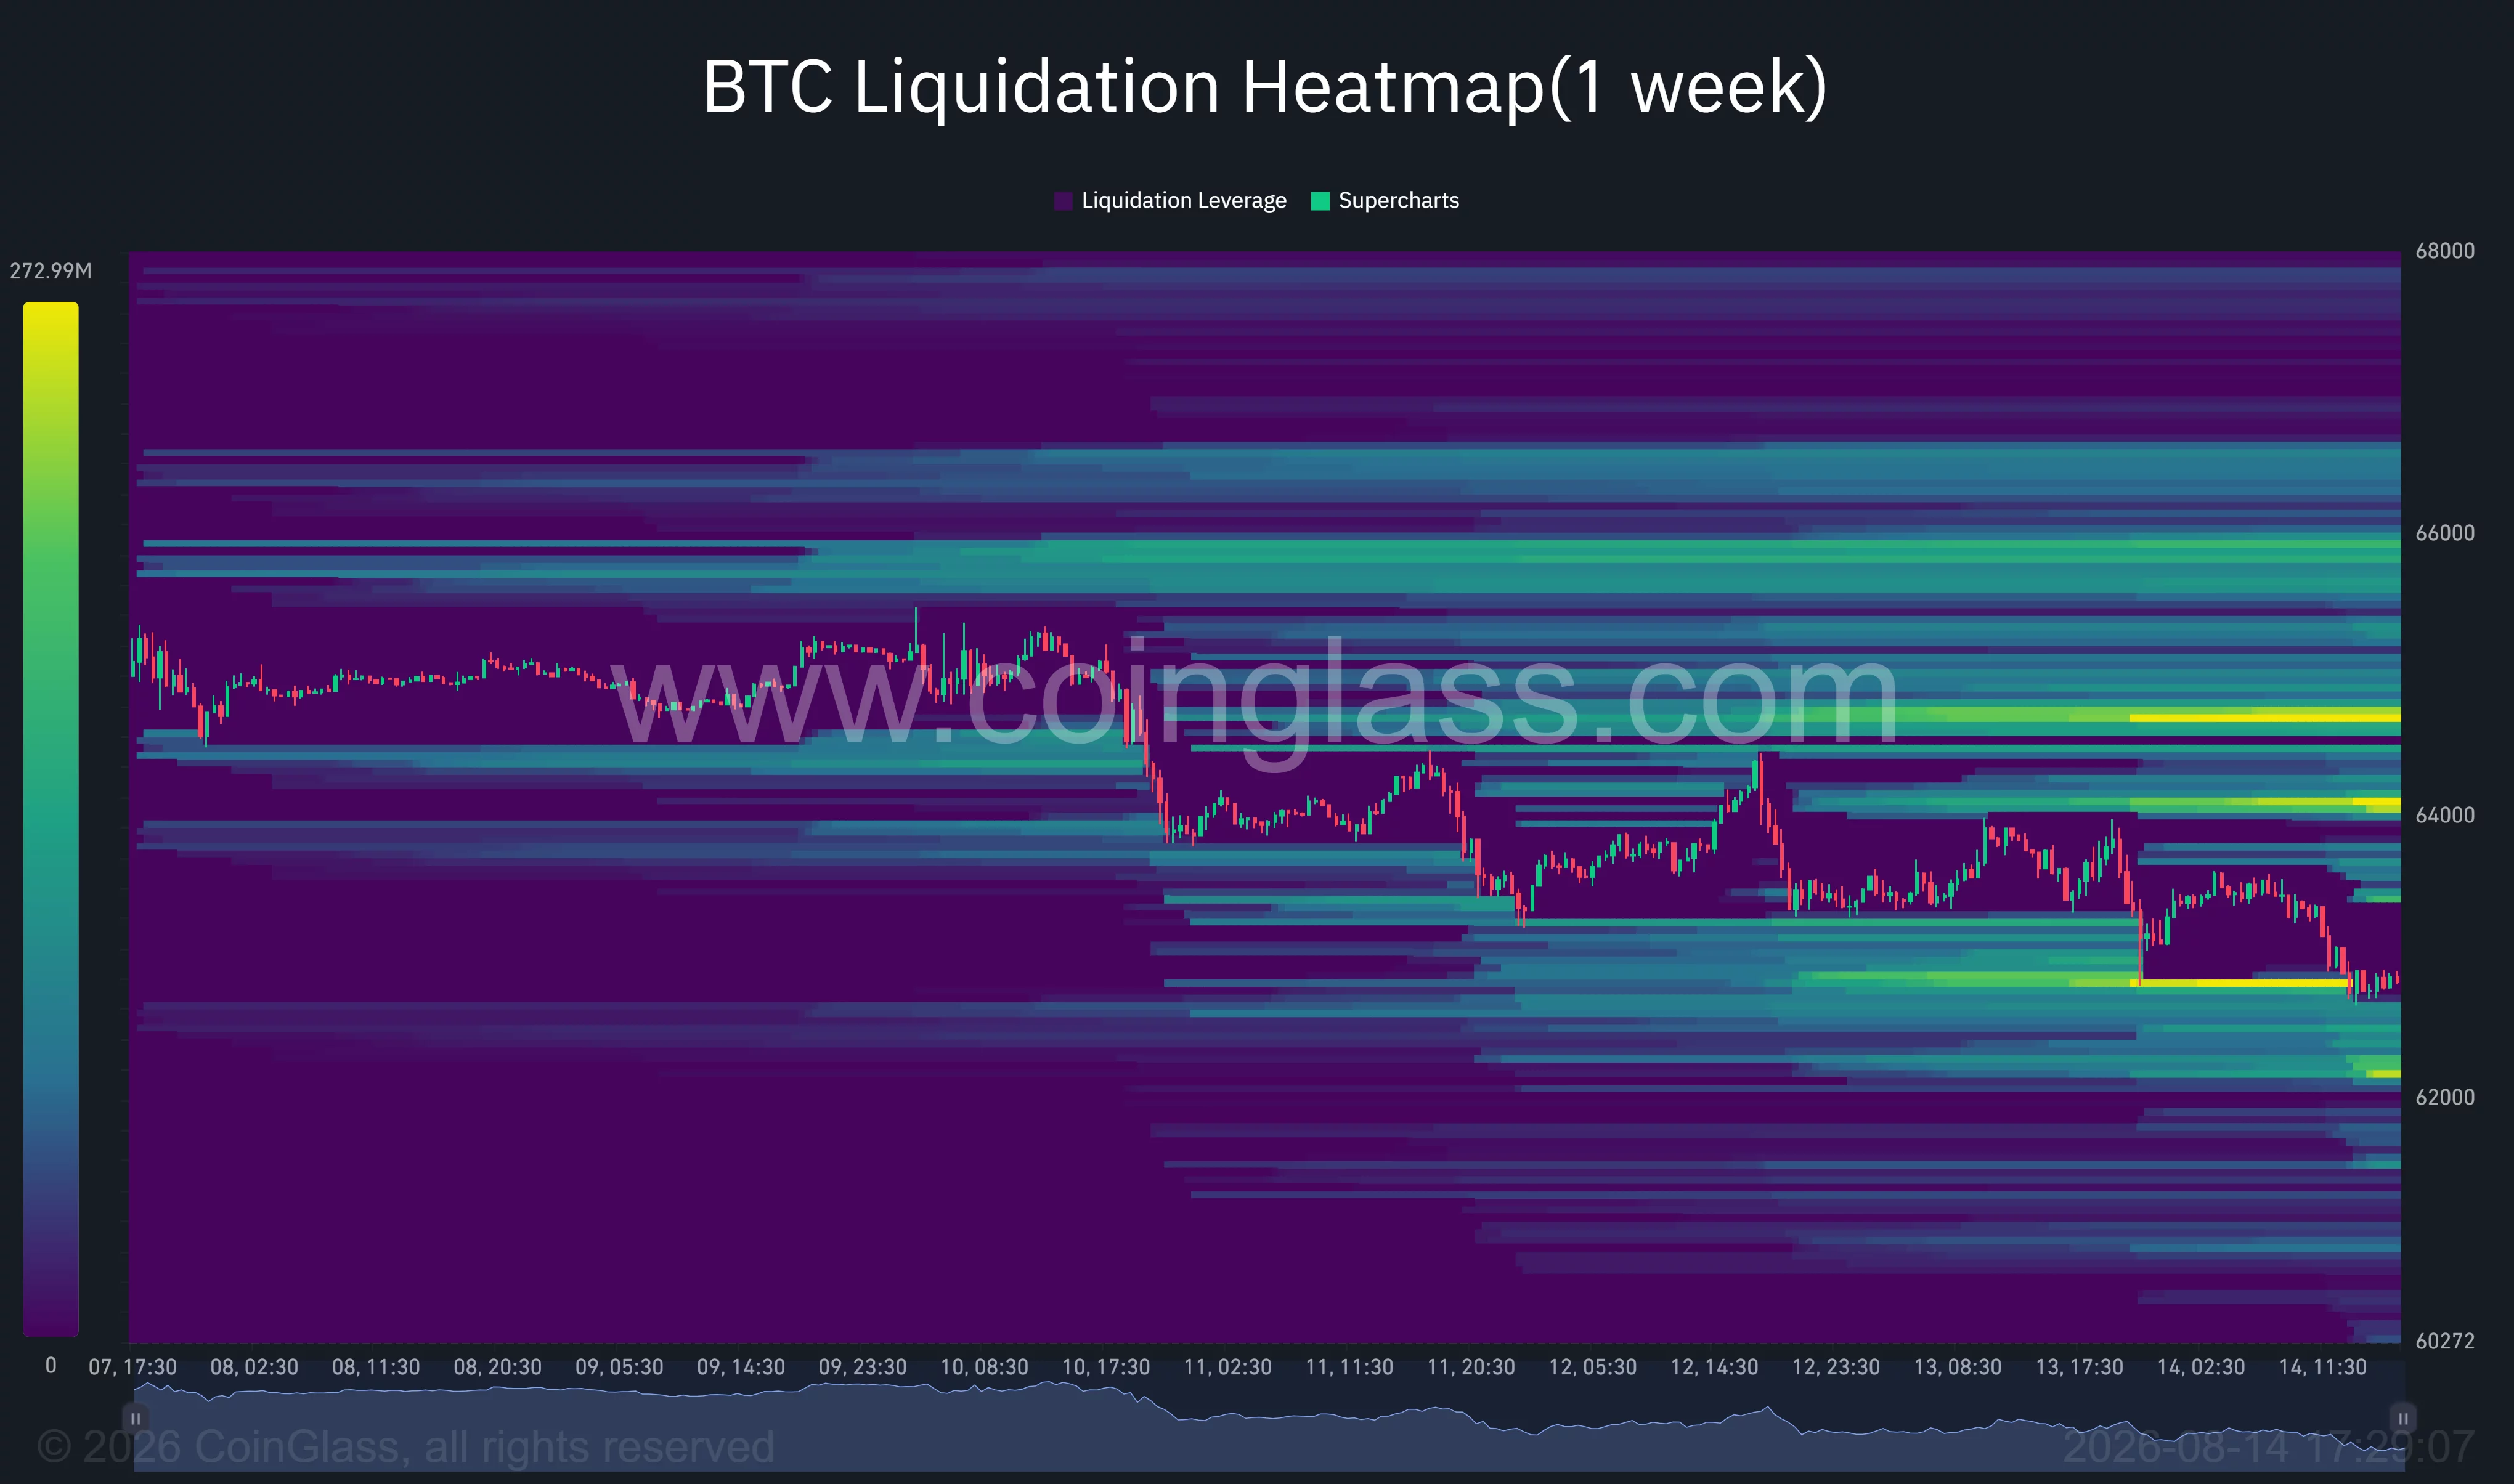
Below $62,000, the next visible liquidity bands appear near $61,500 and $60,300. The lower level also sits close to the bottom of the wider range that formed after Bitcoin’s sharp decline in early June.
For a recovery, Bitcoin must first reclaim $63,500–$64,100. The range includes the whale’s average short entry, the daily Bollinger midpoint, and the 4-hour Supertrend resistance.
A sustained break above $64,100 could expose short positions and pull the price toward liquidation clusters at $64,500–$64,700. Additional liquidity appears near $65,700–$66,000, close to the upper daily Bollinger Band and several previous August highs.
Analysts see $61,500 if the trendline fails
Crypto analyst Gerla said Bitcoin remained compressed inside a multi-week triangle formed by lower highs and a rising support line. According to the analyst, recovering $63,500–$64,000 would bring $65,000 back into play, while losing the lower trendline could send the price toward $61,500.
Gerla leaned toward a downside break because the trading range was tightening while volume declined. Lower volume near the apex of a triangle often precedes a larger move, but the pattern does not determine which side will break first.
Analyst Lennaert Snyder separately said Bitcoin had broken below a $63,900 momentum level and was testing the previous day’s low around $62,800. Snyder identified the prior weekly low near $62,300 as the next downside target if $62,800 fails.
Snyder also noted that the U.S. Dollar Index was weak while Bitcoin continued to fall. Because a weaker dollar can normally support dollar-denominated risk assets, Bitcoin’s inability to benefit indicated weak demand within the crypto market, according to the analyst.
Weekend trading adds another risk in both directions. Thinner order books can make Bitcoin more sensitive to large trades, potentially allowing a move through $62,200 or $64,100 to travel quickly toward the next liquidation cluster.
Disclosure: This article does not represent investment advice. The content and materials featured on this page are for educational purposes only.
Crypto World
Bitcoin (BTC) price slips as U.S. PPI fails to spark gains, ETFs see August’s first two-day drawdown
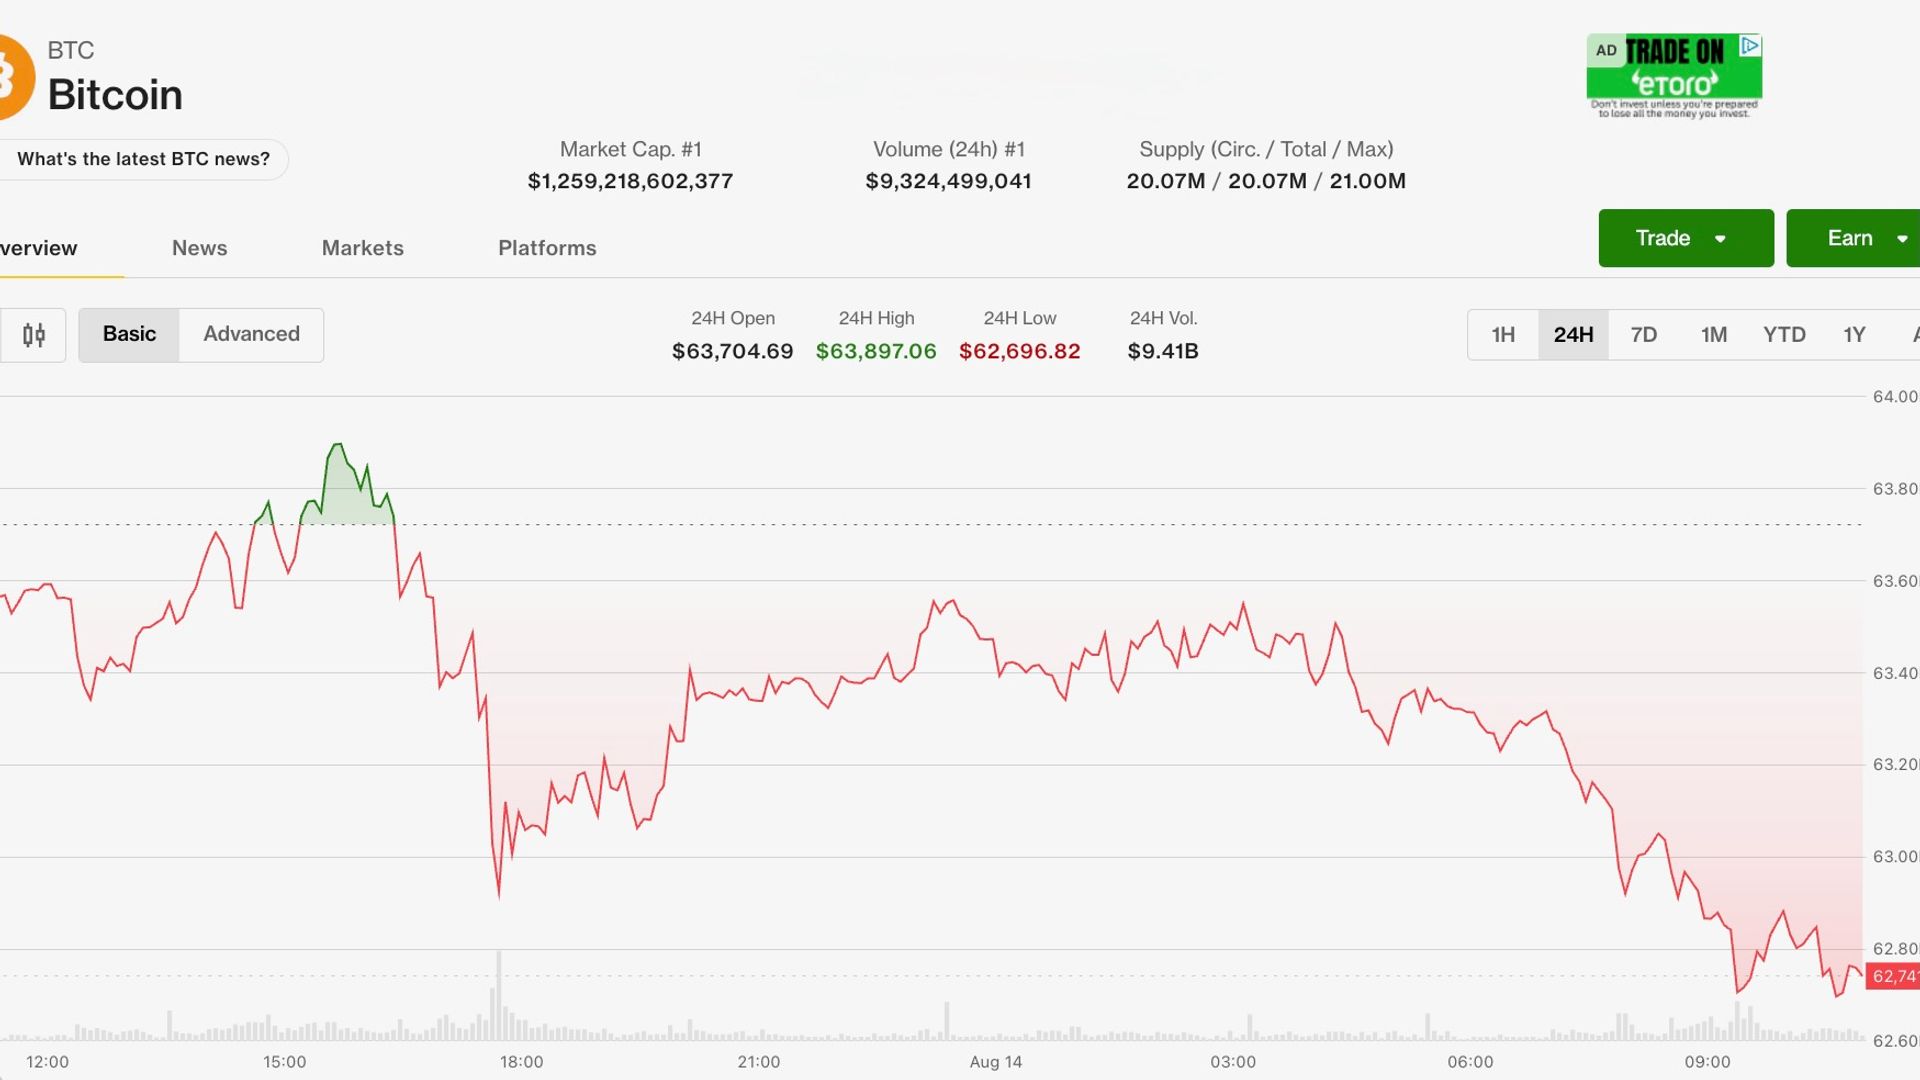
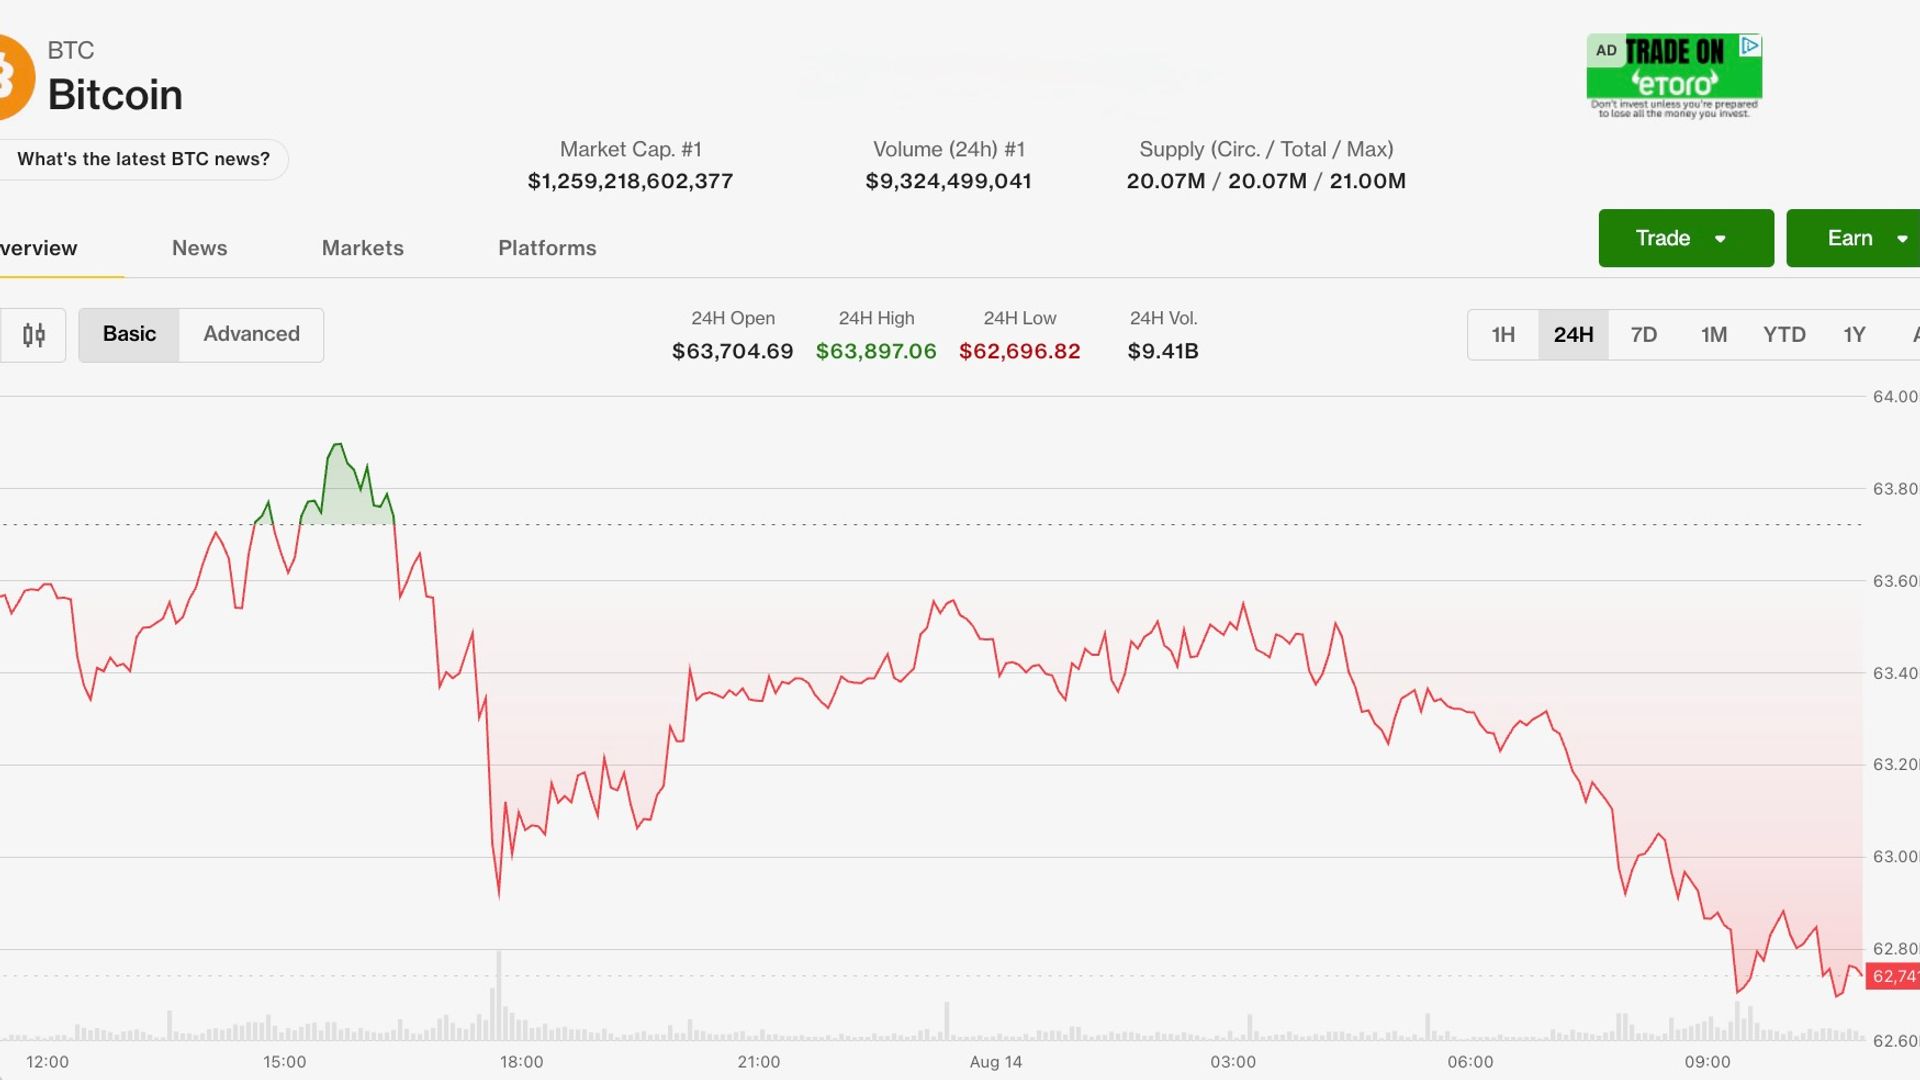
Bitcoin dropped below $63,000, losing 1.14% since midnight UTC as a second day of outflows from spot exchange-traded funds and a lack of bullish catalysts weighed on the crypto market.
Spot bitcoin ETFs experienced the first back-to-back days of outflows since late July with $192 million exiting the products, according to SoSoValue.
The largest cryptocurrency is now trading at its lowest point since Aug. 3 having wiped out all of last week’s rally. Ether is down by 0.73% since midnight, while a portion of the altcoin market continues to show resilience, outperforming crypto majors.
U.S. equities were boosted on Thursday by producer price inflation data, which cooled to 4.7%, below forecasts. The S&P 500 and Nasdaq 100 both rallied following the report, and futures on the indexes remain marginally in the black.
Derivatives positioning
- Futures churn continues: While the crypto market is under pressure, the long-short taker ratio in futures remains balanced, with longs accounting for half of the flow. 24-hour volume growth is again outpacing open interest (OI) growth by a wide margin. That’s a sign of churn rather than fresh positioning.
- BCH sees heaviest fresh shorting: Futures tied to Bitcoin Cash are the biggest OI gainer of the past 24 hours, adding 10% to 1.64 million tokens as the spot price drops 3%. That combination points to short positions being built up. Deeply negative annualized funding rates support that interpretation. The 24-hour OI-adjusted cumulative volume delta (CVD) is negative too, signaling that shorts are trading more aggressively via market orders rather than passive limit orders. Together, these signals point to positioning for a deeper selloff in the token.
- BTC OI rises alongside falling price: Bitcoin is another OI gainer, with the tally rising over 3% to 765,000 BTC alongside a negative CVD. Annualized funding rates, however, still hold mildly positive.
- HBAR shows the clearest bearish tilt: The token’s 24-hour CVD is the most negative among the top 25 coins, with funding rates around -20%, pointing to a market clearly dominated by bears. More broadly, all the top 25 are showing negative CVD.
- Bitcoin volatility cools: BTC’s 30-day implied volatility index, BVIV, fell back below 36%, erasing a spike to nearly 39% earlier this week. That points to continued investor interest in overwriting strategies — approaches aimed at generating extra yield on top of spot holdings. Ether’s equivalent index, EVIV, is showing the same pattern.
- Options positioning stays mixed: On Deribit, BTC calls at the $70,000, $69,000 and $67,000 strikes rank among the five most-traded bets. For ETH, puts at the $1,700 and $1,780 strikes ranked higher instead.
Token talk
- Ether.fi (ETHFI) is the standout performer over the past 24 hours, rallying by 11.5% after adding tokenized stocks and DeFi loans to its neobank platform. The token gave back some of the gains on Friday, dropping 3.3%.
- Cosmos also experienced upside. The token surged by more than 10% in 24 hours and trading volume jumped by 232% to $51 million despite the absence of a clear news catalyst.
- Fetch.ai and monero (XMR) extended their positive weeks, rising 0.55% and 0.81%, respectively, since midnight UTC.
- NEAR, MORPHO, TAO and JUP all lost around 2% since midnight as cautious sentiment remains the dominant theme across the crypto market.

‘Dead’ baby found alive in body bag welcomed back home after ‘miracle’
Stocks open little changed after notching a record high in the previous session

Gregory Robinson and the James Webb Telescope Is TIME’s 2022 Innovator of the Year


-

 Fashion7 days ago
Weekend Open Thread: Mattifying Sunscreen
-

 News Videos6 days ago
Can Astrology Help Find Gold and Silver Trends? A Financial Astrology Guide
-

 Tech7 days ago
Rinn Pharma & Biopharma to join NordicPharmaTrain network
-

 Business5 days ago
Datadog: Best Of Breed For Multiple Reasons
-

 Business5 days ago
How to Start a Cleaning Business: A Step-by-Step Guide
-

 Business5 days ago
BDC Weekly Review: Private BDC Q2 Numbers Are Strong
-
 NewsBeat3 days ago
Communication cards help banking customers access services or report scams
-
 Business3 days ago
Oil Price Today (August 11): Crude oil rises to $88 after Trump’s compensation demand dents Hormuz opening. Here’s why
-

 Fashion7 days ago
Weekly News Update, 8.6.26 – Corporette.com
-

 Fashion5 days ago
Amazon Sundays: Closet Care Before Fall
-

 Business6 days ago
SharkNinja Keeps Eating
-
 Entertainment6 days ago
10 R-Rated Drama Movies That Can Be Called Masterpieces
-

 Politics6 days ago
Be quiet, Miriam! – spiked
-

 Business6 days ago
Mutual Fund Manager Scoops Up Beaten-Down Stocks
-

 Politics5 days ago
Ben-Gvir’s crocodile project halted but abuses at Ketziot Prison continue
-

 Entertainment7 days ago
Warren Hudson’s Dad Releases Audio Of Threats
-

 Politics7 days ago
Welsh independence campaign group YesCymru sets 2032 referendum target
-

 Business5 days ago
5 Things You Must Know About Jorge Messi, the Father and Longtime Agent Who Shaped Lionel Messi’s Career
-

 Politics5 days ago
The Church of England’s ruinous reparations racket
-
 Entertainment7 days ago
Jason Statham Officially Returns in 2 Weeks With Blockbuster New Release
You must be logged in to post a comment Login