
Crypto World
Stagflation 2.0: Today Gold Surges, Oil Slips, Bitcoin Hyper Fills the Gap
Brent crude has slid toward $116 per barrel, while Today gold rebounds toward $4,550, a divergence that has historically served as one of the clearest diagnostic signals of stagflation. Top analysts framing this as a revived safe-haven bid capture the mechanics: energy falls on demand destruction, bullion rises on inflation fear, and the combination compresses every asset class that depends on either growth or purchasing power stability.
Bitcoin is trading at $71,043 at the time of this analysis, recovering from a test of $70,000 support after ETF outflows hit $708 million in a single week on hawkish Fed positioning at 3.50%–3.75%. The stagflation crypto thesis is no longer speculative; it is playing out in real time across commodity and digital asset markets.
Discover: The best pre-launch token sales
Today Gold Surges as Oil Slips: Is This the Stagflation Tell Markets Feared?

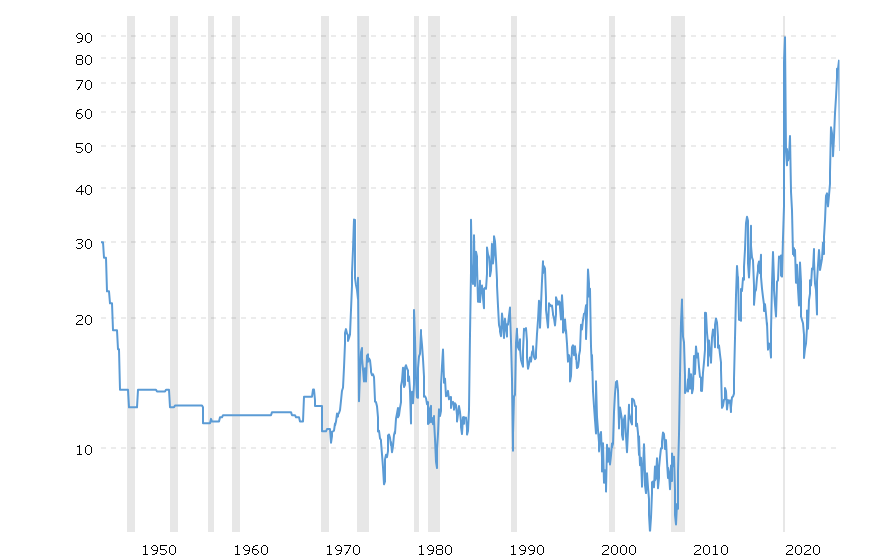
(Source – Gold Vs Oil Ration, Macro Trends)
The Gold vs Oil ratio has spiked sharply, a move that historically coincides with regime shifts rather than routine corrections. When oil falls due to recession fear, while gold rises due to currency debasement anxiety, markets are not pricing two independent events. They are pricing a single macro condition: slowing output, sticky inflation, and collapsing confidence in central bank credibility.
The 1970s episode remains the reference point. During that decade’s stagflation cycle, gold appreciated by more than 2,000%, while oil-linked equities eventually cratered amid a demand collapse. Bloomberg analysts note a similar pattern of divergence is re-emerging, with gold’s current trajectory reflecting what they describe as structural safe-haven rotation rather than a tactical trade. The Brent decline of roughly 8% over recent weeks against gold’s concurrent push toward all-time highs near $4,550 reinforces that framing.
What makes the current setup more acute is the Fed’s position. Rates held at 3.50%–3.75% signal the central bank is not prepared to sacrifice inflation control to defend growth, the textbook stagflation trap. Fiat-denominated assets absorb both sides of that squeeze. Hard-capped assets do not. That distinction is driving the capital rotation visible in both gold’s sustained climb and the crypto market’s underlying accumulation data.
Does Bitcoin Decouple From Oil and Track Gold in a Stagflation Regime?

(Source – Zerocap)
On-chain accumulation data from Zerocap’s weekly market wrap shows massive underlying BTC buying even as ETF outflows registered surface-level bearish sentiment. That divergence — institutional paper selling while spot wallets accumulate — is a structural tell. Bitcoin is beginning to mirror gold’s behavior rather than oil’s, consolidating its Digital Gold narrative in real time.
The BTC/Gold ratio has remained remarkably stable amid recent volatility, a stark divergence from the correlation patterns that dominated 2022, when BTC tracked risk assets lower alongside equities. Fortune data confirms Bitcoin’s recovery to $71,043 is occurring in an environment where traditional risk-on assets remain under pressure, suggesting the decoupling thesis is gaining structural support rather than just narrative momentum.
Strategy, Metaplanet, and American Bitcoin Corp have all deepened BTC treasury positions through this cycle. Smart money is not treating Bitcoin as a risk-on speculative asset, it is treating it as a fixed-supply hedge against the exact macro regime now unfolding. As capital rotates toward digital scarcity, the next wave of appreciation may not stop at Bitcoin mainnet.
Discover: The best crypto to diversify your portfolio with
Bitcoin Hyper Targets Digital Gold Upside as Stagflation Pressure Mounts
As Bitcoin cements its role as a stagflation hedge, capital is beginning to flow into infrastructure plays designed to unlock its programmable potential. Enter Bitcoin Hyper, the first Bitcoin Layer 2 integrating the Solana Virtual Machine (SVM), built to deliver near-zero-cost microtransactions, DeFi applications, and tokenized real-world assets with seconds-level finality, all settled on Bitcoin L1 security.
The Bitcoin Hyper presale has raised over $28 million with daily inflows averaging approximately $50,000, placing the current token price at $0.01367750 against a total supply of 1,000,000,000 HYPER. Staking is live during the presale with an APY of approximately 41%, designed to bootstrap network security and reward early liquidity providers before exchange listings trigger Phase 2.
The BTCHyper investment case aligns closely with the stagflation thesis. Bitcoin’s fixed supply is the macro argument. Bitcoin Hyper’s SVM execution layer, using a Bitcoin Canonical Bridge for cross-chain wrapped BTC, is the infrastructure that makes that argument programmable. Analysts projecting 2026 highs between $0.10 and $0.50 are pricing in Layer-2 adoption, DeFi integrations, and the same institutional BTC tailwind that is driving mainnet accumulation right now.
Investors tired of commodity whiplash are increasingly researching the Bitcoin Hyper presale as the next growth frontier. With stagflation crypto positioning accelerating and the Digital Gold narrative finding fresh macro confirmation, the window at $0.01367750 is priced for early movers, not latecomers.
Join the Bitcoin Hyper Presale Now
Crypto is a high-risk asset class. This article is provided for informational purposes only and does not constitute investment advice. Always DYOR.
The post Stagflation 2.0: Today Gold Surges, Oil Slips, Bitcoin Hyper Fills the Gap appeared first on Cryptonews.

Ether’s (ETH) liquid supply on the Ethereum network continues to tighten, with exchange netflows, rising staking participation, and declining exchange reserves all pointing to a shrinking pool of readily available tokens.
Analysts suggest this supply contraction may mark the early stages of a “new phase,” potentially establishing a stronger structural price floor for ETH in the market cycles ahead.
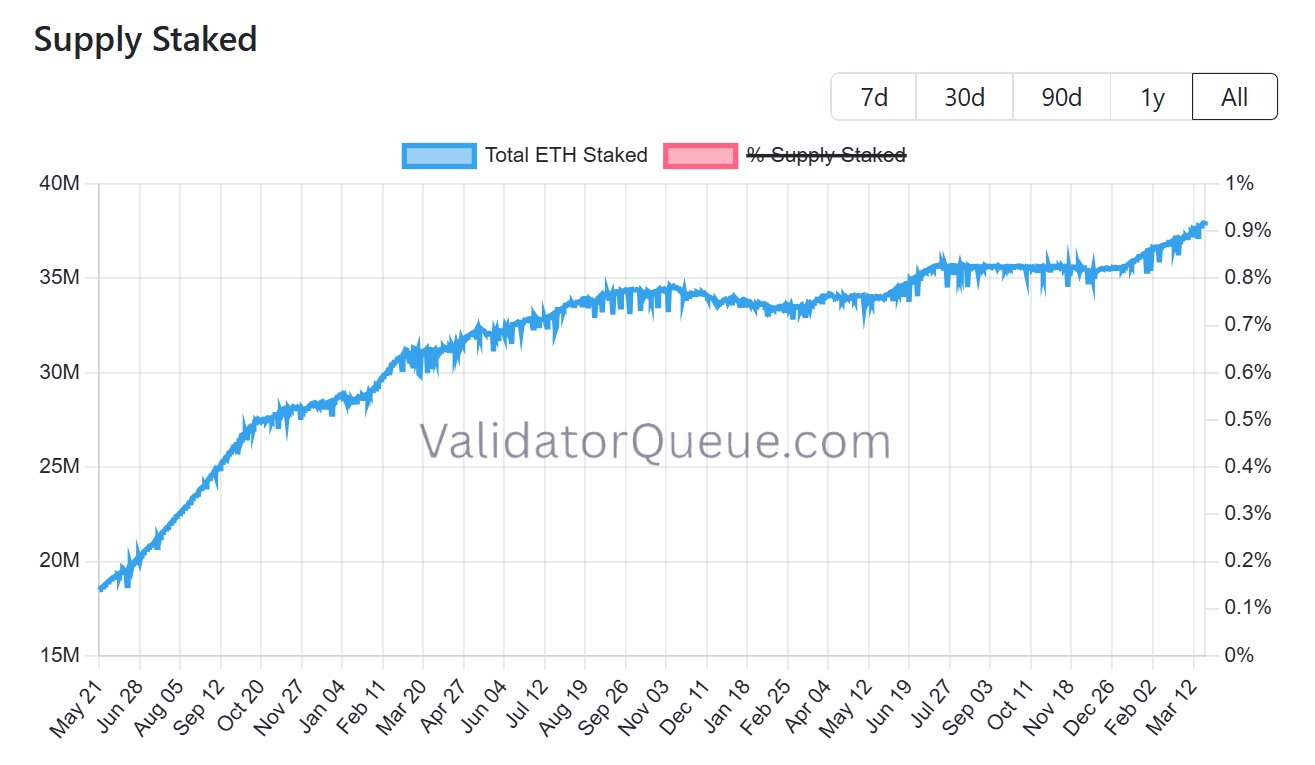
ETH staking locks in 33.1% of the circulating supply
Ethereum’s staking share continues to rise, with about 38.1 million ETH locked on Wednesday, equal to roughly 33.1% of the total supply. Staking infrastructure provider Everstake noted that this is the highest level recorded, marking a steady shift toward illiquid capital rather than tradable inventory. The staking platform said,
“This steady reduction in liquid supply, combined with ongoing demand, creates the conditions for a structurally stronger price environment.”

Crypto analyst Gaah added that this scale of locked ETH creates a visible contraction in the liquid supply.
The ETH validator activity reinforces this trend. The entry queue holds 2,876,752 ETH with an estimated wait time of nearly 50 days, signaling sustained demand to stake.

In contrast, the exit queue contains only 40,504 ETH, with a wait time under 17 hours. The churn rate, capped at 256 validators per epoch, limits how quickly supply can re-enter circulation. This indicates that even if sentiment shifts, unlocking the supply takes time.
Such conditions slow the pace at which ETH can return to exchanges, leaving a significant portion of the supply inactive for trading.
Related: Ethereum price rally pauses at $2.2K: What will trigger breakout?
ETH exchange balances hit multi-year lows
ETH exchange flows have shown consistent outflows across major venues over the past few weeks. Crypto analyst Amr Taha highlighted a $1.67 billion ETH withdrawal from OKX on March 22. Likewise, Binance recorded two separate outflows above $300 million in early February.

The large negative netflows signal that ETH is moving away from exchanges rather than being positioned for sale.
Multiple exchanges reporting sizable withdrawals above, point to a broader contraction in exchange-held supply. The lower balances reduce immediate selling pressure from traders and tighten the available liquidity for spot markets.

CryptoQuant data shows the ETH supply on exchanges has fallen to its lowest level since 2016, with Binance-specific balances currently sitting near its December 2020 lows of roughly 3.3 million ETH.
With fewer coins available for trading, the price sensitivity to demand increases, which may allow ETH to move strongly above its current range near $2,000 to $2,200, once momentum returns.
Related: Ethereum devs up security efforts with new ‘Post-Quantum’ team
This article does not contain investment advice or recommendations. Every investment and trading move involves risk, and readers should conduct their own research when making a decision. While we strive to provide accurate and timely information, Cointelegraph does not guarantee the accuracy, completeness, or reliability of any information in this article. This article may contain forward-looking statements that are subject to risks and uncertainties. Cointelegraph will not be liable for any loss or damage arising from your reliance on this information.


Bitwise CIO Matt Hougan says Circle’s 22% post-CLARITY Act selloff is “excessive,” arguing USDC’s payments moat and a $1.9t stablecoin market by 2030 justify a $75b valuation target.
Summary
- Bitwise CIO Matt Hougan called Circle’s post-regulatory selloff “excessive,” projecting the stablecoin issuer could be worth $75 billion by 2030.
- Hougan cited Citigroup’s revised forecast that the global stablecoin market could reach $1.9 trillion by 2030, arguing the fundamental growth thesis remains intact.
- William Blair analysts added that Circle’s cross-border B2B payments utility is undiminished, even as regulatory uncertainty persists around profit-sharing rules.
Bitwise Asset Management pushed back Wednesday against the market’s reaction to Circle’s recent stock plunge, with CIO Matt Hougan arguing that the stablecoin issuer’s valuation could reach $75 billion by 2030 — well above current levels — and that investors are overreacting to legislative noise. According to The Block, Hougan made the remarks in response to Circle’s (CRCL) share price cratering roughly 22% on Monday after a tougher draft of the CLARITY Act raised the prospect of banning stablecoin yield.
Hougan said the pending legislation has not altered the underlying growth logic of the stablecoin market. He pointed to Citigroup’s updated forecast, which revised its 2030 base case for total stablecoin issuance to $1.9 trillion — up from a prior estimate of $1.6 trillion — and set a bull case of $4.0 trillion, citing accelerating adoption by payment networks, corporations, and financial institutions. Hougan stressed that interest income is not the core driver of stablecoin growth, directly countering the market’s primary fear.
Equity analysts at William Blair echoed the bullish sentiment. In a recent note covered by crypto.news, Blair argued that USDC’s role as a payments “base layer” is being repriced by the market, with Circle’s compliance infrastructure, banking relationships, and cross-chain integrations forming a durable competitive moat — particularly in cross-border B2B payments.
The selloff that prompted Bitwise’s intervention came after the CLARITY Act’s latest draft threatened to restrict stablecoin issuers from distributing yield to holders. The concern is that such a restriction would neutralize one of the key competitive levers that Circle’s rivals use to attract liquidity, though some analysts — including Hougan — argue this could actually advantage Circle by leveling the playing field.
Circle separately froze the USDC balances of 16 business hot wallets late Monday, disrupting operations at several exchanges and platforms, further rattling investor confidence. The move revived longstanding centralization debates around USDC’s architecture, adding to the week’s negative sentiment around the stock.
USDC currently has over $75 billion in circulation, and Circle has processed over $6 trillion in adjusted transaction volume to date. The company reported $1.68 billion in revenue for 2024, the vast majority of it generated through interest on USDC reserves invested in short-term government bonds. Citigroup’s revised $1.9 trillion base-case projection assumes stablecoin issuance will grow at roughly 20% annually through the end of the decade, driven by crypto-native ecosystems, e-commerce adoption, and the substitution of overseas dollar holdings.
William Blair, which maintains an outperform rating on Circle, noted USDC’s 30-day adjusted transaction volume recently hit nearly $6 trillion — dwarfing Tether’s $1.1 trillion over the same period — as evidence that Circle’s network effects are compounding regardless of short-term regulatory turbulence.
Bitwise’s $75 billion target implies significant upside from Circle’s pre-crash valuation and signals that institutional asset managers view the current dip as a buying opportunity rather than a structural break. The firm’s argument, in essence, is that stablecoins will grow with or without yield — and that Circle is best positioned to capture that growth.

The CFTC’s first no-action letter for a self-custodial wallet and a joint SEC-CFTC move classifying XRP as a digital commodity give non-custodial XRP infrastructure a clearer path into regulated derivatives.
Summary
- The CFTC issued its first-ever no-action letter for a self-custodial crypto wallet provider on March 17, granting Phantom Technologies regulatory relief without requiring broker registration.
- XRP treasury firm Evernorth flagged the move as a pivotal moment for XRP, noting the ruling’s core principle — that non-custodial platforms are not financial intermediaries — aligns directly with XRP’s design architecture.
- XRP was simultaneously classified as a “digital commodity” in a joint SEC-CFTC framework released on March 17, pushing the token above $1.50 before it pulled back to $1.41.
A regulatory development that passed largely unnoticed last week is drawing fresh attention from the XRP (XRP) community. On March 24, XRP-focused treasury firm Evernorth flagged that the U.S. Commodity Futures Trading Commission had quietly issued its first-ever no-action letter for a self-custodial crypto wallet software provider — a move Evernorth described as being “hidden by the SEC commodity classification” announced the same day.
The CFTC published Letter No. 26-09 on March 17, granting no-action relief to Phantom Technologies Inc., the developer behind the Phantom wallet — one of Solana’s most widely used self-custodial wallets. The letter stated that Phantom could facilitate derivatives trading access for its users without registering as an introducing broker or associated person, provided it never takes custody of user funds.
Evernorth summarized the significance of the ruling in a post on X: “The core principle: if you don’t hold customer funds, you’re not a financial intermediary.” The firm argued this framework has direct implications for XRP’s infrastructure, given Ripple’s long-standing design philosophy around non-custodial settlement.
Chart analyst @ChartNerdTA amplified Evernorth’s post with the headline “XRP Was DESIGNED For This,” pointing to the convergence of the CFTC no-action letter and XRP’s simultaneous commodity classification as compounding regulatory tailwinds for the token.
XRP Commodity Designation Provides Institutional Framework
On the same date as the Phantom letter, the SEC and CFTC issued a joint interpretive release classifying XRP as a “digital commodity,” formally placing the Ripple-associated token outside the scope of U.S. securities law. Ripple’s Chief Legal Officer Stuart Alderoty responded swiftly on X, stating: “We always knew XRP wasn’t a security — and now the @SECGov has made clear what it is: a digital commodity.”
XRP’s trading volume surged 125% to $3.22 billion on March 17 as the commodity designation was published, pushing its market cap to approximately $93.4 billion and briefly overtaking BNB’s position in the global rankings. The token is currently trading at $1.41, with a 24-hour volume of $2.29 billion and a market cap of $86.4 billion.
The Phantom no-action letter falls under CFTC Letter 26-09, issued by the agency’s Market Participants Division. It allows self-custodial wallets to offer front-end interfaces for CFTC-regulated derivatives — such as futures contracts on designated contract markets — without triggering broker registration requirements, as long as the wallet operator imposes proper risk disclosures, never controls user funds, and maintains records and compliance policies comparable to those of a registered introducing broker.
The implications for XRP are strategic rather than immediate. Evernorth noted that the ruling establishes a regulatory pathway for non-custodial platforms — like those built on the XRP Ledger — to interface with regulated derivatives markets without being reclassified as financial intermediaries. The firm described this as a “significant milestone, particularly for self-custody solutions.”
The CFTC‘s posture under newly confirmed Chairman Brian Quintenz has shifted toward a pro-innovation stance, with the agency advancing a Memorandum of Understanding with the SEC on March 11, 2026, to streamline oversight for dually registered firms and reduce regulatory fragmentation across digital asset markets.

TLDR:
- Bitcoin moved upward against gold as U.S.-Iran tensions rose, defying traditional market flight-to-safety patterns.
- Money rotated out of gold, silver, and stocks, with Bitcoin capturing part of that displaced capital in real time.
- Spot Bitcoin ETFs and institutional allocation in 2026 may be reshaping how the asset responds to geopolitical stress.
- The gold-to-Bitcoin ratio is now a key metric to watch as markets assess whether this safe haven shift is structural.
Bitcoin is drawing fresh attention as geopolitical tensions between the U.S. and Iran escalate. Traditionally, gold has served as the go-to asset during global uncertainty.
However, recent market movements suggest a possible shift. Money appears to be rotating away from gold, silver, and equities.
Bitcoin is absorbing some of that capital. Whether this marks a structural change or a temporary trend remains to be seen.
Bitcoin Captures Flight-to-Safety Capital as Gold Loses Ground
Market observers noted an unusual pattern as U.S.-Iran tensions rose recently. Typically, investors exit risk assets and move into gold during geopolitical stress. This time, Bitcoin moved upward while gold and silver saw outflows alongside equities.
Milk Road, a widely followed crypto newsletter on X, pointed this out directly. The post noted that money was rotating out of gold, silver, and stocks, with Bitcoin catching some of the flight-to-safety bid. That behavior stands out because it rarely happens during geopolitical flare-ups.
Bitcoin shares several core traits with gold. Both assets carry finite supply, operate without counterparty risk, and function as stores of value. However, Bitcoin offers added advantages in borderless access and instant liquidity across any geography.
In situations involving sanctions, capital controls, or cross-border asset freezes, Bitcoin becomes increasingly practical.
Investors who need access to value regardless of location or political circumstance find it more functional than physical gold in those scenarios.
Institutional Presence and ETF Access Add Weight to Bitcoin’s Safe Haven Case
The broader context of this market moment matters. The crypto landscape in 2026 looks markedly different from past cycles. Spot Bitcoin ETFs are now live, and institutional allocation to the asset class is well established.
That institutional base changes how Bitcoin responds to macro stress. In 2022, crypto dropped sharply in risk-off environments.
Today, with deeper liquidity and broader participation, the asset may behave differently under similar conditions.
Milk Road’s post suggested watching the gold-to-Bitcoin ratio closely. If Bitcoin holds or gains ground while geopolitical stress remains elevated, it could signal a more durable shift in how markets treat the asset.
The $100,000 price level remains the target many analysts reference. Reaching it through a geopolitical risk rotation rather than speculative momentum would represent an uncommon path in Bitcoin’s history.
That said, no rotation narrative carries certainty. Bitcoin has historically sold off alongside other assets when risk appetite collapsed broadly.
The next few weeks will determine whether current patterns hold or reverse as the situation between the U.S. and Iran develops further.


The Ethereum Foundation has unveiled its “Strawmap,” a defensive strategy deploying 7 hard forks to achieve full Quantum Resistance by 2029.
The roadmap, drafted by the Foundation’s quantum researchers, targets a radical reduction in block finality to under 16 seconds while migrating the $260 billion network to post-quantum cryptography before the threat materializes.
- Roadmap Scope: The “Strawmap” outlines seven incremental upgrades starting in 2026 to overhaul the consensus layer.
- Technical Target: The protocol aims to deploy STARK-based signatures and achieve Single Slot Finality to neutralize quantum decryption threats.
- Strategic Context: Developers are racing against a roughly five-year window before quantum computers could potentially crack current cryptographic keys.
The Mechanics: Single Slot Finality and Cryptographic Migration
The plan is not a patch; it is a reconstruction. The Strawmap outlines a “Ship of Theseus” approach to replacing Ethereum’s cryptographic foundations without pausing the chain.
The process begins with the Glamsterdam hard fork, tentatively targeted for the first half of 2026, followed by Hegota later that year.

The primary technical objective is the implementation of Post-Quantum Cryptography. Current blockchain security relies on elliptic curve algorithms that theoretical quantum computers could crack in hours.
The upgrades will transition the network toward hash-based signatures (like XMSS and SPHINCS+) and STARKs, which are resistant to brute-force quantum attacks.
This migration is critical for Layer 2 stability as well, where infrastructure halts, such as the recent Arbitrum Sepolia testnet outage, demonstrate the cascading effects of network-level disruptions.
Beyond security, the roadmap prioritizes speed via Single Slot Finality (SSF). Currently, Ethereum requires approximately 15 minutes to fully finalize a block. The Strawmap targets a reduction to under 16 seconds through a consensus redesign known as “Minimmit.” This change would make transaction reversal practically impossible almost immediately after execution, closing the window for reorganization attacks.
The Ethereum Foundation’s quantum team was blunt in their assessment. “Quantum computing will eventually break the public-key cryptography that secures ownership, authentication, and consensus across all digital systems,” the group stated Tuesday.
Strategic Risk: The Race Against Computational Brute Force
This is not a routine upgrade. It is a preemptive strike against an existential threat.
Traditional hacks exploit smart contract logic. A quantum breakthrough skips all of that. It derives private keys directly from the ledger. No code vulnerability needed. The Strawmap exists because that scenario is no longer science fiction.
The Ethereum Foundation executes all 7 Hard Fork upgrades on the 6-month cadence outlined. Quantum resistance goes live before commercial quantum computing becomes viable. Ethereum becomes the settlement layer for global finance with a security guarantee that lasts a century. Single-Slot Finality neutralizes a key speed advantage that faster, centralized L1 competitors like Solana currently hold.
Or the coordination trap closes in. Seven distinct forks in four years demand flawless execution. Ethereum timelines have slipped before.
The Merge. Dencun. If the Strawmap drags into the 2030s, the network enters a quantum emergency window in which the hardware to crack the chain is available before the defenses are live. Quantum researcher Pierre-Luc Dallaire-Demers told DL News that Bitcoin-style cryptography could be cracked within 4 to 5 years. That timeline puts enormous pressure on every fork in this sequence.
Watch the EIP inclusion lists for the Glamsterdam fork in early 2026. That is the signal that this has moved from research to engineering.
Ethereum is rebuilding its engine at full speed. The result sets the security standard for the entire digital asset class.
Discover: The best new crypto in the world
The post Ethereum Unveils 2029 ‘Strawmap’: 7 Hard Forks to Beat Quantum Threats appeared first on Cryptonews.

Ethereum’s on-chain dynamics are signaling a tightening of liquid supply, driven by rising staking participation and sustained withdrawals from exchanges. With roughly 38.1 million ETH staked, about 33% of the circulating supply is now locked in validator deposits, a level that market watchers say marks a meaningful shift toward illiquid, long-hold positions. At the same time, exchange reserves have continued to dwindle, suggesting less readily available supply for fast sales in spot markets. Some analysts argue this could lay the groundwork for a more resilient price floor as demand persists.
Analysts emphasize that the combination of higher staking and shrinking exchange buffers may create a more two-sided market — less supply chasing bid demand in the near term, which could support ETH prices during repeated market pauses. Still, observers caution that the full implications will depend on how quickly stake participation expands further and how exchanges respond to ongoing outflows during turbulent periods.
Key takeaways
- About 38.1 million ETH are staked, equating to roughly 33.1% of circulating supply, the highest level on record and signaling a shift toward illiquid capital.
- The staking pipeline remains robust: an entry queue of about 2.88 million ETH carries an estimated wait of ~50 days, while an exit queue of around 40,500 ETH has a near-term wait of under 17 hours.
- Exchange reserves for ETH have fallen to multi-year lows, with notable withdrawals from major venues (including OKX and Binance) and overall outflows indicating reduced liquid supply on hand for trading.
- CryptoQuant data shows ETH balances on exchanges at a level not seen since 2016, with Binance balances hovering near Dec-2020 lows, around 3.3 million ETH.
- Analysts caution that these dynamics could strengthen support levels and potentially enable sharper moves higher in a rebound, especially if demand remains firm and momentum returns.
Staking expands, liquidity tightens
Ethereum’s staking activity continues to climb, with the validator ecosystem absorbing more capital as participants lock their ETH into proof-of-stake security. The latest figures show about 38.1 million ETH staked, representing roughly one-third of the circulating supply. Stakeholders have framed this as a structural shift away from tradable inventory toward long-hold, illiquid capital that cannot be readily tapped for selling in a market downturn.
In a commentary thread, Everstake — a prominent staking infrastructure provider — highlighted that this steady reduction in liquid supply, coupled with ongoing demand, is fostering a stronger price environment over the longer term. The argument rests on the idea that less ETH available on the market during selloffs could lessen downside pressure and support price stability as buyers step in.
“This steady reduction in liquid supply, combined with ongoing demand, creates the conditions for a structurally stronger price environment.”
Supporting the staking trend, the validator queue shows continuing interest in securing ETH commitments. ValidatorQueue tracks a total of approximately 2.88 million ETH awaiting validation, with an estimated wait of close to 50 days. This cadence underscores that demand to participate in staking remains solid, even as the time to earn staking rewards lengthens for new entrants.
Conversely, the exit queue — the amount of staked ETH seeking withdrawal — remains relatively modest by comparison, at around 40,500 ETH with a wait time under 17 hours. The protocol’s churn cap of 256 validators per epoch further constrains how quickly liquidity can re-enter circulation. Taken together, these dynamics imply that even if sentiment shifts, the market will not see a rapid flood of previously staked ETH returning to tradable supply.
Exchanges drain reserves, reducing selling pressure
Another visible trend is the steady outflow of ETH from centralized exchanges. Over the past several weeks, inflows to major venues have given way to sustained net withdrawals, a signal that traders are moving ETH off exchanges in anticipation of longer-term holding or staking rather than immediate sale.
Notable episodes include a $1.67 billion ETH withdrawal from OKX on March 22, coupled with large, multi-hundred-million-dollar outflows observed at Binance in early February. These actions contribute to a shrinking frame for immediate selling and tighten liquidity in spot markets, making it harder for sellers to press prices downward on short notice.
CryptoQuant data reinforces the narrative of a tightening supply on exchanges. ETH balances on exchanges have declined to their lowest levels since 2016, with Binance’s holdings approaching the lows last seen in December 2020 — roughly 3.3 million ETH. The reduced exchange stockpile implies less readily available inventory to meet selling pressure, potentially amplifying price sensitivity to demand shifts when buyers re-enter the market.
With fewer ETH perched on exchange books, the market could become more responsive to shifts in appetite, allowing price moves to be more pronounced when momentum returns. While the current range has circled roughly around $2,000 to $2,200, tighter supply conditions can help push the next leg higher if demand proves resilient.
What this implies for ETH’s trajectory
Taken together, the tightening liquid supply picture points to a broader structural development rather than a short-term swing. The market is witnessing a gradual rebalancing: more ETH locked in staking, fewer coins available on exchanges, and a churning ecosystem that keeps unlocks measured by epoch-based rules. Analysts describe this as the early stage of a potential “new phase” in ETH’s supply dynamics, one that could raise the floor beneath prices during a broader market downturn and support more durable gains when risk appetite returns.
As one analyst noted, the combination of rising staking participation and constrained liquidity means ETH could respond more decisively to renewed demand compared with earlier cycles. In practice, this translates to a market where price resilience and upside velocity may become more dependent on sustained demand and staking inflows than on near-term supply shocks.
For investors and builders, the evolving balance of staking, validator activity, and exchange reserves underscores the need to watch on-chain flows alongside price action. If staking continues to rise while exchanges remain tight, ETH could see a more pronounced price response to positive catalysts, including network upgrades, developer activity, or favorable macro conditions.
As readers monitor the next steps, key questions remain: Will the pace of staking accelerate further, and how will major exchanges respond to continued outflows? How will the evolving on-chain liquidity profile interact with market sentiment during the next cycle of price discovery? And how might these structural shifts influence ETH’s role in a broader crypto ecosystem that increasingly prizes security, efficiency, and long-hold capital?
Keep an eye on staking metrics and exchange flow data in the coming weeks, as they will offer early signals about how ETH’s supply dynamics are evolving and where price action could follow next.
Some traders have ignited a fresh market debate by giving a prediction that the XRP price is fundamentally undervalued, arguing the asset should already be trading at $10. This bold assertion surfaced during a broader valuation discussion sparked by real estate mogul Grant Cardone, who recently posited a $280,000 target for Bitcoin.
While Bitcoin struggles to reclaim its October highs, XRP currently trades at $1.42, showing a modest disparity between market reality and traders’ theoretical valuation. The 7x gap between the current price and the $10 target implies a market capitalization surge to roughly $610 billion, a figure that would fundamentally reshape the crypto hierarchy.
Discover: The best pre-launch token sales
XRP Price Prediction: Can Ripple Break Resistance to Target $10?
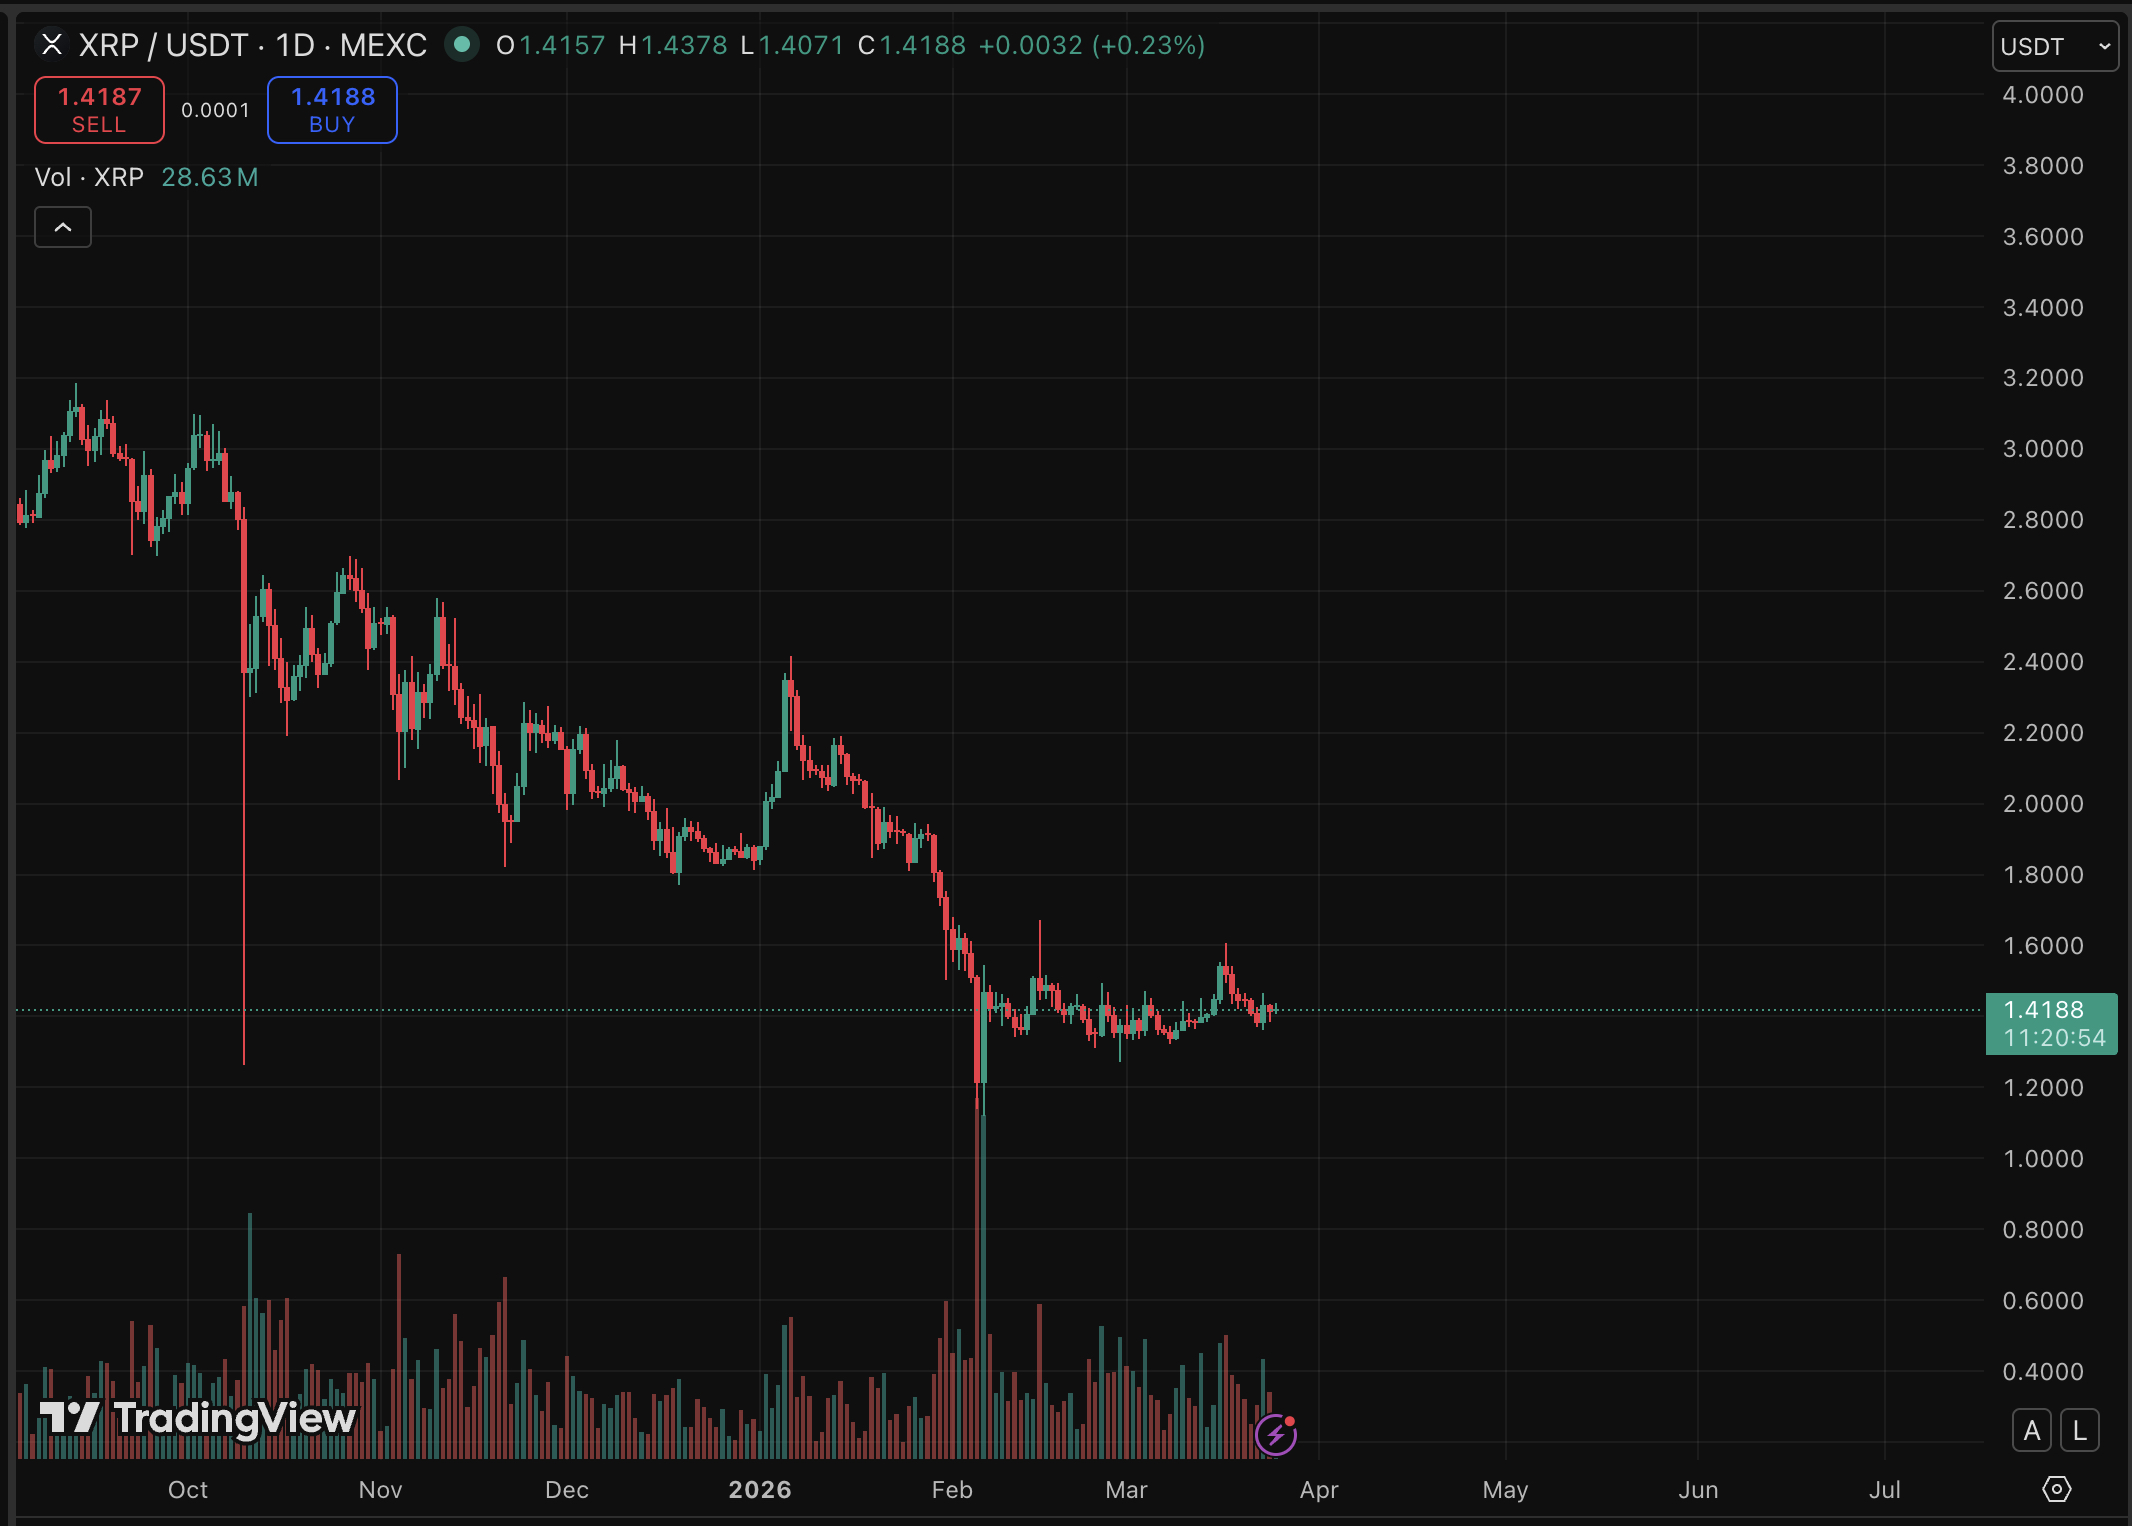
At press time, XRP is changing hands between $1.41 and $1.42, holding precariously above the critical support floor of $1.27. This level, aligned with the 23.6% Fibonacci retracement, serves as the primary defense against a deeper slide toward $1.11. Analysts describe the current zone as “capitulation territory,” where short-term holders often exit at unrealized losses, potentially clearing the books for accumulation.
For the $10 narrative to gain technical traction, XRP must first dismantle the descending trendline resistance at $1.51. Beyond that, a formidable supply wall exists in the $1.76–$1.80 range, where nearly 1.85 billion tokens were previously accumulated.

Long-term data offers a mixed outlook. While optimistic models target $2.45 to $8.00 through 2026, sustaining a price above $10 would likely require the XRP Ledger to capture significant volume from traditional finance sectors, potentially aided by SWIFT’s evolving blockchain pivot.
Discover: The best crypto to diversify your portfolio with
Bitcoin Hyper Targets Early Mover Upside as XRP Tests Key Levels
While established assets like XRP face the heavy lifting required to move multi-billion dollar market caps, capital is increasingly rotating toward infrastructure plays resolving Bitcoin’s scalability issues. Smart money often seeks early-stage protocols where technological breakthroughs drive repricing, rather than relying solely on legacy asset appreciation.
Leading this new wave is Bitcoin Hyper ($HYPER), the first-ever Bitcoin Layer 2 to integrate the Solana Virtual Machine (SVM). The project has already raised a staggering $32 million in its presale, signaling massive institutional and retail interest in high-performance Bitcoin infrastructure.
What could Hyper be cooking up? — Bitcoin Hyper (@BTC_Hyper2) March 25, 2026

 https://t.co/VNG0P4GuDo pic.twitter.com/XHI9QxT4Tv
Bitcoin Hyper distinguishes itself by delivering sub-second finality and the programmability of Solana while anchoring to Bitcoin’s security layer. Priced currently at $0.0136, the token offers a low entry point with a huge 36% APY staking rewards.
Disclaimer: Crypto is a high-risk asset class. This article is provided for informational purposes and does not constitute investment advice.
The post XRP Price Prediction: Is $10 Plausible? appeared first on Cryptonews.


Ethereum isn’t waiting for quantum computers to become a problem before figuring out how to survive them.
The Ethereum Foundation launched pq.ethereum.org on Wednesday, a dedicated resource hub for the protocol’s post-quantum security effort. The site consolidates a roadmap, open-source repositories, specifications, research papers, EIPs, and a 14-question FAQ written by the EF’s post-quantum team.
More than 10 client teams are already building and shipping devnets weekly through what the foundation calls PQ Interop, the foundation said in an X post earlier Wednesday.
Today, several teams at the EF are launching https://t.co/L9ZOUoRNNB, a dedicated resource for Ethereum’s post-quantum security effort.
What started with early STARK-based signature aggregation research in 2018 has grown into a coordinated, multi-team effort, all open source.…
— Ethereum Foundation (@ethereumfndn) March 24, 2026
The technical challenge is substantial. Quantum computers are widely believed to will eventually break the public-key cryptography that secures ownership, authentication, and consensus across Ethereum.
The EF’s position is that a cryptographically relevant quantum computer isn’t imminent, but migrating a decentralized global protocol takes years of coordination, engineering, and formal verification.
The migration touches every layer of the protocol.
At the execution layer, post-quantum signature verification through a vector math precompile would let users transition to quantum-safe authentication through account abstraction without a disruptive “flag day” where everyone has to upgrade simultaneously.
At the consensus layer, the current BLS validator signature scheme gets replaced with hash-based signatures called leanXMSS, with a minimal zk-based virtual machine handling aggregation to restore scalability since post-quantum signatures are larger.
At the data layer, post-quantum cryptography extends to blob handling for data availability.
This connects directly to the strawmap piece from earlier this month where Ethereum co-creator Vitalik Buterin called the document “very important” and walked through the finality improvements. The post-quantum push stood out then because it treated quantum threats as a concrete engineering problem with specific fork targets rather than a hypothetical.
While quantum computing represents a threat category that attacks the cryptographic foundations rather than the physical infrastructure, the protocols that prepare earliest will be the most resilient when such a system eventually materializes.
Crypto World
BitGo Adds CIP-56 Token Standard Support on Canton Network, Enabling Custody for USDCx and cBTC
TLDR:
- BitGo extends its Canton Network infrastructure to support CIP-56 token standard assets including USDCx and cBTC.
- The CIP-56 standard offers privacy-preserving transfers and atomic settlement tailored for regulated financial institutions.
- Canton Network now processes over $350 billion in on-chain assets daily, reflecting rapid institutional blockchain adoption.
- BitGo, the largest Bitcoin custodian globally, is expanding qualified custody across Canton’s growing financial ecosystem.
BitGo has announced support for CIP-56 token standard assets on the Canton Network, adding USDCx and cBTC to its qualified custody platform.
This move builds on the company’s October 2025 launch of Canton Coin custody. The Canton Network now processes over $350 billion in on-chain assets daily.
The expansion positions BitGo as a key infrastructure provider for institutions operating within Canton’s growing financial ecosystem.
CIP-56 Brings Institutional-Grade Features to Canton
The CIP-56 token standard functions similarly to ERC-20 on Ethereum, providing a common interface for wallets, custodians, and applications.
However, it includes additional capabilities tailored to regulated financial markets. These features make it more suitable for institutions handling large-scale transactions.
The standard supports privacy-preserving transfers, which protect sensitive trading data during settlement. It also enables atomic Delivery-vs-Payment settlement, reducing counterparty risk across transactions.
Multi-step transfers allow administrators to control asset movement between approved parties. Together, these features create a compliant, composable environment for real-world assets moving on-chain.
Deterministic finality within seconds and predictable transaction costs further support institutional workflows. These qualities are critical for organizations managing large volumes of trades or settlements.
By integrating CIP-56, BitGo can now support any asset issued under this standard across the Canton Network. This reduces friction for institutions seeking custody solutions on the platform.
BitGo has expanded its @CantonNetwork infrastructure to support CIP-56 token standard assets, bringing qualified custody to USDCx, and cBTC.
Chen Fang, Chief Revenue Officer at BitGo, spoke on the growing role of the network. “Canton is rapidly becoming one of the most important networks for institutional digital finance,” Fang said.
“By supporting CIP-56 assets, BitGo provides the custody infrastructure needed for institutions to participate in Canton’s growing ecosystem.” His remarks reflect the company’s broader commitment to expanding institutional blockchain infrastructure.
Melvis Langyintuo, Executive Director and Head of the Canton Foundation, also weighed in on the development. “CIP-56 is the standard that enables interoperability across the Canton ecosystem,” Langyintuo stated.
“BitGo’s support for CIP-56 assets strengthens the network’s institutional infrastructure and makes it easier for participants to build applications and financial products on Canton.” Both statements point to a shared goal of deepening institutional access to the network.
Three Assets Mark the Start of BitGo’s CIP-56 Rollout
BitGo’s CIP-56 launch covers three assets addressing different institutional needs. USDCx is a USDC-backed stablecoin issued through Circle’s xReserve protocol.
It combines dollar liquidity with Canton’s privacy architecture, making it suitable for on-chain repo settlement and other capital markets workflows. The asset is already being used in live capital markets operations.
cBTC brings Bitcoin liquidity into Canton’s financial infrastructure. The asset is fully backed 1:1 by Bitcoin, allowing institutions to use BTC for collateral, settlement, and trading.
As the largest Bitcoin custodian globally, BitGo is well-positioned to serve institutional cBTC users on the network. This makes the pairing between cBTC and BitGo a natural fit for the market.
USDXLR, issued by Excellar, generates rewards on stablecoin holdings through delta-neutral strategies. It can be used for settlement, liquidity, and collateral workflows while returning yield to holders.
This makes it attractive for institutions seeking returns on stable assets. As a CIP-56 asset, it fits within the broader Canton composable financial infrastructure.
BitGo stated it will continue expanding support for additional Canton assets as more financial institutions and tokenization platforms adopt the network.
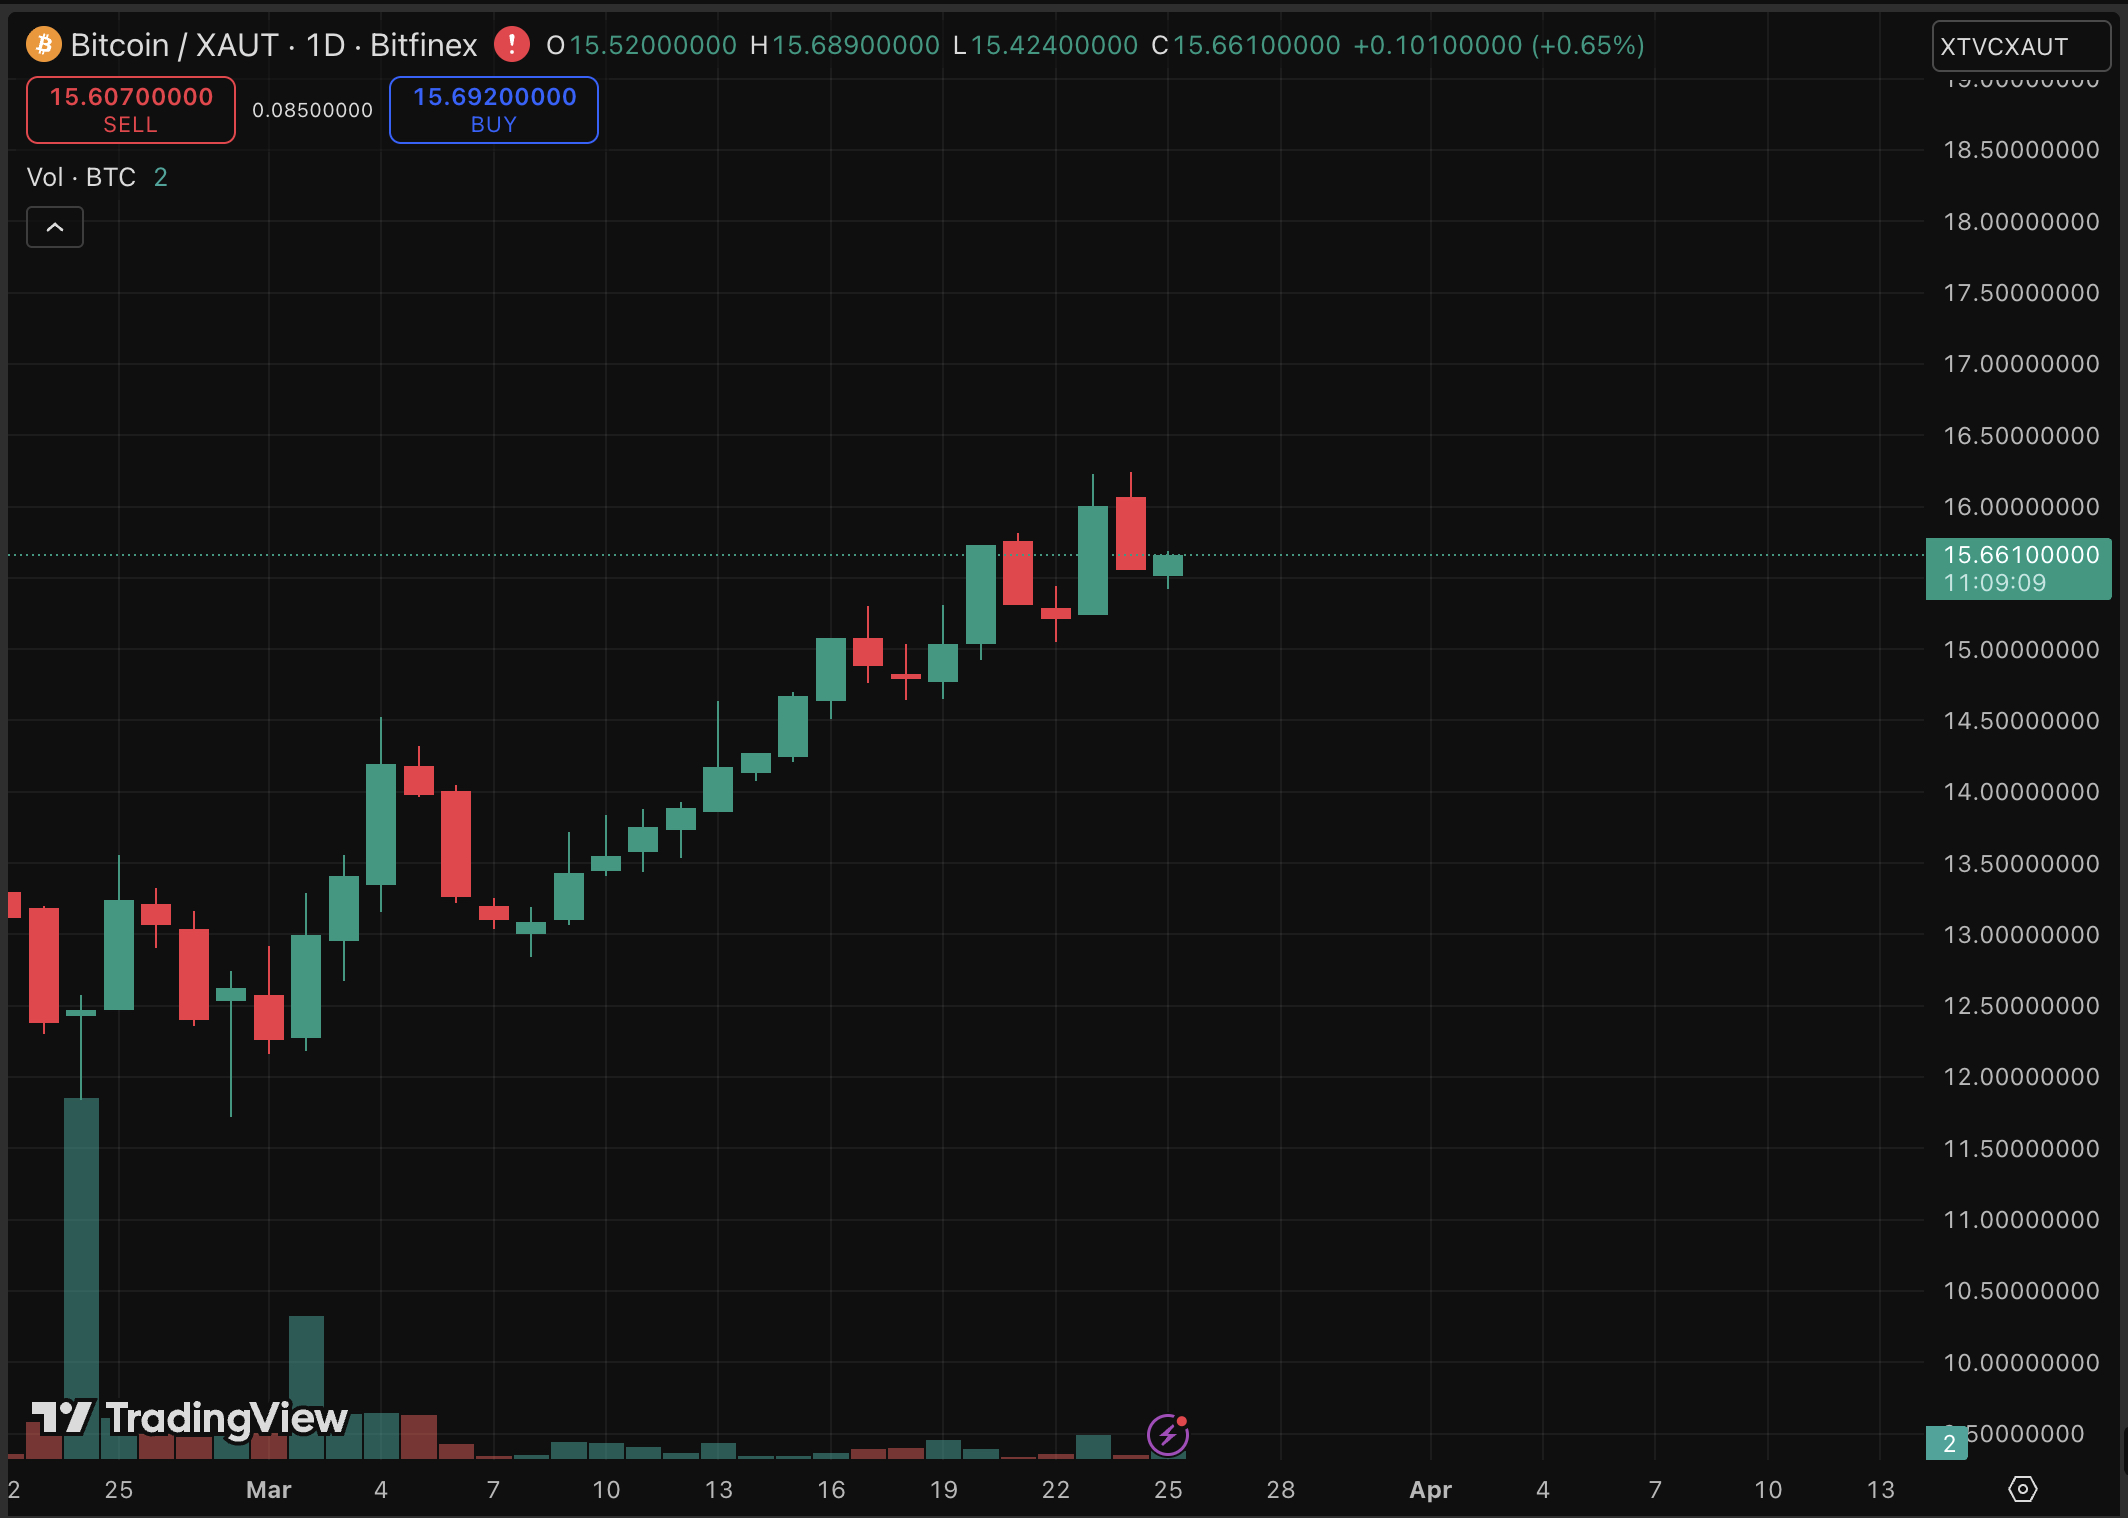
While gold suffers its worst losing streak since February 1920, plummeting for 10 consecutive days, the BTC USD price is consolidating its dominance as the premier alternative asset. Since the start of the Middle East conflict, the Bitcoin-to-gold ratio has surged roughly 30%, with the digital asset currently holding the $70,000 line despite macro headwinds.

The yellow metal has dropped as much as 27% from its January all-time highs, finding support only at the $4,090 mark. In sharp contrast, Bitcoin trades near $71,493, signaling distinct institutional strength even as Fed policy decisions regarding March 2026 rates momentarily shook risk assets. As capital rotates, the technical setup suggests a pivotal moment for digital markets.
Discover: The best pre-launch token sales
Can BTC USD Break $71,500 Price Resistance Post-FOMC?
Bitcoin is currently trading in a tight range between $71,000 and $72,000 following the Federal Reserve’s decision to maintain rates at 3.5%–3.75%. The immediate price action reflects a recovery from a 5% decline tested earlier in the week, where BTC briefly touched $72,100 before sellers stepped in.
For bulls to regain control, a confirmed breakout above the $72,000 resistance level is required. If achieved. However, loss of the middle Bollinger Band at $69,555 could retest lower liquidity zones near $67,500. This resilience aligns with recent BTC USD price volatility signals, indicating a potential bottom formation.
JACK MALLERS JUST SAID: "BITCOIN’S PRICE IS JUST NOISE. EVERY DIP IS A CHANCE TO OWN A BIGGER SLICE OF MONETARY FREEDOM." — CryptoSavingExpert ® (@CryptoSavingExp) March 24, 2026
 pic.twitter.com/39LCtBQ66l
The divergence from gold is stark. While Bloomberg analysts note gold’s “exhaustion” after falling 12% since late February, Bitcoin’s ratio has climbed from 12 ounces to just below 16 ounces per coin. If history repeats, where gold leads and consolidates before Bitcoin catches up, the current crypto consolidation may be the precursor to an aggressive repricing event.
Discover: The best crypto to diversify your portfolio with
Bitcoin Hyper Targets Infrastructure Upside as Layer 2s gain Traction
As Bitcoin cements its role as a store of value comparable to gold, the narrative is shifting toward utility and scalability, specifically through Layer 2 solutions. Just as the mainnet establishes a $70,000 floor, capital is beginning to flow into infrastructure plays designed to unlock Bitcoin’s programmable potential. This rotation favors projects like Bitcoin Hyper ($HYPER), which aims to bridge the speed of Solana with the security of Bitcoin.
Bitcoin Hyper positions itself as the first-ever Bitcoin Layer 2, integrating the Solana Virtual Machine (SVM). This architecture allows for sub-second finality and smart contract execution on Bitcoin, addressing the core limitations of slow transactions and high fees.
The data suggests the market is hungry for this utility: the project has raised an impressive $32 million in its presale phase to date.
Hyper offers a speculative angle on the ecosystem’s growth. The token is currently priced at $0.0136, with high staking APY incentives for early participants.
Disclaimer: Crypto is a high-risk asset class. This article is provided for informational purposes only and does not constitute investment advice. always DYOR.
The post BTC USD Price Outlook: Bitcoin Resurgence and Gold Losing Streak appeared first on Cryptonews.

CDDFT bosses say breast cancer service is “now safe”

Perfect Snacks launches high-protein bar

Ether Supply Tightens as Staked ETH Reaches New 38M High


-
 Crypto World5 days ago
NIO (NIO) Stock Plunges 6.5% as Shelf Registration Sparks Dilution Worries
-

 Fashion5 days ago
Weekend Open Thread: Adidas – Corporette.com
-

 Politics5 days ago
Jenni Murray, Long-Serving Woman’s Hour Presenter, Dies Aged 75
-
 NewsBeat13 hours ago
Manchester United reach agreement with Casemiro over contract clause amid transfer speculation
-

 Crypto World4 days ago
Best Crypto to Buy Now: Strategy Just Spent $1.57 Billion on Bitcoin During Fear While Early Investors Quietly Enter Pepeto for 150x Potential
-

 Crypto World4 days ago
Bitcoin Price News: Bhutan Sells $72 Million in BTC Under Fiscal Pressure, but the Smart Money Entering Pepeto Sees What the Market Does Not
-

 Tech6 days ago
inKONBINI Lets You Spend Summer Days Behind the Register
-

 Sports2 days ago
Remo Stars and Kano Pillars Strengthen Survival Hopes in NPFL
-

 Politics6 days ago
Gender equality discussions at UN face pushbacks and US resistance
-

 Business3 days ago
No Winner in March 21 Drawing as Prize Rolls to $133 Million for Next
-

 Sports2 days ago
Gary Kirsten Accuses Pakistan Cricket Board Of ‘Interference’, Mohsin Naqvi Responds
-

 Tech3 days ago
Give Your Phone a Huge (and Free) Upgrade by Switching to Another Keyboard
-

 Sports5 days ago
2026 Kentucky Derby horses, odds, futures, preview, date: Expert who nailed 12 Derby-Oaks Doubles enters picks
-
Sports7 days ago
Vikings Free Agency Enters Phase 2 with Key Questions
-

 Tech3 days ago
AI enters the chat: New Seattle dating app relies on tech to facilitate meaningful human connections
-

 News Videos7 days ago
Amazing Cardboard Gadget That Turns Paper Into Money #techgadgets #ytshorts
-

 Politics6 days ago
Scotland’s rejection of assisted dying is a victory for humanity
-

 Tech7 days ago
Corsair K100 Air Wireless Mechanical RGB Keyboard Packs Full Power Into a Slim Frame
-

 Business6 days ago
DLocal: Entering 2026 At Escape Velocity
-
Business5 days ago
Columbia Sportswear enters $500 million credit agreement with JPMorgan Chase
You must be logged in to post a comment Login