
Crypto World
Strategy Posts $12.4B Loss as Bitcoin Falls Below Cost Basis


Michael Saylor’s Strategy reported a $12.4 billion net loss for the fourth quarter, driven largely by mark-to-market declines in its massive Bitcoin holdings. The loss coincided with Bitcoin briefly slipping below $60,000, pushing the firm’s stash beneath its cumulative cost basis for the first time since 2023 and wiping out gains made after last year’s U.S. election rally.
For years, Strategy transformed itself from an enterprise software company into a leveraged Bitcoin proxy, exploiting a persistent premium in its stock price to raise capital and buy more BTC. That strategy is now faltering. The treasury company announced no new equity issuance or debt financing alongside earnings, signalling tightening access to capital as investor appetite cools.
While Saylor has insisted there are no margin calls and said the firm holds $2.25 billion in cash, enough to cover interest obligations for more than two years, pressure is mounting as Bitcoin continues to trade well below Strategy’s reported average acquisition price of $76,052. The company also reiterated that it does not expect to generate profits in the foreseeable future.
Strategy Holds 713,502 BTC Worth $46 Billion
Strategy currently holds more than 713,000 Bitcoin, valued at roughly $46 billion, per Bloomberg data. Although the firm added $75.3 million worth of BTC in late January, analysts say the broader model is under strain. Benchmark analyst Mark Palmer told Bloomberg that investors are now focused on whether Strategy can still raise capital to fund additional Bitcoin purchases under worsening market conditions.
Critics have grown louder. As reported earlier Michael Burry recently warned that continued declines in Bitcoin could trigger cascading losses for corporate holders, reviving concerns long raised by short sellers about Strategy’s reliance on leverage and non-yielding assets. Strategy’s shares are now down nearly 80% from their November 2024 peak, underscoring how quickly sentiment has turned.
BitMine Faces $8.2B Unrealized ETH Loss as Ether Slides Below $2,000
BitMine Immersion Technologies is also sitting on roughly $8.2 billion in unrealized losses after Ethereum’s price fell to around $1,930, well below the firm’s average purchase price of $3,826 per token. The company holds about 4.29 million ETH, acquired for roughly $16.4 billion, and has seen the value of those holdings shrink following a nearly 30% decline since early January.
Despite the drawdown, BitMine has staked more than 2.9 million ETH, generating about $188 million in annual yield, holds $538 million in cash with no debt, and says it views the sell-off as a buying opportunity, even as its shares have plunged 88% from their July peak, echoing losses seen at Michael Saylor’s Strategy.
The post Strategy Posts $12.4B Loss as Bitcoin Falls Below Cost Basis appeared first on Cryptonews.


Key Takeaways
- AppLovin shares tumbled approximately 9% Thursday, marking a 35% retreat from its $745 peak earlier this year.
- Bearish traders amplified concerns regarding competitive threats, intensifying downward momentum amid weakening investor sentiment.
- Between March 11-12, CEO Adam Foroughi executed 44 stock sales; days later, a board member offloaded more than 130,000 units.
- Fourth-quarter 2025 performance exceeded expectations: $1.66B revenue (surpassing forecasts), net profit surged 84% annually, yearly free cash flow reached $3.95B.
- Broader economic concerns, including recession possibilities and inflation estimates approaching 4.2%, contributed to the stock’s weakness.
AppLovin shares retreated approximately 9% during Thursday’s session, trading around the $396 level. No adverse company announcements triggered the decline. Instead, the selloff reflected mounting short-seller activity combined with widespread market jitters.
Bearish investors amplified claims questioning the sustainability of AppLovin’s competitive positioning and whether its artificial intelligence-driven advertising technology can maintain market dominance. These arguments gained momentum following a notable spike in executive stock disposals.
CEO Adam Foroughi executed 44 separate stock sales on March 11-12, with transaction prices ranging from $449 to $481 per share. Board member Eduardo Vivas subsequently sold over 130,000 units on March 16, at prices between $446 and $465. During the 90-day period ending March 26, insiders completed 155 transactions with virtually zero purchase activity to counterbalance the disposals.
This selling activity provided ammunition for bearish traders, despite strong fundamental business metrics.
Financial Performance Remains Robust
AppLovin’s fourth-quarter 2025 financial results demonstrated exceptional strength. The company posted $1.66 billion in revenue, exceeding analyst projections by 3.35%. Net profit reached $1.1 billion, representing an 84% year-over-year increase. The adjusted EBITDA margin stood at an impressive 84%.
Fourth-quarter free cash flow totaled $1.31 billion. Annual free cash flow climbed to $3.95 billion—an 89% year-over-year surge. The company deployed $2.58 billion toward repurchasing 6.4 million stock units throughout 2025.
Operating expenses declined to merely 23% of revenue in Q4, compared to 37% in the prior-year period. Such dramatic margin improvement is uncommon in the technology sector.
CEO Foroughi addressed skeptics during the Q4 earnings conference: “When I look at our internal dashboards, we are delivering the strongest operating performance in our history.”
Wall Street analysts remain predominantly optimistic. Morgan Stanley maintains an Overweight recommendation with an $800 price objective. Goldman Sachs holds a Neutral stance at $710. Among all covering analysts, 24 recommend buying, 3 suggest holding, and only 1 advises selling. The average price target stands at $648.
Economic Headwinds Compound Selling Pressure
Broader economic conditions are exacerbating investor concerns. Market participants remain anxious about escalating tensions involving Iran, climbing oil prices, and materially elevated recession probabilities according to economists.
A Thursday OECD report forecast U.S. inflation could reach 4.2% this year—substantially above the Federal Reserve’s recent 2.7% projection from the previous week.
APP has declined 35% year-to-date and fallen 38% over the trailing six-month period. The stock reached approximately $745 at its 52-week high.
For the first quarter of 2026, AppLovin provided revenue guidance of $1.745–$1.775 billion with anticipated adjusted EBITDA margins of 84%. Elevated call option trading activity indicates continued near-term price volatility is probable.


Financial compliance has always been balanced on a delicate line: regulators need sufficient visibility to keep bad actors out, but users want their financial lives kept private just to make a payment or trade. In 2025, that tension is sharper than ever. We have stricter anti-money laundering (AML) rules, broader data-protection regimes, more cross-border activity and, at the same time, better privacy-enhanced technology than we’ve ever had.
The good news is we no longer have to sacrifice privacy to ensure compliance. Zero-knowledge proofs (ZKPs) provide a solution to the so-called privacy paradox: regulators need assurance that rules are followed, but exposing full identities and transaction details creates security, legal, and data protection risks. ZKPs let us flip the model from “show me the data” to “show me a proof,” enabling firms to demonstrate compliance without revealing underlying information.
This approach is not designed to obscure regulatory oversight. Instead, it modernizes the compliance toolset so regulated firms can demonstrate compliance with their legal duties (sanctions screening checks, KYC obligations, segregation of client assets, capital checks) without transferring or exposing the underlying data. ZKPs may be better for users and, in the long term, for regulatory compliance, because proofs are verifiable and tamper-evident.
What zero knowledge actually does
A zero-knowledge proof is a cryptographically powered way of saying: “I can prove to you that I followed rule X, but I won’t show you the sensitive information usually required to prove that.” In finance, “rule X” can be very concrete: “this wallet was screened against the current sanctions list”; “this user holds a valid KYC credential from a trusted issuer”; “this exchange holds client assets 1:1 and they reconcile to liabilities”; “this transaction is below (or within) an allowed range,” and so on.
Today, we can be required by law to report large datasets to specific regulators. We comply with applicable data protection laws, but this also increases the risk of cybersecurity breaches and misuse. A ZK-based approach proves the outcome, not all the inputs. If a regulator needs to go deeper, a process can be designed for selective disclosure of particular required data (viewing keys, time-bound access, and full audit logs, granted under due process as necessary), like a permissioned regulatory portal or window.
Why this matters now
Three trends are converging.
In the EU, supervisors are making anti-money laundering (AML) controls more granular, while GDPR and other privacy regimes emphasise data minimisation and purpose limitation. These can be complementary rather than opposing each other: compliance should provide the same or better assurance with less routine exposure of personal data. This objective may be achieved by utilising privacy-preserving reporting techniques.
Second, digital identity frameworks (such as those envisaged under eIDAS 2.0) are getting closer to reality. They are built on the same building blocks as ZK: verifiable credentials, selective disclosure and cryptographic attestations. That makes it far more realistic to issue portable “I passed KYC” or “I am not sanctioned” credentials that can be proven, not re-collected, across multiple services.
Third, supervisors are exploring privacy-enhancing technologies, including proof verification models.
What a proof-based compliance stack could look like
We already have live examples. ZK-enhanced proof-of-reserves is the best-known one: an exchange proves it has the assets to meet customer liabilities without revealing individual balances. That is a zero-knowledge assurance.
You can do the same for sanctions screening. Instead of sending the full identity every time, a wallet presents a proof that it was checked against the latest list at a specific time. The regulator, or a regulated VASP on the other side, runs a verifier node to confirm the proof is valid and up to date. It is important to note that ‘verifier nodes’ are a policy proposal that operate as an oversight infrastructure for supervisors to validate proofs without collecting bulk data.
You can also do it for segregation: a custodian proves that client assets are not co-mingled with house funds via a range or sum proof, without publishing the entire ledger. You can even layer this into smart contracts: transactions don’t execute unless the proof passes. That is “programmable compliance” – rules enforced at transaction time in ‘real time’, rather than afterwards.
For regulators, the key shift is from collecting raw data to verifying cryptographic evidence. They still get assurance, auditability and traceability when there is a legal basis to unmask. But they do not have to hold or process significant amounts of personal data by default, reducing both operational and legal risk.
Answering key questions
Regulators are already beginning to embrace targeted ZK pilots, ranging from verifiable proof-of-reserves to Travel Rule compliance that validates user attributes without exposing full datasets. As these primitives mature, they naturally scale into market-integrity controls, allowing firms to demonstrate they are within concentration and exposure limits through range and sum proofs without revealing underlying positions.
Critically, ZK is not a synonym for opacity; well-architected systems utilize selective disclosure via viewing or multi-party keys. This ensures that law enforcement access is narrow, provable and subject to due process rather than remaining universal and silent.
What regulators could require
To work across borders, we need standards: standard proof types (e.g., “not on sanctions list X as of date Y”), standard credential formats and standard verifier logic that can be inspected. That is how you avoid every exchange, wallet, or bank building its own version and creating unnecessary supervisory complexity for supervisors.
Concretely, regulators may benefit from six things:
- Outcomes over data (tell me what you proved, not everything you hold);
- Least-information proofs (prove only what is necessary for this obligation);
- Programmable checks (enforced at transaction time where appropriate);
- Strong data-availability and exit mechanisms (users can always confirm their balances and withdraw);
- Verifiable verifier logic (inspections, test vectors, audit logs);
- No generalized backdoors (disclosure only under lawful, narrow, logged processes).
Binance is a global exchange that already uses ZKPs for demonstrating reserves. Our proof-of-reserves (POR) system uses a Merkle tree – a cryptographic structure that condenses many account entries into a single “fingerprint” – together with zero-knowledge proofs to demonstrate that customer assets are fully backed without revealing individual balances. With each POR update, users can confirm that their balance is included in the tree, while ZKPs ensure that the overall totals are correct and that no negative or fake balances are included. The result is independent, privacy-preserving verification of reserves that builds trust without compromising personal data.
But this is bigger than one company. If we get this right, we can make financial compliance more precise, more respectful of privacy law, and easier to supervise.
This will take collaboration. Regulators will need to develop proof standards they accept; industry will need to align on, and incorporate the proof standards, and standard-setting bodies will ensure proof standards are interoperable across borders.
What success looks like
Success is when a user can prove legitimacy without oversharing; a bank, VASP, or exchange can meet AML/Travel Rule obligations with smaller data disclosures; a regulator can run a verifier node and get real-time assurance; and bad actors can be unmasked under clear, narrow, lawful conditions.
In short, assurance with less disclosure. As cyber risk rises, privacy laws evolve, and cross-border digital finance grows, moving from routine bulk data collection to verifiable proofs is a pragmatic upgrade to supervisory practice.
References to EU privacy law in this op-ed reflect the framework as of November 2025; the Commission’s Digital Omnibus proposals remain subject to change through the ordinary legislative process.


Ethena price hovers just under $0.10 as heavy futures leverage, whale withdrawals and a long unlock schedule reshape how ENA supply moves across DeFi.
Summary
- Ethena is trading around $0.098, with daily volume above $225 million and market capitalization close to $840 million.
- Derivatives activity remains heavy, with open interest close to $952 million and futures volume over $830 million in the last 24 hours.
- Recent token unlocks and whale withdrawals from exchanges are tightening liquid supply even as DeFi yield narratives keep Ethena in focus.
Ethena (ENA), the governance token for the synthetic dollar protocol behind the USDe stablecoin, is changing hands at about $0.09831 today, with 24‑hour trading volume of $225.14 million and a market cap of $838.98 million. CoinMarketCap data show ENA’s unlocked market cap matches the headline figure at $838.98 million, while its fully diluted valuation is higher given a total and max supply of 15 billion tokens. The token’s volume‑to‑market‑cap ratio stands at 26.83%, indicating unusually brisk turnover relative to its size and pointing to active trading interest.
ENA sits at the intersection of DeFi and synthetic assets, with 8.22 billion tokens in circulation out of 15 billion total, and roughly 87.89 thousand on‑chain holders according to CoinMarketCap’s statistics page. The project is structured around USDe, a synthetic dollar instrument, and sENA, a staked token used for protocol governance and restaking‑style security, placing Ethena within the broader restaking and yield‑bearing DeFi sector rather than as a base layer or AI token. Coinbase data similarly frame ENA as part of a growing class of DeFi governance assets, with prior snapshots showing market capitalization above €2.11 billion when the token traded closer to €0.33.
On the derivatives side, CoinGlass reports Ethena trading at $0.2422 in its futures overview, with 24‑hour futures volume of $832.15 million, spot volume of $66.99 million, market capitalization of $1.93 billion, and open interest of $392.29 million at that time. Coinalyze’s aggregated open interest dashboard shows ENA open interest at approximately $952.7 million, up 7.31% over 24 hours, capturing the notional value of both coin‑ and stablecoin‑margined contracts. Together, those figures underscore a derivatives‑heavy market structure where leverage plays a central role in short‑term price action.
Whale and unlock dynamics add another layer. CoinMarketCap’s latest Ethena updates highlight a whale withdrawal of $4 million in ENA from Binance on March 24, 2026, a move interpreted as accumulation and a potential reduction in immediately sellable exchange supply. A separate analysis of token unlocks from Yahoo Finance points to a March 2 unlock of 40.63 million ENA, worth about $4.21 million at the time, representing 0.53% of released supply and allocated to the Ethena Foundation. CoinMarketCap’s token‑unlock schedule confirms monthly unlocks running until April 2027, implying a persistent supply overhang that markets must absorb over time.
Ethena’s design, centered on creating a synthetic dollar yield product that behaves more like a fixed‑income instrument, sets it alongside other DeFi protocols bridging on‑chain and traditional‑style returns. CoinMarketCap’s AI summary notes roadmap items including development of an Ethena chain using USDe as gas and expanded restaking utility for sENA, both initiatives aimed at deepening protocol usage and fee generation. In parallel, token‑unlock tracking and derivatives statistics emphasize how ENA’s near‑term price will likely continue to be driven by the interplay between unlock supply, whale positioning, and leveraged futures activity, rather than purely spot investor flows.


In today’s newsletter, Claudia Marcela Hernández analyzes how stablecoins have evolved past volatility-fixers to become the foundational settlement asset for global tokenized markets and cross-border payments, following the clarity provided by the GENIUS Act.
Then, in Ask an Expert, Morva Rohani breaks down how stablecoin regulation serves as a foundation for tokenized capital markets, why some jurisdictions see U.S. stablecoin policy as a risk, and the key factors advisors must use to assess a stablecoin’s credibility.
Learn about the latest advancements in the Clarity Act in Keep Reading.
Happy Reading.
Are stablecoins the infrastructure reshaping global finance?
Stablecoins were originally designed to solve one of crypto’s earliest problems: volatility. By pegging their value to fiat currencies such as the U.S. dollar, stablecoins gave traders a reliable unit of account that could move across blockchains without the price swings associated with assets like bitcoin. For years, they functioned primarily as liquidity tools inside crypto markets. But that role is rapidly changing.
Stablecoins are evolving from niche trading instruments into a foundational layer of global financial infrastructure. They now serve as settlement assets in decentralized finance (DeFi), payment rails for cross-border transfers and the preferred settlement currency for tokenized financial markets.
Institutions that once approached crypto cautiously are beginning to acknowledge the technology’s potential. The International Monetary Fund (IMF) has noted that stablecoins could improve the efficiency of cross-border payments by reducing the number of intermediaries involved in global transactions. Meanwhile, policymakers in the United States are moving to integrate stablecoins into the regulated financial system.
Because most of these tokens are pegged to the U.S. dollar, they may also be doing something far more consequential: quietly extending the reach of the dollar across the blockchain-based global economy.
How a Stablecoin Is Issued and why they matter?
A user provides fiat currency, typically U.S. dollars, to a licensed issuer. In return, the issuer mints an equivalent amount of stablecoins on a blockchain, maintaining a 1:1 peg. The fiat received is placed into reserve accounts, usually held in cash or short-term U.S. Treasuries, which back the value of the tokens in circulation.
When a user wants to exit, the process works in reverse: the stablecoins are redeemed, and the user receives fiat from the reserves. This issuance-redemption mechanism is what anchors the stablecoin’s price to its reference asset.
Stablecoins enable near-instant, 24/7 settlement, independent of banking hours. They allow for programmable transactions, where payments can be automated and embedded into digital systems. And they provide access to dollar-denominated value, often without requiring a traditional bank account.
The World Economic Forum established that stablecoins transaction volumes have reached tens of trillions of dollars annually, underscoring their growing role as a core component of digital financial activity.
For policymakers, this presents both an opportunity and a challenge. The U.S. Treasury has noted that digital payment innovations, including stablecoins, can enhance efficiency, reduce costs and promote financial inclusion, provided that appropriate safeguards are in place.
Use cases and applications
· Cross-border payments: Stablecoins enable near-instant international transfers at a fraction of the cost of traditional correspondent banking systems.
· Remittances: In many emerging markets, stablecoins offer faster and cheaper alternatives to traditional remittance providers, which often charge significant fees.
· Decentralized finance (DeFi): Stablecoins serve as collateral, liquidity pools and settlement assets across lending protocols, decentralized exchanges and derivatives markets.
· Tokenized real-world assets: As tokenization expands to include bonds, real estate and commodities, stablecoins increasingly function as the settlement currency for digital financial markets.
· Corporate treasury and global settlement: Fintech companies and multinational firms are experimenting with stablecoins to facilitate cross-border treasury operations and instant settlement of international transactions.
In short, stablecoins are gradually becoming the base layer of digital financial activity.
The Regulatory Turning Point: The GENIUS Act
The transition of stablecoins from niche crypto instruments to recognized financial infrastructure accelerated significantly in 2025 with the passage of the GENIUS Act (the Guiding and Establishing National Innovation for U.S. Stablecoins Act in the United States).
The legislation created the first comprehensive federal framework governing the issuance of payment stablecoins. Under the law, regulated entities, including banks and approved non-bank financial institutions, are allowed to issue stablecoins backed by high-quality liquid assets and subject to strict requirements including reserve transparency, regular audits, anti-money laundering and counter-terrorism financing (AML/CTF) under the Bank Secrecy Act.
One of the most important aspects of the GENIUS Act was regulatory clarity. For years, uncertainty around whether stablecoins should be treated as securities, commodities or banking products created hesitation among institutional players. The law addressed this ambiguity by establishing stablecoins as a distinct category of digital payment instruments.
Stablecoins and monetary power
Dollar-denominated stablecoins dominate the market by a wide margin compared with those linked to other currencies. That dominance has an important implication because stablecoins may extend the reach of the U.S. dollar beyond the traditional banking system.
Other jurisdictions are responding with their own regulatory strategies. For example, the European Union, through its Markets in Crypto-Assets (MiCA) framework, has introduced strict requirements for stablecoin issuers operating within the EU, including reserve requirements and limits designed to protect monetary sovereignty — but is also exploring the creation of a Central Bank Digital Currency (CBDC)
In Asia, financial hubs such as Hong Kong and Singapore are developing licensing regimes aimed at supervising stablecoin issuance and integrating the technology into regulated financial markets. China, meanwhile, has taken a different path by prioritizing the development of a central bank digital currency and exploring digital yuan settlement systems that could expand its monetary influence internationally.
The future of stablecoins will depend on trust in their reserves, in their governance and in the systems that oversee them. And ultimately, their long-term value will not be defined by how fast they scale, but by how safely and sustainably they become part of the global financial system.
– Claudia Marcela Hernández, digital assets specialist
Ask an Expert
Q. How important is stablecoin regulation to tokenized capital markets?
Stablecoin regulation is important because tokenized capital markets need a credible on-chain settlement asset. But regulation alone is not enough. For stablecoins to support institutional tokenized markets, there must also be legal certainty around settlement finality, redemption at par, issuer credit risk and how stablecoin-based settlement fits within payment system and securities laws.
In that sense, stablecoin regulation is a necessary foundation for tokenized capital markets, but not the whole framework. What institutions ultimately need is confidence that the settlement asset is reliable, that obligations are legally discharged when transactions settle on-chain and that the broader market structure can operate with clear, coordinated oversight.
Q. Are some jurisdictions starting to see U.S. stablecoin policy as a risk?
Yes, there is growing recognition that stablecoins carry geopolitical and monetary implications. Because the vast majority of fiat-backed stablecoins are denominated in U.S. dollars, their adoption could extend the reach of the dollar into blockchain-based financial systems. As U.S. policy frameworks formalize regulated dollar-backed stablecoins, this dynamic becomes more entrenched, positioning the U.S. to shape both the currency and standards of digital financial infrastructure.
In Canada, for example, proximity to the U.S., deep financial integration and broader geopolitical uncertainty have sharpened this focus. The concern is less about direct competition and more about dependency. Without a domestic framework, Canadian users and institutions could default to foreign-issued, USD-based stablecoins.
Canada’s approach has been to create a framework that enables innovation and competition while ensuring safety, consumer protection, and interoperability with global regimes. The objective is to allow both domestic and foreign stablecoins to operate under Canadian oversight, while preserving monetary relevance and ensuring Canadians have trusted, regulated options in a digital financial system.
Q. How can advisors assess whether a stablecoin is credible?
As stablecoins integrate into regulated systems, credibility comes down to a few core factors. First, reserve quality and transparency: assets should be fully backed by high-quality liquid instruments with regular disclosure or audits. Second, redemption: holders must have a clear, enforceable right to redeem at par. Third, regulatory oversight: credible issuers operate within defined legal and compliance frameworks. Governance also matters, including issuer structure, jurisdiction and custody of reserves. Ultimately, the key question is not just whether a stablecoin trades at $1, but whether its structure ensures it can consistently meet redemptions and retain user confidence during periods of stress.
– Morva Rohani, executive director, Canadian Web3 Council
Keep Reading
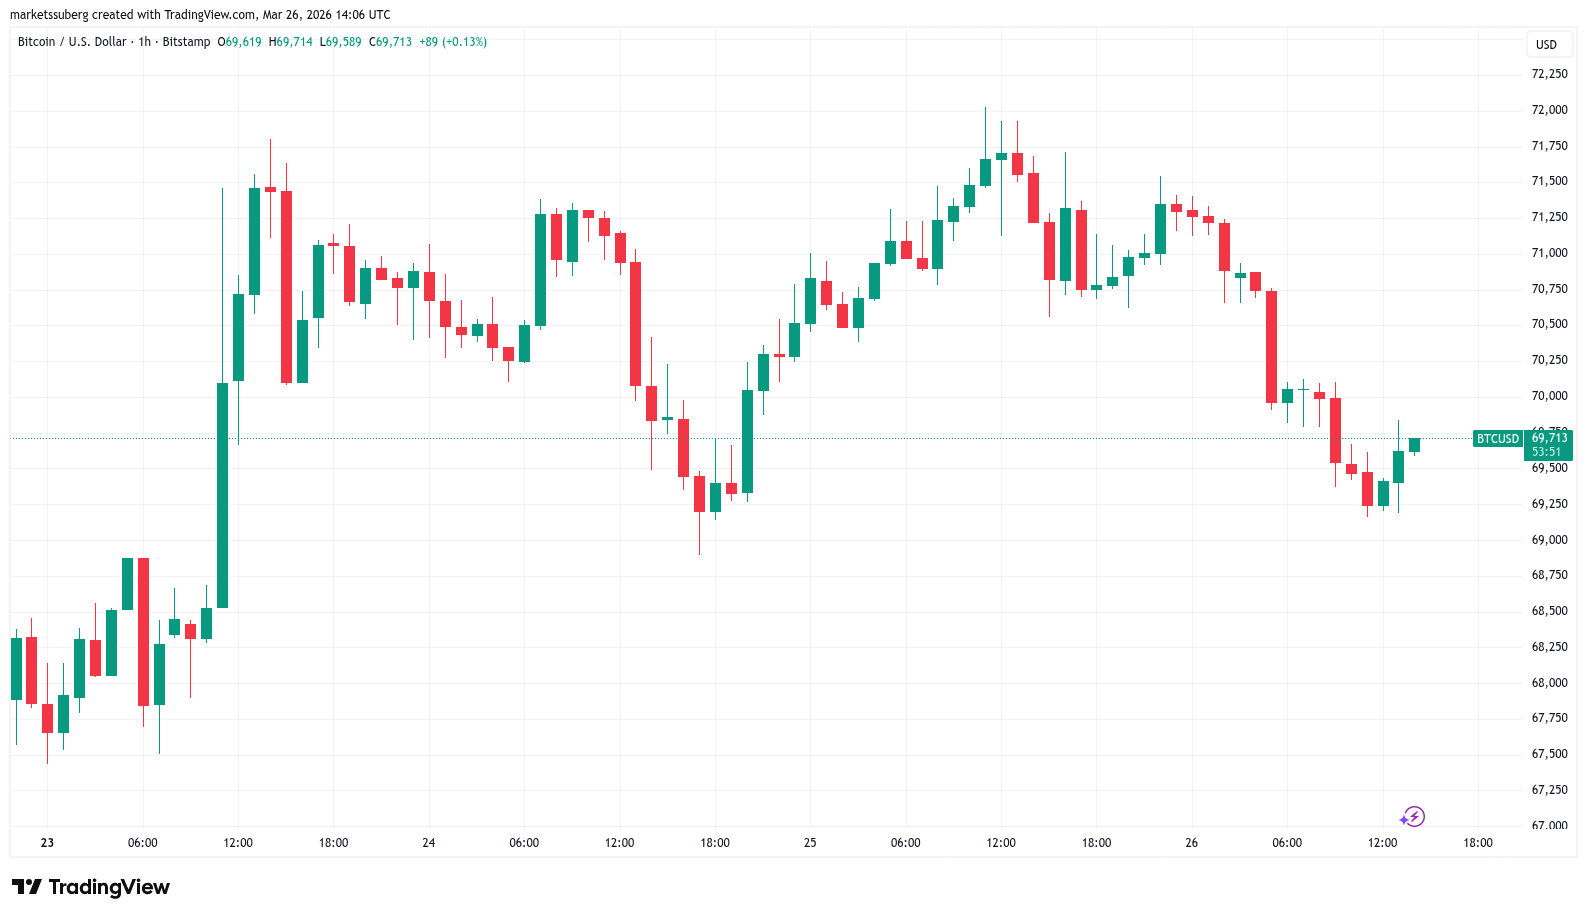
Bitcoin lost its grip on $70,000 amid inflation and recession talk as analysis suggested that BTC price action lacked “outright stress.”
Bitcoin (BTC) daily losses approached 3% at Thursday’s Wall Street open as markets stayed on edge over fresh Iran tensions.
Key points:
-
Bitcoin slips from $70,000 as markets continue to observe Iran developments.
-
Inflation and recession worries grow louder with no clear end to the conflict in sight.
-
Bitcoin analysis avoids an outright bearish appraisal of BTC price action.
Bitcoin wobbles as US inflation fears increase
Data from TradingView showed BTC/USD nearing $69,000 for the first time since Monday.

Volatility picked up as the US session began, with traders reacting to the latest developments in the US-Iran war.
A reported lack of mutual understanding over a peace proposal followed pressure from US President Donald Trump.
In a post on Truth Social, Trump called Iranian negotiators “very different and ‘strange.’”
“They better get serious soon, before it is too late, because once that happens, there is NO TURNING BACK, and it won’t be pretty!” he wrote.

US stocks turned red at the open, while attention also focused on the longer-term impact of the conflict on inflation.
As reported by trading resource The Kobeissi Letter and others, the Organization for Economic Co-operation and Development (OECD) put US inflation at 4.2% in 2026 — the highest among G7 countries.
“Potential rate HIKES in the US and EU are now back on the table,” it responded on X, referring to central banks raising interest rates — a key headwind for crypto.

Earlier, Cointelegraph reported on increasing expectations that the US would enter a recession within the next 12 months.
Analysis: BTC price action “not obviously bearish”
With Bitcoin still wedged in a narrow range, trading company QCP Capital stressed its “resilience” within the overall macro landscape.
Related: Bitcoin ‘compression’ outcome may send BTC to $80K: Analyst
“BTC is hovering around $70k, and the price action still feels more like quiet consolidation than outright stress,” it summarized in its latest “Market Color” analysis on the day.
“The broader macro backdrop remains fragile, with risk sentiment weighed by renewed Middle East headlines and oil still carrying a meaningful geopolitical premium, even after pulling back from the week’s highs.”

QCP described Bitcoin’s price activity as “not obviously bearish.”
“For now, BTC is trading like an asset being accumulated on dips but not yet chased. The range is holding, the surface is defensive but orderly, and macro remains firmly in the driver’s seat,” it added.
As Cointelegraph continues to report, many traders remain highly risk-averse to BTC, expecting new macro lows to result from an eventual range breakdown.
This article does not contain investment advice or recommendations. Every investment and trading move involves risk, and readers should conduct their own research when making a decision. While we strive to provide accurate and timely information, Cointelegraph does not guarantee the accuracy, completeness, or reliability of any information in this article. This article may contain forward-looking statements that are subject to risks and uncertainties. Cointelegraph will not be liable for any loss or damage arising from your reliance on this information.

Key Takeaways
- Adobe (ADBE) lost its Outperform rating from William Blair, downgraded to Market Perform this Thursday
- Analyst Arjun Bhatia pointed to “intense competition” pressuring Adobe’s flagship Creative Cloud offerings
- Competitors like Canva (achieving $4B ARR with +30% growth) and Figma (hitting $1.2B ARR with +40% expansion) are encroaching on Adobe’s $19B Digital Media business
- Artificial intelligence has rapidly “democratized” creative capabilities, putting Adobe’s professional user segment at risk
- While not labeling Adobe an “AI loser,” William Blair expects the stock to remain range-bound near term
On Thursday, William Blair stripped Adobe of its Outperform designation, lowering the rating to Market Perform. Analyst Arjun Bhatia’s rationale revolves around a singular anxiety: the protective moat surrounding Adobe’s Creative Cloud franchise appears to be eroding.
Bhatia recognized that Adobe’s valuation appears attractive at merely nine times free cash flow. Yet an inexpensive price tag doesn’t guarantee security. His apprehension isn’t rooted in valuation metrics — it’s about whether Adobe can defend its territory.
The analyst’s report stated it directly: “intense competition” represents the central challenge. And the threats are emerging from every angle.
Artificial intelligence platforms have advanced rapidly. In Bhatia’s assessment, they have “overnight, democratized the highly technical skills creative professionals had built.” This represents a direct assault on Adobe’s primary customer segment — the professionals whose livelihoods depend on mastering its complex software suite.
Canva has reached $4 billion in annual recurring revenue, expanding beyond 30% year-over-year. Figma — Adobe’s failed acquisition target — currently generates $1.2 billion in ARR while posting 40% growth. Adobe’s Digital Media division operates at a $19 billion annual run rate, yet these rivals are narrowing the gap considerably.
Canva has systematically captured market share at the entry level. Figma has dominated the UI/UX design category. Both companies are advancing from the periphery, and those boundaries are dissolving.
New AI-First Competitors Intensify Challenges
The competitive pressure extends further. Midjourney, Runway, Synthesia, and StabilityAI represent a generation of AI-first entrants transforming the creative software landscape. These aren’t traditional software vendors adapting to AI — they were architected around artificial intelligence from inception.
Beyond these startups, Google, OpenAI, and Apple are each advancing into creative tooling through distinct strategies. The competitive environment Adobe confronts today bears little resemblance to what existed just 24 months ago.
Bhatia deliberately avoided hyperbole. “We are not calling Adobe an ‘AI loser,’” his report stated. However, too many uncertainties remain to maintain an Outperform stance at present.
Profitability Metrics Draw Scrutiny
Adobe maintains operating margins in the mid-40 percent range — an exceptional figure that has historically strengthened the investment thesis. William Blair identified this as potentially problematic. Such robust margins may invite additional competition rather than deter it.
The firm emphasized that margin trajectories and Adobe’s success in monetizing emerging AI-driven opportunities deserve intensive monitoring ahead.
Bhatia’s conclusion noted that outstanding questions surrounding pricing authority, competitive differentiation, and sustainable economics “are unlikely to be resolved in the near term,” suggesting the stock will trade sideways until greater certainty emerges.
Adobe’s most recent quarterly results demonstrated ongoing expansion within its Digital Media division, though forward guidance for the current period fell short of certain analyst projections — a disappointment investors hadn’t completely digested before this downgrade arrived.

The Reserve Bank of Australia has put a hard number on tokenization: $16.7 billion in annual economic gains, with upside beyond that if new markets emerge.
RBA Assistant Governor Brad Jones cited those findings Wednesday, drawn from Project Acacia, a structured pilot that tested tokenized assets across Australia’s wholesale financial markets, not a whitepaper projection or a consultancy estimate.
This is a central bank quantifying economic value from a live experiment. That distinction matters.
Jones stated plainly that the question is no longer whether tokenization has a future, but how. That framing signals a policy posture shift, from exploratory to infrastructure-building — with the RBA now moving toward a formal digital financial market infrastructure sandbox.
- Pilot Scope: Project Acacia tested 20 tokenization use cases across asset classes including government bonds, repos, bank term deposits, and trade payables, settled via stablecoins, deposit tokens, and wholesale CBDC.
- Economic Quantification: RBA projects AUD 24 billion ($16.7 billion) in annual gains from RWA tokenization, with higher potential if new tokenized markets develop.
- Next Phase: RBA and the Digital Finance Cooperative Research Centre will launch a digital financial market infrastructure (DFMI) sandbox, moving from pilots toward commercialization-stage testing.
Discover: The best crypto presales gaining institutional momentum right now
The Mechanics: What Project Acacia Actually Tested
Project Acacia was not a simulation. It ran 20 discrete use cases across live asset classes, government bonds, repurchase agreements, bank term deposits, investment funds, trade payables, and mining royalties — settled through multiple instrument types: stablecoins, bank deposit tokens, wholesale CBDC, and exchange settlement accounts.
Participants included banks, custodians, fintechs, fund managers, stablecoin issuers, and infrastructure operators, testing settlement on both private and public distributed ledger technology platforms.
BREAKING:
Australia's Reserve Bank says asset tokenization could generate $16.7 billion in annual efficiency gains. pic.twitter.com/KODoCbP0OF— Crypto Rover (@cryptorover) March 25, 2026
The $16.7 billion figure is anchored specifically to efficiency gains from automating asset lifecycle management, reducing manual settlement errors, compressing counterparty risk windows, and unlocking liquidity in fixed income markets.
Fixed income was a focal point because of its scale and its dependence on foreign investor capital, U.S. investors are currently Australia’s largest source of fixed income funding, and tokenized infrastructure could lower capital costs while improving secondary market liquidity.
The pilot also assessed how wholesale CBDC could be issued onto external ledgers, a technical test of interoperability between central bank settlement layers and commercial tokenization platforms. That is the infrastructure question the sandbox is designed to answer at commercial scale. The full findings from Jones’ address map out a sequenced path from pilot learnings to durable market infrastructure.
Industry showed strong appetite for tokenized private money throughout the process. The RBA noted that U.S. and European banks are already issuing deposit tokens in response to stablecoin competition, a dynamic the RBA expects to replicate domestically, with deposit tokens scaling for larger markets and stablecoins addressing smaller greenfield use cases.
Discover: The best crypto to diversify your portfolio with
The Strategic Signal: Why a Central Bank’s Data Changes the Calculus
Central banks do not publish $16.7 billion economic projections as gestures.
The RBA’s quantification of tokenization upside is an institutional green light. The kind that moves compliance budgets, board-level risk appetites, and infrastructure investment timelines in ways that venture capital endorsements never do.
The precedent is already set. Singapore’s MAS BLOOM sandbox converted tokenized trade finance from concept to live deployment fast. Ripple joined with RLUSD and demonstrated exactly how quickly regulatory sandbox frameworks become production infrastructure. The RBA’s DFMI sandbox follows the same logic. Stage-gated testing designed to de-risk commercialization, not validate what is already known.
McKinsey forecasts tokenized asset value approaching $2 trillion by 2030. The RBA data gives that global trajectory a country-level economic mandate. ASIC head Joe Longo made the binary explicit in November. Seize the opportunity or get left behind. The RBA moving from research to sandbox infrastructure is the institutional answer to that ultimatum.
— BSCN (@BSCNews) March 24, 2026
 CRYPTO: AUSTRALIAN PENSION GIANT HOSTPLUS EYES BITCOIN ACCESS FOR 2.2 MILLION MEMBERS
$96 billion in assets. 2.2 million members. And now crypto is on the table.
Per Bloomberg, @Hostplus, Australia's third-largest pension fund by member count, is weighing a plan to offer… pic.twitter.com/EiS8annBse
The structural risk is timing. Tokenized fixed income is advancing rapidly in the US. Australia’s dependence on foreign investors means isolated domestic development creates fragmentation risk, a scenario where Australian tokenized assets cannot interface with the global settlement layer already forming elsewhere. The sandbox’s cross-border payment research component addresses that directly but the window for seamless integration narrows as other jurisdictions lock in standards.
The rails are being built. Central banks from Canberra to Singapore to Washington are laying them simultaneously.
The only question that matters for active market participants is which projects are already positioned on those rails before institutional volume arrives.
Discover: The best pre-launch token sales
The post Australia Central Bank Backs Tokenization After $16.7B Pilot Finding appeared first on Cryptonews.


Demand for free Bitcoin cloud mining rises in 2026 as users seek hardware-free ways to earn crypto.
Summary
- Demand for free Bitcoin cloud mining grows in 2026 as users seek passive crypto income without hardware costs.
- Cloud mining platforms simplify crypto earnings with contracts, bonuses, and no need for ASICs or high electricity use.
- AngelBTC offers a $100 free mining bonus, enabling users to start contract-based Bitcoin mining with daily rewards.
The demand for free Bitcoin cloud mining without investment in 2026 continues to rise as more users search for accessible ways to earn cryptocurrency without purchasing expensive mining hardware.
Traditional Bitcoin mining requires ASIC machines, cooling systems, and high electricity costs. Today, cloud mining platforms simplify this process by offering contract-based mining services, allowing users to earn passive crypto income through remote mining infrastructure.
Many platforms now provide free entry incentives, such as welcome bonuses or trial mining contracts, making it easier for beginners to get started with bitcoin mining, crypto mining, and passive income strategies.
Below are five verified cloud mining platforms widely discussed in 2026.
1. AngelBTC – Contract-based cloud mining with $100 free bonus
AngelBTC is a cloud mining platform operated by BTC North Corp in Canada, focusing on renewable energy-powered mining infrastructure and structured mining contracts.
Visit AngelBTC official website
Unlike many platforms that only offer limited demo mining, AngelBTC provides a $100 free mining bonus, allowing users to activate real contracts and start generating daily rewards.
The platform connects users to mining farms across the United States, Canada, Norway, and Iceland, utilizing hydropower, wind, solar, and geothermal energy to maintain stable mining performance.
Key Features
- $100 free cloud mining bonus (no upfront investment)
- Real contract-based mining system (not simulation)
- Daily mining rewards with transparent tracking
- Renewable energy mining infrastructure
- Automated mining management for beginners
AngelBTC mining contracts overview
| Contract Name | Amount | Duration | Daily Rate | Daily Profit | Total Profit |
| Solar 5TH | $100 | 1 Day | 1.00% | $1 | $1 |
| Solar 5TH | $200 | 2 Days | 2.00% | $4 | $8 |
| Wind 10TH | $600 | 5 Days | 2.00% | $12 | $60 |
| Hydropower 15TH | $1100 | 5 Days | 2.20% | $24.2 | $121 |
| Hydropower 25TH | $2350 | 5 Days | 2.50% | $58.75 | $293.75 |
| Wind 40TH | $3950 | 4 Days | 2.70% | $106.65 | $426.6 |
| Hydropower 70TH | $9500 | 3 Days | 3.00% | $285 | $855 |
| Geothermal 120TH | $14500 | 2 Days | 3.30% | $478.5 | $957 |
| Natural Gas 200TH | $23500 | 1 Day | 4.00% | $940 | $940 |
| Hydropower 500TH | $49500 | 1 Day | 5.00% | $2475 | $2475 |
View Full Contract & Claim $100 Free Hash Power!
Additional earning opportunity
Beyond mining contracts, AngelBTC also provides an optional referral-based earning model for users seeking additional passive income.
Users can earn a permanent 4.2% commission on every qualifying investment made by referred users, without complex conditions.
This creates a dual-income structure:
- Daily mining rewards from active contracts
- Long-term passive income through referral commissions
For users exploring crypto passive income strategies in 2026, this model offers additional scalability without requiring extra investment.
Become an AngelBTC ambassador
AngelBTC also supports a community-driven growth model where users can participate as ambassadors.
There is no investment required to join, and users can start sharing their referral link immediately after registration. This aligns with the broader trend of decentralized promotion and crypto affiliate programs, which are becoming increasingly popular in the blockchain industry.
2. StormGain – Mobile-friendly free mining feature
StormGain offers a mobile-based cloud mining feature that allows users to generate small amounts of Bitcoin without purchasing hardware.
Advantages
- Free mining feature within mobile app
- Beginner-friendly interface
- Integrated crypto trading tools
- Available on Android and iOS
3. NiceHash – Global Hash power marketplace
NiceHash operates as a hash power marketplace, allowing users to buy or sell computing power based on real-time profitability.
Advantages
- Flexible mining model
- Automatic algorithm switching
- Global mining network
- Real-time profit tracking
4. GoMining – Tokenized cloud mining model
GoMining provides a tokenized mining system, where users purchase digital miners backed by real mining hardware.
Advantages
- Tokenized mining ownership
- Passive income generation
- Blockchain-based infrastructure
- Flexible entry levels
5. Hashing24 – Industrial bitcoin mining contracts
Hashing24 focuses on industrial-scale Bitcoin mining contracts, offering stable long-term mining solutions.
Advantages
- Dedicated BTC mining contracts
- Industrial mining farms
- Transparent performance tracking
- Long-term contract options
Why free cloud mining is popular in 2026
The rise of free Bitcoin cloud mining without investment is driven by accessibility and reduced financial risk.
Key Benefits
- No hardware required
- No electricity or maintenance costs
- Beginner-friendly onboarding
- Passive income through mining contracts
- Real-time earnings monitoring
These features make cloud mining one of the most searched topics in crypto, especially for keywords like:
- free bitcoin cloud mining without investment 2026
- Bitcoin mining contracts daily income
- passive crypto income platforms
Conclusion
In 2026, cloud mining has evolved into a contract-driven and scalable ecosystem, offering users multiple ways to participate in cryptocurrency mining.
Platforms like AngelBTC combine:
- real mining infrastructure
- structured contracts
- free entry bonuses
- referral-based income models
At the same time, platforms such as StormGain, NiceHash, GoMining, and Hashing24 provide alternative approaches to mining participation.
For both beginners and experienced users, cloud mining remains one of the most practical methods to access bitcoin mining, crypto mining, and passive income opportunities without managing physical hardware.
Disclosure: This content is provided by a third party. Neither crypto.news nor the author of this article endorses any product mentioned on this page. Users should conduct their own research before taking any action related to the company.


- Sky is diversifying its revenue streams and yield strategies.
- Securitize and Maple have joined the Sky Ecosystem agent network.
- The SKY token could rally to $0.10
The Sky Ecosystem token is under sell-off pressure as negative sentiment keeps altcoins in the red.
But despite top coins wallowing in bearish territory, Sky is up 13% over the past month, and network fundamentals look bullish.
The latest boost comes from ecosystem platforms joining Sky’s agent network, including Securitize and Maple Finance.
SKY price could benefit as the project taps into diversified revenue streams and yield strategies.
Sky-backed Obex brings 8 new allocators to ecosystem
A lot of the buzz around Sky today stems from an announcement that Sky-backed platform Obex is spearheading the latest onboarding of capital allocators.
Sky Ecosystem has welcomed eight new allocators, marking the largest capital deployment from a decentralized protocol into a coordinated cohort of specialised agents.
These allocators have already borrowed up to $1 billion in USDS from the Sky Protocol, enabling deployment across innovative yield strategies.
The Sky Agent Network operates as the ecosystem’s core revenue engine.
Each agent functions as an independent capital allocator, borrowing USDS and directing it toward high-potential opportunities.
These platforms compete on risk-adjusted returns, with a portion of generated value accruing back to the Sky Protocol.
According to details, the new cohort that is helping broaden the network’s DeFi scope includes Maple Finance, Securitize, Centrifuge, River and TVL Capital.
The projects cut across on-chain lending, tokenization, AI infrastructure plays and structured credit, among others.
By integrating these diverse sources, Sky Protocol is adding potential avenues for untapped revenue pools.
Growth could influence SKY price performance, particularly if DeFi yield optimization takes root.
SKY price outlook
The Sky Ecosystem (SKY) token is trading around $0.071, down about 3% over the past 24 hours, after touching intraday highs of $0.077, according to CoinMarketCap data.
As of March 26, the token remains roughly 13% above its late-February lows, reflecting a modest recovery.
The recent uptick has coincided with rising USDS borrowing volumes, while increased interest around agent onboarding has also supported buying activity.
These trends suggest improving network fundamentals, with the reported $1 billion USDS deployment pointing to notable capital inflows that could enhance SKY’s utility in governance and staking.
Broader tailwinds, including growing adoption of real-world assets (RWAs) and supportive regulatory developments in the US and Europe, may further support sentiment.
However, risks remain. Underperformance in yield strategies or renewed macroeconomic volatility could weigh on prices.
From a technical perspective, SKY appears to be forming a bullish flag pattern on the daily chart.
A move above $0.075 could open the door toward the next major resistance near $0.15.
On the downside, the $0.060 level is seen as key support, while the token’s all-time low stands at $0.03, reached in February.
Code is not the weakest point in crypto thefts
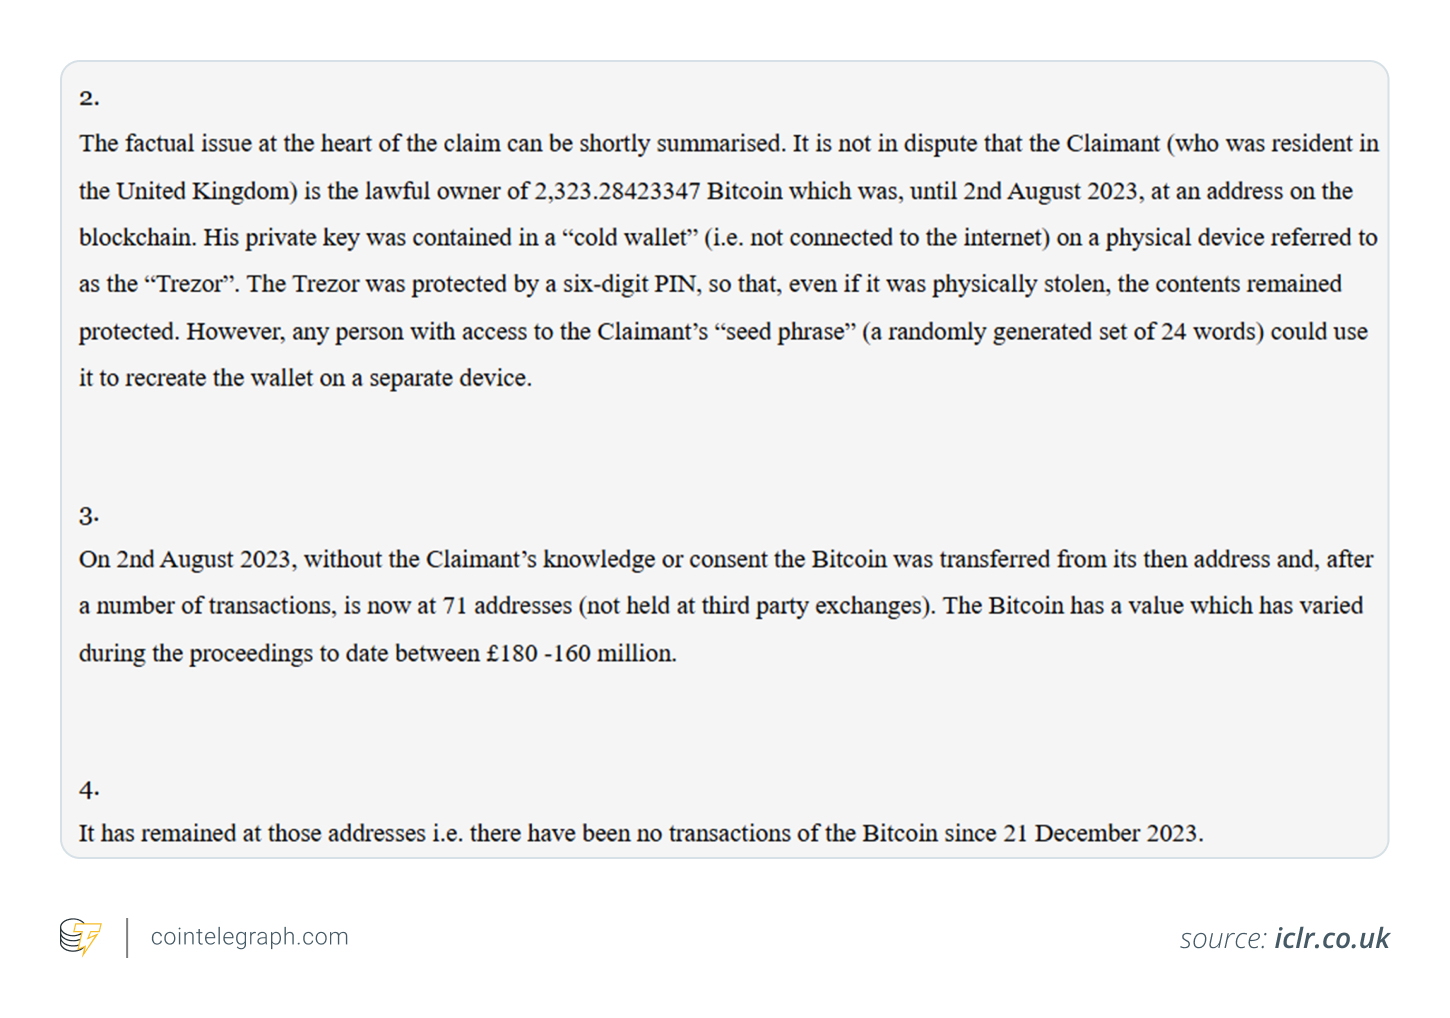
In crypto, security is usually regarded as a technical issue. You are asked to safeguard your private keys, rely on a hardware wallet and steer clear of phishing links. Yet a prominent case in the UK reveals that the real vulnerability in this case might have had nothing to do with code.
The UK High Court is currently reviewing a case involving the alleged theft of 2,323 Bitcoin (BTC), worth about $176 million. The theft did not stem from hacking or malware. Instead, it began with a seed phrase being exposed, which became the single point of failure in self-custody.
The dispute centers on Ping Fai Yuen, who claims that his estranged wife, Fun Yung Li, and her sister gained access to his Bitcoin by secretly recording his wallet’s recovery information.
The assets were held in a hardware wallet, designed to keep private keys completely offline and shielded from remote threats. Yet the theft still happened and it required no breach of encryption.
Court documents suggest the theft only required discovering the seed phrase.
Alleged timeline of the crypto theft
The allegations describe events that suggest surveillance rather than digital intrusion.
-
The individuals in question are accused of using a camera or recording device to capture the seed phrase and related codes.
-
The claimant later learned of the scheme after receiving a warning from his daughter.
-
He then set up audio recording equipment, which he says captured conversations about moving the funds.
-
The Bitcoin was subsequently transferred to 71 separate wallet addresses.
No additional movements have appeared on the blockchain since Dec. 21, 2023, indicating that the assets have remained inactive since the reported transfer.
Authorities are said to have confiscated devices and cold wallets as part of the inquiry, although the proceedings are still ongoing.
Did you know? In several past cases, hidden cameras, not hackers, have been the weakest link in crypto security. Physical surveillance has quietly become one of the most underestimated threats to self-custodied digital assets.
Why the seed phrase mattered in the UK crypto theft
To understand the case, you need to grasp a core principle of crypto: Whoever has access to the seed phrase has full control of the funds.
A hardware wallet shields private keys from online risks. But the seed phrase, typically 12 to 24 words, serves as a full backup of the entire wallet.
Finding the seed phrase allows anyone to:
-
Rebuild the wallet on any other device
-
Access all the associated funds
-
Move the assets without ever touching the original hardware
Put simply, once the seed phrase becomes known, the physical device loses all relevance.

The surveillance element: An uncommon form of compromise
What stands out in this matter is the reported method used to carry out the breach.
Rather than relying on phishing or malicious software, the allegations center on visual or audio capture, possibly through a hidden camera or covert recording.
This brings attention to a seldom-mentioned risk: side-channel exposure.
Seed phrases are frequently written down, spoken or typed during setup. If any of those moments are watched or recorded:
-
The phrase can be pieced together.
-
The wallet can be copied elsewhere.
-
Assets can be relocated without immediate traces.
In environments full of smart devices, cameras and shared spaces, this type of risk continues to rise.
The UK High Court’s early stance
The matter came before the UK High Court, where Justice Cotter examined the evidence presented.
Although this does not constitute a final decision in the case, the judge indicated that the claimant had demonstrated a very high probability of success.
Among the elements considered were:
The court also stressed the need for swift action, citing security concerns and Bitcoin’s price fluctuations.
Did you know? Some wallets now offer decoy wallets that use different PINs. This feature allows users to display a smaller balance under duress, adding a layer of protection against both physical coercion and surveillance-based attacks.
Why the assets were spread across 71 addresses
The claim states that the Bitcoin was distributed across 71 wallet addresses.
This step carries several implications:
-
It makes tracking and recovery more difficult.
-
It avoids drawing attention to a single large transfer.
-
It fragments the holdings, which can delay legal and investigative efforts.
Although the blockchain’s transparency allows movements to be traced, spreading the funds adds layers of complexity and time to any recovery process.
The dusting attack concern
The claimant also expressed concern about a possible dusting attack on the addresses involved.
Dusting refers to sending tiny amounts of crypto to wallets in order to:
-
Monitor subsequent activity
-
Link addresses to real identities
-
Identify valuable targets for future attacks
If wallet addresses become public, they can attract additional scrutiny, even if no further activity occurs.
Why this matter extends beyond a single conflict
On one hand, this case remains a private legal dispute. On the other, it serves as a case study in the broader risks of crypto custody.
It demonstrates that:
-
Hardware wallets limit digital threats, yet leave human factors untouched.
-
Threats from those close to the owner can outweigh those from outside attackers.
-
Exposure of the seed phrase can result in a complete loss of control.
Above all, this shows that crypto security involves far more than just devices; it relies heavily on environment, conduct, trust and relationships.
Security lessons from the case
This example reinforces several straightforward guidelines:
-
Keep the seed phrase completely hidden from cameras, phones and connected devices.
-
Avoid storing recovery information in places that others can access.
-
Separate personal identity from wallet control whenever possible.
-
Use multiple layers of protection for large holdings.
More sophisticated arrangements may include additional passphrases, split backups or multisignature setups. Each of these methods is designed to reduce reliance on a single vulnerable element.
Scottish Conservatives replaced by stuffed toy at Perthshire election hustings
Andersons Inc (ANDE) director Bowe sells $1.09 million in stock
AppLovin (APP) Stock Plunges 9% as Short Interest Spikes Amid Economic Uncertainty


-
 Crypto World6 days ago
NIO (NIO) Stock Plunges 6.5% as Shelf Registration Sparks Dilution Worries
-

 Fashion6 days ago
Weekend Open Thread: Adidas – Corporette.com
-
 NewsBeat1 day ago
Manchester United reach agreement with Casemiro over contract clause amid transfer speculation
-

 Politics6 days ago
Jenni Murray, Long-Serving Woman’s Hour Presenter, Dies Aged 75
-

 Crypto World5 days ago
Best Crypto to Buy Now: Strategy Just Spent $1.57 Billion on Bitcoin During Fear While Early Investors Quietly Enter Pepeto for 150x Potential
-

 Crypto World5 days ago
Bitcoin Price News: Bhutan Sells $72 Million in BTC Under Fiscal Pressure, but the Smart Money Entering Pepeto Sees What the Market Does Not
-

 Tech6 days ago
inKONBINI Lets You Spend Summer Days Behind the Register
-

 News Videos13 hours ago
Parliament publishes latest register of MPs’ financial interests
-

 Sports3 days ago
Remo Stars and Kano Pillars Strengthen Survival Hopes in NPFL
-

 Politics7 days ago
Gender equality discussions at UN face pushbacks and US resistance
-

 Business4 days ago
No Winner in March 21 Drawing as Prize Rolls to $133 Million for Next
-

 Sports3 days ago
Gary Kirsten Accuses Pakistan Cricket Board Of ‘Interference’, Mohsin Naqvi Responds
-

 Tech4 days ago
Give Your Phone a Huge (and Free) Upgrade by Switching to Another Keyboard
-

 Sports6 days ago
2026 Kentucky Derby horses, odds, futures, preview, date: Expert who nailed 12 Derby-Oaks Doubles enters picks
-

 Tech4 days ago
AI enters the chat: New Seattle dating app relies on tech to facilitate meaningful human connections
-

 Business7 days ago
DLocal: Entering 2026 At Escape Velocity
-

 Politics7 days ago
Scotland’s rejection of assisted dying is a victory for humanity
-
Business6 days ago
Columbia Sportswear enters $500 million credit agreement with JPMorgan Chase
-

 NewsBeat7 days ago
Missile lands next to presenter during live report
-

 Tech5 days ago
Today’s NYT Connections Hints, Answers for March 22 #1015
You must be logged in to post a comment Login