
Crypto World
Strategy stretch shares draw retail investors seeking Bitcoin yield


Strategy’s “Stretch” preferred shares are drawing strong interest from retail investors as the company keeps using the product to fund Bitcoin purchases.
Summary
- Retail investors hold majority of Strategy Stretch shares seeking lower volatility Bitcoin exposure with steady yields
- Strategy raised over 1 billion dollars through Stretch shares to fund recent Bitcoin purchases
- Stretch shares offer 11.5 percent dividend while redirecting part of Bitcoin returns to investors
New comments from Strategy executives show that individual investors now make up most of the holders of STRC, a dividend-paying security that the company markets as a lower-volatility way to gain Bitcoin-linked exposure.
Strategy CEO Phong Le said about 80% of the owners of the company’s “Stretch” perpetual preferred shares are retail investors. He said retail buyers prefer “low-volatility, high-yield digital credit” as they look for steadier exposure tied to Bitcoin.
The figures show that demand for Bitcoin-linked products remains active even during a weaker period for the asset and for Strategy’s stock. Michael Saylor and other company executives have increased promotion of STRC as a product for investors who want Bitcoin exposure without taking on the same level of price swings seen in common shares or the token itself.
Strategy relied heavily on STRC sales in March to raise funds for more Bitcoin purchases. Bloomberg reported that about $1.2 billion from at-the-market sales of the preferred shares helped finance one of the company’s recent Bitcoin buys, though the firm later returned to common stock sales for its latest purchase.
Speaking at the 2026 Digital Asset Summit in New York, Saylor said selling a new credit instrument to retail investors is usually difficult. He later told CNBC that the goal is to create “an onramp for people who believe Bitcoin is going to be around for the long term, but they can’t handle the volatility in the near term.”
In addition, Saylor said Stretch removes the first 10% to 11% of Bitcoin’s yearly return and directs it to credit investors. He said the structure is “way overcollateralized” and argued that equity holders could still benefit if Bitcoin rises at a faster pace over time.
The security pays a variable dividend that adjusts monthly in an effort to keep the share price near $100. The dividend stood at 11.5% in March, while the product is structured as a perpetual preferred share with no maturity date.
Strategy expands its funding plans
Strategy has signaled that preferred stock will remain a core part of its Bitcoin funding model. In filings and company materials, the firm has described a broader capital strategy built around different securities that offer varying types of Bitcoin exposure to investors.
The company also disclosed plans to expand its fundraising capacity. According to the report cited in the source material, Strategy plans to raise up to $21 billion through stock sales and another $21 billion through Stretch-related at-the-market programs, showing that the company is preparing to keep using these instruments as it adds to its Bitcoin holdings.

Key Highlights
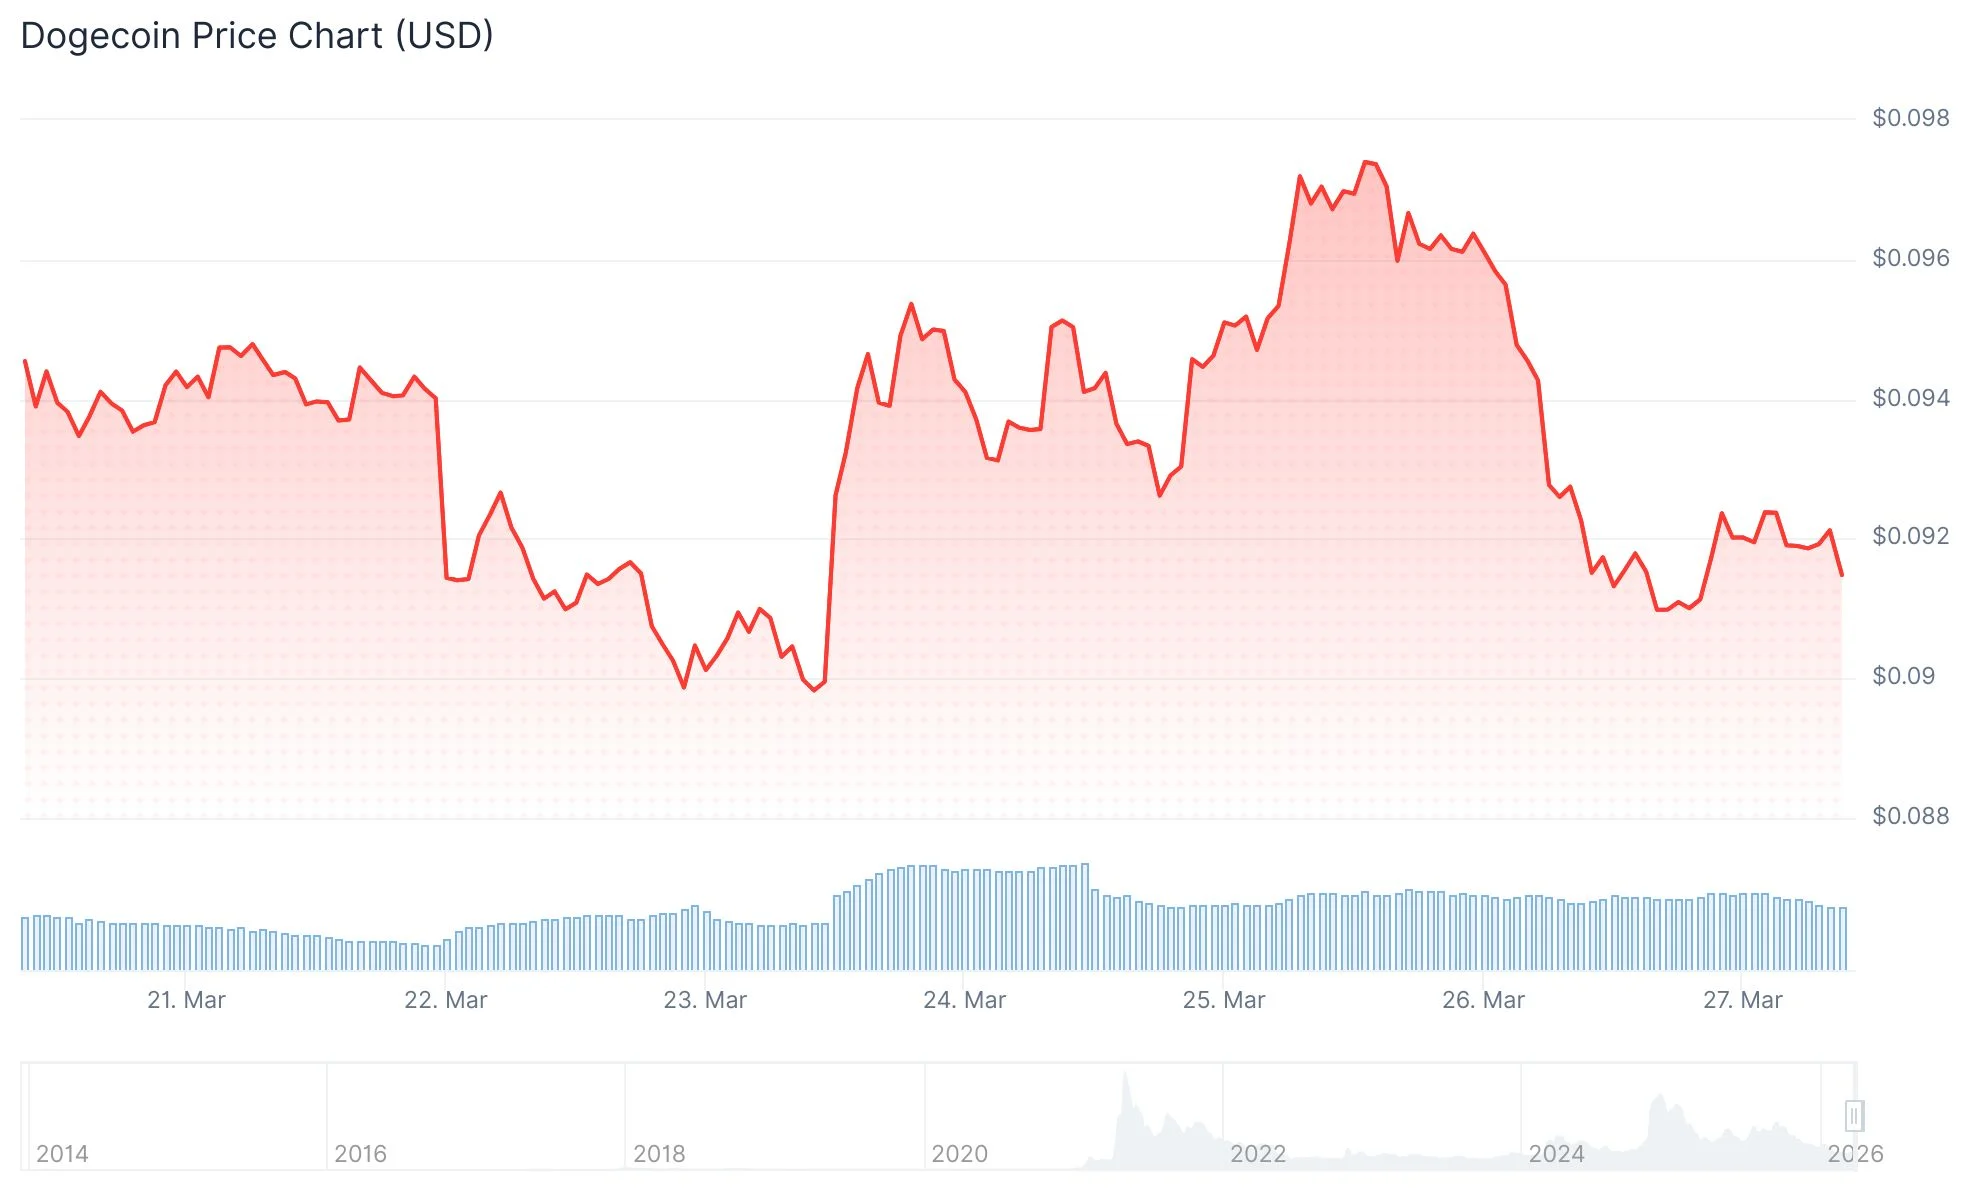
- DOGE price declined more than 5% over 24 hours, currently trading near $0.091
- Eight consecutive days of zero net flows recorded across Dogecoin ETF products
- Retail traders acquired approximately 4.5 million DOGE tokens on Kraken during recent pullback
- Technical analysis reveals death cross formation, typically interpreted as bearish momentum
- Dogecoin mining integration with Qubic platform confirmed for April 1, 2026 launch
Dogecoin has experienced a significant pullback exceeding 5% over the last day, with the meme coin currently changing hands around the $0.091 mark. This downturn mirrors broader cryptocurrency market weakness, as overall digital asset market valuation decreased 1.18% to settle at $2.4 trillion.

The cryptocurrency continues holding above the critical $0.092 support threshold, though mounting downward pressure threatens this level. Technical indicators paint a concerning picture—the Relative Strength Index currently registers around 41, while the MACD demonstrates early signs of bearish divergence. Market observers suggest bulls must push DOGE back above $0.095 to shift momentum.
Charts also display a death cross pattern, occurring when shorter-term moving averages dip beneath longer-term counterparts. Technical traders typically interpret this formation as indicating potential downside ahead.
Institutional Money Remains Sidelined
According to tracking data from SoSoValue, Dogecoin exchange-traded fund products have registered absolutely no net capital movement for eight straight trading days. Neither inflows nor outflows have been recorded during this period.
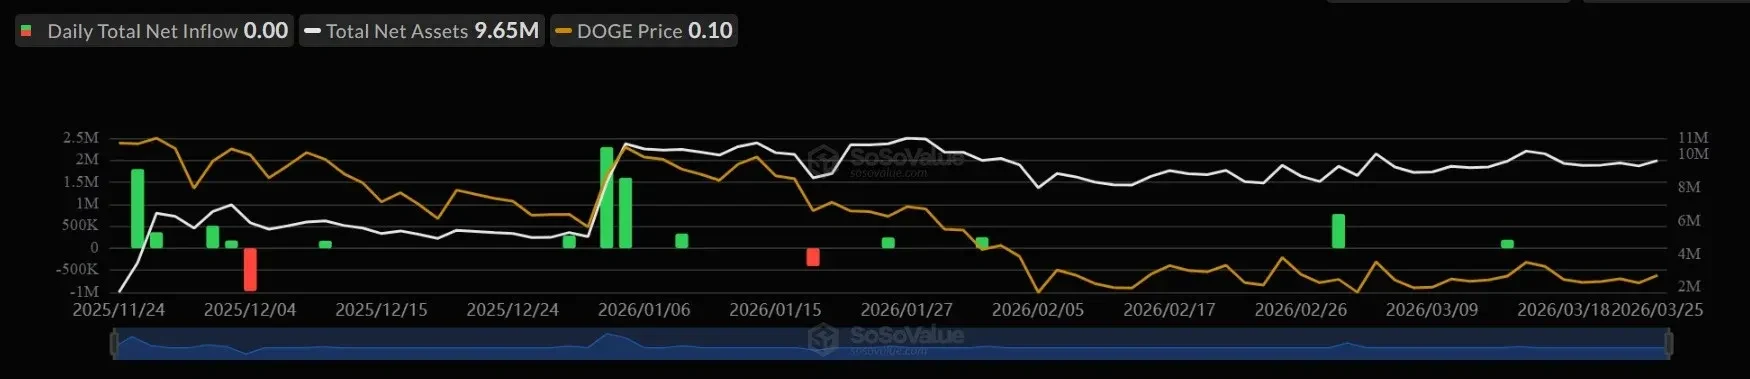
This stagnation suggests institutional participants remain uncommitted despite recent volatility. Market commentators interpret this freeze differently—some view the standstill as hesitation, while others consider the absence of withdrawals as evidence that current holders anticipate price appreciation.
The contrast between institutional and retail market behavior is striking. While ETF channels showed zero activity, individual traders on Kraken purchased nearly 4.5 million DOGE tokens within a 12-hour period as prices retreated.
Large Holders Accumulating on Weakness
Blockchain analytics from CryptoQuant reveal taker buy dominance persisting across leading trading platforms throughout the previous 90-day period. This metric indicates aggressive purchase orders have consistently exceeded selling pressure in spot trading venues.
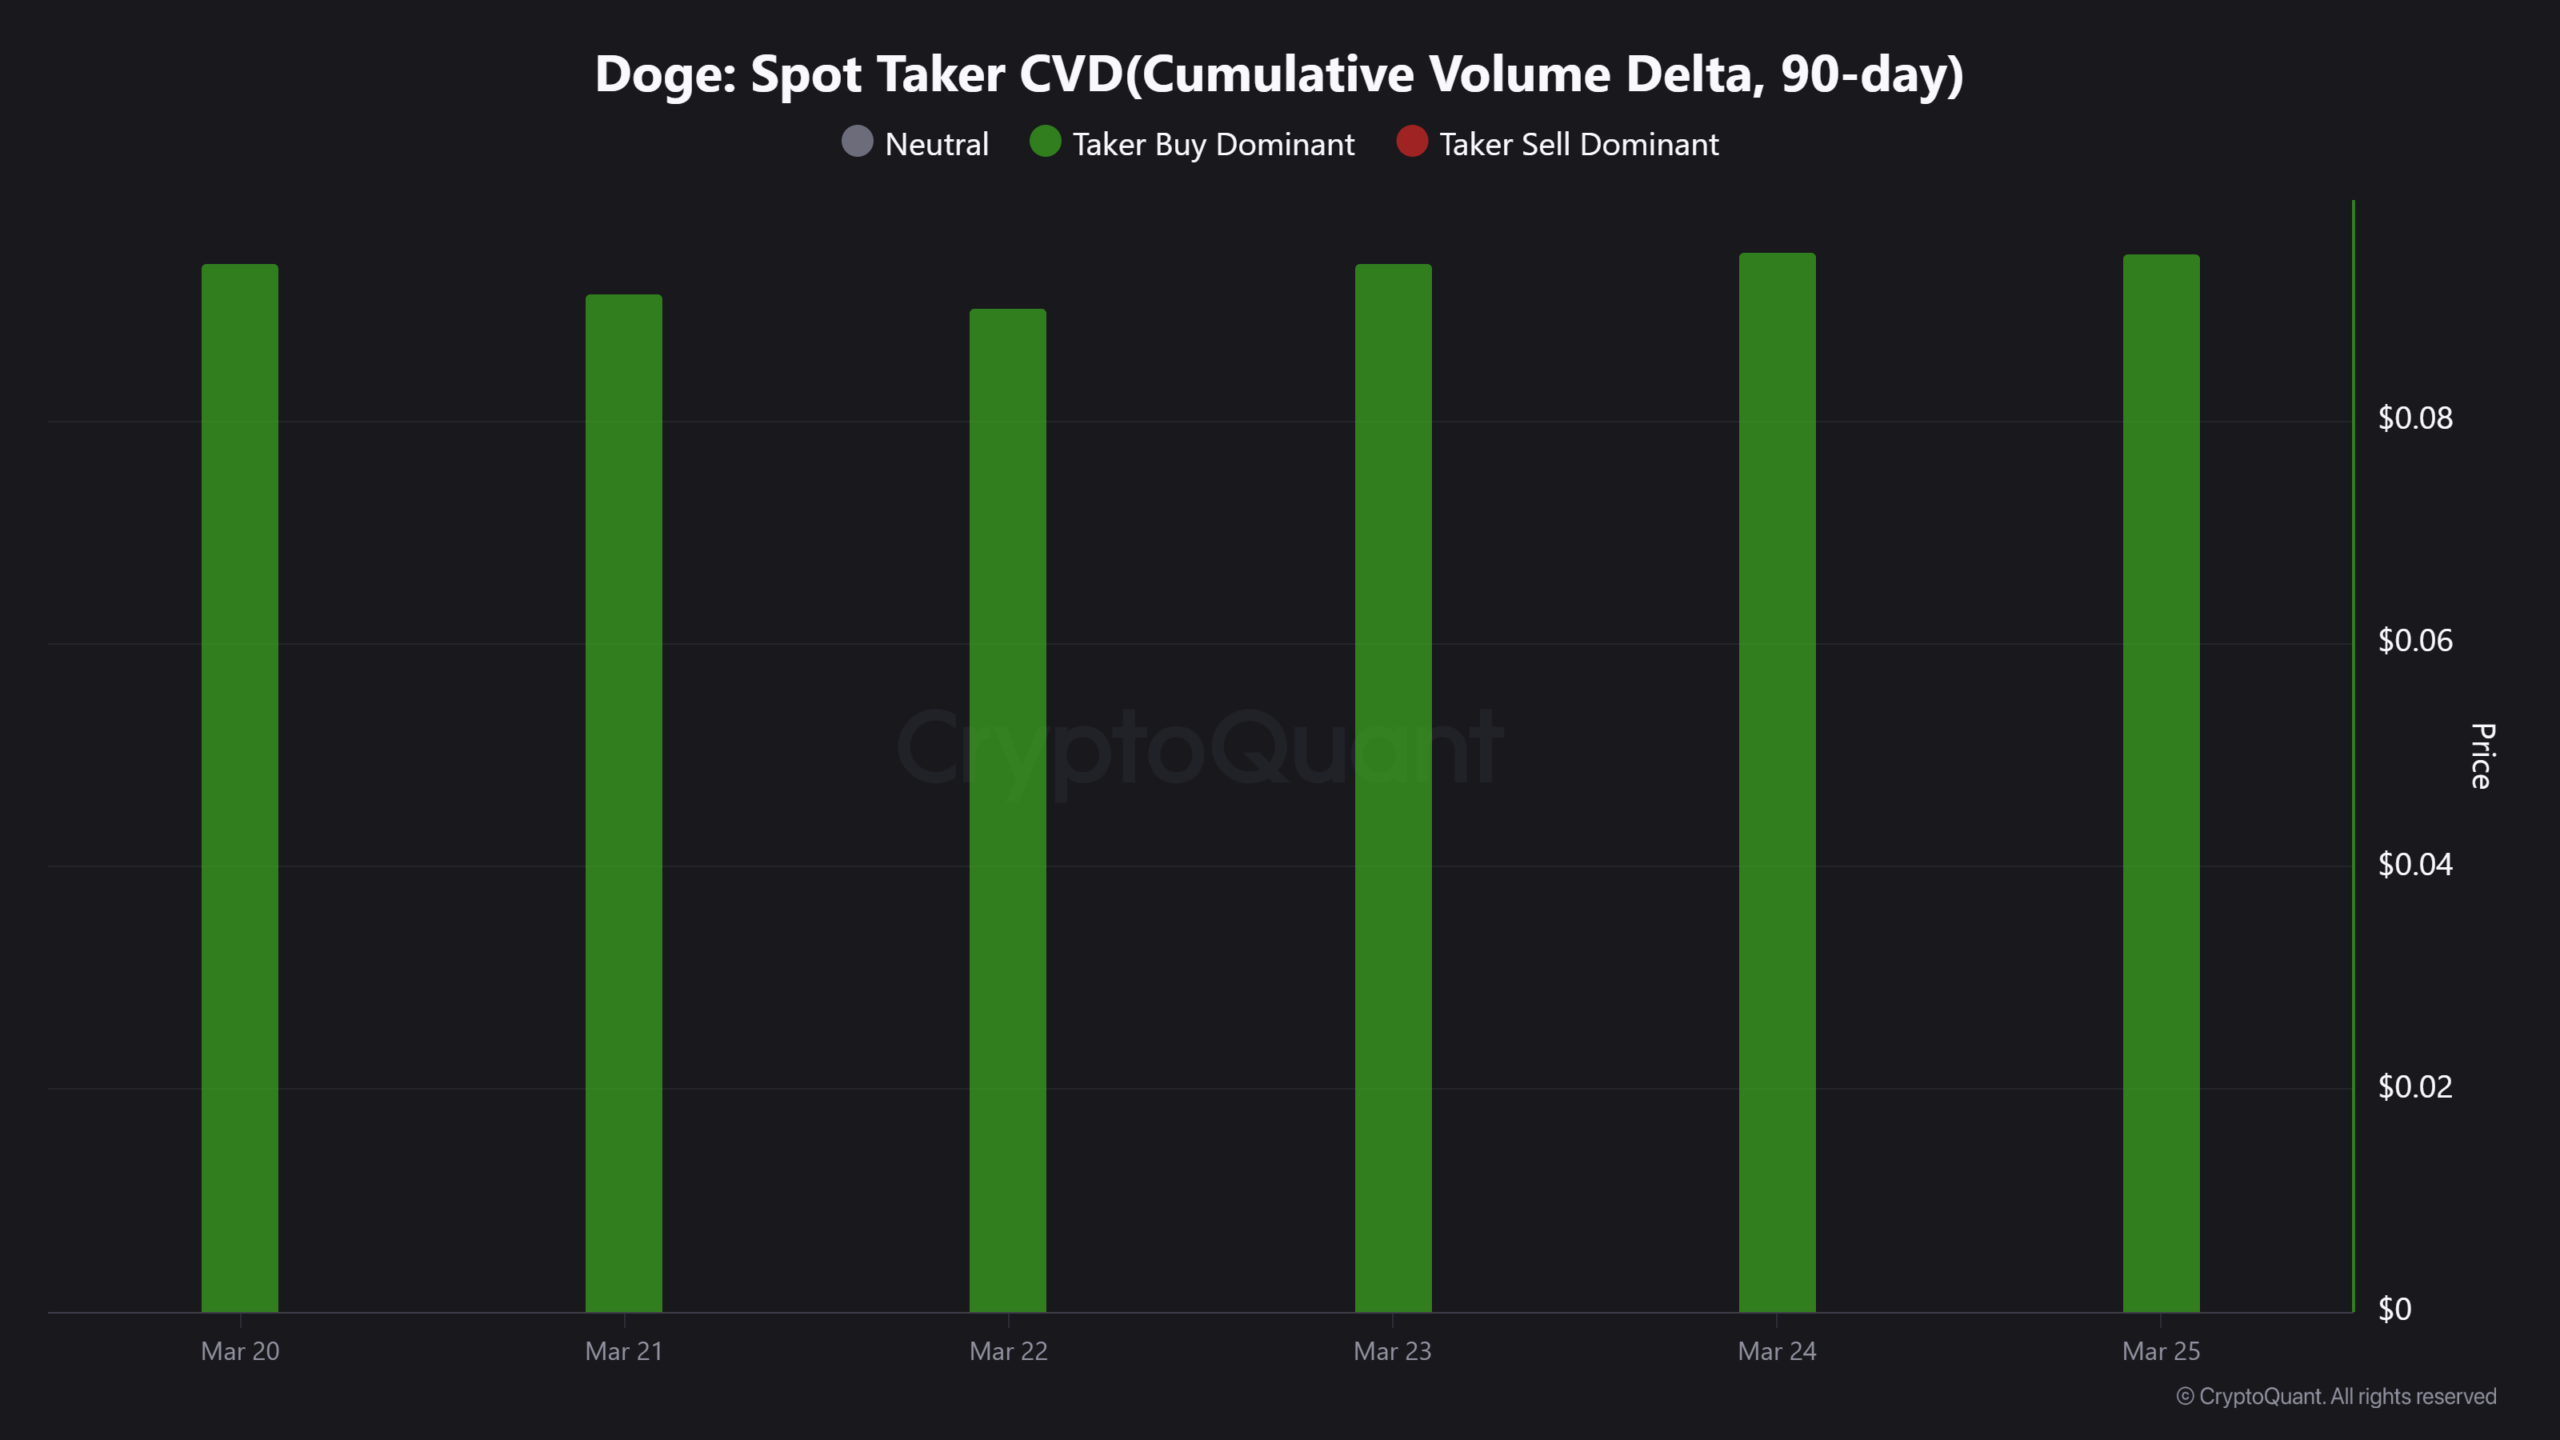
This accumulation behavior has emerged repeatedly during recent downward moves. Market participants seem to view price weakness as strategic entry points rather than signals to exit positions. Technical strategists note that such sustained accumulation frequently precedes significant upward price movements, although no breakout has developed thus far.
Large wallet activity suggests anticipation of movement beyond the $0.10 threshold. DOGE faced resistance at this psychological level in recent trading sessions and has failed to reclaim it since.
The Qubic platform has officially announced its April 1 launch date for the Dogecoin mining initiative. According to company statements, every share generated through mining will undergo verification through Oracle Machines, which became operational on mainnet February 11. The Dogecoin mining feature represents the inaugural external proof-of-work application developed on this infrastructure.


ETH is under serious pressure. Ethereum price trades at just a nod above $2,000, down 3.70% in the past 24 hours, the sharpest single-day drop since March 18’s 6% wipeout, and the technical prediction is deteriorating fast. The $2,000 handle is no longer a distant scenario, as crypto falls.
Bears pushed ETH to an intraday low of $2,030 after the asset failed to hold above $2,150, triggering a cascade through $2,100 and $2,080 in quick succession. A bearish trend line has formed on the hourly chart with resistance capping at $2,135, while ETH now trades below its 100-hour Simple Moving Average.
ETH crashed from 2199 to 2032 (over 8% drop), now in an oversold rebound. MA50 is sloping down, medium-term trend remains bearish—treat bounces as opportunities to reduce exposure. — Asma Khatuhgfd (@khatuhgfd94622) March 27, 2026

Catalysts, including BlackRock’s staked ETHB ETF launch and the FOMC rate decision, haven’t provided the bid bulls were hoping for.
Discover: The best crypto to diversify your portfolio with
Ethereum Price Prediction: Can ETH Recover, or Is a Drop to $1,880 Next?
ETH is consolidating near the 23.6% Fibonacci retracement of the $2,200-$2,032 downward move, a technically weak holding position that typically precedes continuation lower rather than reversal.
The MACD histogram on the hourly chart is losing momentum in bearish territory, a confirmation that sellers remain in control of short-term price action. A huge head and shoulder will be confirmed if ETH can’t defend the $2,000 line.

Three scenarios define the next 48–72 hours:
- Bull case: ETH clears $2,135 resistance and the descending trend line with conviction, opening a path toward $2,200 and potentially $2,245–$2,320.
- Base case: ETH grinds between $2,050 support and $2,135 resistance, bleeding volume while macro headwinds persist.
- Bear case: A confirmed break below $2,020 opens $1,980, then $1,950, with the main structural support sitting at $1,880.
Year-to-date, ETH is stable with less than 1% movement . The Glamsterdam hard fork remains a potential demand catalyst on the 2026 roadmap, but near-term technicals offer little relief. Watch the $2,000 psychological level closely; it’s the line between consolidation and a deeper flush.
Discover: The best pre-launch token sales
Bitcoin Hyper Targets Early-Mover Upside as Ethereum Tests Key Levels
When a large-cap asset like ETH prints multi-month lows and conviction evaporates, capital doesn’t sit idle; it searches for asymmetric opportunities elsewhere.
Bitcoin Hyper ($HYPER) is building what it positions as the first-ever Bitcoin Layer 2 with Solana Virtual Machine (SVM) integration, targeting Bitcoin’s core limitations of slow transactions, high fees, and absent programmability in one architecture.
Two modes. One future.
Bitcoin Hyper.https://t.co/VNG0P4GuDo pic.twitter.com/uNneqkZg13
— Bitcoin Hyper (@BTC_Hyper2) March 27, 2026
The presale has raised north of $32 million at a current price of $0.0136, with huge staking rewards available for early participants. The SVM integration claim is notable: if the throughput benchmarks hold at launch, this could represent a genuinely differentiated position in the L2 landscape rather than another incremental scaling play.
Research Bitcoin Hyper and review the presale terms here.
This article is for informational purposes only and does not constitute financial advice. Crypto assets are highly volatile — always conduct your own research before investing.
The post Ethereum Price Prediction: ETH Faces Pressure, Risks Falling Below $2,000 appeared first on Cryptonews.
Crypto World
Solana (SOL) Struggles After $93 Rejection: Bearish Flag Signals Potential Drop to $40s

Key Takeaways
- SOL faced rejection at the $93 level, declining 5.7% over 24 hours to approximately $87
- The token trades beneath its 20-, 50-, 100-, and 200-day moving averages
- Technical indicators including RSI and MACD reflect diminishing price momentum
- A developing bearish flag formation on the daily timeframe suggests potential downside to the $40–$45 zone
- Despite price weakness, Solana handled 44% of worldwide cryptocurrency transactions
Solana (SOL) faces mounting pressure following an unsuccessful attempt to breach the $93 resistance threshold. The digital asset has retreated and now hovers around a critical support area that market participants are monitoring intently.
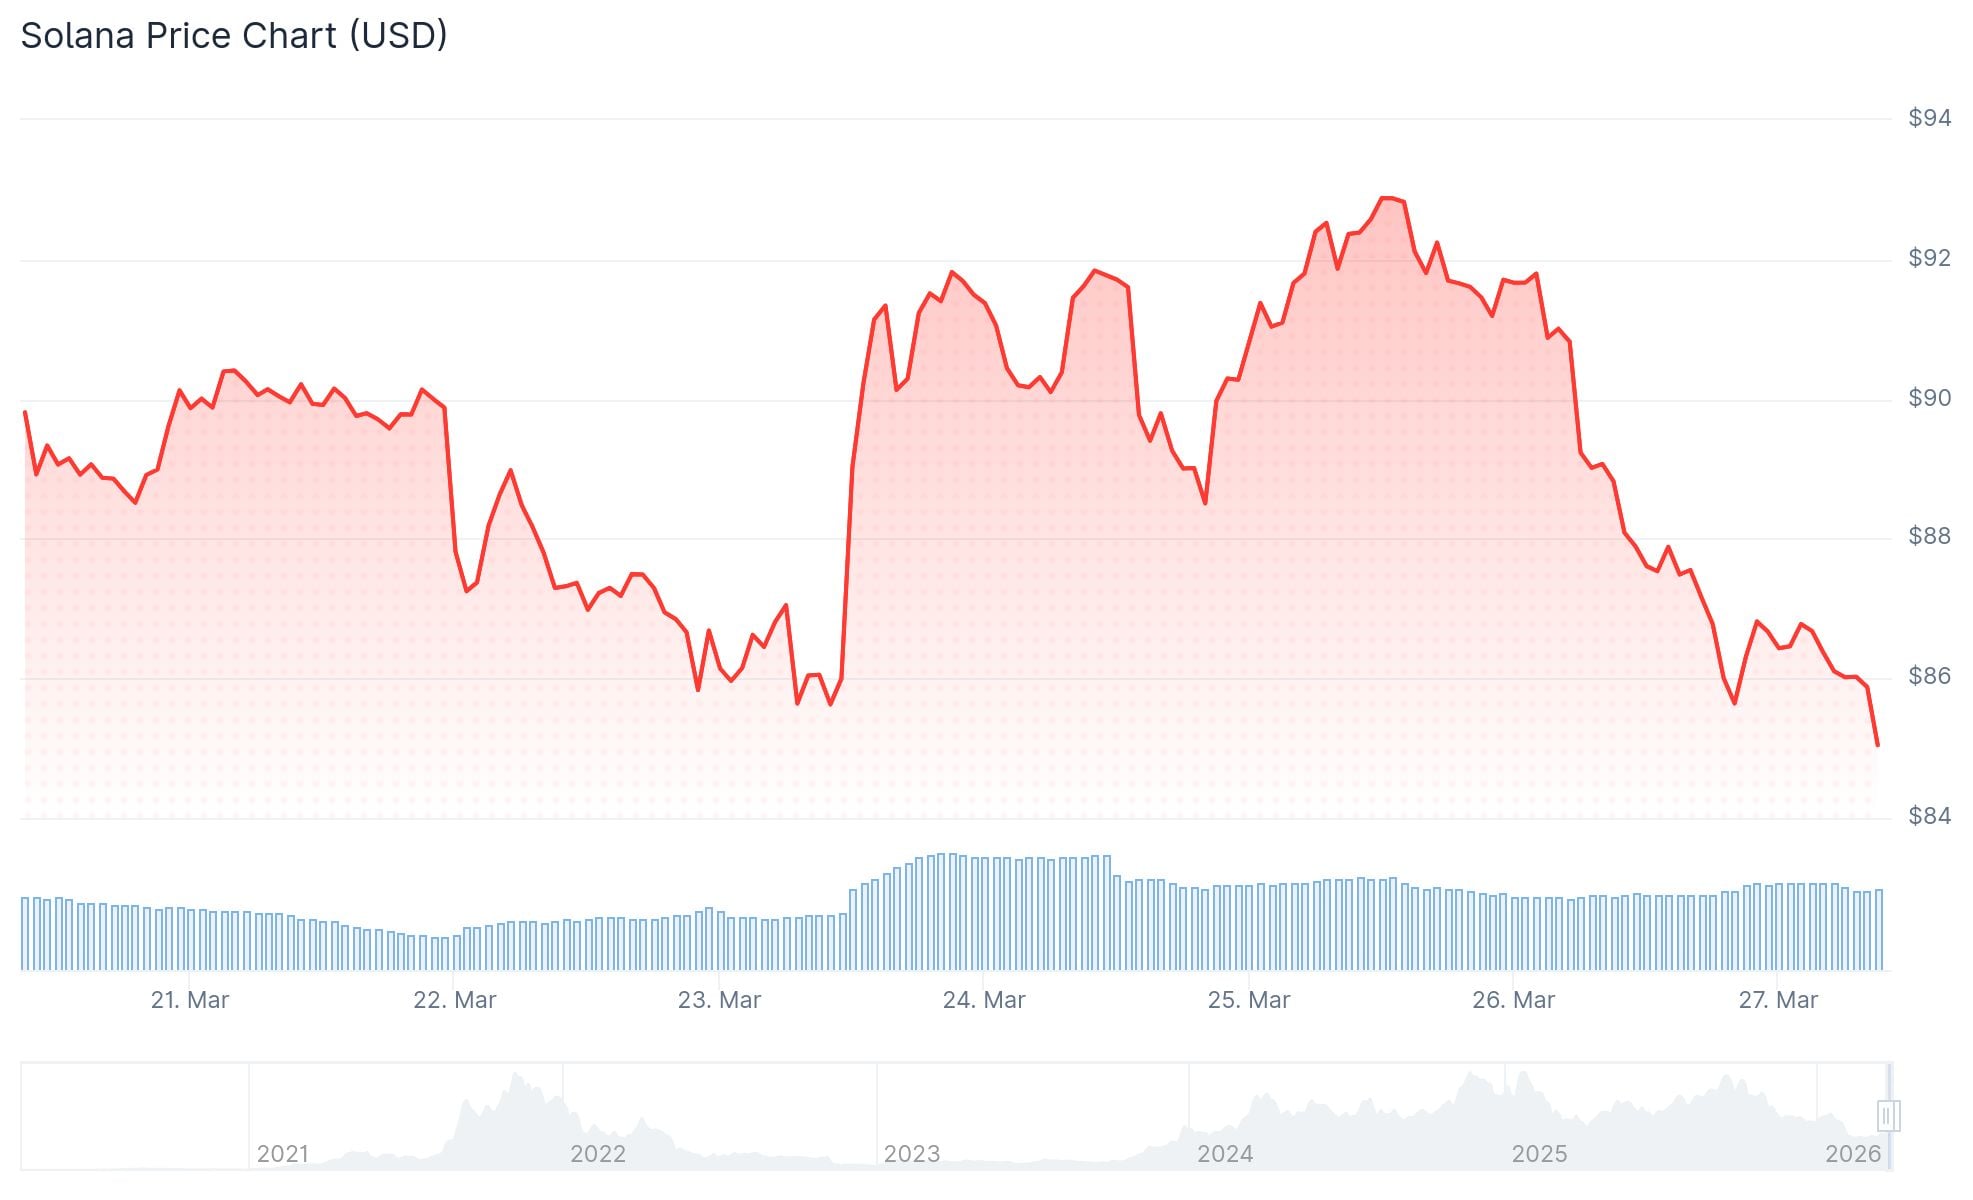
Currently, SOL changes hands at $87.45. The cryptocurrency recorded $5.62 billion in trading volume during the previous 24-hour period, while maintaining a market capitalization of $50.21 billion. The asset experienced a 5.70% decline within the last day.
Cryptocurrency analyst BitGuru highlighted the $93 rejection in an X platform post dated March 26, 2026. The analyst emphasized that SOL has retreated to a significant historical support area following the failed breakout attempt. The price action at this juncture may determine the token’s trajectory in the coming sessions.
Should demand materialize at current levels, SOL might stage a recovery toward upper resistance thresholds. Conversely, a breach of this support zone could trigger additional losses.
Technical Indicators Point to Weakening Momentum
Solana currently trades beneath all primary moving average benchmarks. The 20-day moving average registers at $88.63, while the 50-day stands at $86.09. The 100-day moving average is positioned at $106.54, and the 200-day rests at $143.24.
Trading below both the 100-day and 200-day moving averages indicates the cryptocurrency remains distant from establishing consistent upward momentum.
The Relative Strength Index reads 47.66, positioned below its signal line of 52.54. Meanwhile, the MACD line registers 0.127, trailing its signal line of 0.232. The relatively neutral MACD histogram suggests minimal directional strength in either direction.
Bearish Flag Formation Suggests Downside Potential
Chart analysis reveals a bearish flag pattern developing on the daily timeframe—a technical setup resembling a formation observed earlier this year. During that previous occurrence, Solana experienced a substantial breakdown following the pattern’s completion.
The present formation displays price consolidation within an ascending channel following a significant decline. Should a breakdown materialize from these levels, technical projections point toward the $40 to $45 price range within approximately one to two weeks.
Notwithstanding the price challenges, Solana’s blockchain activity demonstrates remarkable strength. The network handled 825,729,338 transactions from a total of 1,867,616,231 blockchain transactions recorded during the assessment period—representing 44% of global cryptocurrency transaction volume.
Analyst Ali Charts observed via X that more than 100 million SOL tokens changed hands between $91.45 and $82.60, identifying this range as the most critical demand area. Should this zone fail, subsequent support levels worth monitoring include $53.10, $35.40, and $23.60.
Quick Summary
- President Trump announced a 10-day extension for the pause on strikes targeting Iran’s energy facilities, setting an April 6 deadline for Iranian compliance.
- Bitcoin declined more than 3% during Thursday’s session before stabilizing above the $69,000 mark.
- The Nasdaq Composite experienced a 2.4% decline Thursday, marking approximately a 10% retreat from its peak recorded in January.
- The yield on 10-year U.S. Treasury notes surged to 4.43%, with market participants increasingly pricing in potential Federal Reserve rate increases instead of cuts.
- Brent crude oil prices exceeded $103 per barrel amid heightened anxieties over potential Strait of Hormuz disruptions.
Digital assets experienced a partial recovery Thursday following President Trump’s announcement that he would postpone military action against Iranian energy facilities. The declaration provided temporary respite to financial markets that had suffered significant declines earlier in the trading session.
Via his Truth Social platform, Trump stated: “As per Iranian Government request… I am pausing the period of Energy Plant destruction by 10 Days.” He further indicated that diplomatic negotiations are “ongoing” and “going very well.”
The Islamic Republic now faces an April 6 deadline to meet American requirements before potential strikes on its electrical infrastructure would recommence.
The leading cryptocurrency had plummeted over 3% earlier during Thursday’s trading. Following the president’s social media announcement, it rallied approximately 1% from session lows and stabilized just north of $69,000.

Alternative digital currencies similarly rebounded from their intraday troughs. Ethereum, XRP, Solana, and Cardano all posted modest gains from their lows but continued trading 3% to 5% below levels from 24 hours prior.
Equity Markets Face Continued Volatility
The technology-heavy Nasdaq index tumbled 2.4% during Thursday’s session. The benchmark has now retreated roughly 10% from its late January high.
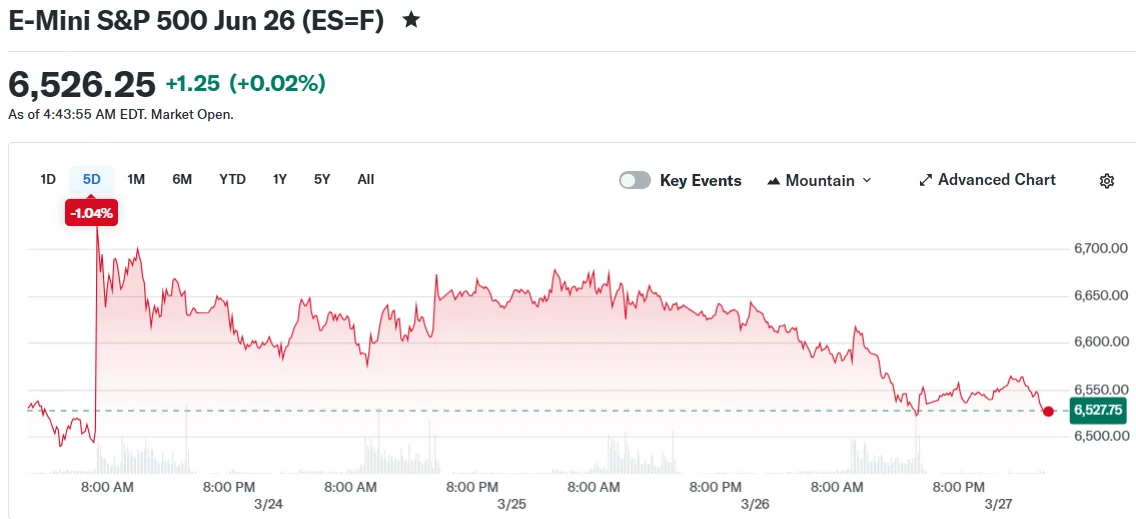
Futures contracts for U.S. equities posted modest advances Friday morning. Nasdaq 100 and S&P 500 futures each appreciated approximately 0.2%, while Dow Jones Industrial Average futures inched up 0.1%.
Neverthstanding these gains, upward momentum remained constrained. Market participants maintained a defensive posture as skepticism surrounding any permanent diplomatic resolution sustained elevated uncertainty levels.
Fixed Income Yields and Crude Oil Advance
The benchmark 10-year U.S. Treasury note yield climbed as high as 4.43% Thursday, advancing from levels below 4% registered just weeks ago. It moderated slightly to 4.41% by the session’s conclusion.
This pronounced increase has virtually eliminated market expectations for Federal Reserve interest rate reductions. Certain traders are now positioning for potential rate hikes instead. Comparable dynamics are unfolding across Western European sovereign debt markets.
Energy commodity prices also escalated. Brent crude futures traded above the $103 per barrel threshold. West Texas Intermediate approached $96. Both advances occurred as hostilities persisted throughout the Middle East region and apprehension intensified regarding potential interruptions to maritime traffic through the Strait of Hormuz.
Market observers are monitoring whether the geopolitical confrontation could persist deep into April.
Emerging reports indicate Iranian leadership remains hesitant to engage in direct negotiations with Washington, despite reviewing an American diplomatic proposal. This prevailing uncertainty continues exerting pressure on financial markets entering the weekend.


US Representative Maxine Waters has asked the Federal Reserve Bank of Kansas City to explain its decision to approve Kraken Financial’s limited-purpose master account.
Summary
- Maxine Waters asked the Kansas City Fed to explain Kraken Financial’s master account approval terms.
- Waters asked which Federal Reserve services Kraken can access and what restrictions apply to usage.
- Kraken’s approval renews debate over crypto firms seeking direct access to core US payment rails.
Her request puts fresh attention on how crypto-linked firms may gain access to the US payment system and what safeguards apply when the Federal Reserve reviews those applications.
Waters, the top Democrat on the House Financial Services Committee, sent a letter to Kansas City Fed President Jeff Schmid on Thursday. She asked him to respond by April 10 with details on what Kraken’s approval allows in practice and which Federal Reserve services the company can use.
She also asked what conditions or limits apply to the account. Her letter requested information on anti-money laundering checks, consumer protection reviews, and the legal basis behind the approval process.
Kraken Financial received a limited-purpose master account from the Federal Reserve Bank of Kansas City earlier this month. The move drew attention because crypto-linked firms have sought direct Federal Reserve access for years.
The account could give Kraken access to Fedwire, the Federal Reserve’s main payment network. That system allows institutions to move funds on the same core rails used by banks and credit unions across the United States.
Waters said the public notice left important questions unanswered. In her letter, she wrote that the Kansas City Fed’s announcement “does not disclose specific information” about Kraken’s access to Federal Reserve financial services because of “the confidentiality of business information provided by applicants.”
Waters said direct access to the Federal Reserve’s payment system raises policy, regulatory, and consumer protection questions. She argued that the Federal Reserve must show that any approval follows the law and applies the same standards to all applicants.
She wrote that “answers to these questions are critical” to ensure the approval process works “with impartiality” and supports “a safe and efficient payment system.” Waters also said new activity in digital assets, tokenization, payments, and artificial intelligence is moving faster than many existing laws.
Crypto firms continue push for master accounts
Kraken is not the only crypto-linked company seeking this type of access. Custodia Bank, Anchorage Digital Bank, and Ripple’s Standard Custody & Trust Company have also pursued Federal Reserve master accounts.
Waters has often taken a cautious position on crypto policy. Advocacy group Stand With Crypto lists her as “strongly against crypto,” citing past statements and votes against crypto legislation. Her latest letter now places the focus on transparency in how the Federal Reserve handles crypto-related account approvals.

Ondo Finance just landed one of the heaviest institutional co-signs in tokenized finance history, and trading at $0.28 and posting a staggering 10% price jump in 24 hours as its prediction gets bullish.
Ondo Finance confirmed it will partner with Franklin Templeton to bring tokenized versions of publicly traded stocks and ETFs to blockchain users via Ondo Global Markets, a platform launched in September 2025 that already reports $620 million in total value locked and $12 billion in cumulative trading volume across 60,000 users.
BREAKING — X Finance Bull (@Xfinancebull) March 25, 2026
 Franklin Templeton is partnering with $ONDO to tokenize ALL their ETFs. U.S. equities, fixed income, and gold.
Trading 24/7 through crypto wallets.
Now remember what $ONDO is already doing on the $XRP Ledger.
Ondo's OUSG, backed by BlackRock's BUIDL fund, is… pic.twitter.com/M6hiXvbAGf
Franklin Templeton will supply investment products and support educational rollout for crypto-native audiences. The move follows a broader central bank and institutional push into tokenized asset infrastructure, with BlackRock and others already testing on-chain settlement rails.
The partnership with Franklin Templeton, which oversees $1.7 trillion in assets under management, is moving the coin as it should.
Discover: The best crypto to diversify your portfolio with
ONDO Price Prediction: $0.3 Resistance To Be Broken This Week?
ONDO is running to break the $0,29 channel, and the technical picture is about as ambiguous as it gets. March 26 closed at $0.27 on $80.8 million in volume, respectable activity for a mid-cap RWA token.
Key levels to watch: support at $0.25–$0.26, with resistance clustering at $0.285–$0.29. That ceiling has capped every rally attempt in the current consolidation window. A clean close above $0.295 on elevated volume would shift momentum decisively bullish.

The regulatory clarity narrative that’s lifting other institutional-grade tokens remains a slow-burn catalyst for ONDO specifically, given that tokenized securities sit in a grey zone that regulators haven’t fully addressed across wallet-to-wallet transfers.
Discover: The best pre-launch token sales
LiquidChain Targets Early Mover Upside as ONDO Tests Key Levels
ONDO at $0.28 is a mature, already-discovered trade. The Franklin Templeton partnership is priced into sentiment, and even a rally to the $0.5136 year-end target represents roughly 97% upside from current levels. That’s meaningful. But early-stage infrastructure operating in the same RWA and cross-chain space are still pricing in discovery, not deployment.
A new layer emerges. Only a few see it first.
The future is LiquidChain⟁https://t.co/vqvBcdSj94 pic.twitter.com/R7ZeZ0NPGl
— LiquidChain (@getliquidchain) March 24, 2026
LiquidChain ($LIQUID) is a Layer 3 infrastructure project with a specific structural thesis: fusing Bitcoin, Ethereum, and Solana liquidity into a single execution environment. Where most cross-chain protocols force developers to rebuild or bridge repeatedly, LiquidChain’s Deploy-Once Architecture means a single deployment accesses all three ecosystems simultaneously.
The presale is live at $0.014 per $LIQUID, with more than $600K raised to date. Core features include a Unified Liquidity Layer, Single-Step Execution, and Verifiable Settlement.
This article is not financial advice. Cryptocurrency investments are highly volatile. Always conduct your own research before making any investment decisions.
The post ONDO Price Prediction: Franklin Templeton’s $1.7 Trillion Weight to Carry appeared first on Cryptonews.
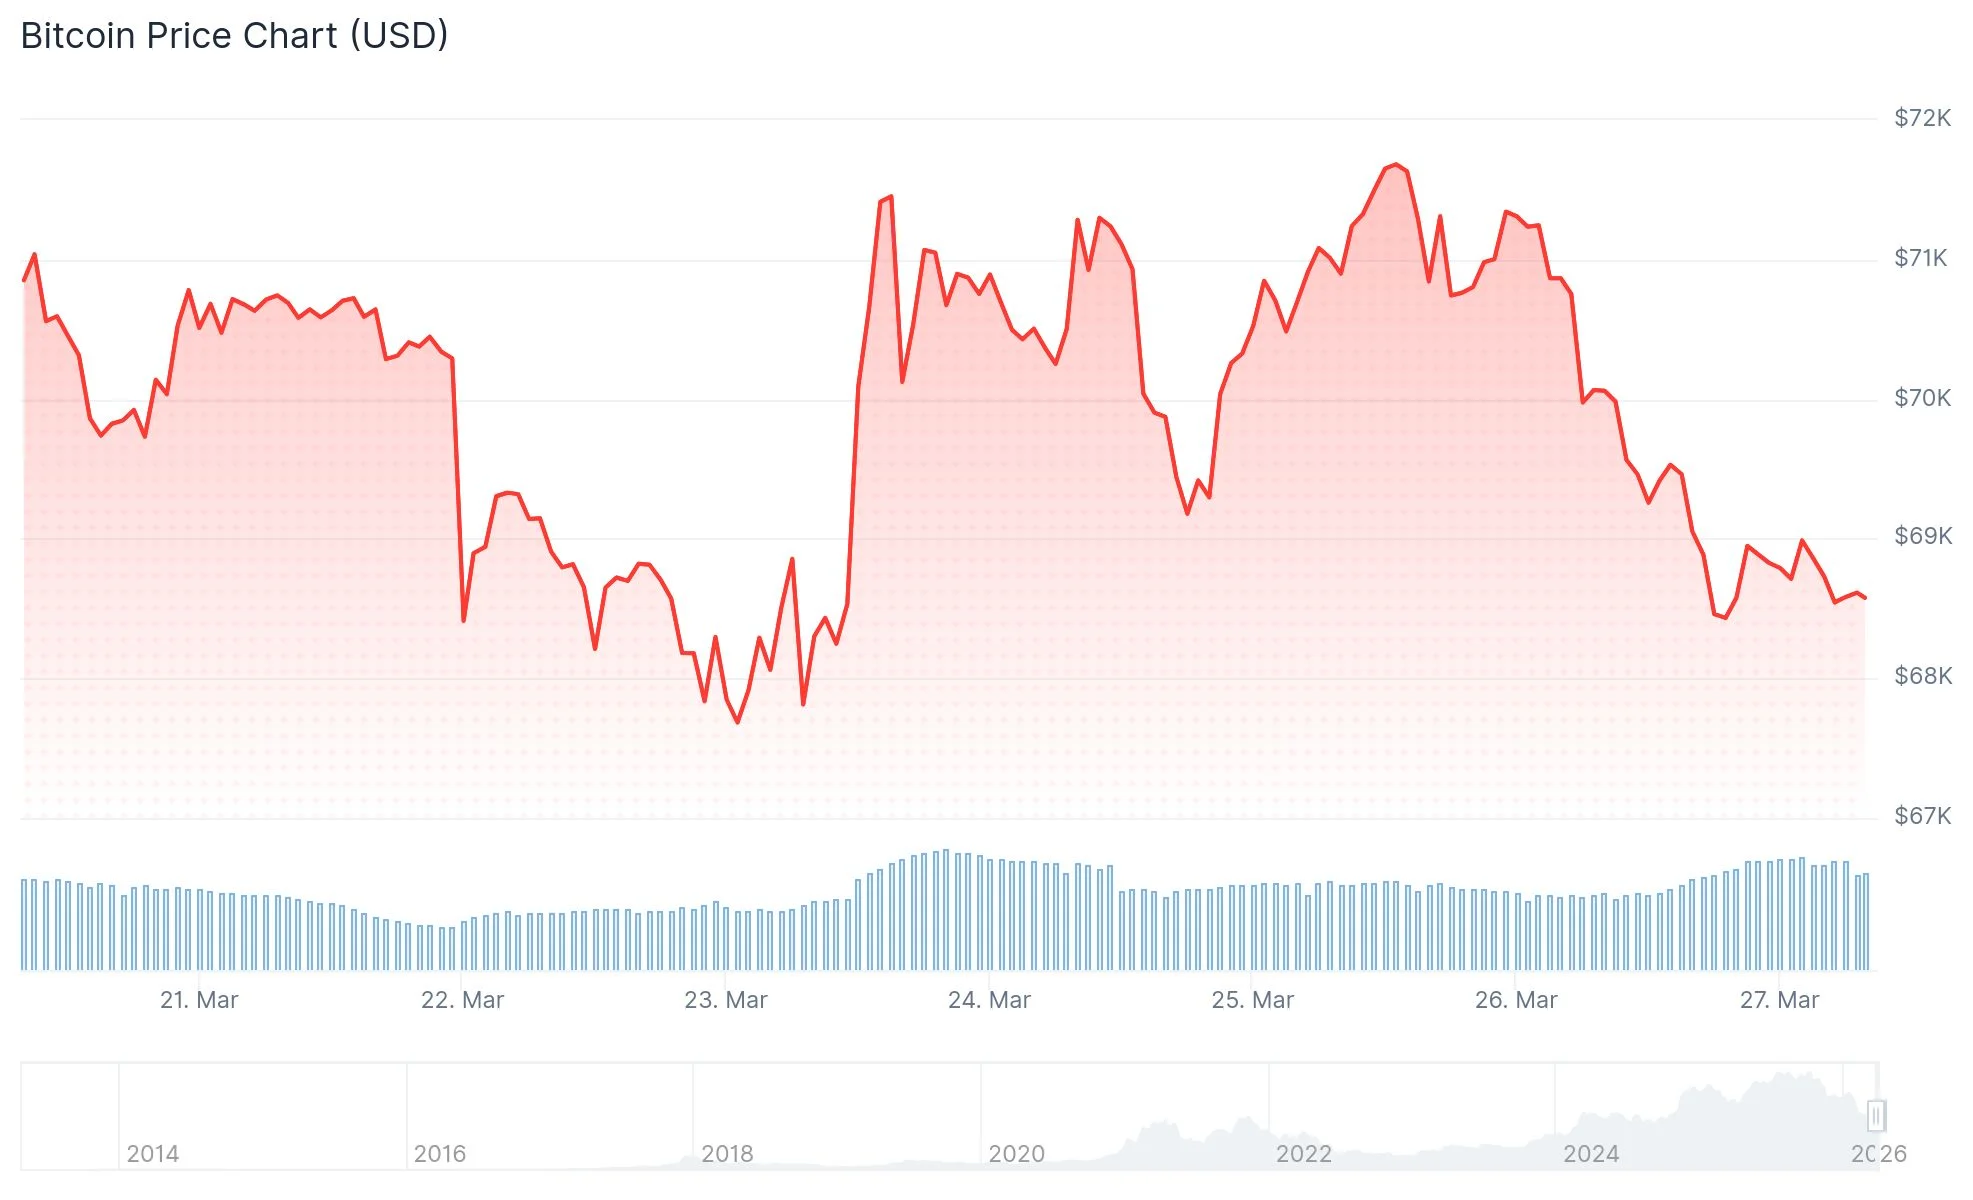
Crypto’s most prominent Washington ally just changed his business card, and the market is watching, and the Bitcoin price prediction is changing. BTC is trading around $68,700, down 1.8% in 24 hours, dragging the crypto market down. The timing is uncomfortable: policy uncertainty and a softening chart colliding at once.
White House AI and Crypto Czar David Sacks announced Thursday he is stepping down from his czar role and joining the President’s Council of Advisors on Science and Technology (PCAST) as co-chair. The transition was legally inevitable; Sacks’s czar designation classified him as a “special government employee,” a status capped at 130 working days.
He told Bloomberg the PCAST role carries no such restriction, and he will continue shaping crypto and AI policy alongside an advisory roster that includes Jensen Huang, Mark Zuckerberg, Marc Andreessen, and Sergey Brin. Sacks oversaw the passage of the stablecoin-focused GENIUS Act and was actively involved in the crypto market structure bill.
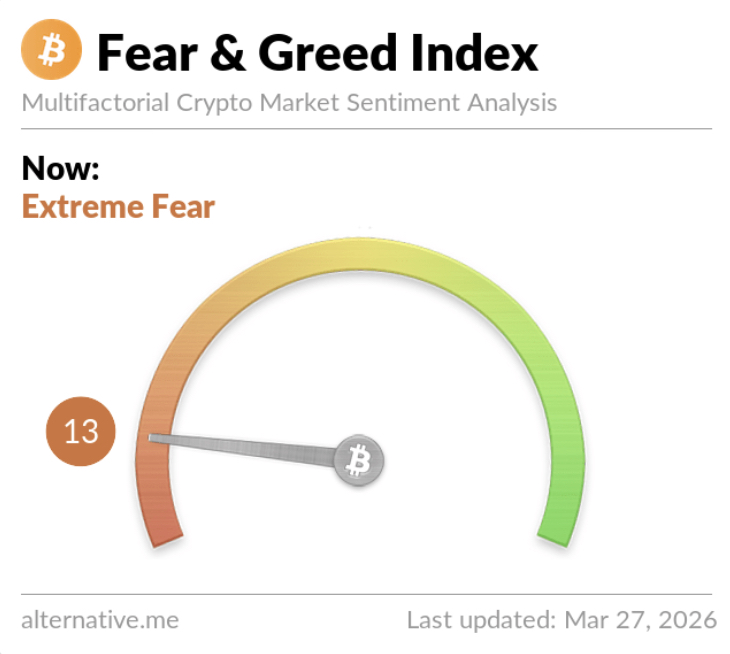
The structural policy work continues, in other words, just under a different letterhead. Whether that reassures a market already flashing Extreme Fear is the harder question.
Discover: The best pre-launch token sales
BTC Price Prediction: Reclaim $70,000 This Week or Drop to $60K?
The chart is not cooperating. Bitcoin sits at $68,700, consolidating inside a descending channel with moving averages stacked bearishly. The Fear & Greed Index has collapsed to 13 in an extreme fear situation, a level that historically marks either capitulation bottoms or accelerated selloffs.

Key support levels to monitor: $68,000, $67,700, and $66,500. Resistance sits at $70,400, then $71,700, with a harder ceiling near $72,300.
Three scenarios, ranked by current probability:
- Bull case: Spot holds $68,400, futures demand stabilizes and price reclaims $70,000+ into the weekend.
- Base case: Consolidation between $66,400 and $70,400 persists as ETF inflows plateau and miner selling pressure absorbs any recovery bids.
- Bear case: Analyst Alessio Rastani’s warning of a “high chance” drop below $60,000 materializes if $66,400 gives way, opening a path toward the $54,200 level flagged in forex analysis.

The Bitcoin institutional demand picture remains the swing for price prediction. A Fear & Greed reading of 13 cuts both ways.
Discover: The best crypto to diversify your portfolio with
Bitcoin Hyper Targets Early-Mover Upside as BTC Tests Critical Support
When spot Bitcoin grinds sideways at Extreme Fear levels, the rotation question surfaces: where does asymmetric upside actually live right now?
A different segment of the Bitcoin ecosystem is drawing attention. Bitcoin Hyper ($HYPER) is positioning as the first Bitcoin Layer 2 with Solana Virtual Machine (SVM) integration, sub-second finality on Bitcoin’s security layer, a proposition that existing L2s haven’t delivered. The project targets Bitcoin’s three structural constraints: slow transactions, high fees, and the absence of programmable smart contracts.
Two modes. One future. — Bitcoin Hyper (@BTC_Hyper2) March 27, 2026

Bitcoin Hyper. https://t.co/VNG0P4GuDo pic.twitter.com/uNneqkZg13
Presale numbers are concrete: $0.0136 per token, with more than $32 million raised to date. Staking is live with high APY for participants. The architecture includes a Decentralized Canonical Bridge for BTC transfers and SVM-powered smart contract execution that the team claims outpaces Solana itself.
This article is for informational purposes only and does not constitute financial advice. Crypto assets are highly volatile. Always do your own research before investing.
The post Bitcoin Price Prediction: David Sacks Is No Longer Crypto Czar appeared first on Cryptonews.
U.S. spot Ethereum exchange-traded funds recorded seven straight days of outflows with over $390 million leaving the funds.
Summary
- U.S. spot Ethereum ETFs logged a seventh straight day of outflows, with over $390 million withdrawn amid weakening institutional demand.
- Capital rotation into BlackRock’s staked ETH ETF and safe-haven assets like gold reflects a broader risk-off sentiment tied to geopolitical tensions.
- Ethereum remains under pressure, down sharply from yearly highs, though declining exchange balances point to ongoing accumulation.
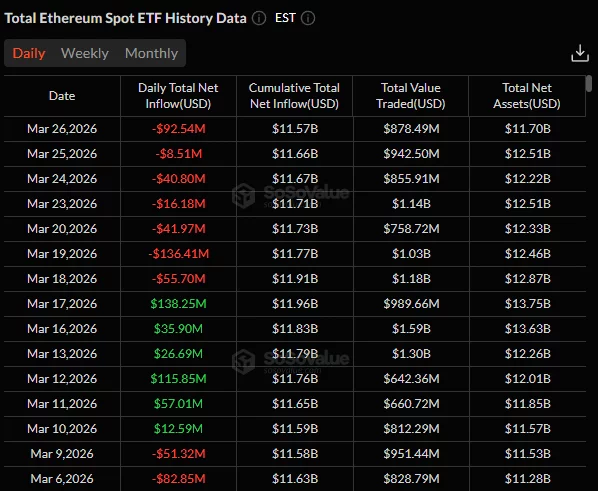
According to data from SoSoValue, the 10 spot ETH ETFs saw $92.54 million in net outflows on Thursday, March 26, primarily led by BlackRock’s ETHA with $140.24 million in outflows. The investment manager’s staked Ethereum ETF (ETHB) managed to offset a large portion of the outflows as it drew in $96.81 million on the day.

Following the outflows yesterday, these investment products have now seen redemptions for the seventh consecutive day, with a combined $391.65 million flowing out.
Before this streak, the ETFs recorded a six-day inflow run in which they drew in over $386 million. This suggests that institutional traders could be withdrawing from the market amid expectations of a prolonged conflict between the U.S. and Iran, destabilizing risk assets.
A part of this activity may also come from capital rotation into BlackRock’s ETHB, which offers investors native staking yields unlike the standard spot ETFs that simply track the price of the underlying asset. The firm previously noted that it would waive a portion of sponsor fees to remain competitive for the initial $2.5 billion in assets.
Besides this, investors have also been rotating capital from these ETFs towards traditional safe-haven assets such as gold and other precious metals as oil prices continue to retain upward pressure, sparking fears of global inflation and a hawkish Federal Reserve.
On the monthly scale, the ETH ETFs are close to completing their 5th straight month of net outflows that began in November last year, with nearly $2.85 billion in total exits.
Ethereum price has fallen over 45% from its year-to-date high to $1,815 in late February amidst the persistent ETF outflows and broader market downturn triggered by the U.S.-Iran war, rising energy costs, and diminished expectations of Federal Reserve interest rate cuts this year. At press time, Ethereum price was trading at $2,065, down 2.7% over the past 24 hours.
Market analysts, such as Tom Lee, Head of Research at Fundstrat and Chairman of Ethereum treasury company Bitmine, have called a market bottom for Ethereum, aligning with the firm’s aggressive accumulation of Ether as it advances towards its 5% target of the total circulating supply.
This comes as Ethereum balances on exchanges have fallen to an all-time low, a sign of accumulation, whether by retail investors or institutional giants such as Bitmine, likely positioning for much higher prices.
Disclosure: This article does not represent investment advice. The content and materials featured on this page are for educational purposes only.


David Sacks has ended his 130-day term as the White House’s crypto and AI czar, but he is staying involved in technology policy through a new advisory post.
Summary
- David Sacks ended his czar term and moved into a broader White House technology advisory role.
- Sacks will co-chair PCAST and continue shaping AI and digital asset policy recommendations there.
- PCAST brings together top tech leaders as Trump pushes one national rulebook for AI policy.
The change keeps him close to the administration’s work on AI and digital assets while expanding his role to cover a wider set of technology issues.
Sacks said his time limit as a special government employee had been reached. Under US rules, special government employees can serve only 130 days during a 12-month period, which ended his formal term in the crypto and AI czar role.
He said he will now serve as co-chair of the President’s Council of Advisors on Science and Technology, known as PCAST. The council is a federal advisory group that gives policy recommendations on science and technology matters to the White House.
Sacks said the new position will overlap with his previous work because council members will “study issues together” before sending recommendations to regulators. Fox Business also reported that a senior White House adviser said, “David will always be his crypto and AI czar,” while the broader role lets him advise on other major technology issues.
Sacks plans to keep supporting the administration’s AI policy framework released on March 20, 2026. That framework called for a more unified national approach to AI rules and backed a lighter federal structure instead of a state-by-state system.
During his time in office, Sacks helped lead the President’s Working Group on Digital Asset Markets. The group’s report, released in July 2025, laid out recommendations for digital asset regulation and was prepared under the White House order that created the working group.
He was also tied to the administration’s broader AI policy work. He took part in changes to Biden-era AI chip export rules and remained involved in the White House push for a national AI strategy.
PCAST lineup points to a wider tech focus
The White House said PCAST includes major technology leaders such as Nvidia CEO Jensen Huang, Meta CEO Mark Zuckerberg, Oracle’s Larry Ellison, AMD CEO Lisa Su, and others. The council is expected to advise on artificial intelligence and other emerging technologies.
That makeup suggests the council may focus more broadly on AI, computing, and national technology strategy, even as crypto remains part of Sacks’ portfolio. Sacks said one concern is the “patchwork of regulation” created when states take different approaches, adding that the president wants “one rulebook.”

Today, BTC/USD is trading slightly below the psychological $70k level. Assessing its price action since the panic on 5 February, it is reasonable to suggest that the market is showing signs of range-bound behaviour: sellers tend to emerge near $75k, while buyers become active around $65k.
This balance between supply and demand, where neither side has been able to take control for several weeks, may feel either tiring or calming; however, the price chart suggests there are reasons for concern.
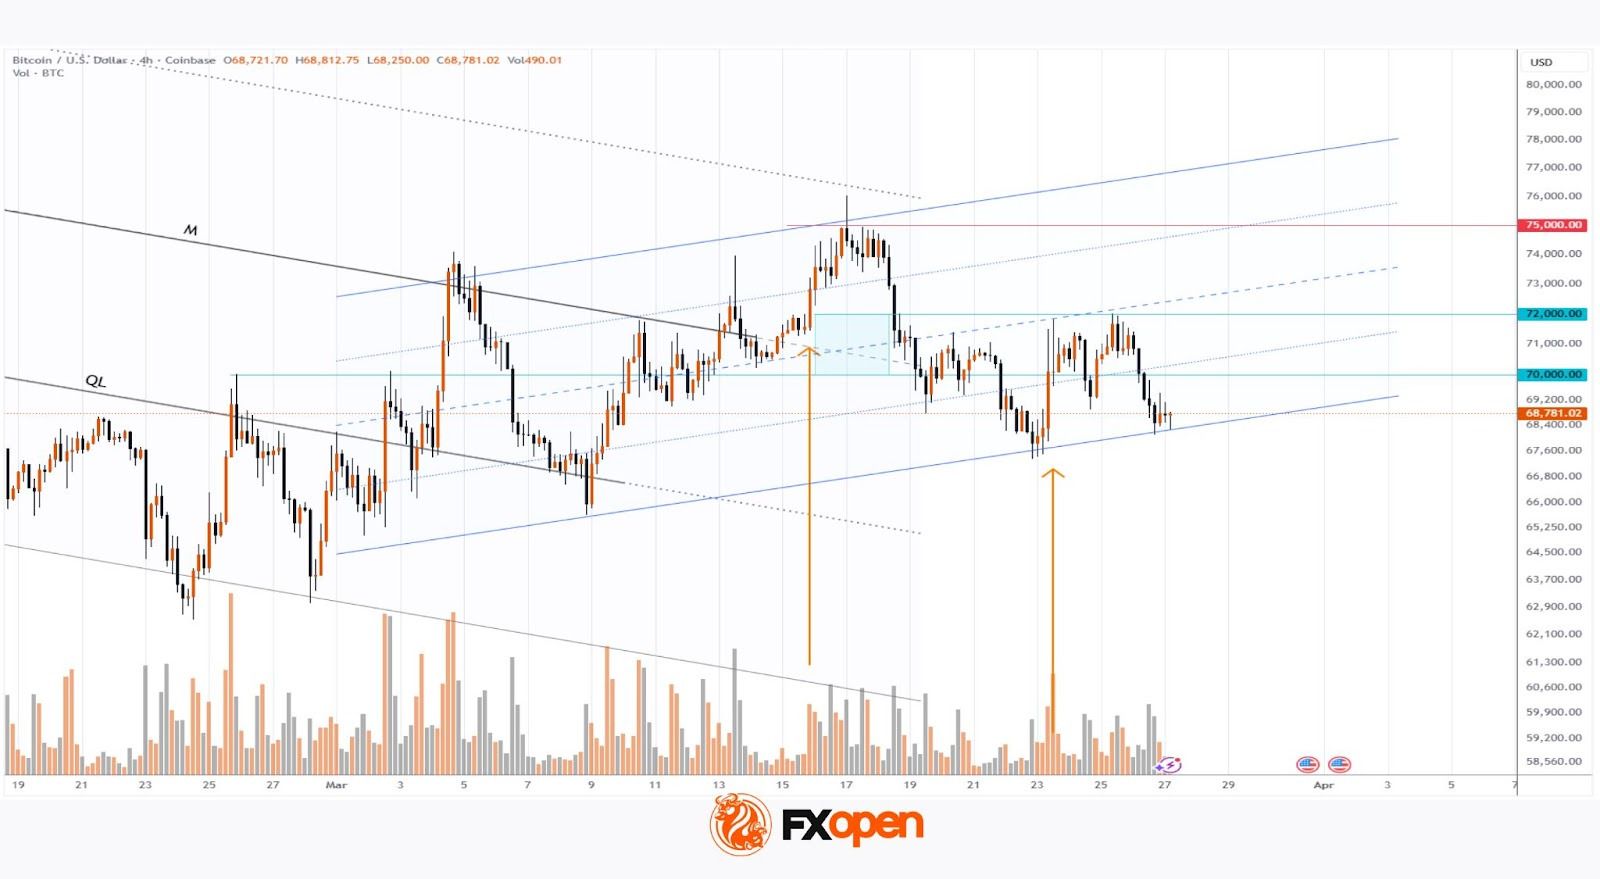
Technical Analysis of BTC/USD
On 18 March, analysing Bitcoin’s price action within a broad descending channel, we:
→ noted signs of buying pressure, which led to the formation of an intermediate ascending channel (shown in blue);
→ suggested that buyers were pushing sellers out of the $70–72k zone, which could act as support.
However, the price soon reversed lower from the psychological $75k level, and the highlighted zone failed to provide support. Bulls retreated and showed an inability to defend the gains marked by the first arrow.
A similar lack of strength was observed later:
→ As indicated by the second arrow, on Monday, 23 March, Bitcoin surged sharply following statements by Donald Trump regarding negotiations with Iran.
→ However, the previously mentioned $72k level acted as resistance, and yesterday’s decline once again reflects a retreat by buyers.
As a result, there are grounds to conclude that bulls are struggling to sustain momentum, increasing the risk of a bearish breakout below the lower boundary of the blue channel. This level is particularly important because:
→ the blue channel may be interpreted as a bearish flag pattern;
→ a breakdown of this pattern could pave the way for a continuation of the prevailing downtrend, which has been in place since autumn 2025.
FXOpen offers the world’s most popular cryptocurrency CFDs*, including Bitcoin and Ethereum. Floating spreads, 1:2 leverage — at your service (additional fees may apply). Open your trading account now or learn more about crypto CFD trading with FXOpen.
*Important: At FXOpen UK, Cryptocurrency trading via CFDs is only available to our Professional clients. They are not available for trading by Retail clients. To find out more information about how this may affect you, please get in touch with our team.
This article represents the opinion of the Companies operating under the FXOpen brand only. It is not to be construed as an offer, solicitation, or recommendation with respect to products and services provided by the Companies operating under the FXOpen brand, nor is it to be considered financial advice.
John Swinney urged to ‘come clean’ on SNP role in Jordan Linden sex assault ‘cover up’
UK patent and trademark firm opens Bristol office as it targets ‘significant’ South West opportunities

Dogecoin (DOGE) Price Drops 5% as Large Holders Accumulate During Correction

Smart energy pays enters the US market, targeting scalable financial infrastructure

Why Israel is blocking foreign journalists from entering

Bitcoin: We’re Entering The Most Dangerous Phase

XRP I CAN’T BELIEVE WHAT I AM SEEING! (It All Makes Sense Now!)

“Unlock Financial Freedom: Transform Your Savings with This EPIC House-Shaped Coin Bank!”(AC-1408)

PROOF XRP WAS NEVER MEANT FOR RETAIL! – THEY WILL SEIZE YOUR XRP? – XRP MARKETCAP PREVENTS $10+?
-
 Crypto World6 days ago
NIO (NIO) Stock Plunges 6.5% as Shelf Registration Sparks Dilution Worries
-
 NewsBeat2 days ago
Manchester United reach agreement with Casemiro over contract clause amid transfer speculation
-

 Fashion7 days ago
Weekend Open Thread: Adidas – Corporette.com
-

 Politics7 days ago
Jenni Murray, Long-Serving Woman’s Hour Presenter, Dies Aged 75
-

 Crypto World5 days ago
Best Crypto to Buy Now: Strategy Just Spent $1.57 Billion on Bitcoin During Fear While Early Investors Quietly Enter Pepeto for 150x Potential
-

 Crypto World5 days ago
Bitcoin Price News: Bhutan Sells $72 Million in BTC Under Fiscal Pressure, but the Smart Money Entering Pepeto Sees What the Market Does Not
-

 News Videos1 day ago
Parliament publishes latest register of MPs’ financial interests
-

 Sports4 days ago
Remo Stars and Kano Pillars Strengthen Survival Hopes in NPFL
-

 Sports4 days ago
Gary Kirsten Accuses Pakistan Cricket Board Of ‘Interference’, Mohsin Naqvi Responds
-

 Tech5 days ago
Give Your Phone a Huge (and Free) Upgrade by Switching to Another Keyboard
-

 Business5 days ago
No Winner in March 21 Drawing as Prize Rolls to $133 Million for Next
-

 Sports7 days ago
2026 Kentucky Derby horses, odds, futures, preview, date: Expert who nailed 12 Derby-Oaks Doubles enters picks
-

 Tech4 days ago
AI enters the chat: New Seattle dating app relies on tech to facilitate meaningful human connections
-
Business6 days ago
Columbia Sportswear enters $500 million credit agreement with JPMorgan Chase
-

 News Videos4 days ago
Ch 9 Financial Management Part 1 | Detailed One Shot | Class 12 Business Studies Boards 2026
-

 Tech5 days ago
Today’s NYT Connections Hints, Answers for March 22 #1015
-

 Business13 hours ago
Instagram, YouTube Found Responsible for Teen’s Mental Health Struggle in Historic Ruling
-
 Crypto World7 days ago
Small-cap Russell 2000 enters correction territory
-

 Business5 days ago
Will Duke Basketball Win It All? Duke Basketball Enters Second Round as Third Favorite to Claim NCAA Title
-

 Sports4 days ago
2026 Kentucky Derby horses, odds, futures, preview, date: Expert who hit 12 Derby-Oaks Doubles enters picks
You must be logged in to post a comment Login