
Crypto World
The Good and The Bad for XRP After Failed Rebound
XRP is trying to build a short-term recovery, but the broader trend still leans cautious. The recent bounce has improved momentum on both pairs, yet the price is still trading beneath major trend-defining resistance levels. In other words, sellers are no longer fully in control of the very short term, but buyers have not done enough to claim a real trend reversal either.
XRP/USDT Analysis: The Daily Chart
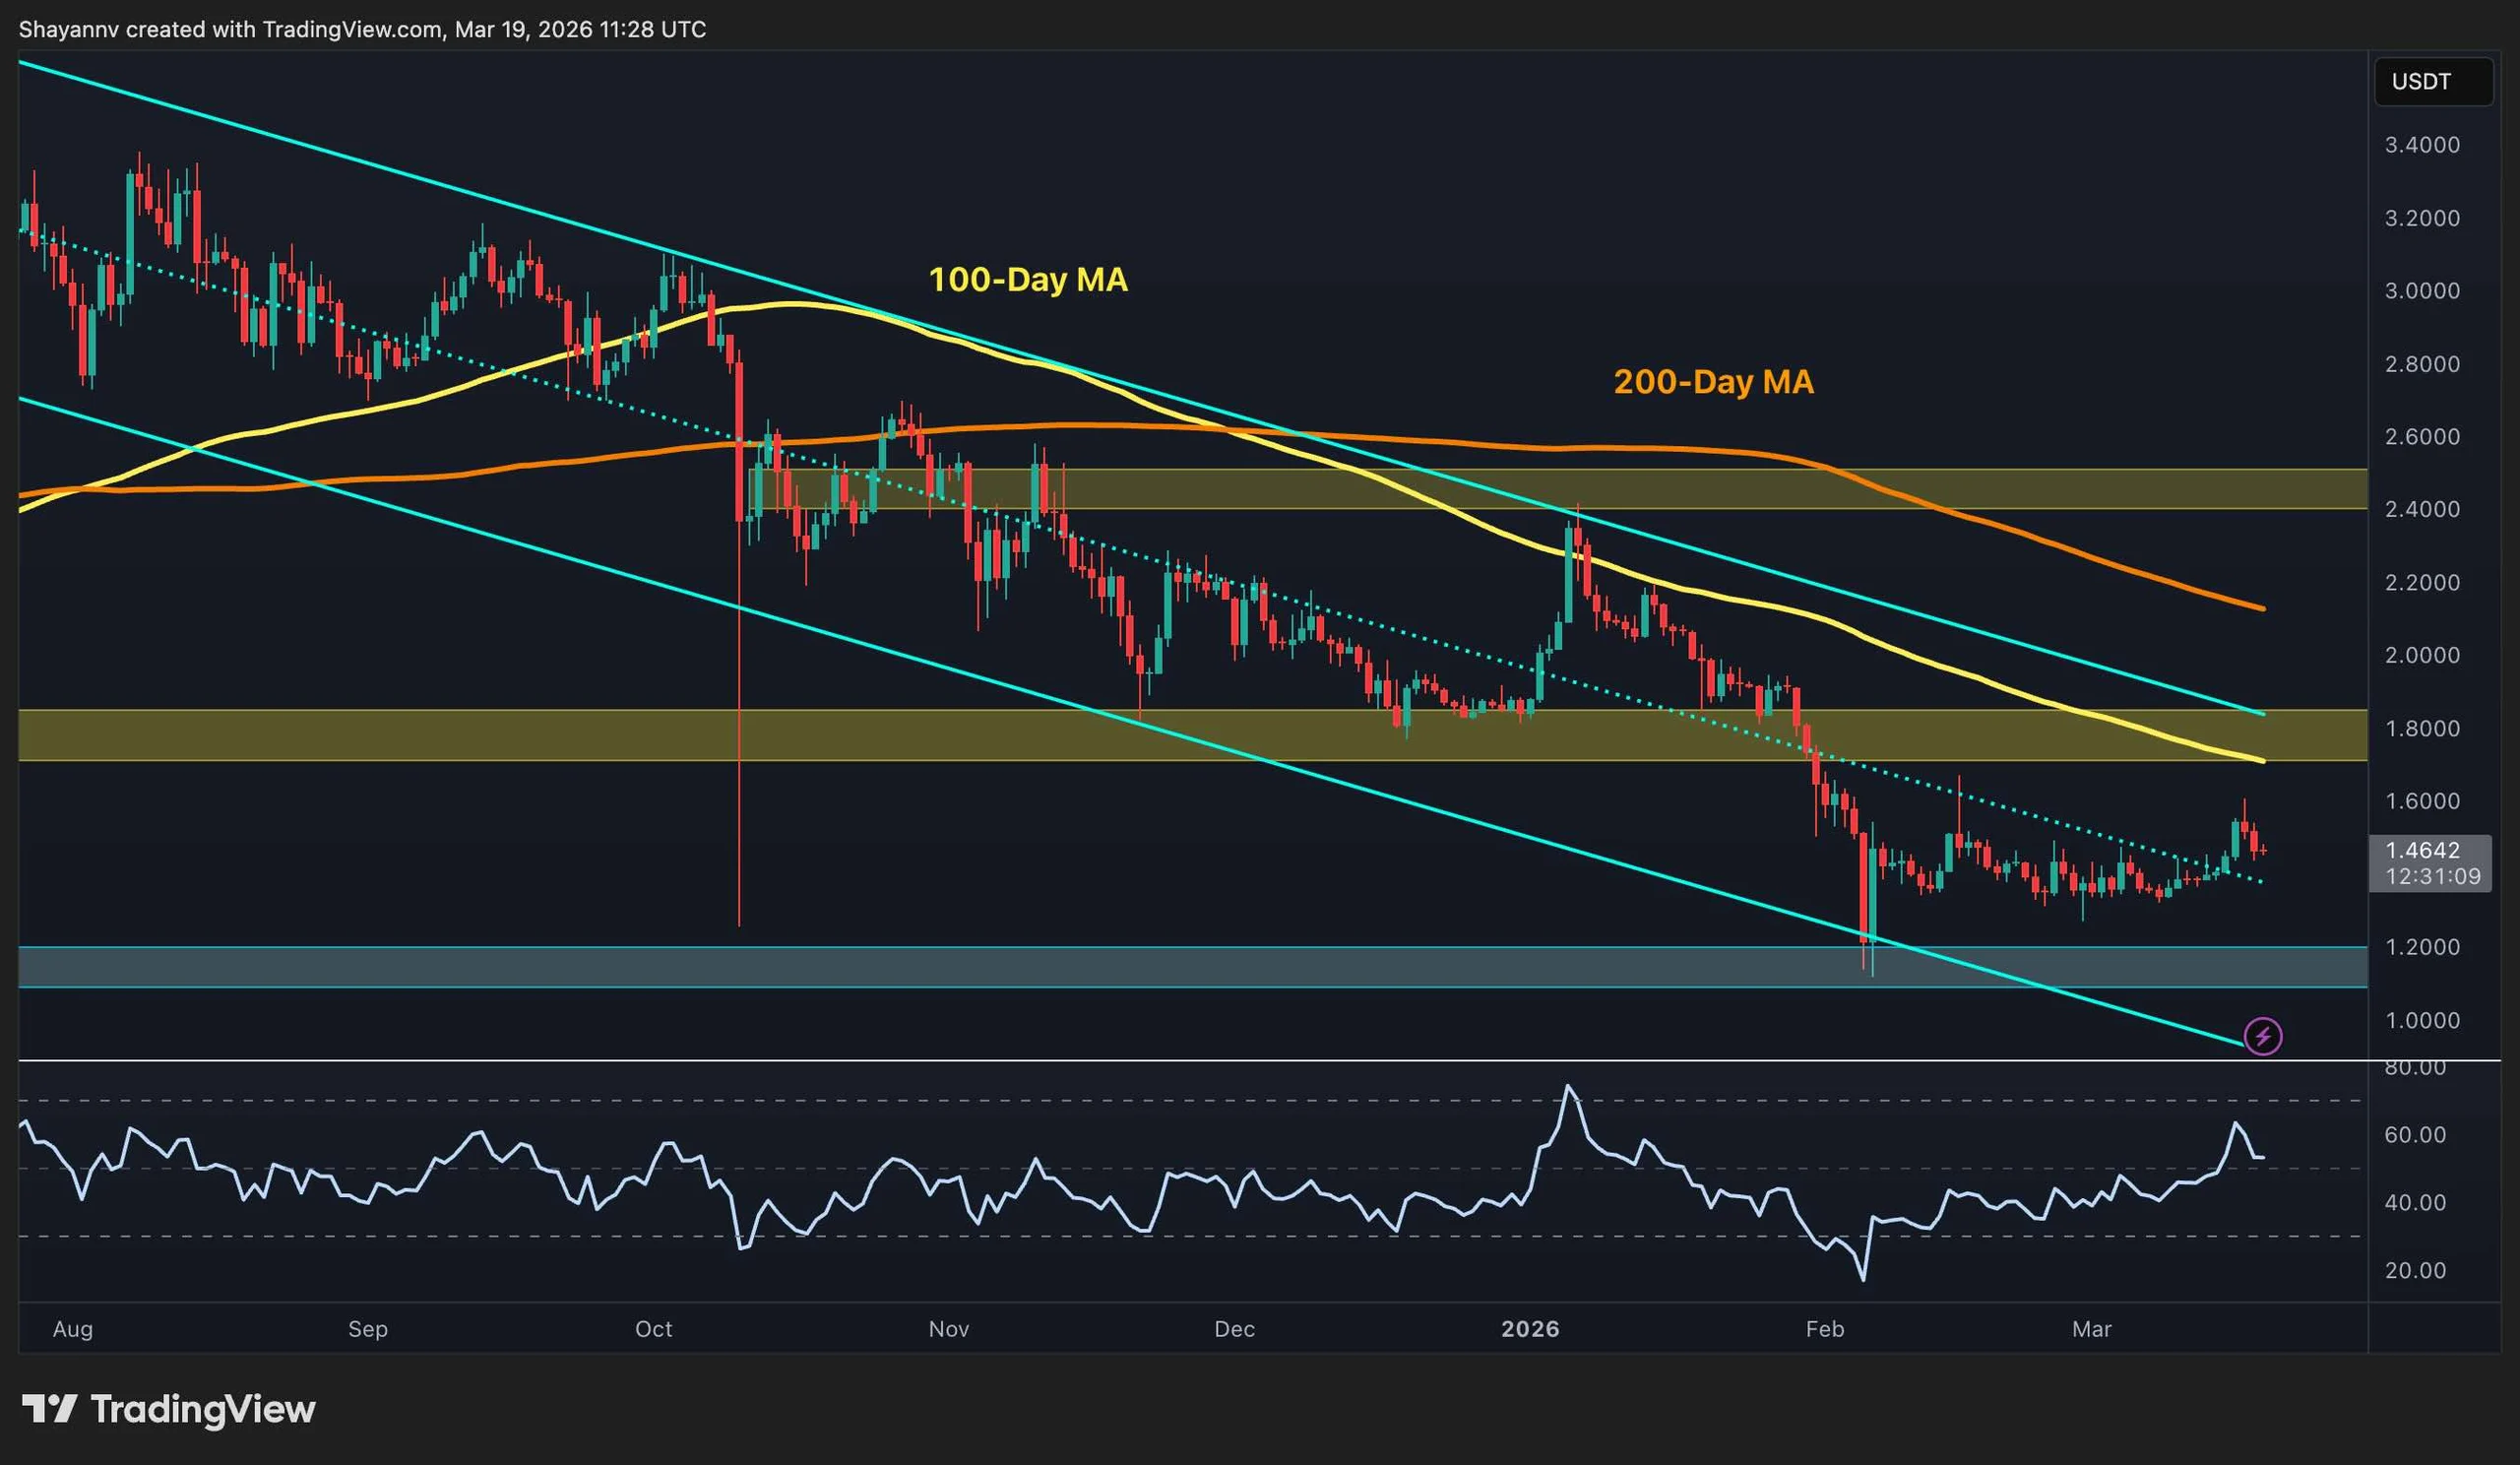
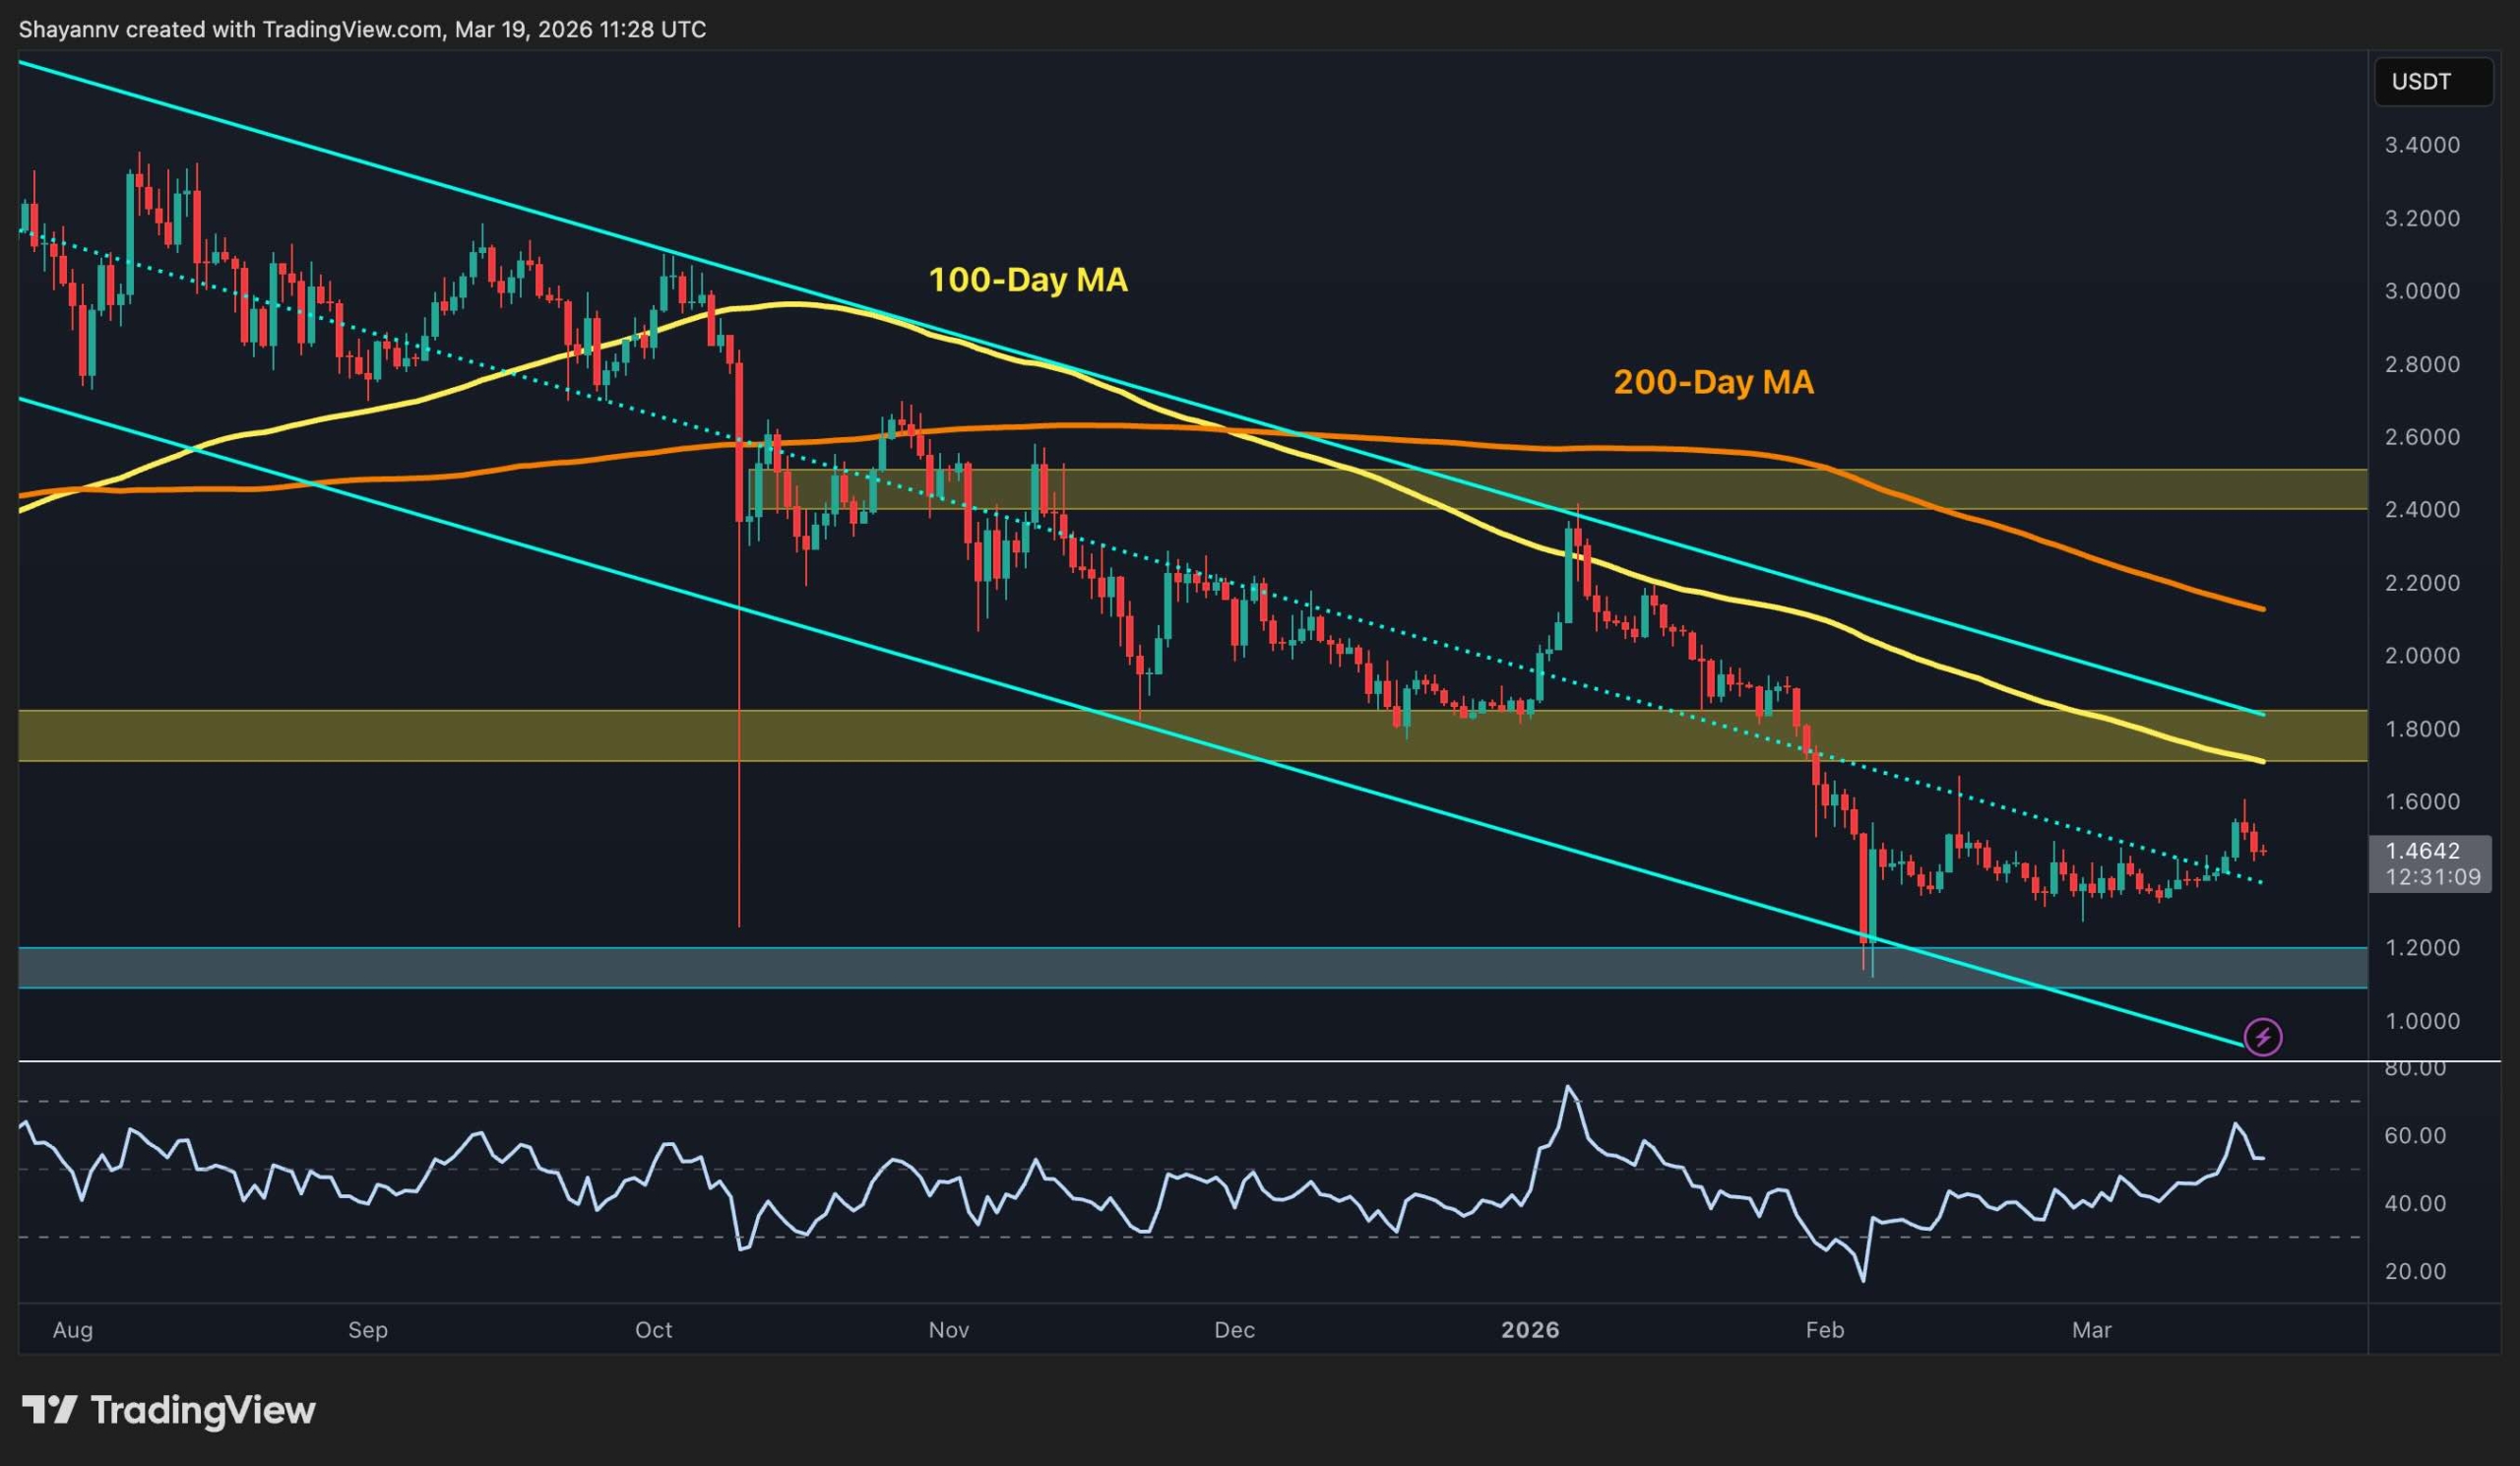
On the XRP/USDT chart, the asset has pushed back toward the mid-$1.40s after defending the $1.10 to $1.20 demand zone earlier this month. That rebound matters because it keeps XRP off the lows and lifts RSI back into a healthier range, but the price is still stuck inside the descending structure and below the first major supply band around $1.75 to $1.80.
That leaves XRP in a tricky spot. The current move looks constructive, but it still resembles a relief rally inside a larger downtrend rather than a clean breakout. If buyers can force a reclaim of the $1.75 to $1.80 region, the door opens toward the much heavier $2.40 to $2.50 resistance area. But the price would also need to climb above both the 100-day and 200-day moving averages to reach this area. Until then, the bounce is not decisive.
XRP/BTC 4-Hour Chart
The XRP/BTC pair is telling a similar story. After repeatedly holding the 2,000 sats area, XRP has started to recover a bit and is now pressing back above that support zone. Momentum has improved, and the pair no longer looks as weak as it did during the recent dip, though it is still trading under both the 100-day and 200-day moving averages.
For the BTC pair, the first task is to turn this rebound into follow-through. A push through the 2,100 to 2,200 sats area would be a good start, and lead to a breakout above both key moving averages. But the real test remains higher at 2,400 to 2,500 sats, where layered resistance and the broader downtrend line converge. If XRP gets rejected before that, the market likely falls back into the same sideways-to-bearish range. However, if it breaks through, the tone shifts from simple stabilization to genuine recovery.

Binance Free $600 (CryptoPotato Exclusive): Use this link to register a new account and receive $600 exclusive welcome offer on Binance (full details).
LIMITED OFFER for CryptoPotato readers at Bybit: Use this link to register and open a $500 FREE position on any coin!
Disclaimer: Information found on CryptoPotato is those of writers quoted. It does not represent the opinions of CryptoPotato on whether to buy, sell, or hold any investments. You are advised to conduct your own research before making any investment decisions. Use provided information at your own risk. See Disclaimer for more information.

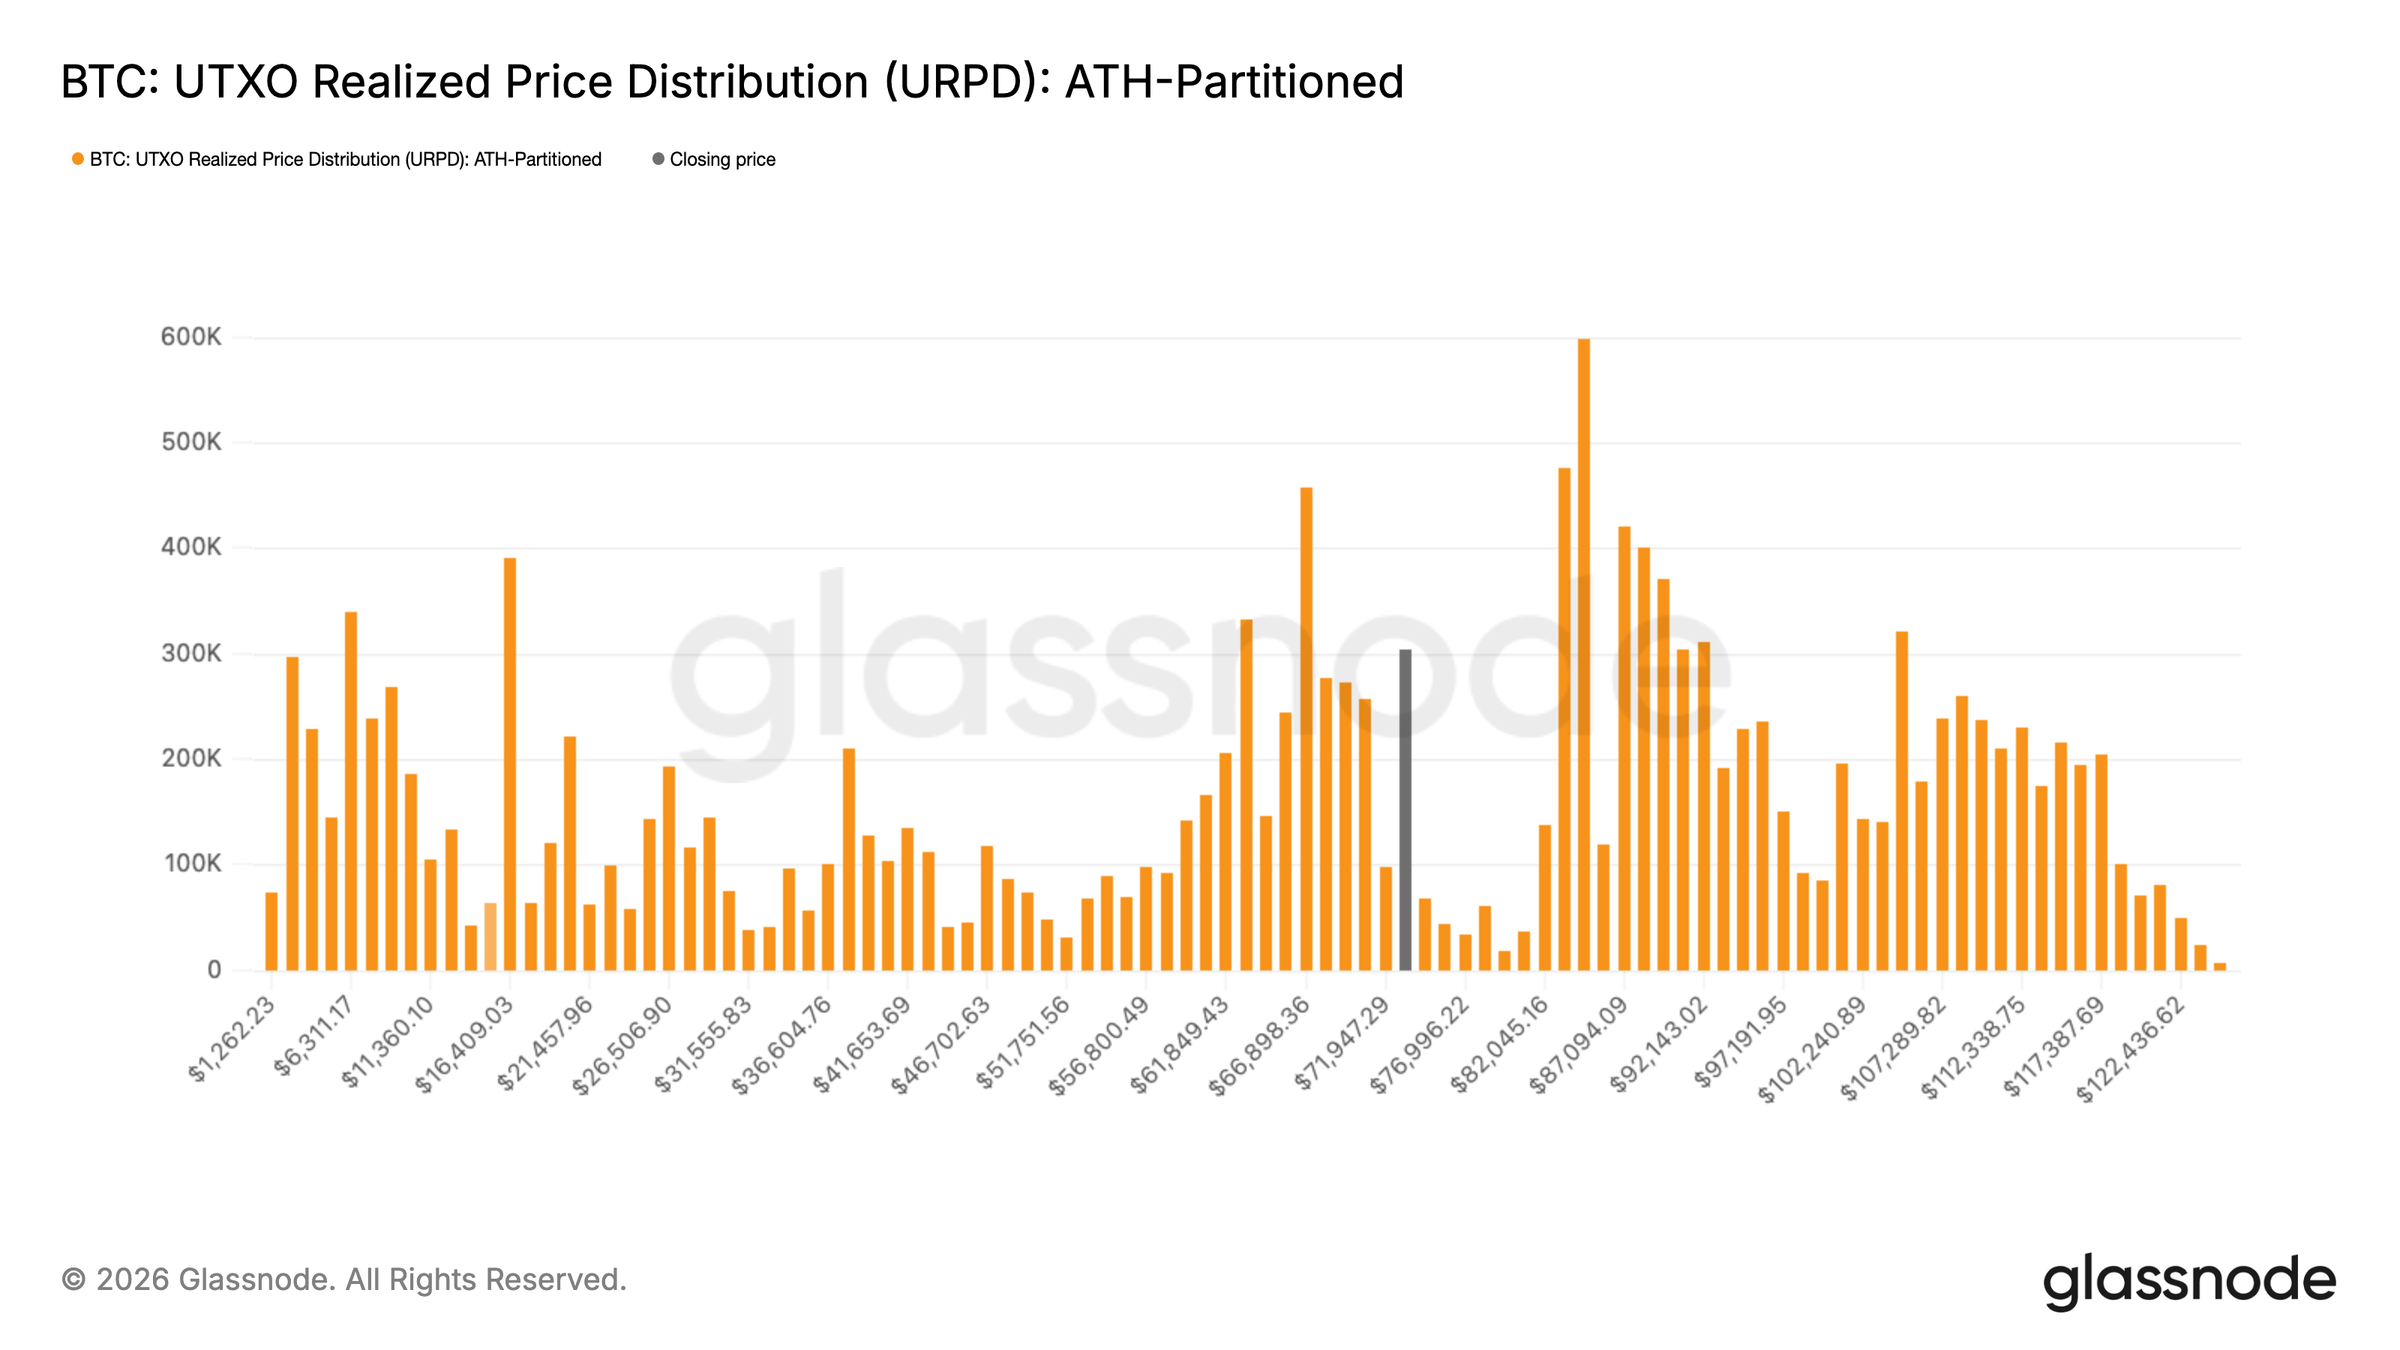
Bitcoin’s (BTC) rally to $76,000 revived market optimism for investors, but onchain data suggested that the move may still be part of an early-stage recovery defined by frequent periods of price volatility.
According to Glassnode, BTC price has entered a relatively “open” zone between $72,000 and $82,000, where there’s less resistance.
This range is particularly defined by the UTXO Realized Price Distribution (URPD), which highlights where the investors accumulated their coins. This means BTC may move more freely in the short term within this range, if the momentum holds.

Glassnode explained that a more reliable signal lies in whether the broader market is returning to profitability. The share of Bitcoin supply in profit has climbed back to around 60%, which is a level often seen during the early stages of a recovery. Glassnode added,
“A sustained push above 75% would carry considerably more weight as a confirmation of early bull market conditions, whereas continued rejection near current levels would reinforce the bear market recovery narrative.”

Another key factor is how the market handles the current sell pressure. As Bitcoin climbed above $74,000, the short-term holders began realizing profits at an accelerated pace, with realized gains reaching $18.4 million per hour.
This mirrors behavior seen in earlier failed rallies, where investors sold into strength, capping the upside momentum. If Bitcoin can absorb this wave of profit-taking and maintain support above $70,000, it increases the chance for a rally into the $78,000 to $82,000 range.
Related: Bitcoin tests old 2021 top as gold falls to six-week lows under $4.7K
Trend indicator remains in “bear” market territory
From a technical standpoint, the broader trend structure still leans toward caution. On the higher time frames (daily and weekly charts), Bitcoin continues to trade within a pattern of lower highs and lower lows, indicating that a bullish market structure has not been established.
For a bullish shift, BTC needs to break above its previous lower high near $97,855 and sustain the price action above that level.

This region also aligns with the Fibonacci “golden zone” between the 0.5 and 0.618 retracement levels, an area tracked by traders as a key decision point during trend reversals.
A clean breakout above this range, followed by consolidation, will suggest a strong demand and increase the likelihood of a long-term rally.
CryptoQuant’s cycle indicator echoes this cautious outlook. The Bitcoin Bull-Bear Cycle indicator remains in bearish territory, improving to -0.72 from -1 earlier this month but still far from confirming a trend reversal.

For a full bull market confirmation, the indicator needs to move above 1, reflecting sustained positive momentum.
An early signal to watch is a move above the bull-bear 365-day moving average, currently at -0.23. This level acts as a long-term trend filter, smoothing out short-term volatility and highlighting whether the market conditions are shifting to bullish or bearish on the higher time frame.
Related: Bitcoin ETF inflow streak snaps with $164M outflows amid BTC dip
This article does not contain investment advice or recommendations. Every investment and trading move involves risk, and readers should conduct their own research when making a decision. While we strive to provide accurate and timely information, Cointelegraph does not guarantee the accuracy, completeness, or reliability of any information in this article. This article may contain forward-looking statements that are subject to risks and uncertainties. Cointelegraph will not be liable for any loss or damage arising from your reliance on this information.

Security researchers are sounding alarms over a Coinbase Commerce page that appeared to prompt users to enter wallet recovery phrases. The episode has reignited concerns that a flow leveraging seed phrases could normalize behavior routinely exploited in phishing attempts, especially when associated with a trusted platform.
The contention began after Yu Xian, the founder of blockchain security firm SlowMist and a prominent figure in security circles, drew attention to the page on X. He questioned why a Coinbase-hosted page would solicit plaintext mnemonic phrases for asset recovery, describing the practice as an unconscionable security lapse.
Coinbase has not publicly explained the page’s origin, beyond saying it is reviewing the matter. The company told Cointelegraph it is looking into the issue but did not offer further information at publication. Yu Xian did not respond by press time, and Cointelegraph has not received a comment from him since initial outreach.
In the crypto community, seed phrases are considered the keys to a self-custody wallet. Users who share them risk handing control to attackers, as the phrases grant full access to assets stored in compatible wallets. The guidance remains stark: never disclose seed phrases to third parties, customer support, or untrusted websites.
Coinbase referenced the subdomain as a commerce “withdrawal tool”
Members of the crypto sleuthing community, including ZachXBT, highlighted that the page was referenced in Coinbase’s public Help documentation surrounding its Commerce product. ZachXBT noted that the guide appeared to describe a method for users to recover funds by importing seed phrases into compatible wallets such as Coinbase Wallet or MetaMask, pointing to a withdrawal tool hosted on the same subdomain that has drawn scrutiny.
The narrative was reinforced by statements in Coinbase’s own Help materials, which describe self-custodial wallets—meaning Coinbase does not have access to seed phrases and cannot recover funds if they are lost. The documentation has since sparked questions about how such guidance aligns with the observed page prompting seed phrase input.
“So basically Coinbase has an official page live threat actors can use to target Coinbase users via seed phrase social engineering if they wanted?”
That line, shared by ZachXBT on X, underscores the potential for a phishing vector that leverages a perceived official pathway to seed Phrase recovery, should the page prove legitimate or be misconfigured. The incident sits at the intersection of user education, platform trust, and the evolving complexity of self-custody workflows.
Why this matters for users and builders
Seed phrases are the linchpin of self-custody security. A page that casually requests such credentials, even within an official-sounding context, runs counter to best practices widely taught by wallet providers and security researchers. For users, it raises the stakes of social engineering campaigns that blend legitimate branding with deceptive prompts. For developers and exchanges, the episode highlights a delicate balance: offering recovery and interoperability features without exposing users to new attack surfaces.
Self-custodial wallets give users direct control over private keys and recovery phrases, but with that control comes responsibility. If a trusted portal inadvertently or inadvertently appears to solicit mnemonic data, users may be tempted to comply, especially during times of asset risk or loss. The incident thus taps into broader debates about how to design recovery flows that are both user-friendly and resistant to manipulation.
Coinbase’s response and the path forward
Coinbase has acknowledged the matter and said it is investigating, though details have not been provided publicly. The company has previously advised users against pasting seed phrases into any website and has emphasized that its Commerce wallets are self-custodial, meaning Coinbase cannot access seed phrases or recover funds if they are lost. The current episode raises questions about whether the page represented an official feature, a misconfiguration, or a security gap in the documentation surrounding Commerce.
Separately, Coinbase has been vocal about warning signs of phishing and social engineering, noting that scammers may impersonate customer support over the phone or online to harvest login details and verification codes. The firm has urged users to stick to official channels on X and Reddit for support. The evolving situation leaves several uncertainties:
- Was the page a technical error, a misconfigured subdomain, or an actual attempt to steer users toward seed-phrase recovery?
- Did the referenced help guide reflect current product flows, or has it been altered or removed in response to the scrutiny?
- What steps will Coinbase take to prevent similar prompts in the future, and will there be updates to Commerce documentation to clarify best practices around seed phrases?
Context from the wider security landscape
Phishing and social engineering remain pervasive risks in crypto, with attackers continually adapting their lures around familiar brands and services. The OpenClaw phishing episode, for instance, illustrated how attackers mix messaging around “free tokens” with authentic-looking interfaces to entice victims. In that climate, any ecosystem feature that touches seed phrases—whether as part of a recovery workflow or a cross-wallet import—demands especially rigorous safeguards and clear user education. Cointelegraph previously covered how security researchers urge vigilance against seed-phrase exposure, underscoring the critical nature of keeping recovery data private and offline whenever possible.
What readers should watch next
The coming days and weeks will likely reveal how Coinbase resolves questions about the Commerce page and its recovery-flow references. Watch for:
- Official statements from Coinbase detailing findings from the investigation and any changes to Commerce documentation or user flows.
- Clarifications on whether the subdomain-driven prompt was operational, experimental, or a misconfiguration tied to the broader Help ecosystem.
- Ongoing guidance from wallet providers and security researchers on safe recovery practices, particularly for self-custody setups tied to exchange-backed services.
As the industry weighs this incident, it reinforces a core principle for users and builders alike: seed phrases remain a highly sensitive asset, and even seemingly legitimate interfaces must be treated with scrutiny. The path forward will hinge on clearer recovery mechanisms that preserve user control without creating new opportunities for social engineering.


MVRV data indicate that ETH is undervalued, and previous occurrences of this range have led to substantial gains across multiple market cycles.
Ethereum witnessed fresh losses on Thursday amidst the broader market pullback. The crypto asset shed almost 5%, pushing the price down toward $2,100.
New data suggest that ETH has entered a historically significant accumulation zone, and past data show strong upside following similar MVRV compression levels.
MVRV Drop
Ethereum has entered what analyst Ali Martinez describes as a generational “buy zone,” according to the latest on-chain data. The MVRV Ratio, a metric that compares market value to the average investor cost basis, has declined into the 0.8 to 1.0 range. This indicates a reset to fair value levels. In previous cases, similar conditions have led to major upward cycles for the asset.
Previous instances of this range were followed by gains of 150%, 5,390%, 130%, 280%, and 250%. The current positioning indicates that Ethereum may be nearing a long-term bottom, as accumulation trends are emerging across the network. Martinez’s tweet read,
“On-chain data suggests Ethereum is approaching a long-term bottom. For those with a 12-24 month horizon, the accumulation window is officially open!”
Crypto trader “EliZ” also observed that recent market conditions offered a clear short-term opportunity, where traders who entered positions at lower levels were able to take profits on altcoins. According to the investor, the market is now entering a critical phase defined by important technical levels.
As long as price holds within the $2,050 to $2,180 range on the daily timeframe, the medium-term uptrend remains intact, and continuation is likely. However, a breakdown below the $2,000 level would invalidate this structure.
In such a scenario, market conditions would change, thereby creating a favorable setup for aggressive short positions. This breakdown could open the door for a major downward move and transition from a bullish continuation phase to a bearish trading environment.
You may also like:
ETH ETFs Bleed
On the institutional front, spot US ETH exchange-traded products faced $55.70 million in outflows on March 18 after five consecutive days of inflows. Fidelity’s FETH faced the brunt of the macroeconomic turmoil and incurred the maximum losses with $37.11 million flowing out of it.
Grayscale’s ETHE followed suit with almost $9 million in outflows. VanEck and Bitwise’s ETHV and ETHW were next with losses of around $4.8 million each.
Binance Free $600 (CryptoPotato Exclusive): Use this link to register a new account and receive $600 exclusive welcome offer on Binance (full details).
LIMITED OFFER for CryptoPotato readers at Bybit: Use this link to register and open a $500 FREE position on any coin!


Iran’s IRGC pounds Gulf energy hubs after Israel’s South Pars attack, torching Qatar’s LNG lifeline, affecting crypto markets, and dragging the global economy toward recession.
Summary
- Iran’s IRGC hits Qatar’s Ras Laffan LNG hub and refineries in Kuwait, Saudi Arabia, and the UAE, forcing major output shutdowns and stoking supply fears.
- Brent crude rips above $110 and European gas jumps over 25% as markets price in lasting damage to Gulf energy capacity and rising global recession risk.
- Trump pivots from threatening to “blow up” South Pars to urging de-escalation as energy infrastructure across the Persian Gulf becomes a primary war target.
The Middle East war escalated sharply on Thursday as Iran’s Islamic Revolutionary Guard Corps (IRGC) launched waves of retaliatory strikes on energy facilities across the Persian Gulf, setting Qatari liquefied natural gas terminals ablaze and targeting oil refineries in Kuwait, Saudi Arabia, and the UAE — sending global energy prices soaring and pushing the region to the brink of a wider economic catastrophe.
The attacks came in direct retaliation for Israeli airstrikes on Iran’s South Pars gas field — the world’s largest natural gas complex, jointly managed with Qatar — which Israel struck with reported U.S. support on Wednesday. The South Pars strike marked a qualitative shift in the conflict, now in its third week, as both sides explicitly began targeting each other’s critical energy infrastructure for the first time.
The consequences were immediate and global. Brent crude surged above $110 per barrel during Thursday’s trading — a rise of more than 50% since the war began on February 28, when it was trading near $70 — briefly touching $116 before partially retreating. European natural gas benchmark TTF prices surged as much as 28–30%, having already doubled over the past month.
The most strategically significant strike hit Qatar’s Ras Laffan terminal, the world’s primary LNG export hub, which normally supplies approximately 20% of global LNG consumption. Qatari authorities confirmed the attack caused “extensive damage,” forcing QatarEnergy to suspend production — a decision that, if sustained beyond two months, would, according to energy analytics firm Wood Mackenzie, “fundamentally change the global gas market outlook.” Global LNG supply has already contracted by nearly 20% since QatarEnergy halted operations earlier this month.
Iran also struck Kuwait’s Mina Al-Ahmadi Refinery — one of the largest in the Middle East — via drone, with the Kuwait Petroleum Corporation confirming a “limited” fire at the facility. A drone struck a Saudi Aramco refinery in Yanbu, a joint venture with ExxonMobil on the Red Sea, with damage still being assessed. In a further escalation, Iran has entirely halted gas exports to Iraq, raising fears of a cascading regional energy crisis.
Tehran issued explicit threats to strike additional Gulf installations, naming Saudi Arabia’s Jubail Petrochemical Complex, the UAE’s Al Hosn Gas Field, and Qatar’s Mesaieed complex as “direct and legitimate targets.” The IRGC warned civilians in neighboring Gulf states to evacuate areas around oil and gas facilities.
JPMorgan responded by cutting its year-end S&P 500 target from 7,500 to 7,200 points, warning that oil prices rising more than 30% historically precede demand contractions and recession. Global equity markets fell, with European stocks declining as energy costs surged.
U.S. President Trump, who had threatened to “massively blow up” South Pars if Iranian attacks on Qatar continued, shifted tone by Thursday, calling for de-escalation of strikes on energy facilities. The war, which shows no signs of abating, has now placed the Persian Gulf’s energy infrastructure — supplying a substantial share of the world’s oil and gas — squarely in the crosshairs.
Crypto markets cracked alongside the energy spike, with Bitcoin sliding back below $70,000 after trading above $73,000 earlier in the week, while Ethereum dropped toward the low‑$2,200s and broader crypto market value retreated from the roughly $2.5 trillion area as traders unwound leverage and rotated into cash and short‑duration TradFi safe havens.
A new Bitcoin-based finance protocol called Hashi has been introduced on the Sui blockchain, with early participation commitments from crypto institutions including BitGo, Bullish and FalconX ahead of its planned launch later this year.
According to an announcement shared with Cointelegraph, Hashi is designed to let Bitcoin holders earn yield on native Bitcoin (BTC) through onchain lending and borrowing, targeting a segment that currently represents a small share of Bitcoin’s overall market.
The protocol, developed primarily by Mysten Labs, the core contributor to the Sui blockchain, will initially focus on BTC-backed lending, allowing users to borrow stablecoins against their holdings while institutions are expected to supply liquidity at launch.
A Sui Foundation spokesperson told Cointelegraph that the protocol is designed to address structural limitations that have held back Bitcoin’s use in decentralized finance, particularly reliance on intermediaries and limited transparency around collateral.
The system introduces onchain verification and programmatic collateral management aimed at making BTC lending more suitable for institutional use. “We are replacing ‘trust me’ workarounds with onchain verification,” the spokesperson said.
Hashi will enable native BTC to be used directly in onchain financial services without relying on wrapped or synthetic assets, bringing transparency and automated collateral management to Bitcoin finance, components that institutions require to use it at scale.
Bitcoin remains largely unused in decentralized finance, with about 0.22% of its supply, or roughly $3.07 billion, currently deployed in decentralized finance (DeFi) protocols, according to the announcement and onchain data from DefiLlama.
The rollout also includes participation commitments from custodians and infrastructure providers such as Ledger and Cubist, along with Sui-based DeFi protocols expected to support lending, custody and collateral management once the platform launches.
Hashi said it will rely on a combination of multi-party computation custody and smart contracts on Sui to manage collateral and facilitate lending, with audits and formal verification planned before launch.
Additional features outlined include insurance coverage for BTC collateral and plans for issuing Bitcoin-backed bonds. The project is currently in development, with a devnet expected soon and a mainnet launch planned for later this year.
Related: Maestro launches mining-backed Bitcoin credit market for institutions
Bitcoin-backed lending rebounds after post-FTX collapse
Bitcoin-backed lending markets shrank sharply following the 2022 collapse of crypto lenders BlockFi and Celsius Network, where rehypothecation and opaque risk management exposed users to significant losses.
The practice of rehypothecation, reusing customer collateral to generate additional loans, amplified systemic risk during that period and contributed to a broader loss of confidence in crypto lending platforms.
In recent years, however, interest in Bitcoin-backed lending has begun to recover as regulators and companies explore models that emphasize transparency, collateral management and reduced counterparty risk.
In June, the US Federal Housing Finance Agency directed Fannie Mae and Freddie Mac to explore whether cryptocurrencies can be counted as borrower reserves in mortgage risk assessments, marking a shift toward recognizing digital assets like Bitcoin without requiring conversion into US dollars.
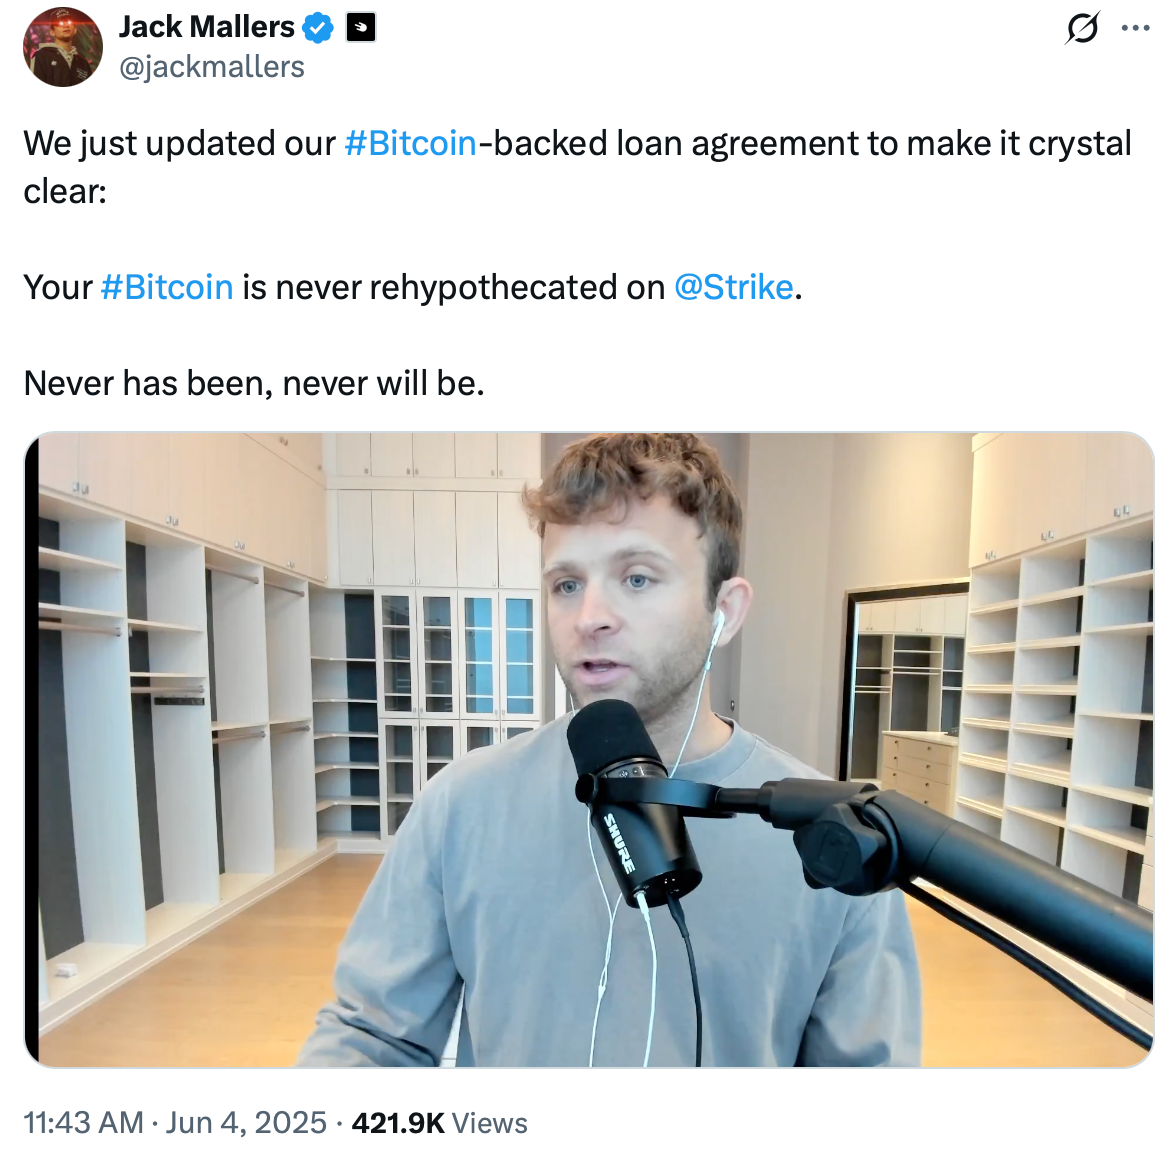
Private companies are also building Bitcoin lending products. In June, Jack Mallers said Strike had updated its Bitcoin-backed loan agreement to state that user collateral is held in segregated wallets and is not rehypothecated, “never has been, never will be,” according to a post on X.

In January, Coinbase reintroduced Bitcoin-backed loans in the United States, allowing eligible users to borrow up to $100,000 in USDC against BTC held on the platform.
Other companies, including Ledn, also offer loans against Bitcoin while emphasizing stricter custody and risk controls.
Magazine: Big Questions: Can Bitcoin save you from the dreaded Cantillon Effect?
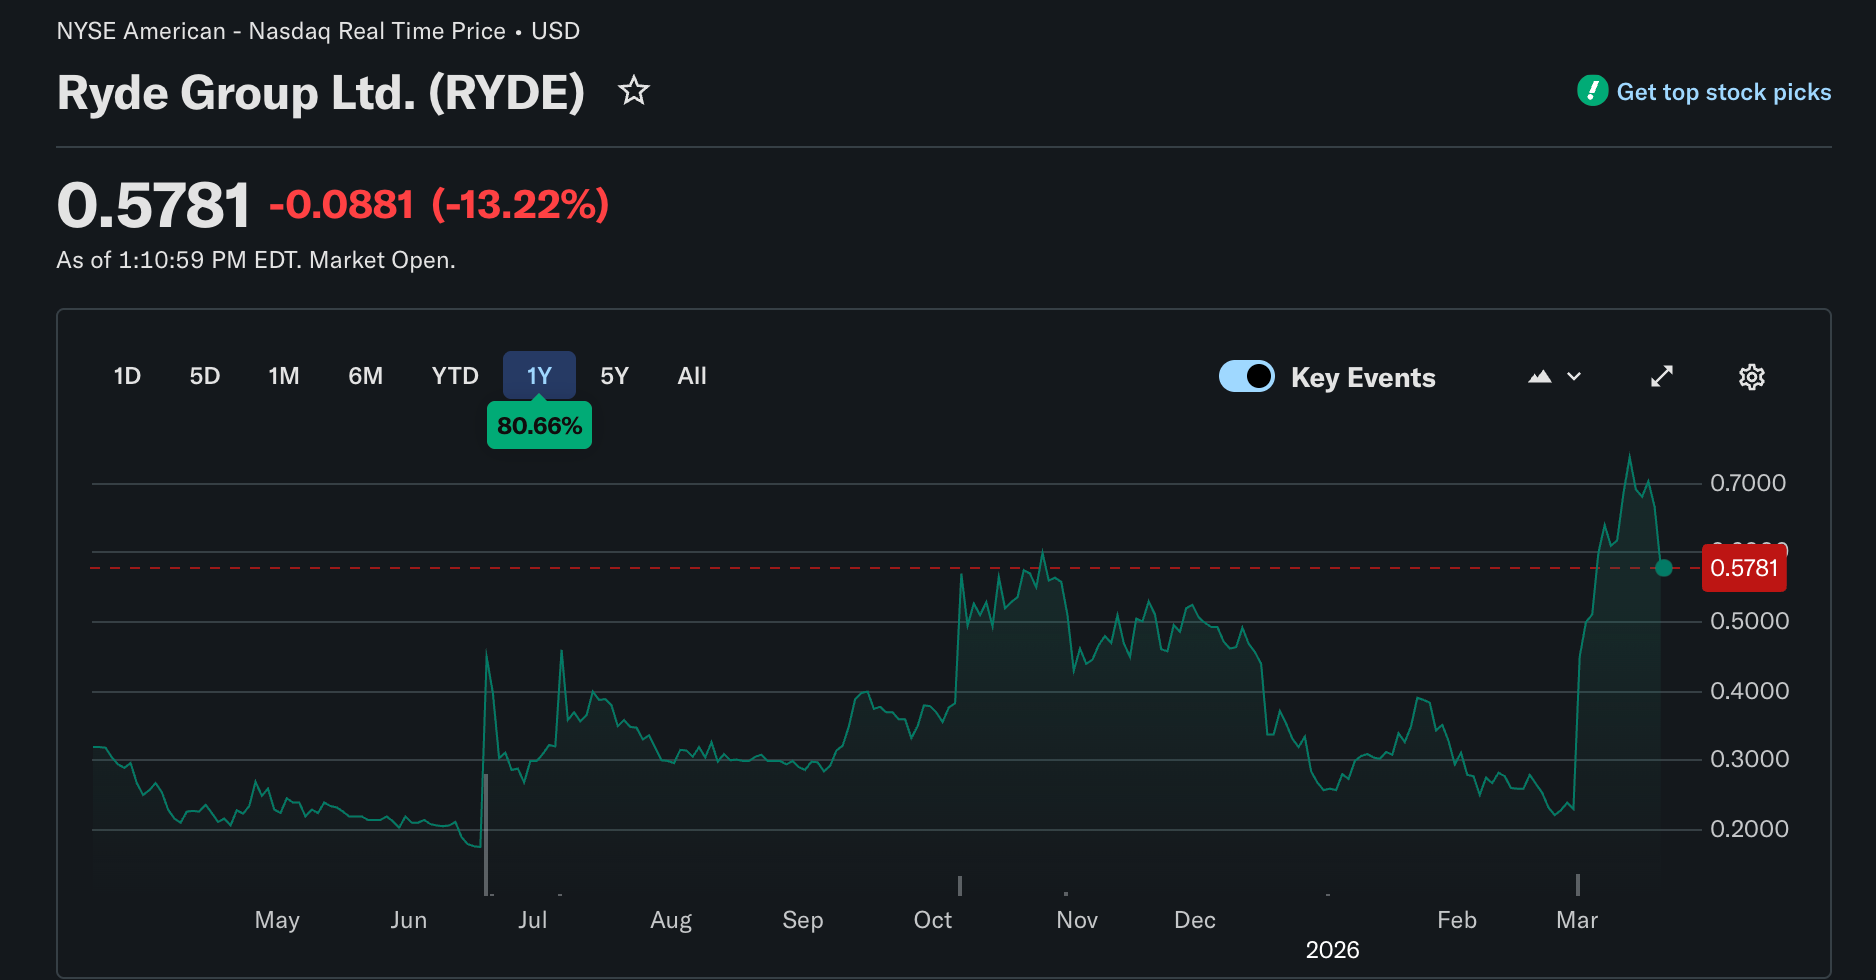
Ryde Group, a Singapore-based ride-sharing and carpool platform, similar to Uber or Lyft, said Wednesday that it has adopted a crypto treasury strategy for its corporate reserve.
The company said it will invest a portion of its corporate reserves into Bitcoin (BTC), Ether (ETH), and Sol (SOL), with specific allocations and time of purchase to be determined by a governance team at Ryde, according to its announcement.
Ryde cited the “evolving macroeconomic environment” as the reason for adopting a crypto treasury, and said that the option to invest portions of its treasury in digital assets gives the company more flexibility in how it manages its treasury operations.
Ryde’s crypto assets will be held with a third-party custodian, and the company has established an investment committee responsible for portfolio management and a separate risk management committee responsible for investment safety and regulatory compliance.
The company’s NYSE American-traded shares were down more than 13% in early afternoon trading on Thursday, trimming their year-to-date increase of more than 122%, according to Yahoo Finance.

Cointelegraph reached out to Ryde about its crypto treasury, but did not receive a response by the time of publication.
The company started accepting BTC as an in-app payment method for users in 2020, and later expanded support to include some altcoins. However, it is unclear if Ryde still accepts crypto as an in-app payment method.
Users were able to convert accepted cryptocurrencies to Ryde tokens via the RydePay wallet to pay for services on the platform.
Ryde’s decision to adopt a crypto treasury strategy comes amid a challenging business environment for digital asset treasury companies, squeezed by falling crypto and share prices.
Related: XRP treasury Evernorth files with SEC to list shares on Nasdaq
Ryde bucks the trend by entering the treasury space as the industry faces challenges
The digital asset treasury sector experienced a multiple net asset value (mNAV) collapse in September 2025, which meant many crypto treasury companies started trading below the value of their crypto holdings.
In February 2026, monthly inflows into crypto treasury companies slowed to their lowest levels since October 2024, dropping to just $555 million for the month.

During the same month, the board of directors for GD Culture Group (GDC), a publicly listed holding company focused on digital marketing and AI, authorized the company to sell portions of its Bitcoin reserve to finance a share repurchase program.
At the same time, Ether treasury company BitMine Immersion Technologies faces more than $7.5 billion in paper losses at the time of this writing, as the price of Ether sits well below BitMine’s average acquisition price of about $3,753 according to BitMine Tracker.
Magazine: How Ethereum treasury companies could spark ‘DeFi Summer 2.0’


The league also signed an information-sharing agreement with the CFTC, the first such deal between the derivatives regulator and a professional sports body.
Major League Baseball (MLB) on Thursday named Polymarket its official prediction market exchange partner and signed a memorandum of understanding (MOU) with the Commodity Futures Trading Commission, marking the regulator’s first such agreement with a major U.S. sports league.
Under the partnership, Polymarket and its brokers will receive exclusive access to MLB marks and logos, official league data and brand exposure across the league’s digital ecosystem and live events.
The deal centers on an integrity framework that restricts markets deemed to pose manipulation risk, including contracts on individual pitches, manager decisions, and umpire performance. Polymarket will also integrate those controls into its U.S. Rulebook so that all of its brokers are held to the same standards.
The MOU formalizes a commitment to share information confidentially, with designated representatives meeting regularly to discuss threats to the integrity of MLB games and the broader prediction market landscape. The agreement comes a year after MLB wrote to the CFTC calling for stronger integrity protections in the space.
While Polymarket holds exclusive rights, MLB said it intends to maintain integrity relationships with all other prediction market exchanges offering baseball contracts, requiring each to integrate protections into their own rulebooks.
MLB joins a growing roster of leagues embracing prediction markets. The National Hockey League struck multiyear deals with both Polymarket and Kalshi last October, while Major League Soccer announced its own Polymarket partnership in January.
Prediction Markets Go Mainstream
The partnership caps a remarkable ascent for Polymarket, which runs outcome tokens as ERC-1155s on Polygon and has evolved from a niche DeFi protocol into a mainstream news source.
As The Defiant reported in December, onchain prediction market monthly volumes have grown 130-fold since early 2024, reaching more than $13 billion, making the sector one of the fastest-growing in finance.
Polymarket received CFTC approval to operate in the U.S. in November 2025, and its return followed a $2 billion strategic investment from Intercontinental Exchange, the owner of the New York Stock Exchange. The platform has since rolled out its U.S. app, beginning with sports markets.
The MLB deal also arrives against a complex regulatory backdrop. Just last week, the CFTC issued an advance notice of proposed rulemaking signaling its intent to build a comprehensive framework for prediction markets.
At the same time, state regulators continue to push back. Arizona’s attorney general filed criminal charges against rival platform Kalshi just two days before the MLB announcement, alleging it operates an illegal gambling business in the state. The tug-of-war between federal and state oversight remains unresolved, as the CFTC has argued that prediction market contracts should be classified as derivatives under federal oversight, while some state gaming regulators insist they constitute gambling subject to state-level regulation.

Opera, the Nasdaq-listed web browser maker, is proposing a move to be compensated in CELO tokens rather than cash as it deepens its ties to the Celo ecosystem. The company has put forward a plan to restructure its commercial agreement, shifting from quarterly USD payments to an allocation of 160 million CELO tokens, pending on-chain governance approval by Celo’s community.
If the proposal passes, Opera would closely align its financial interests with the performance of the Celo network and emerge as one of the largest institutional holders of CELO. Celo is a mobile-first payments platform originally built to streamline stablecoin transfers in emerging markets and, last year, migrated from a standalone layer-1 to an Ethereum layer-2 network, a shift that broadens its compatibility with existing DeFi infrastructure.
Opera and Celo have together advanced a payments-focused collaboration since 2021, when Opera integrated Celo-native stablecoins into its built-in wallet. The partnership has since intensified around Opera’s MiniPay wallet, a self-custodial application built on Celo that Opera says serves 14 million users and emphasizes stablecoin-based payments in emerging markets. In November, MiniPay began connecting with Latin American real-time payment rails such as Brazil’s PIX and Mercado Pago, expanding the potential reach of Celo-powered payments.
Beyond the corporate tie-up, the proposal sits within a broader pattern of technology firms aligning with blockchain-native tokens as strategic financial signals. While Opera moves toward token-based compensation, other industry players maintain token exposures through core infrastructure products, such as ConsenSys with ETH via MetaMask and Blockstream’s BTC-focused offerings. The CELO token itself has faced the same market headwinds as many crypto assets, with prices below earlier peaks despite positive developments around Celo’s ecosystem evolution.
Key takeaways
- Opera proposes to replace US dollar quarterly payments with a grant of 160 million CELO tokens, subject to on-chain governance approval by the Celo community.
- If approved, Opera would become one of the largest institutional holders of CELO, tying its revenues more directly to the network’s performance.
- The move builds on Opera’s long-running collaboration with Celo, highlighted by the MiniPay wallet, which has grown to 14 million users and expanded to real-time payments links with PIX and Mercado Pago in Latin America.
- Opera’s financial momentum accompanies the token proposal: Q4 2025 revenue of $177.2 million (up 22% YoY); full-year revenue of $614.8 million with adjusted earnings of $142.5 million; and a $300 million share repurchase program.
Opera’s CELO plan in context of its business momentum
Opera’s decision to reframe its compensation model comes as the company reports stronger-than-guided results across its core browser business and newer product segments. In February, Opera disclosed fourth-quarter revenue of $177.2 million, driven by continued user growth and monetization gains, with adjusted earnings of $41.9 million for the quarter. For the full year, the company tallied $614.8 million in revenue and $142.5 million in adjusted earnings, underscoring a stable earnings trajectory that supports a significant capital-return program—the$300 million share repurchase announced alongside the results. Opera’s publicly traded shares have benefited from the upbeat results, rising more than 21% over the past month and trading near $15 per share, implying a market capitalization around $1.3 billion.
The CELO compensation proposal reflects a broader strategic tilt: aligning a commercial partner’s incentives with the performance and governance of a blockchain ecosystem it supports. If the CELO allocation goes forward, Opera’s operational decisions—from wallet integrations to business development—could be increasingly influenced by CELO’s network health and governance outcomes. That alignment could be beneficial if Celo’s ecosystem expands usage, stabilizes its payments rails, and attracts more developers and partners to its mobile-first frictionless payment vision.
What this means for investors and the ecosystem
For investors, the proposal signals a nuanced approach to corporate blockchain involvement—not merely as a passive adopter but as a token-bearing stakeholder with a meaningful stake in the network’s long-term success. The potential shift raises questions about governance risk, token price dynamics, and how such token allocations translate into real-world value creation for shareholders. If the governance process allows the 160 million CELO allocation, Opera could become a cornerstone user and validator of Celo’s on-chain economy, potentially driving greater liquidity and utility for CELO as a payments-focused asset.
From a market perspective, CELO’s price action has historically reflected the tension between ecosystem development and broader crypto market cycles. While the token has not yet reclaimed its earlier highs, supporters point to ongoing ecosystem improvements and partnerships as catalysts for longer-term value. The governance-driven nature of CELO’s distribution means outcomes will hinge not only on Opera’s business performance but also on community sentiment and decision-making within Celo’s on-chain processes.
Beyond Opera, the broader trend of companies maintaining token exposures through infrastructure work or ecosystem participation underscores a shift in how traditional tech and fintech players balance risk, governance, and potential upside. The example of ConsenSys, which holds ETH through its core infrastructure work, and Blockstream’s BTC-focused initiatives illustrate a wider pattern of firms embedding themselves more deeply in crypto networks, sometimes with token-based incentives tied to platform success.
As Opera’s governance process advances, observers will watch for milestones such as the timing of CELO token allocations, any conditions embedded in the governance proposal, and the practical implications for Opera’s cost structure and earnings if token-based compensation proves additive to revenue growth rather than volatile headwinds. The company’s ongoing adoption of MiniPay and its expansion into real-time payment rails abroad will also be key indicators of CELO’s practical utility in everyday consumer payments, which could, in turn, affect the token’s attractiveness to investors.
Opera’s board and management have signaled confidence in the long-term value of the Celo ecosystem. For readers watching the crypto payments landscape, the unfolding CELO-Opera dynamic will be a useful case study in how large, publicly traded tech firms navigate token-based compensation, governance risk, and the practical realities of integrating blockchain payments into mainstream consumer products.
Readers should keep an eye on governance updates from Celo’s community and any formal communications from Opera outlining the timeline for CELO allocations. The outcome will not only shape Opera’s financial and strategic posture but could also subtly recalibrate expectations around corporate token incentives in the broader crypto ecosystem.
Opera’s latest results and strategic moves suggest a broader narrative: as crypto-native collaboration moves from pilot projects to institutional-level partnerships, the lines between traditional fintech and decentralized networks blur further. The next few quarters will reveal whether CELO-based compensation translates into tangible user growth, real-world adoption of MiniPay, and a more resilient revenue model for Opera in a competitive browser market.
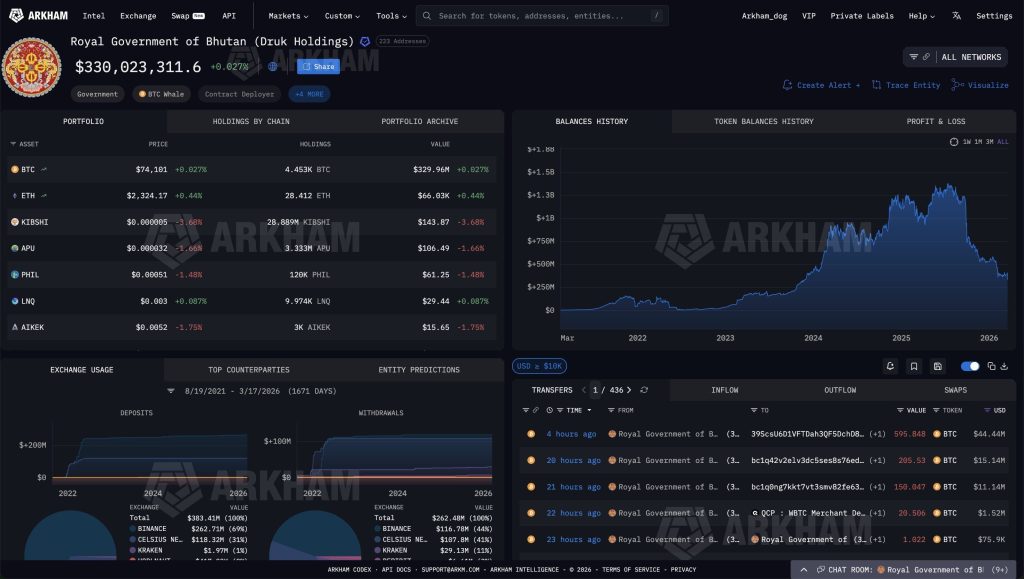
Bhutan just moved $72.3 million worth of Bitcoin to Binance. 929 BTC sent Tuesday morning while Bitcoin price consolidated near $71,000.
Most sovereign sell-offs hit the order book hard. This one barely registered. Price did not move.
That silence is the entire story. Bhutan is not just a Bitcoin miner anymore. It is actively managing an institutional-grade portfolio. And the market absorbed nearly $73 million in supply without flinching.
Key Takeaways:
- Bhutan transferred 929 BTC ($72.3M) to Binance deposit wallets.
- Price impact was negligible due to probable OTC execution.
- DHI still holds approximately 12,574 BTC in reserves.
How Do You Sell $72M in Bitcoin Without Crashing the Price?
Dumping 929 BTC on a standard spot order book wipes out buy support instantly. Price crashes. That is what unsophisticated sellers do.
Bhutan did not do that.

By routing through Binance, Druk Holding and Investments almost certainly used an OTC desk. Large block trades get matched with institutional buyers privately. The transaction settles off the public order book entirely. Market makers absorb the risk themselves and quote a fixed price for the block.
The coins change hands. The seller gets stablecoins. The retail chart never sees a red candle.
This is textbook institutional execution. And it signals that sovereign crypto entities are operating at a completely different level than they were even two years ago.
Did Bhutan’s Sale Move Bitcoin Price? Here Is What the Data Shows
Bitcoin did not move during the transfer window. Zero unusual sell pressure on Coinbase orderbooks. The liquidity was sourced externally or netted internally by Binance.
Arkham Intelligence confirmed funds cleared directly from DHI wallets into Binance hot wallets. Bhutan’s total BTC outflows have exceeded $114 million in recent weeks.

This is hedge fund level execution. Active market makers managing yield and liquidity instead of panic dumping into thin order books.
The market has absorbed it cleanly. But Bhutan still holds roughly $886 million in Bitcoin. If that starts moving with the same frequency, the real stress test begins.
Discover: The best new crypto in the world
The post Masterclass in OTC Liquidation: How Bhutan Moved $72M Bitcoin Without Moving the Price appeared first on Cryptonews.
Bitcoin (BTC) price support could “fail” by the weekly close in a major blow to Bitcoin bulls, analysis warns.
Key points:
-
BTC price downside versus local highs at $76,000 nears 10%.
-
Bitcoin brings its 200-week trend line back into focus, but little hope remains that it will rescue price.
-
A trader warns of “months” of ranging at current levels.
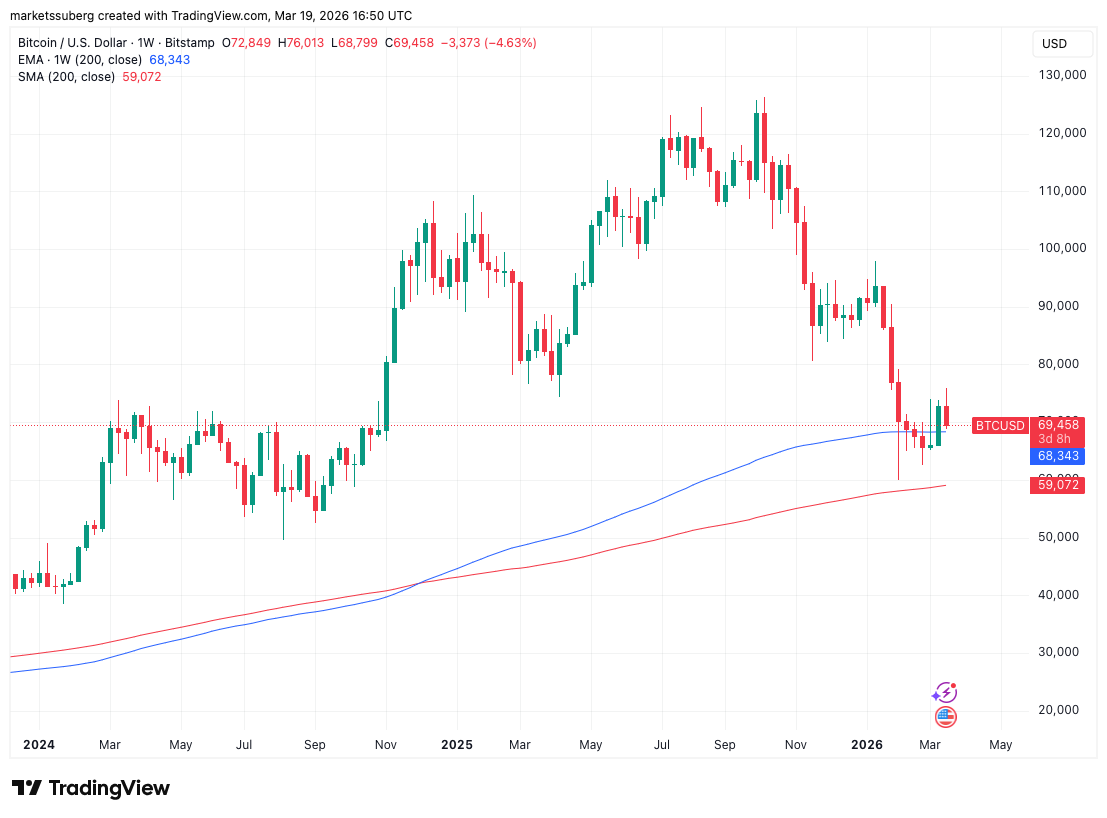
200-week BTC price trend line “unreliable”
In his latest X update on Thursday, crypto trader and analyst Rekt Capital brought a long-term BTC price trend line back into focus.
The 200-week exponential moving average (EMA) for BTC/USD, currently at around $68,300, is coming in for its first retest in over a week.
“Bitcoin is pulling back in towards the 200-week EMA (black) to check if it can successfully turn the EMA into new support after having broken it as resistance last week,” he summarized.
The 200-week EMA has long been on the radar for traders. Along with its equivalent simple moving average (SMA) near $59,000, it forms a key support band for price as Bitcoin’s latest bear market takes shape.

BTC/USD has crisscrossed the 200-week EMA multiple times in 2026, but its significance remains.
“A successful retest of the EMA would fully confirm the breakout beyond it to enable future trend continuation to the upside and further build on this Macro Relief Rally,” Rekt Capital continued.
“However, it is important to consider whether Bitcoin could fail this upcoming retest into new support, in the same way price failed to bearish retest the 200 EMA into new resistance before.”

The post describes the EMA as “unreliable” thanks to price crossing both above and below it with ease.
“A Weekly Close below the 200 EMA would mean that price failed its upcoming retest to in turn strengthen the case for the EMA acting as unreliable support,” Rekt Capital concluded.
Bitcoin trader: Current range could last “months”
The current low-time frame BTC price trading range contains multiple important lines in the sand.
Related: $58K BTC price still in play? Five things to know in Bitcoin this week
Bitcoin’s old all-time high from 2021 is at $69,500, while its 2025 lows currently mark the start of overhead resistance at $74,500.
So far, bulls have been unable to clear sellers and continue past $76,000, and many market participants expect new macro lows to come as a result as price retreats by nearly 10%.
Updating X followers on his thoughts, trader Roman, long entertaining a trip to $50,000 or lower, said that price may form a frustrating sideways range first.
“It’s very possible we range here for months,” he warned.
$BTC 1D
Always amazed that price going up a few % can drive people crazy.
Anyways, back into our range, rejected resistance once again. My only issue with thinking this WONT breakdown yet is volume is now low on the sell side.
It’s very possible we range here for months. https://t.co/XqaMz3cezg pic.twitter.com/oncvXxVp4i
— Roman (@Roman_Trading) March 19, 2026
This article does not contain investment advice or recommendations. Every investment and trading move involves risk, and readers should conduct their own research when making a decision. While we strive to provide accurate and timely information, Cointelegraph does not guarantee the accuracy, completeness, or reliability of any information in this article. This article may contain forward-looking statements that are subject to risks and uncertainties. Cointelegraph will not be liable for any loss or damage arising from your reliance on this information.

Crypto Trading For Beginners Pt.2 | Crypto Trading LIVE DEMO | Bitcoin Trading

Best running watches 2026: From Huawei and Apple to Garmin, we’ve found the top picks for every route

TSA union warns airport security could soon ‘get worse’ amid partial shutdown

Smart energy pays enters the US market, targeting scalable financial infrastructure

Why Israel is blocking foreign journalists from entering

Bitcoin: We’re Entering The Most Dangerous Phase
Crypto Trading For Beginners Pt.2 | Crypto Trading LIVE DEMO | Bitcoin Trading

What is the single most effective piece of financial advice you’ve ever received?

Crypto Trading For Beginners | Bitcoin Trading for Beginners | Crypto Trading kaise kare | App India
-
 Crypto World6 days ago
HYPE Token Enters Net Deflation as HyperCore Buybacks Outpace Staking Rewards
-

 Tech4 days ago
Your Legally Registered ‘Motorcycle’ Might Not Count Under Proposed US Law
-

 Fashion6 days ago
Weekend Open Thread: Addict Lip Glow
-
 Tech2 days ago
Are Split Spacebars the Next Big Gaming Keyboard Trend?
-
Sports5 days ago
Why Duke and Michigan Are Dead Even Entering Selection Sunday
-

 Business4 days ago
Search for Savannah Guthrie’s Mother Enters Seventh Week with No Arrests
-

 Business5 days ago
US Airports Launch Donation Drives for Unpaid TSA Workers as Partial Government Shutdown Enters Fifth Week
-
Crypto World5 days ago
Coinbase and Bybit in Investment Talks: Could Bybit Finally Enter the US Crypto Market?
-

 Business3 days ago
Australian shares drop as Iran war enters third week
-

 Business5 days ago
Country star Brantley Gilbert enters growing non-alcoholic beer market
-

 Crypto World3 days ago
Crypto Lender BlockFills Enters Chapter 11 with Up to $500M in Liabilities
-

 Sports6 days ago
College Basketball Best Bets: Conference Tournament Semifinal Picks
-

 Politics1 day ago
The House | The new register to protect children from their abusers shows Parliament at its best
-

 Business7 days ago
Trump demands Powell cut rates as Iran conflict raises energy prices
-

 Fashion3 days ago
25 Celebrities with Curly Hair That Are Naturally Beautiful
-

 News Videos1 day ago
RBA board divided on rate cut, unusually buoyant share market | Finance Report | ABC NEWS
-

 Crypto World7 days ago
Senate Votes to Include CBDC Ban in Bipartisan Housing Bill
-

 NewsBeat7 days ago
Deane Road crash near Bolton colleges and university
-

 Crypto World1 day ago
Canada’s FINTRAC revokes registrations of 23 crypto MSBs in AML crackdown
-

 News Videos7 days ago
Tom Lee: The 100x Opportunity EVEN Bigger Than Bitcoin (New Ethereum Prediction 2026)


You must be logged in to post a comment Login