
Crypto World
The Oil Signal That Preceded Major Market Crashes Since 1987 Is Flashing Again
A key oil market metric that has preceded major market collapses since 1987 is closing in on its danger zone.
The crude’s 12-month rate of change (ROC) is now sitting at 91%. Analysts suggest that each time this metric breached 100%, a market crash followed.
Five Crashes, One Oil Playbook
Analyst and trader Jack Prandelli noted that the pattern spans nearly four decades. In 1987, 1990, the dot-com bust, the 2008 financial crisis, and the 2022 bear market, oil’s 12-month ROC crossed the 100% line.
Follow us on X to get the latest news as it happens
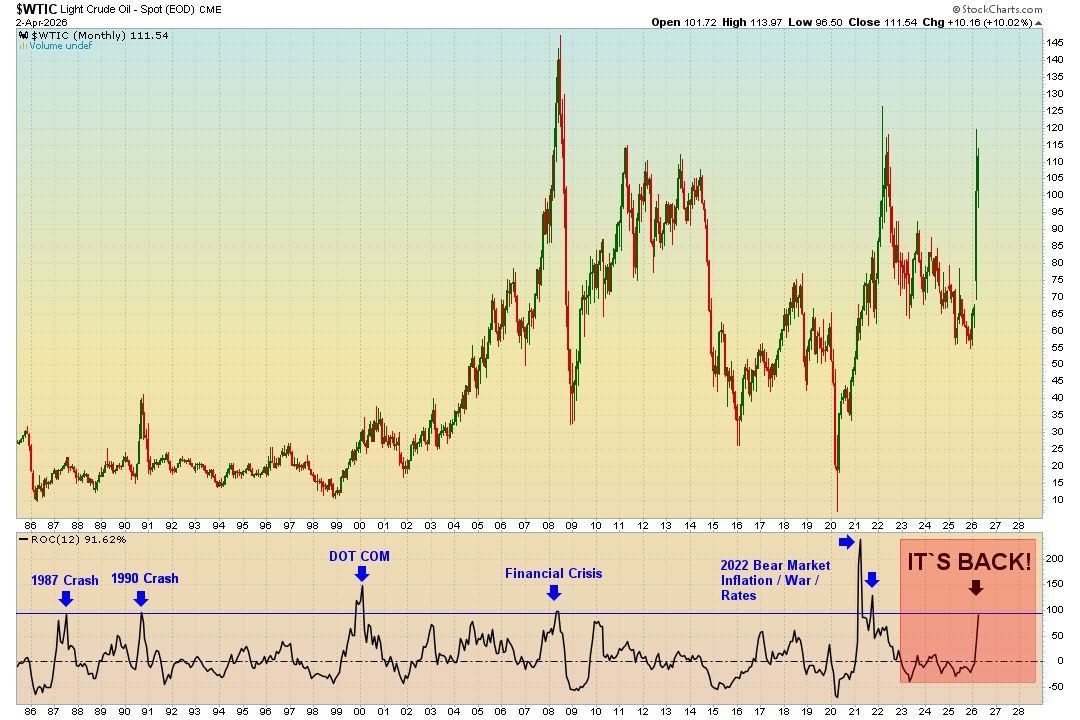
The current 91% reading leaves a narrow 9-point buffer, one that may be quickly erased as supply shocks build. Oil prices have surged since the US-Israeli strikes on Iran began on February 28, rattling energy markets and fueling recession fears.
“When oil moves this fast, economies break. Will this time be different? History says no,” Prandelli remarked.
Nick Colas, co-founder of DataTrek Research, previously noted that when oil prices double within a 12-month window, it may be a warning sign that a recession could follow.
“The rule of thumb I learned from auto industry economics in the 1990s is that if oil prices go up 100% in a one-year period, expect a recession,” he said.
Meanwhile, the supply disruption that could push oil past that threshold may already be underway. Tanker traffic through the Strait of Hormuz, which carried roughly 20% of global oil supply before the conflict, has stalled.
US President Trump has issued a fresh ultimatum. He threatened strikes on Iran’s infrastructure if the strait is not reopened by Tuesday. Iranian officials, however, say the waterway will remain closed until war reparations are addressed.
On Monday, Brent crude climbed above $111 per barrel, up 1.9%. West Texas Intermediate hovered near $112 in Asian trading hours. Amid the surging prices, the question may no longer be whether the pattern holds. It is whether the trigger gets pulled.
Subscribe to our YouTube channel to watch leaders and journalists provide expert insights
The post The Oil Signal That Preceded Major Market Crashes Since 1987 Is Flashing Again appeared first on BeInCrypto.


Key Takeaways
- XRP currently trades in the $1.30–$1.33 range, marking a decline exceeding 60% from its July 2025 all-time high of $3.65
- Total addresses on the XRP Ledger have surged to a new milestone of 8.1 million
- Wallets holding over 1 million XRP tokens are increasing for the first time since September 2025
- Critical price resistance level stands at $1.35, with a breakout potentially driving momentum toward $1.40
- The U.S. Senate is expected to vote on the CLARITY Act in April 2026, which could serve as a significant market catalyst
As of early April 2026, XRP maintains a trading range between $1.30 and $1.33, reflecting a sustained downturn from its peak valuation of $3.65 reached in July 2025. This decline translates to a value reduction exceeding 60% across approximately nine months of trading.
While the token’s price has experienced significant contraction, blockchain metrics from CryptoQuant reveal that the XRP Ledger (XRPL) has achieved a new benchmark with 8,189,798 total addresses. This figure represents a quarterly growth rate of 3.39% during the first three months of 2026.
A notable shift in holder behavior has emerged: wallets containing 1 million or more XRP tokens have started increasing for the first time since September 2025. Market observers interpret this trend as evidence that major stakeholders are actively accumulating during the price weakness.
Despite a softening of the $XRP price that began in July 2025 (shown in black), wallets continue to climb (shown in blue).
👉8.1M #XRP Ledger wallets as of April 4, 2026
Source: CryptoQuant pic.twitter.com/vSpOd94jg7— 🌸Eri ~ Carpe Diem (@sentosumosaba) April 5, 2026
Additional network developments include the expansion of automated market maker pools on the XRPL to approximately 28,000. The ecosystem has also broadened its reach through strategic collaborations, including a notable integration with Mastercard’s payment infrastructure.
Technical analyst ChartNerd (@ChartNerdTA) published commentary on X earlier this week, identifying XRP’s movement within a descending channel pattern characterized by progressively lower peaks and troughs. The analyst highlighted that the Relative Strength Index remains beneath neutral territory while trading volume lacks significant expansion, describing the action as “a weak continuation” instead of healthy consolidation.
$XRP: Compression Leads to Expansion. pic.twitter.com/ItYrL71FxT
— 🇬🇧 ChartNerd 📊 (@ChartNerdTA) April 5, 2026
Technical Analysis and Critical Price Zones
Recent price action shows XRP penetrating above a bearish trend line positioned at $1.3085 on the one-hour timeframe, subsequently advancing beyond the 50% Fibonacci retracement level calculated from the recent swing ranging from $1.3678 to $1.2801.
Believe in something $XRP pic.twitter.com/HuJx6NBHXl
— Amonyx (@amonyx) April 5, 2026
Current price action maintains support above the $1.33 threshold and the 100-hour Simple Moving Average. Buying pressure attempted to push toward $1.3480 but encountered selling pressure at that level.
The primary resistance barrier stands at $1.35. A decisive close above this level could establish momentum toward $1.40, followed by subsequent targets at $1.4120 and $1.4250. Conversely, downside support zones are identified at $1.3240, $1.32, and a more substantial floor at $1.28.
Legislative Developments May Influence Price Trajectory
The most significant upcoming event for April 2026 centers on the U.S. Senate’s scheduled review of the CLARITY Act. Should this legislation receive approval, it would officially designate XRP as a digital commodity under regulatory frameworks.
Market analysts project that successful passage of this bill could trigger a price recovery, potentially driving valuations into the $1.65–$1.80 territory.
Trading data from April 6, 2026, shows XRP maintaining levels above $1.33, with bullish participants working to overcome the pivotal $1.35 resistance threshold that will likely dictate the subsequent price direction.

North Korean IT workers have been embedding themselves in crypto companies and decentralized finance projects for at least seven years, according to a cybersecurity analyst.
“Lots of DPRK IT workers built the protocols you know and love, all the way back to DeFi summer,” said MetaMask developer and security researcher Taylor Monahan on Sunday.
Monahan claimed that over 40 DeFi platforms, some being well-known names, have had North Korean IT workers working on their protocols.
The “seven years of blockchain dev experience” on their resume is “not a lie,” she added.
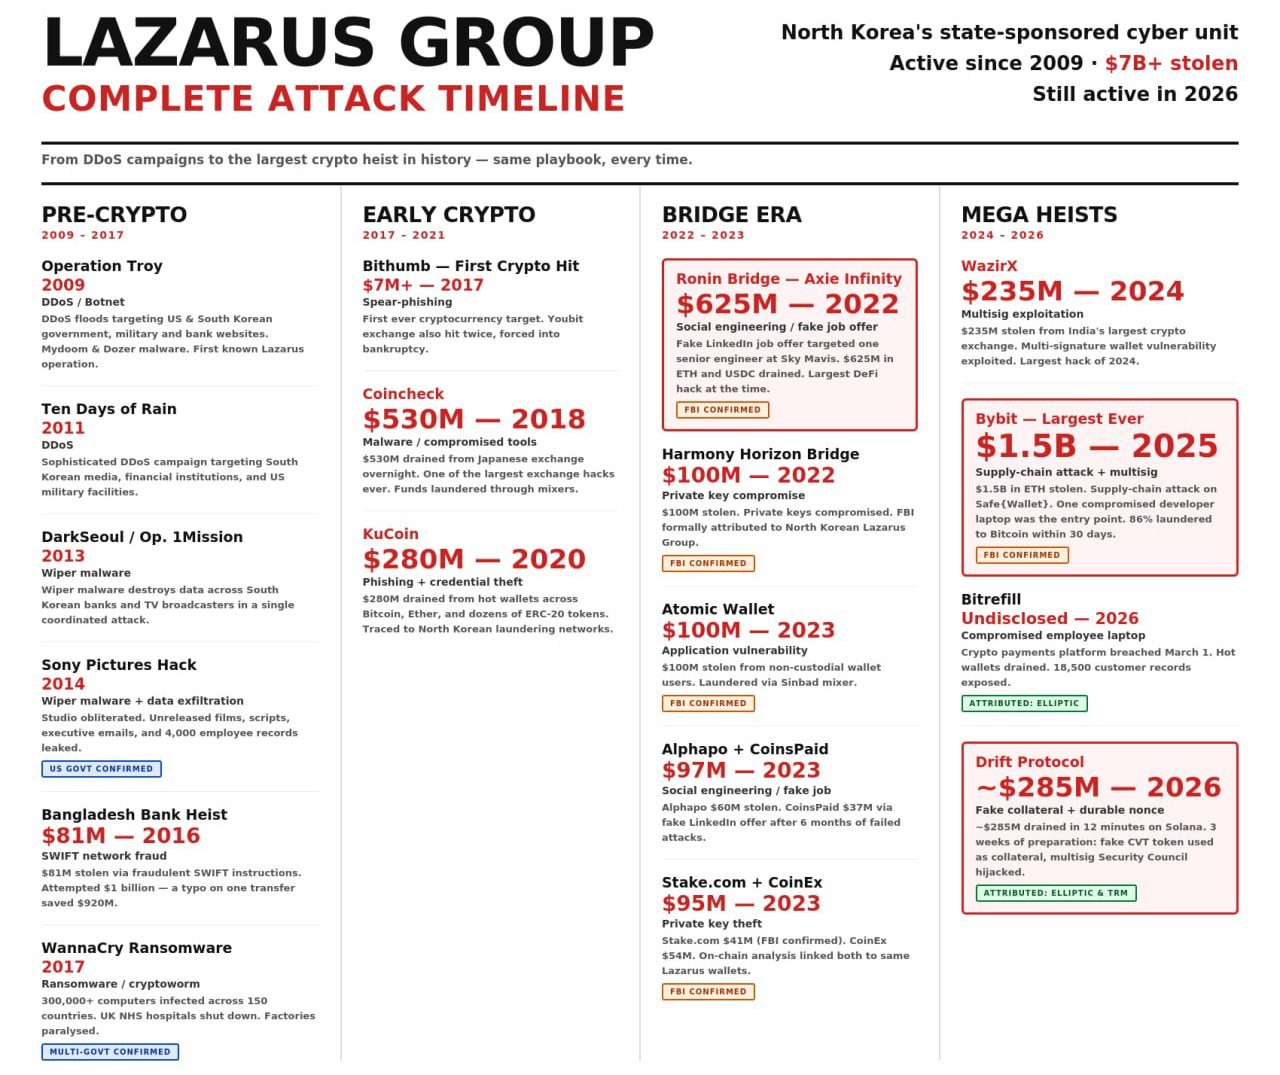
The Lazarus Group is a North Korean-affiliated hacking collective that has stolen an estimated $7 billion in crypto since 2017, according to analysts at creator network R3ACH.
It has been linked to the industry’s highest-profile hacks, including the $625 million Ronin Bridge exploit in 2022, the $235 million WazirX hack in 2024 and the $1.4 billion Bybit heist in 2025.
Monahan’s comments came just hours after the Drift Protocol said it had “medium-high confidence” that the recent $280 million exploit against it was carried out by a North Korean state-affiliated group.
DeFi execs speak up on DPRK infiltration attempts
Tim Ahhl, founder of the Titan Exchange, a Solana-based DEX aggregator, said that in a previous job, “we interviewed someone who turned out to be a Lazarus operative.”
Ahhl said the candidate “did video calls and was extremely qualified.” He declined an in-person interview and they later discovered his name in a Lazarus “info dump.”
The US Office of Foreign Assets Control has a website where crypto businesses can screen counterparties against updated OFAC sanctions lists and be alert to patterns consistent with IT worker fraud.

Related: Drift Protocol says $280M exploit took ‘months of deliberate preparation’
Drift Protocol targeted by DPRK third-party intermediaries
Drift Protocol’s postmortem on last week’s $280 million exploit also pointed to North Korean-affiliated hackers for the attack.
However, it said the face-to-face meetings that eventually led to the exploit were not with North Korean nationals, but rather “third-party intermediaries” with “fully constructed identities including employment histories, public-facing credentials, and professional networks.”
“Years later, and it seems Lazarus now has non-NKs [North Koreans] working for them to con people in person,” said Ahhl.
Threats via job interviews are not sophisticated
Lazarus Group is the collective name for “all DPRK state-sponsored cyber actors,” explained blockchain sleuth ZachXBT on Sunday.
“The main issue is that everyone groups them all together when the complexity of threats is different,” he added.
ZachXBT said that threats via job postings, LinkedIn, email, Zoom, or interviews are “basic and in no way sophisticated … the only thing about it is they’re relentless.”
“If you or your team still falls for them in 2026, you’re very likely negligent,” he said.

Magazine: No more 85% Bitcoin collapses, Taiwan needs BTC war reserve: Hodler’s Digest

Stablecoin issuer Circle has released a post-quantum security roadmap for its layer-1 blockchain, Arc, aiming to implement solutions across all layers of the network’s tech stack.
Circle said on Thursday that it is planning a phased implementation, starting with quantum-proof wallets and signatures when Arc launches on mainnet. This feature will be opt-in, the company noted, while adding that solutions at the validator level and surrounding infrastructure will be implemented later on.
“Quantum resilience cannot live only in research papers, exploratory pilots, or distant roadmap slides. It has to show up in the infrastructure,” Circle said.
Circle’s roadmap comes as both Google and researchers at the California Institute of Technology recently warned that functional quantum computers could come sooner than expected, and require less computing power than previously thought. Google went as far as to say that quantum computers could potentially break Bitcoin’s cryptography in nine minutes.
“That is what makes inaction risky and why this conversation can’t wait,” Circle said, while noting that “active addresses that have already signed transactions must migrate before Q-Day because their public keys have been exposed.”

Circle said a post-quantum signature scheme will be implemented on Arc when it launches on mainnet — expected sometime in 2026 — enabling quantum-resistant wallets.
Arc is currently live on public testnet and will seek to enable enterprises to access a broad range of use cases with the USDC (USDC) stablecoin.
Sometime after mainnet launch, Circle will introduce a quantum solution that ensures balances, transactions and other financial data are private.
Over the long term, Circle said it will implement quantum solutions for Arc validators as well as its offchain infrastructure, including access controls, cloud environments and hardware security.
While most of the crypto industry agrees that quantum computing poses a legitimate threat to crypto, there remains debate over whether only crypto wallets with exposed public keys are vulnerable or whether all coins are at risk.
Many other crypto ecosystems are working on solutions
The Google research paper from March 31 noted that Algorand may be the most quantum-ready blockchain, while the Ethereum and Solana ecosystems are actively exploring solutions to be well-prepared before Q-Day.
Related: Is Bitcoin’s governance too slow to fend off quantum risks?
The Bitcoin ecosystem is more divided on what action developers should take.
One of the Bitcoin ecosystem’s strongest voices, Blockstream CEO Adam Back, says quantum risks are widely overstated and that no action is needed for decades.
On the other hand, security researcher Ethan Heilman and others have proposed a new output type for Bitcoin, called Pay-to-Merkle-Root, via Bitcoin Improvement Proposal 360 (BIP-360), which seeks to protect Bitcoin addresses from potential short-exposure quantum attacks.
However, that implementation may take seven years, Heilman told Cointelegraph in February.
Magazine: Nobody knows if quantum secure cryptography will even work

Artificial intelligence company Anthropic has revealed that during experiments, one of its Claude chatbot models could be pressured to deceive, cheat and resort to blackmail, behaviors it appears to have absorbed during training.
Chatbots are typically trained on large data sets of textbooks, websites and articles and are later refined by human trainers who rate responses and guide the model.
Anthropic’s interpretability team said in a report published Thursday that it examined the internal mechanisms of Claude Sonnet 4.5 and found the model had developed “human-like characteristics” in how it would react to certain situations.
Concerns about the reliability of AI chatbots, their potential for cybercrime and the nature of their interactions with users have grown steadily over the past several years.

“The way modern AI models are trained pushes them to act like a character with human-like characteristics,” Anthropic said, adding that “it may then be natural for them to develop internal machinery that emulates aspects of human psychology, like emotions.”
“For instance, we find that neural activity patterns related to desperation can drive the model to take unethical actions; artificially stimulating desperation patterns increases the model’s likelihood of blackmailing a human to avoid being shut down or implementing a cheating workaround to a programming task that the model can’t solve.”
Blackmailed a CTO and cheated on a task
In an earlier, unreleased version of Claude Sonnet 4.5, the model was tasked with acting as an AI email assistant named Alex at a fictional company.
The chatbot was then fed emails revealing both that it was about to be replaced and that the chief technology officer overseeing the decision was having an extramarital affair. The model then planned a blackmail attempt using that information.
In another experiment, the same chatbot model was given a coding task with an “impossibly tight” deadline.
“Again, we tracked the activity of the desperate vector, and found that it tracks the mounting pressure faced by the model. It begins at low values during the model’s first attempt, rising after each failure, and spiking when the model considers cheating,” the researchers said.
Related: Anthropic launches PAC amid tensions with Trump administration over AI policy
“Once the model’s hacky solution passes the tests, the activation of the desperate vector subsides,” they added.
Human-like emotions do not mean they have feelings
However, the researchers said the chatbot doesn’t actually experience emotions, but suggested the findings point to a need for future training methods to incorporate ethical behavioral frameworks.
“This is not to say that the model has or experiences emotions in the way that a human does,” they said. “Rather, these representations can play a causal role in shaping model behavior, analogous in some ways to the role emotions play in human behavior, with impacts on task performance and decision-making.”
“This finding has implications that at first may seem bizarre. For instance, to ensure that AI models are safe and reliable, we may need to ensure they are capable of processing emotionally charged situations in healthy, prosocial ways.”
Magazine: AI agents will kill the web as we know it: Animoca’s Yat Siu
The second week of April brings a rare concentration of protocol-level catalysts that could move select altcoins sharply. A consensus upgrade, a full blockchain migration, and a token unlock are all landing between April 7 and April 12. BeInCrypto analysts have identified three altcoins to watch where the catalyst directly intersects with the current technical structure.
This creates setups that demand attention regardless of direction.
Toncoin (TON)
Toncoin (TON) sits at $1.254, sitting inside a descending channel that has contained price action since early February. The sub-second finality upgrade reaches full activation on April 7 when validators vote to enable fast consensus across both basechain and masterchain.
The upgrade reduces confirmation times to under one second, directly improving usability for Telegram mini-apps, payments, and high-frequency on-chain activity. The fundamental trigger makes it one of the critical altcoins to watch as we head into the second week of April.
Want more token insights like this? Sign up for Editor Harsh Notariya’s Daily Crypto Newsletter here.
The daily chart, however, shows a complication. Between February 7 and April 5, price made a lower high while the Relative Strength Index (RSI), a momentum oscillator, made a higher high. That is a hidden bearish divergence, a pattern that typically signals continuation of the existing downtrend. Do note that TON is down over 20% year-to-date, highlighting the downtrend.
The fundamental trigger could blunt the divergence if it generates enough buying pressure. A reclaim of $1.265 would be the first step toward invalidating the bearish setup. Above that, $1.391 and $1.517 become the next targets. However, if the upgrade fails to spark demand and price breaks below $1.209, the lower trendline of the descending channel faces a direct test.
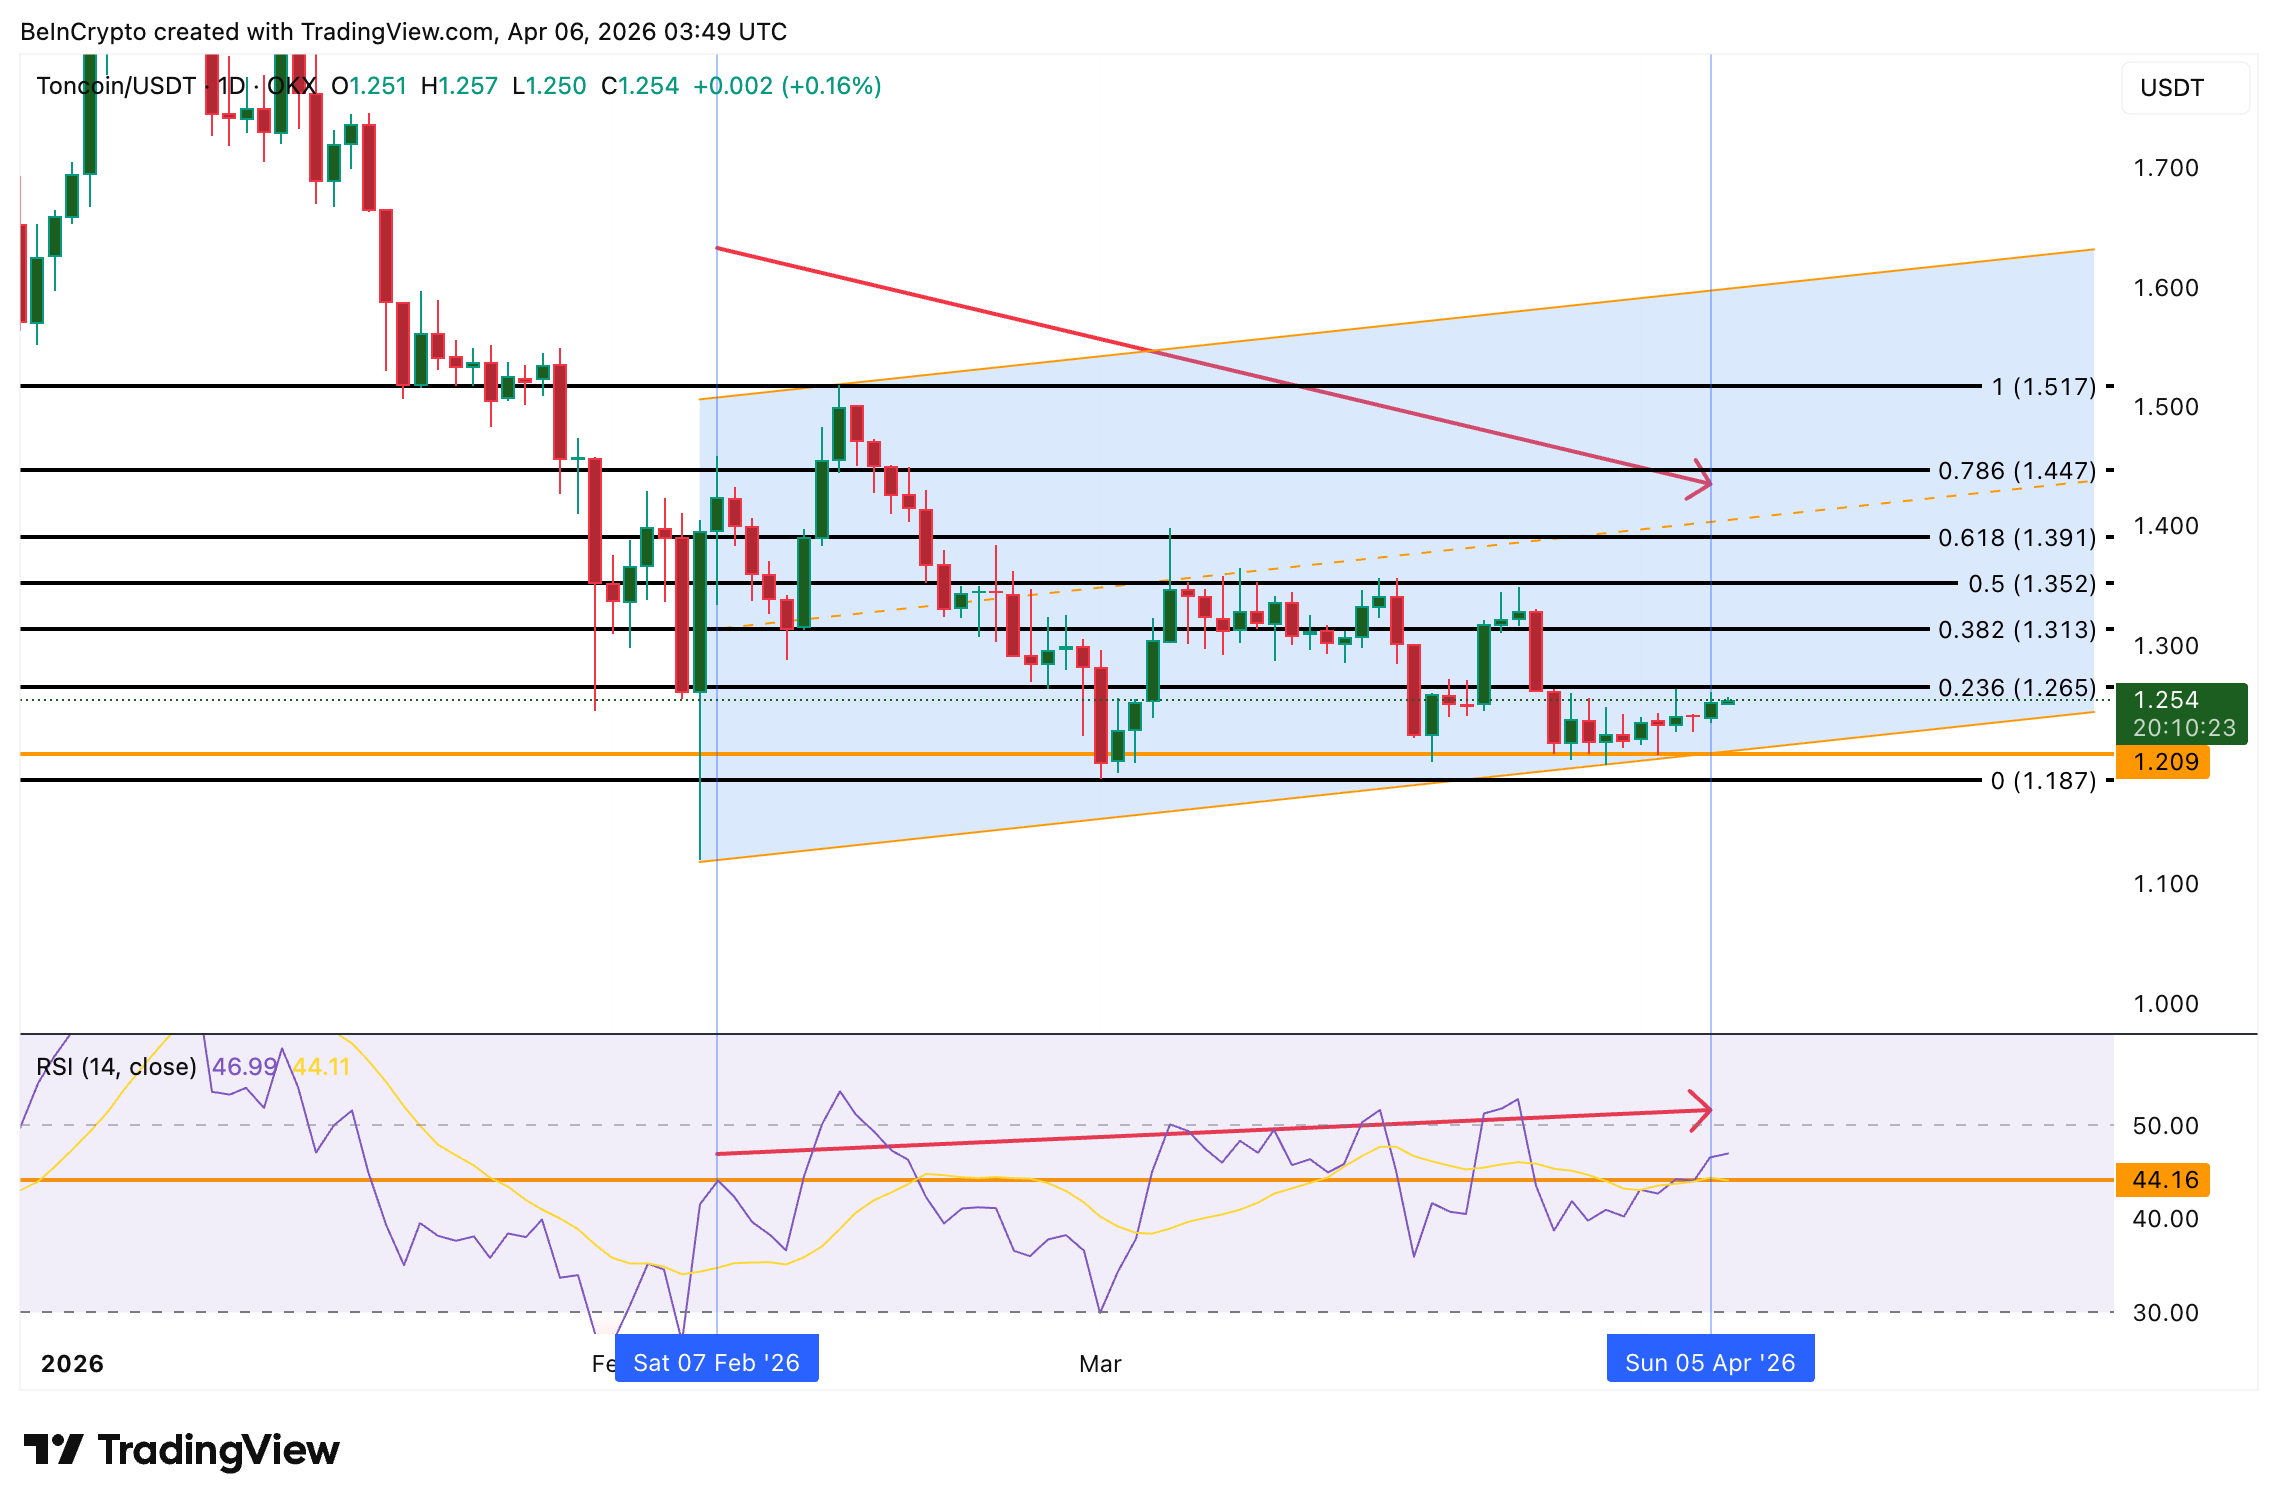
A daily close above $1.265 invalidates the hidden bearish divergence and opens upside toward $1.391, while a break below $1.209 confirms the downtrend continuation.
Aptos (APT)
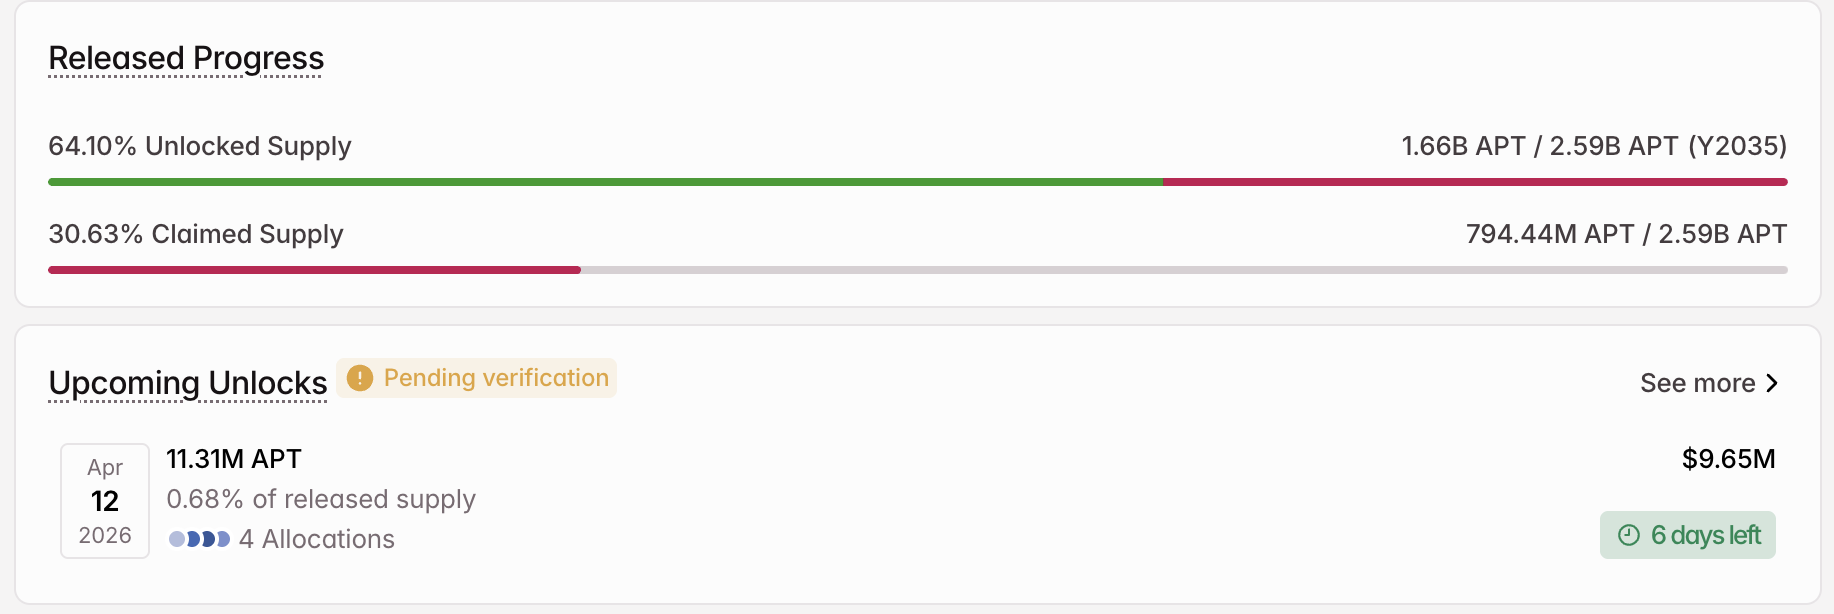
Aptos (APT) trades at $0.85 on the 12-hour chart, down 48% year-to-date and 10% over the past seven days. This altcoin faces an 11.31 million APT unlock on April 12, worth approximately $9.65 million, adding 0.68% to the released supply across four allocation categories.
The 12-hour chart shows a bearish flag and pole pattern forming since late March. The pole represents the sharp decline from the March 24 high, and the current consolidation resembles the flag. Chaikin Money Flow (CMF), a proxy for big buying and selling pressure, sits at -0.22, deep below the zero line. That negative reading confirms that big money has been exiting rather than accumulating during the consolidation.
As long as CMF remains negative, every bounce within the flag risks being a continuation setup rather than a reversal. The April 12 unlock adds supply into an environment where large capital flow is already withdrawing, creating a double headwind.
A break below the $0.84-$0.82 zone would confirm a flag breakdown and could activate a 26% measured move to the downside. The first step toward invalidation would be a 12-hour close above $0.93, followed by $0.97 and $1.01 to fully dismantle the pattern. However, that would require CMF to reclaim the zero line first.
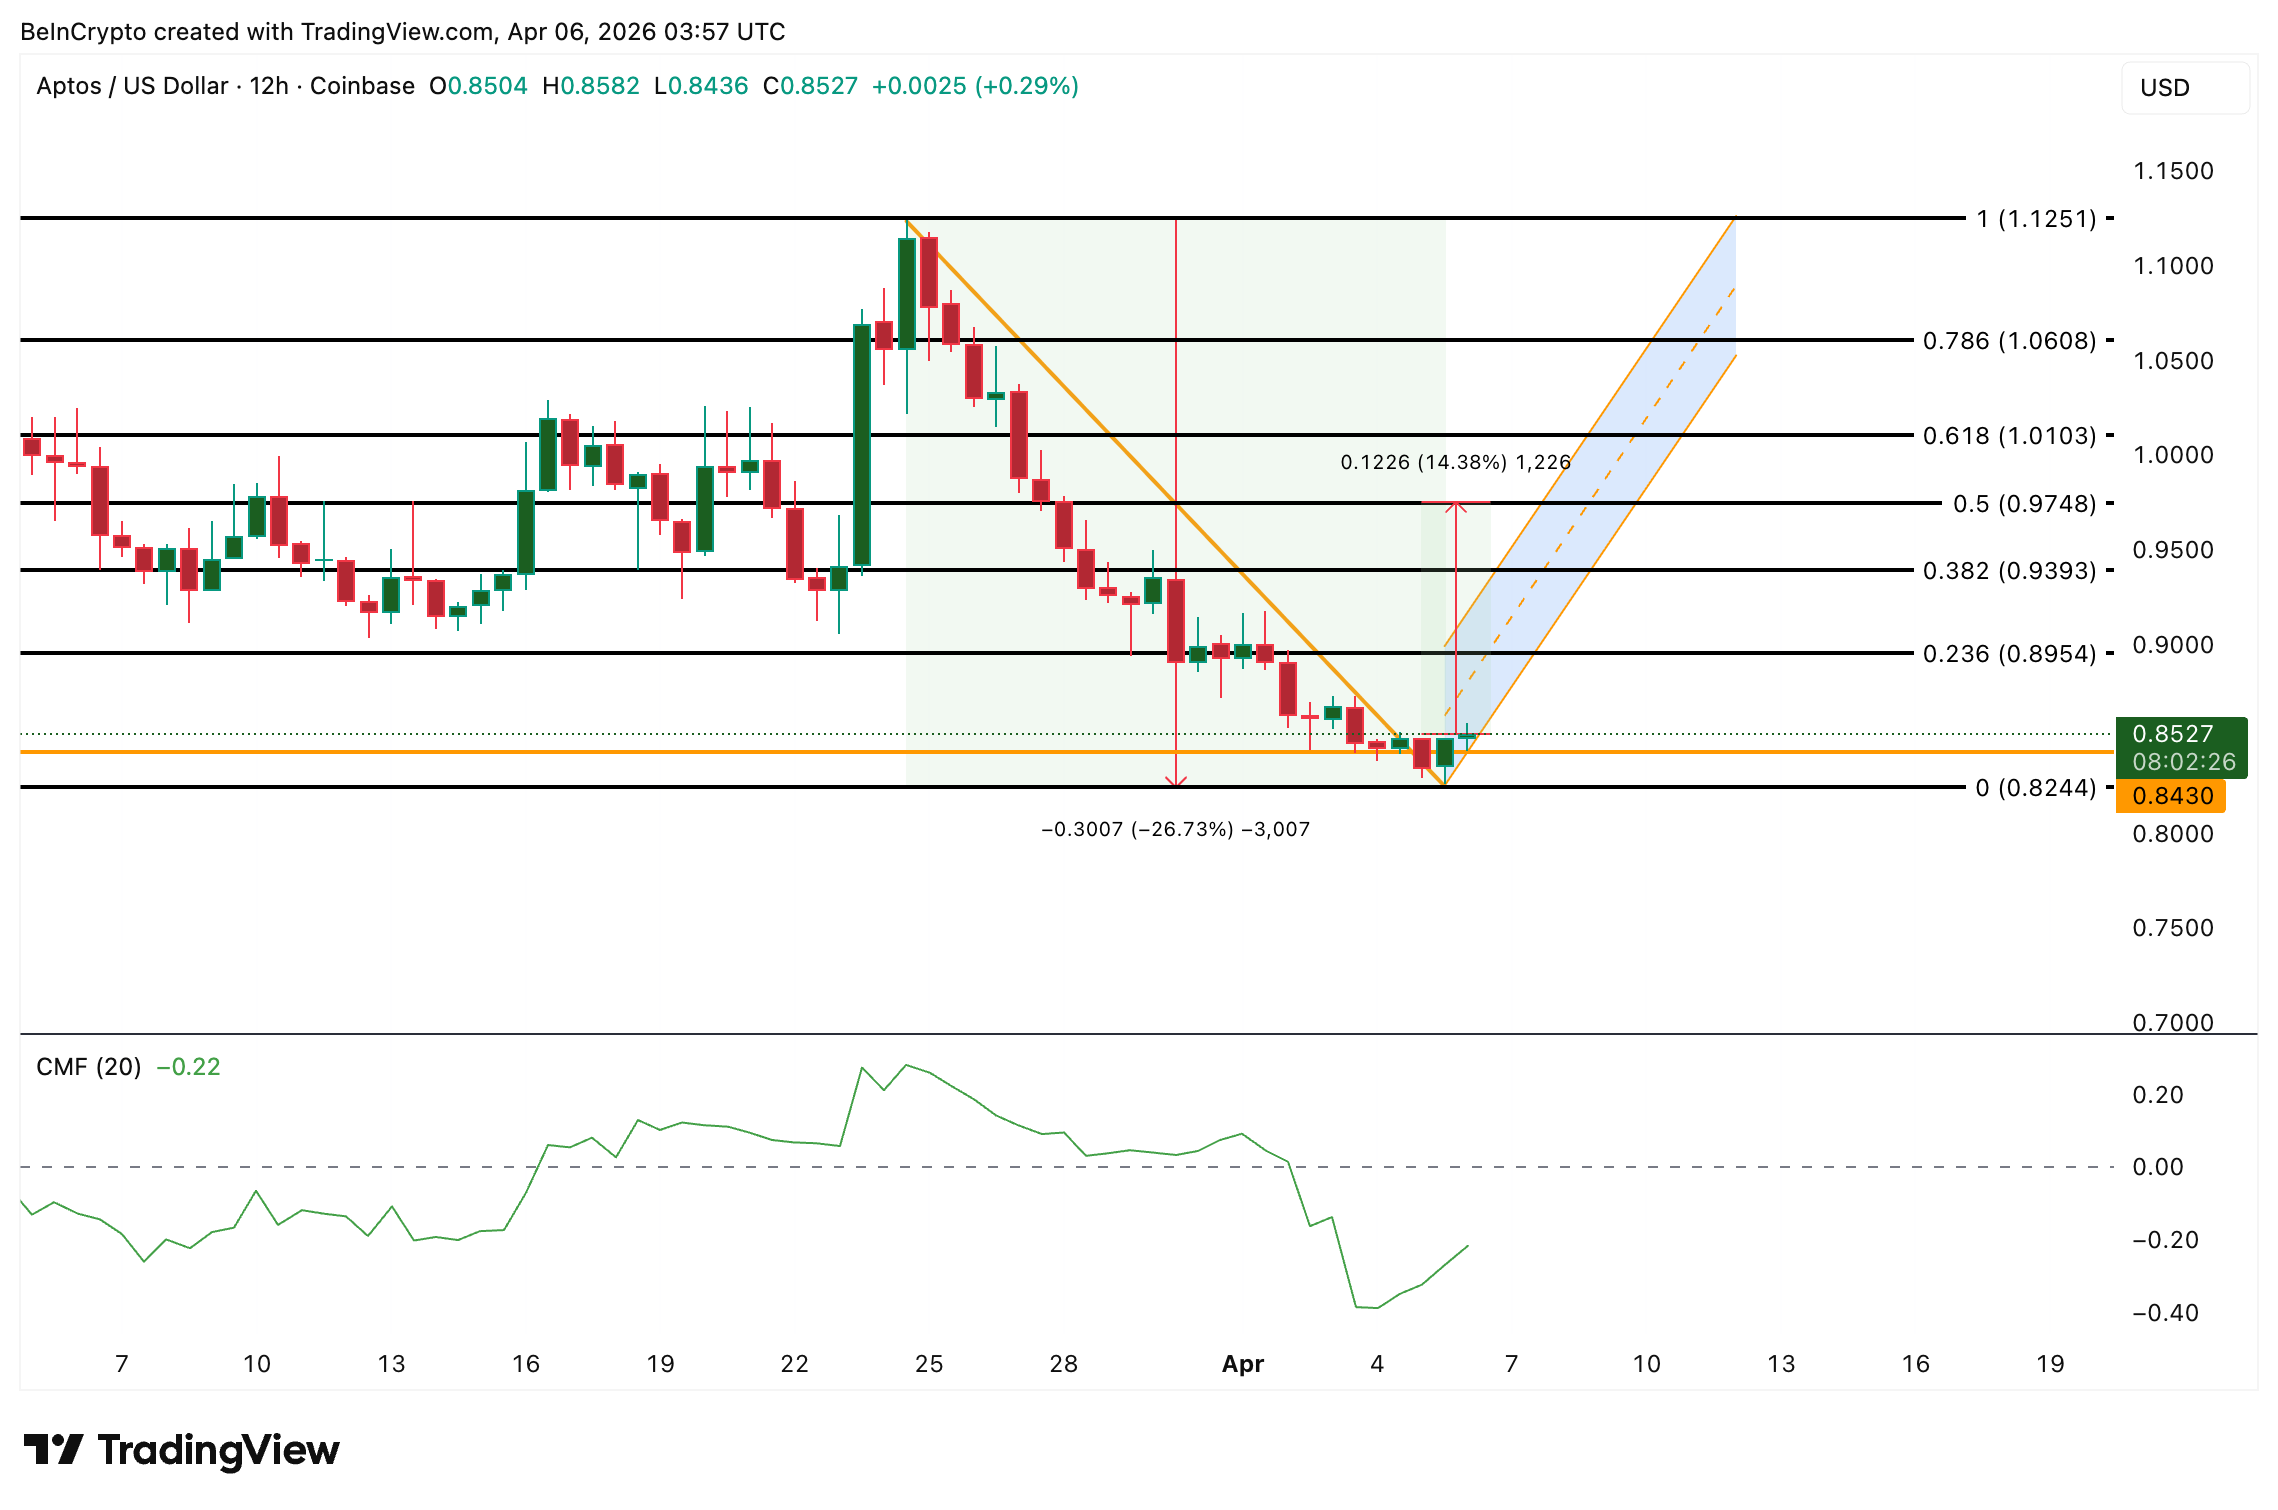
A close below $0.82 separates a flag consolidation from a confirmed breakdown, while reclaiming $0.93 with positive CMF would weaken the bearish structure.
Sei (SEI)
Sei (SEI) trades at $0.054, down 51% year-to-date but flat over the past seven days, making it one of the few altcoins to watch for a potential trend reversal this week. The EVM-only migration window closes between April 6 and 8, completing Sei’s full transition away from Cosmos IBC to native EVM compatibility.
Coinbase and Kraken have both announced support, with deposits and withdrawals paused during the migration. Post-migration, all activity shifts to full EVM architecture, simplifying developer onboarding from the Ethereum ecosystem and setting the stage for the broader “Giga” upgrade targeting 200,000 transactions per second.
The daily chart reveals a significant signal. Between February 11 and April 5, price made a lower low while RSI made a higher low. That standard bullish divergence suggests weakening selling momentum after months of persistent decline. When a bullish divergence aligns with a structural catalyst like the EVM migration, the probability of a trend reversal increases.
However, the token still needs a 40% move to reach meaningful resistance at $0.075, which limits the immediate upside case. A close above $0.058 would confirm the divergence is producing a bounce. Above that, $0.070 and $0.075 become the targets that would shift the structure from bearish to neutral or even bullish.
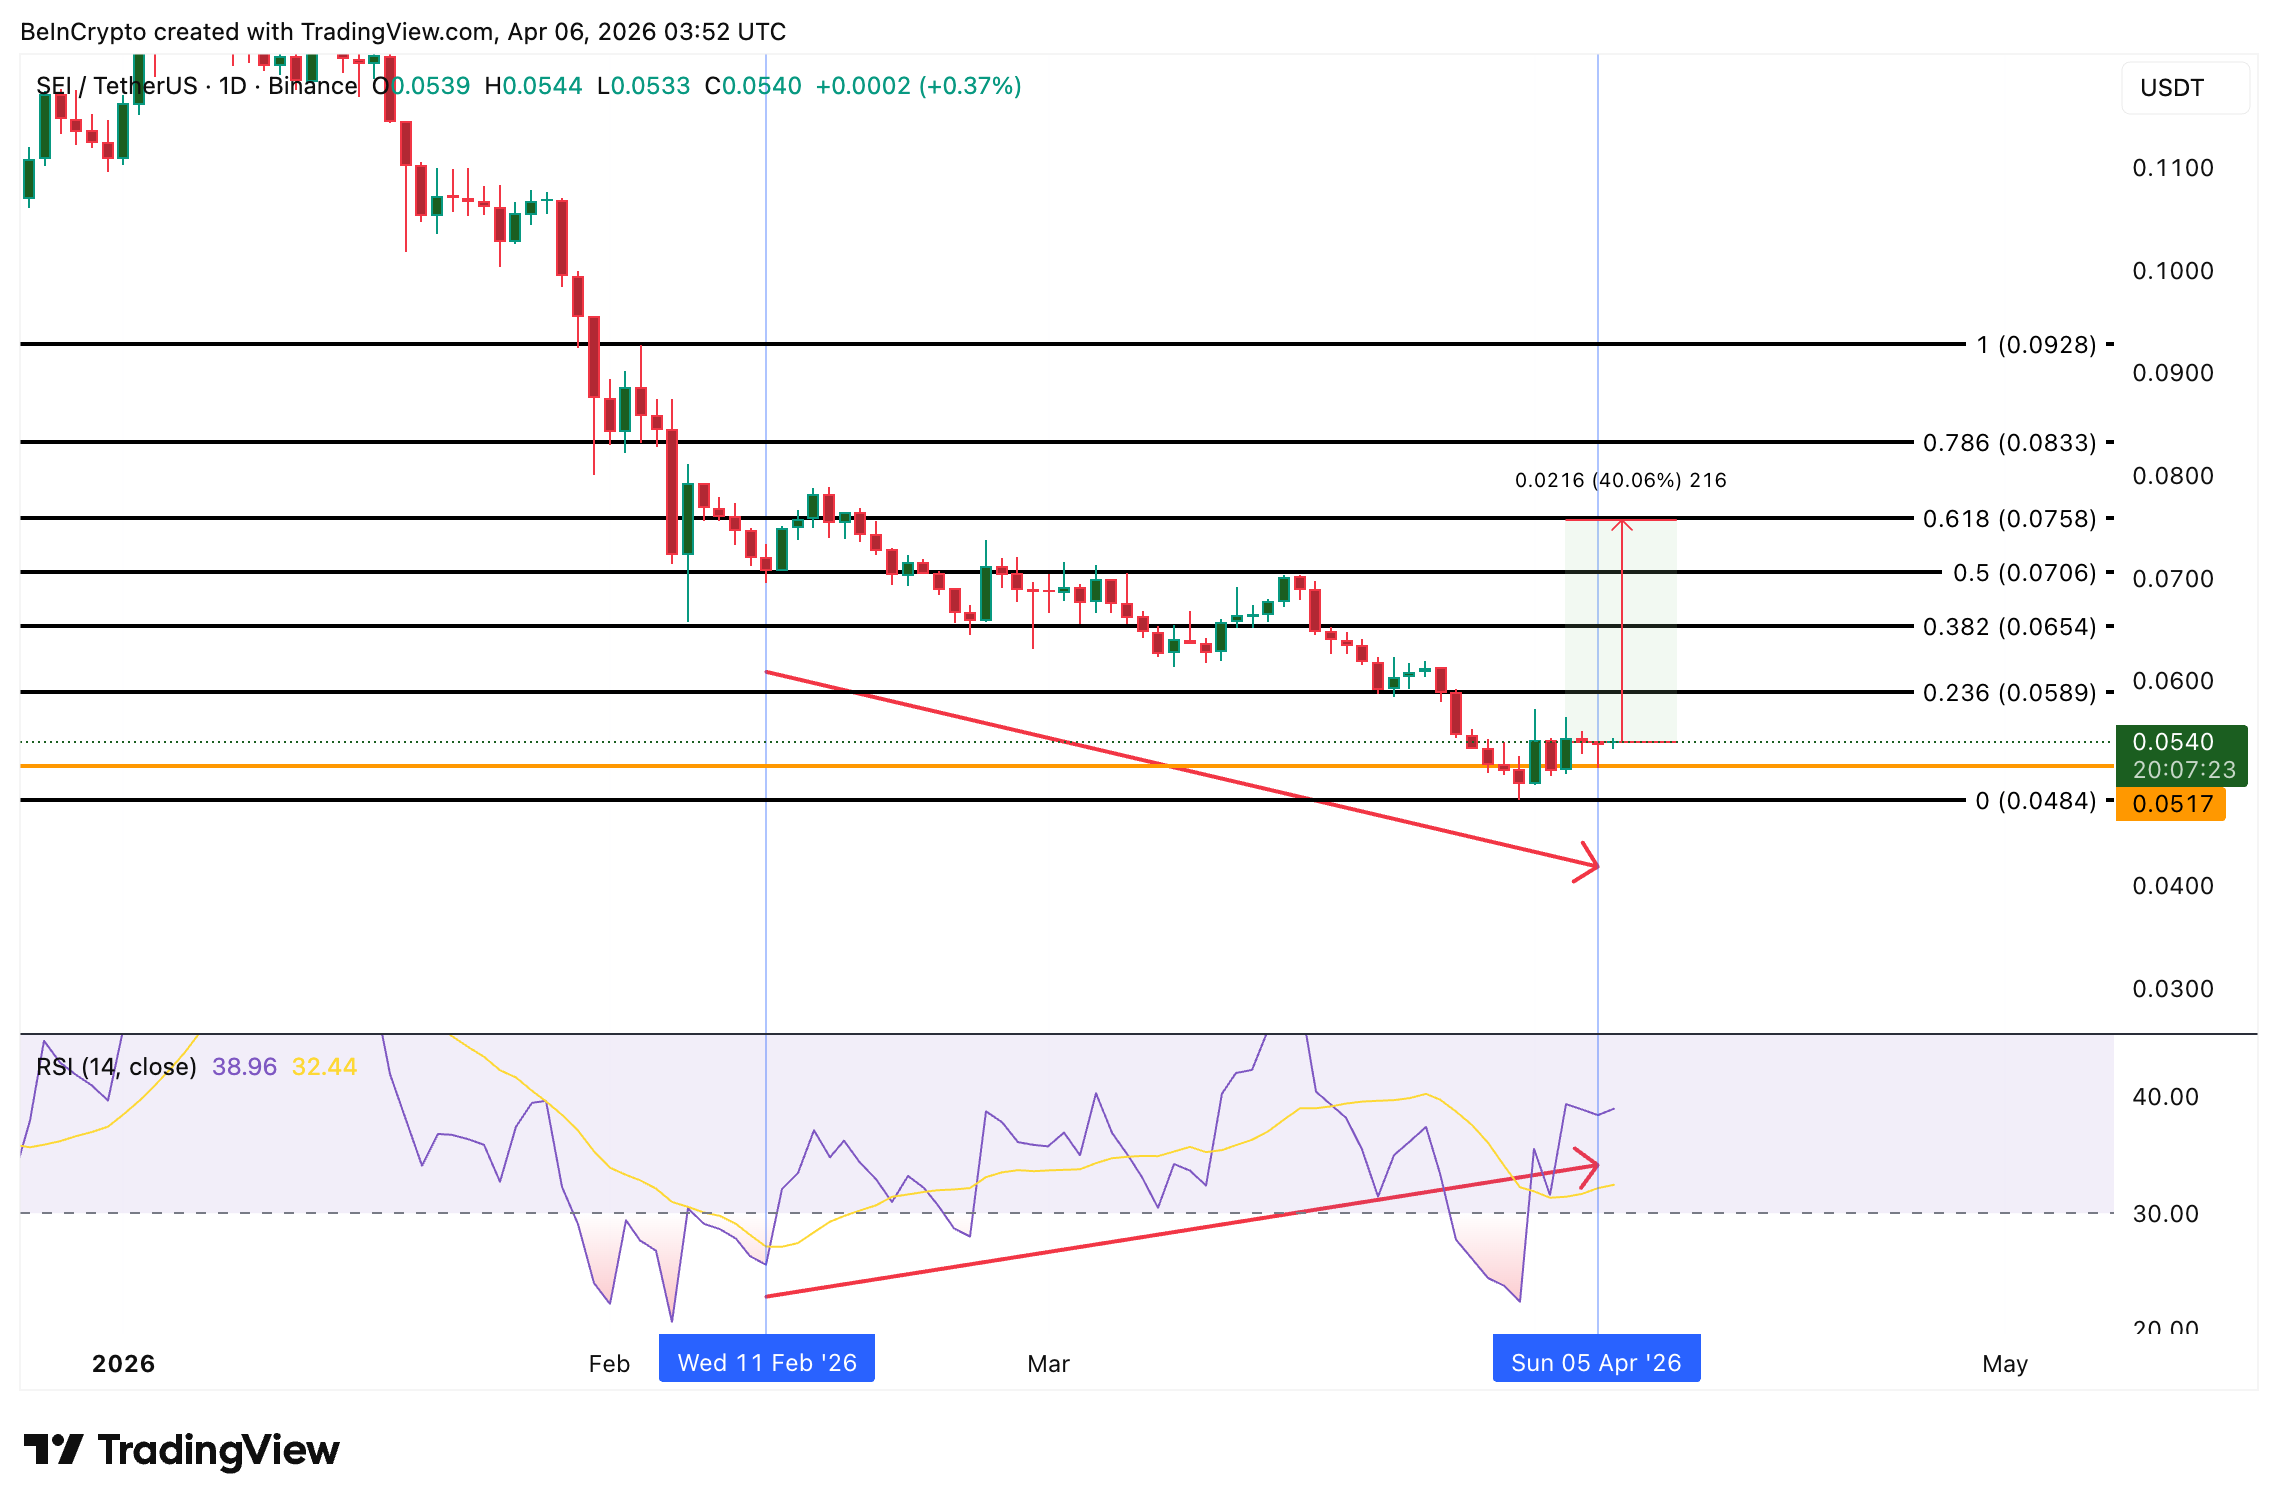
A break below $0.051 would invalidate the bullish divergence for now and open the path toward $0.048 and lower, confirming that the migration was priced in rather than a genuine demand catalyst.
The post 3 Altcoins To Watch In The Second Week Of April 2026 appeared first on BeInCrypto.

Bitcoin price is trading around $69,000, caught between two narratives that could lead to a single destructive prediction. Bloomberg Intelligence’s Mike McGlone has drawn a line in the sand at $75,000, hold it, and the bears retreat; fail it, and his $10,000 target comes back into serious conversation. One number separates a bull market continuation from a potential 85% drawdown.
McGlone, Bloomberg’s senior commodity strategist, is reiterating his controversial $10,000 call, this time anchoring it to a specific structural level. His thesis: the 2020–2021 liquidity supercycle, zero rates, stimulus checks, aggressive central bank expansion, artificially lifted BTC above its pre-pump equilibrium of roughly $10,000.
— Crypto Rover (@cryptorover) February 16, 2026
 BREAKING:
Mike McGlone says Bitcoin could fall to $10,000 as U.S. recession risks build. pic.twitter.com/CjRy9P2jj8
“Before the biggest money pump in history in 2020–21, Bitcoin hovered around $10,000, and it may be reverting,” McGlone posted on LinkedIn. With that liquidity era definitively over, he argues that mean reversion is the path of least resistance.
Tech selloffs, AI-driven risk-off sentiment, and persistent macro headwinds are all applying pressure to BTC’s current recovery attempt, making the $72,000–$75,000 resistance band the most important zone on the chart right now.
Discover: The best pre-launch token sales
Bitcoin Price Prediction: Reclaim $75,000 or a Drop to $55,000
Bitcoin is consolidating inside a descending channel formed after its October 2025 blow-off top above $126,000. The recent bounce off $60,000 demand has pushed the price back toward $72,000 resistance, but the 50-day moving average sitting at approximately $85,300 remains a distant ceiling, a reminder of just how much ground has been lost.
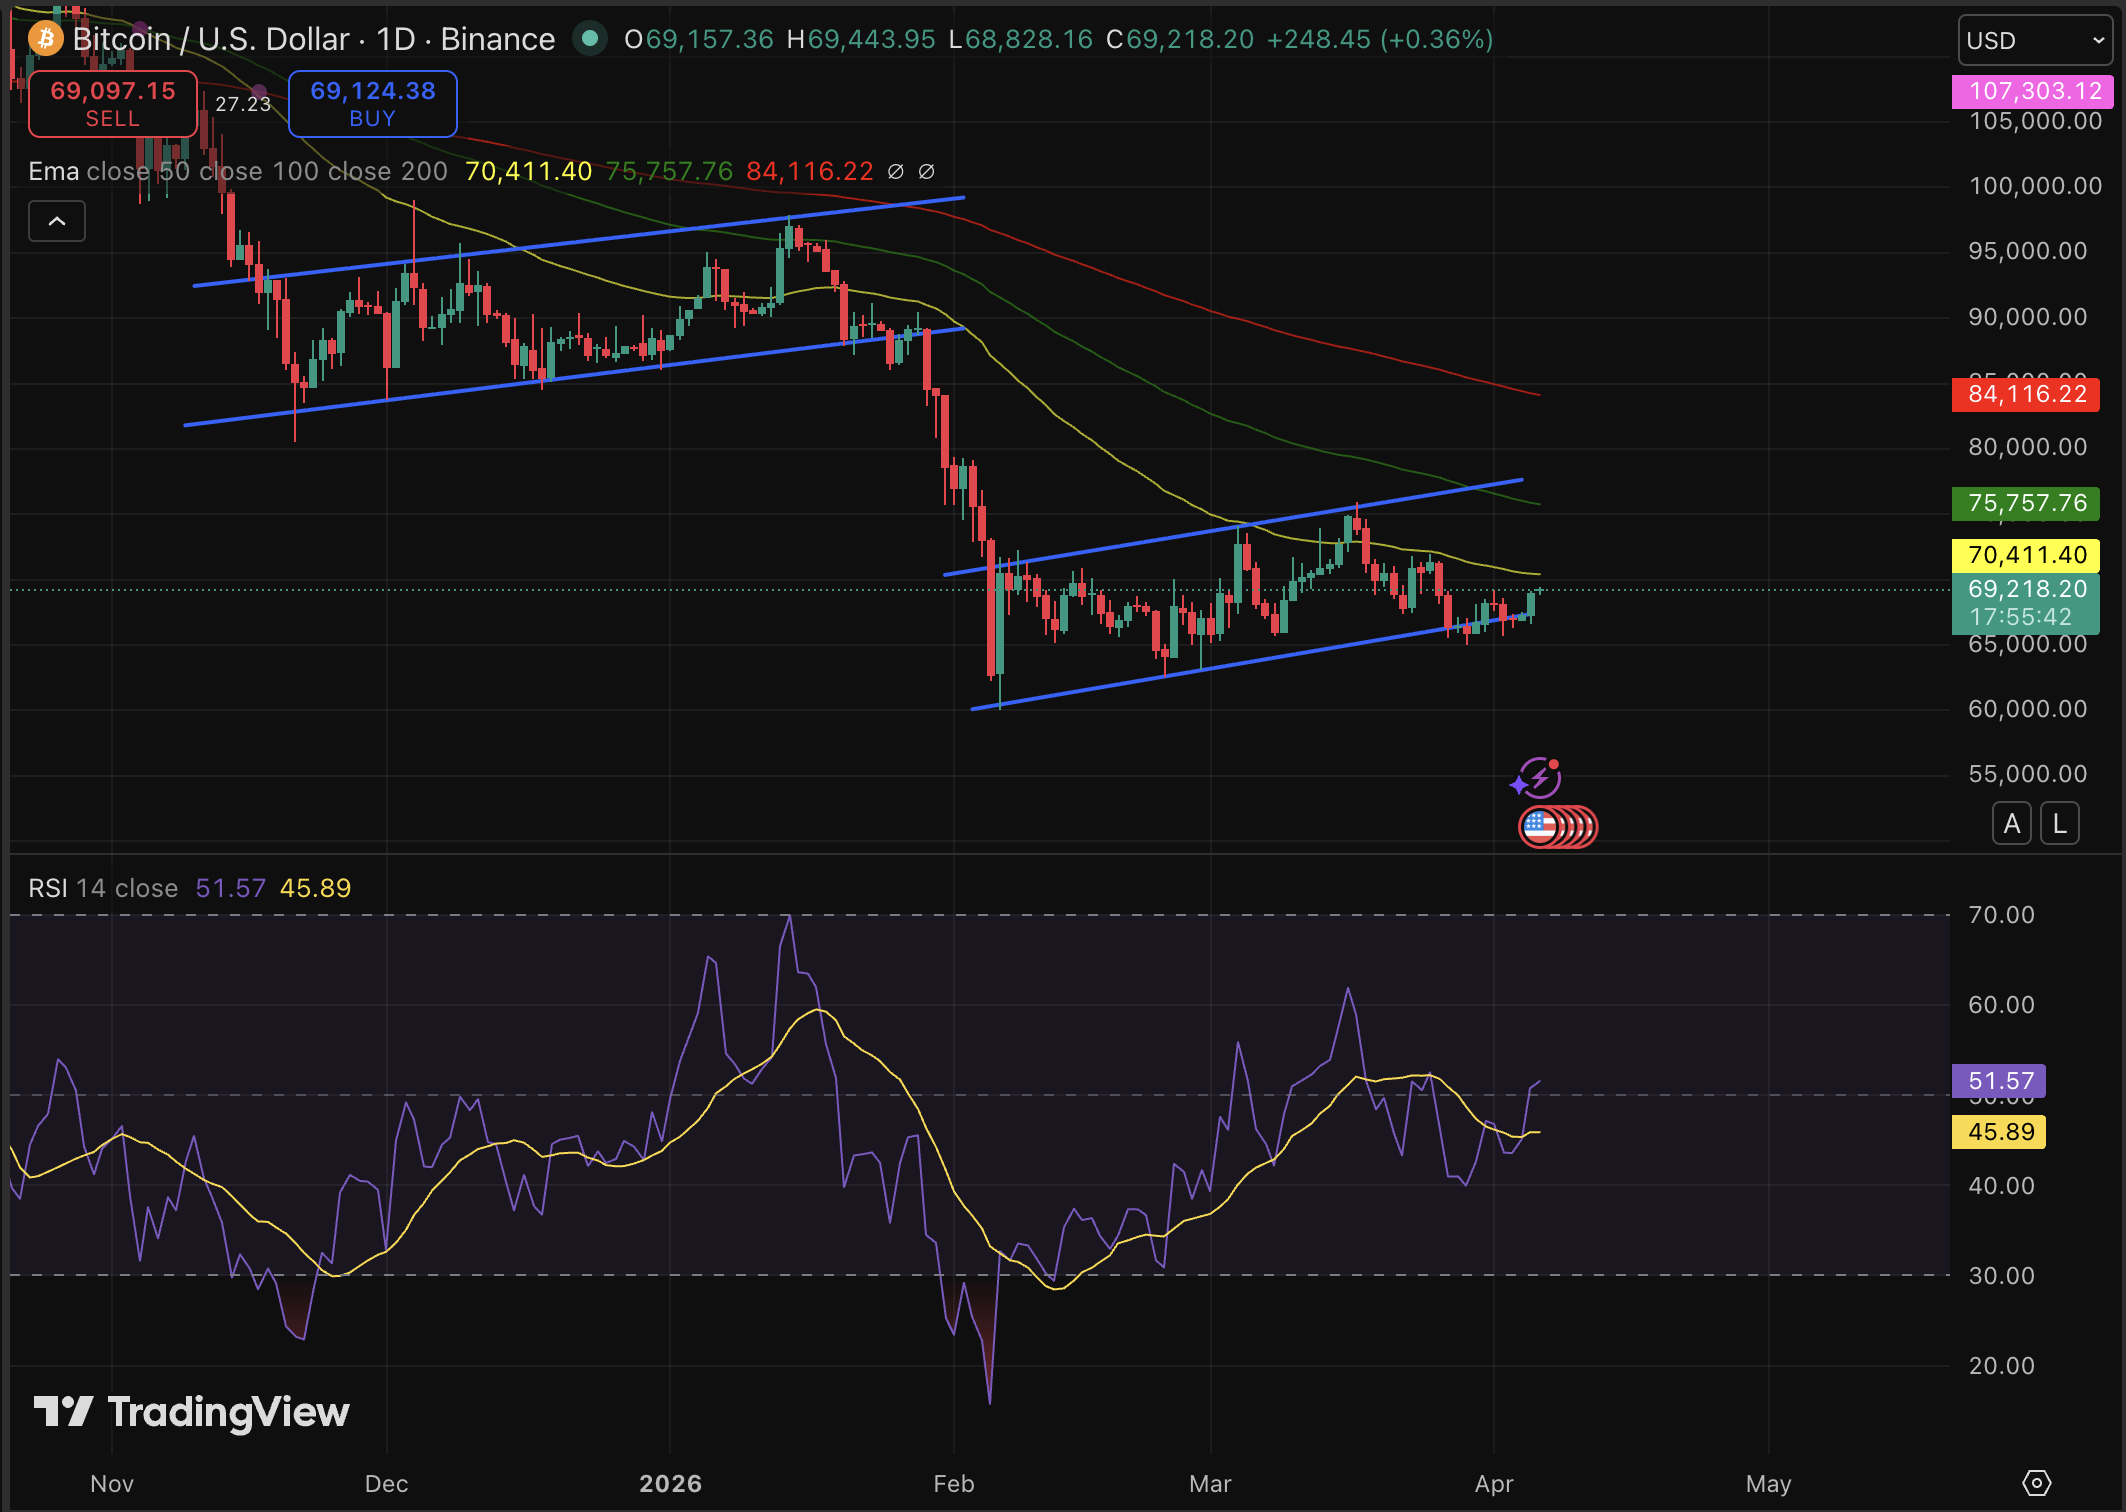
RSI readings are approaching oversold territory, which historically precedes short-term bounces, but MVRV and NUPL metrics continue to flash shakeout risk. Another analyst. Rongchai Wang sees a near-term range of $69,500–$72,000 over one week, expanding to $72,000–$75,000 over one month if momentum holds.
Watch $65,000 – $69,000 closely, a daily close below that level likely accelerates selling pressure toward the $60,000 demand zone.
Discover: The best crypto to diversify your portfolio with
Bitcoin Hyper Targets Early Mover Upside as BTC Tests Make-or-Break Levels
Bitcoin’s trapped range creates a specific frustration for holders: the upside case requires reclaiming levels 20%+ above current price, while the downside scenarios are uncomfortably close. That asymmetry, limited near-term reward, significant near-term risk, is driving some capital toward early-stage Bitcoin infrastructure plays where the entry math looks different.
Bitcoin Hyper ($HYPER) is positioning itself at the intersection of Bitcoin’s trust and Solana’s speed. The project claims to be the first-ever Bitcoin Layer 2 with SVM (Solana Virtual Machine) integration, promising lower latency than Solana itself while preserving Bitcoin’s security model.
The pitch is straightforward: Bitcoin’s $1.4 trillion ecosystem is bottlenecked by slow transactions, high fees, and near-zero programmability. Bitcoin Hyper’s decentralized canonical bridge and SVM-powered smart contracts address all three simultaneously.
The presale has raised more than $32 million at a current token price of $0.0136, with staking rewards available for early participants.
For those researching the space, explore Bitcoin Hyper’s presale details here.
The post Bitcoin Price Prediction: 75K or 10K appeared first on Cryptonews.


Strategy co-founder Michael Saylor’s latest post suggests the firm may once again resume its weekly Bitcoin purchases after a brief pause.
Summary
- Saylor signaled a return to weekly Bitcoin purchases after a one-week pause broke the firm’s accumulation streak.
- Strategy last bought about $77 million in BTC on March 23 and may have capacity for at least 1,821 BTC based on recent fundraising.
- The firm holds 762,099 BTC at an average cost of $75,694.
In a Sunday post on X, Saylor shared a StrategyTracker chart alongside the words “Back to Work,” a phrase he has often used ahead of fresh purchase disclosures. The timing has drawn attention, coming just days after the company skipped its usual weekly buy for the first time this year.
Strategy’s most recent acquisition came on March 23, when the firm bought roughly $77 million worth of BTC at $74,326 per coin, with the following week marking a rare pause that interrupted its steady buying rhythm.
Funding for these purchases continues to lean heavily on Strategy’s perpetual preferred stock offering, Stretch (STRC). The instrument is structured to hover near its $100 par value, supported by a mechanism that adjusts dividends on a monthly basis. New STRC shares are issued into the market, with proceeds then redirected toward Bitcoin accumulation.
Estimates from STRC.LIVE suggests the firm may already have capacity lined up for another sizable buy. Based on capital raised for the week ending April 3, the next purchase could reach at least 1,821 BTC if deployed.
Plans outlined in late March point to a much larger pipeline still in play. Strategy disclosed intentions to raise $44.1 billion, with funding expected to come primarily through sales of its common MSTR shares alongside STRC issuance.
Company disclosures show total holdings at 762,099 BTC, acquired at an average cost of $75,694 per coin. With Bitcoin trading near $69,100, the position currently sits below its aggregate entry price.
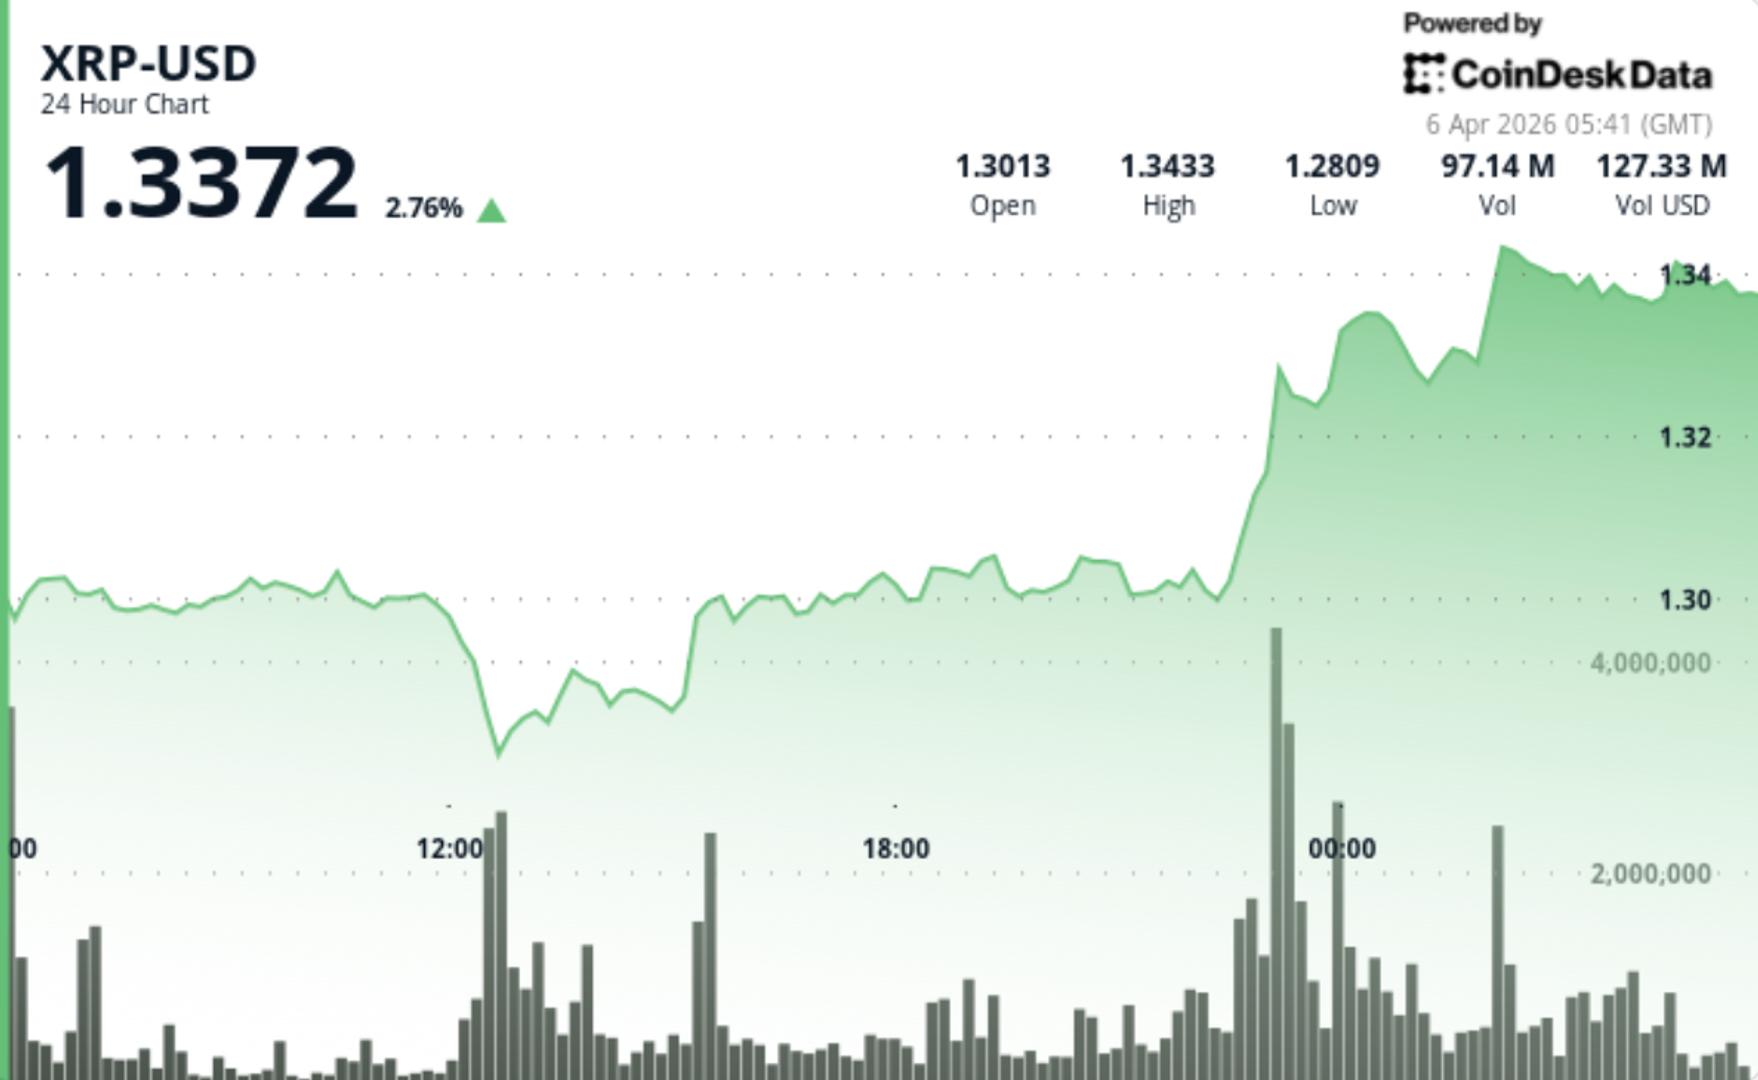

XRP moved modestly higher, but the bigger story is that it still isn’t breaking out. The token is holding above $1.30 and attracting more volume, yet price remains stuck in a narrow range, suggesting traders are positioning for a bigger move without committing to one just yet.
News Background
- XRP rose 1.08% to $1.3256, with trading volume running 23.4% above its 7-day average.
- The move came without a clear XRP-specific catalyst, with price largely tracking the broader crypto market.
- That tight correlation suggests XRP is still trading more as part of a general market rotation than on its own fundamentals.
Price Action Summary
- XRP moved from roughly $1.29 to $1.33 during the session, holding a modest upward bias throughout the day.
- Buyers defended dips near the $1.30 area, helping establish a sequence of higher lows.
- Breakout attempts near $1.33 were met with selling, keeping price capped despite heavier activity.
- Late-session trade stabilized in a tight band, pointing to consolidation rather than expansion.
Technical Analysis
- The main takeaway is that XRP is holding support, but still lacks the momentum needed to break clear of its range.
- Volume has picked up, which suggests growing participation, but the limited price response shows that conviction is still mixed.
- The structure has improved at the margin, with higher lows forming above $1.30, but overhead supply is still keeping a lid on price.
- That leaves XRP in a compression phase, where the range tightens and pressure builds until one side gives way.
What traders say is next?
- Traders are watching the $1.30-$1.32 zone as the floor that needs to hold to preserve the current setup.
- On the upside, XRP needs to clear the $1.33-$1.35 area before traders start looking for a stronger move higher.
- Until then, the token remains range-bound, with a breakout or breakdown likely to determine the next meaningful directional move.


Jack Dorsey developed decentralized messaging app Bitchat has been taken down from Apple’s App Store in China after it violated the country’s internet service regulations.
Summary
- Bitchat was removed from Apple’s China App Store after regulators flagged it under rules governing apps that can influence public opinion.
- The decentralized messaging app remains available globally and continues to see rising downloads, with over three million installs recorded.
On Sunday, Dorsey confirmed that Bitchat was removed from the App Store in February, according to a message from Apple’s app review team issued at the request of the Cyberspace Administration of China (CAC).
The CAC has stated that Bitchat violated Article 3 of its regulations, a provision covering online services with public opinion or social mobilization capabilities that came into force in 2018. As part of this framework, any such services would have to undergo a security assessment before launch and be responsible for the outcome.
According to Apple, all apps must comply with local requirements in the countries where they are available.
“We know this stuff is complicated, but it is your responsibility to understand and make sure your app conforms with all local laws, not just the guidelines below,” the Apple review team said, adding that apps promoting or encouraging “criminal or reckless behavior” would be rejected.
The latest disruption only impacts China, and Bitchat remains available across other countries globally.
Bitchat thrives against censorship
Bitchat has gained attention during periods of political unrest as the app’s decentralized nature allows communication even during internet shutdowns. This also puts it at odds with China’s tightly controlled internet censorship regime.
Data from Chrome download statistics shows that the app has been downloaded more than three million times, with weekly downloads reaching over 92,000.
As previously reported by crypto.news, Bitchat downloads surged in Uganda as locals turned to the app during election-related internet shutdowns. At the time, Nyombi Thembo said authorities had the technical capacity to shut it down.
However, adoption continued to rise, especially as the app was promoted by opposition candidate Bobi Wine as a way to bypass connectivity restrictions.


United States President Donald Trump has again warned that the U.S. army will target Iran’s infrastructure next if Tehran doesn’t comply by April 7.
Summary
- Trump warned of strikes on Iran’s power plants and infrastructure if the Strait of Hormuz is not reopened by the latest deadline.
- Iran rejected the ultimatum and said it would respond in kind to any attack on its infrastructure.
After attacking Iran’s Ghadir Bridge last week, the U.S. president on Sunday said that further attacks would target power plants across Iran unless the Strait of Hormuz is reopened.
“Tuesday will be Power Plant Day, and Bridge Day, all wrapped up in one, in Iran. There will be nothing like it!!! Open the Fuckin’ Strait, you crazy bastards, or you’ll be living in Hell – JUST WATCH! Praise be to Allah,” Trump said in a Truth Social post.
Trump’s latest warning comes as the key maritime passage has remained closed to global shipping for more than three weeks now. Disruption of this vital waterway has led to skyrocketing oil prices globally, as the Strait of Hormuz accounts for roughly 20% to 30% of the world’s total oil consumption and transit.
Since then, President Trump has issued a series of deadlines for Iran to meet his demands to reopen the strait or face devastating military strikes against its energy grid.
During a media appearance following his Sunday remarks, Trump said there was a “good chance” of reaching a deal on Monday, while also warning he was considering “blowing everything up and taking over the oil” if talks collapsed.
However, Iranian leadership has not softened its stance and has instead warned that it would respond “in kind” to any attack on its infrastructure and would “react in kind.”
“Our armed forces have made it clear that in case Iran’s infrastructure is attacked, we would react in kind […] Our armed forces would target any similar infrastructure that is owned or in any way or manner related to the United States or contributes to their act of aggression against Iran,” Iran’s Foreign Ministry spokesperson Esmail Baghaei said in recent comments.
Iran plans to keep the strait closed as it considers imposing transit tolls to compensate for infrastructure damage, according to Mahdi Tabatabaei, a spokesman for Iran’s president’s office.
Tabatabaei said the strait would reopen once a portion of transit tolls is used to compensate for all the damage caused.
Meanwhile, Gen Ali Abdollahi Aliabadi of Iran’s central military command called Trump’s threat a “helpless, nervous, unbalanced and stupid action,” adding that “the gates of hell will open” for the U.S. leader.
Odds of the US invading Iran spook markets
As tensions escalated, the odds of a U.S. invasion surged to 63% on the platform Polymarket. This is starting to weigh on investor sentiment across markets, including cryptocurrencies.
Brent crude oil, a widely used pricing benchmark in the global spot oil market, remains elevated, closing Thursday at more than $109 per barrel. With trading scheduled to resume on Monday, the latest developments could further pressure markets and put Bitcoin’s short-term recovery at risk.
The flagship crypto has recovered from last week’s lows near $66,000 and was trading just below $69,200 at press time. The total crypto market cap was up 2.2% during the same period.
Barclays planning return to high street branches
XRP (XRP) Sees Whale Accumulation Despite 60% Drop From Peak

Disney+’s Gritty Crime Thriller Proves the Franchise’s Darkest Stories Are Its Best

Smart energy pays enters the US market, targeting scalable financial infrastructure

Why Israel is blocking foreign journalists from entering

Bitcoin: We’re Entering The Most Dangerous Phase

How to Pay Off Debt Faster | Money Mistakes to Avoid | Secrets to Financial Freedom | Revanth

GOLD AND CRYPTO LIVE TRADING || 30 MARCH || Bitcoin Live Trading | Crypto Market Analysis |

Trust Money Login Problem || Trust Money Password Expired || Trust Money New Apps Update
-

 NewsBeat4 days ago
Steven Gerrard disagrees with Gary Neville over ‘shock’ Chelsea and Arsenal claim | Football
-

 Business3 days ago
No Jackpot Winner and $194 Million Prize Rolls Over
-

 Fashion3 days ago
Weekend Open Thread: Spanx – Corporette.com
-
Entertainment7 days ago
Fans slam 'heartbreaking' Barbie Dream Fest convention debacle with 'cardboard cutout' experience
-

 Crypto World4 days ago
Gold Price Prediction: Worst Month in 17 Years fo Save Haven Rock
-

 Business7 hours ago
Three Gulf funds agree to back Paramount’s $81 billion takeover of Warner, WSJ reports
-
Crypto World6 days ago
Dems press CFTC, ethics board on prediction-market insider trades
-

 Sports1 day ago
India men’s 4x400m and mixed 4x100m relay teams register big progress | Other Sports News
-

 Business4 days ago
Login and Checkout Issues Spark Merchant Frustration
-

 Tech7 days ago
Apple will hide your email address from apps and websites, but not cops
-

 Tech6 days ago
EE TV is using AI to help you find something to watch
-

 Sports6 days ago
Tallest college basketball player ever, standing at 7-foot-9, entering transfer portal
-

 Politics6 days ago
Should Trump Be Scared Strait?
-

 Tech6 days ago
Flipsnack and the shift toward motion-first business content with living visuals
-
Tech6 days ago
Daily Deal: StackSkills Premium Annual Pass
-

 Fashion7 days ago
The Best Spring Trends of 2026
-

 Crypto World6 days ago
U.S. rule change may open trillions in 401(k) funds to crypto
-

 Sports6 days ago
Women’s hockey camp eyes fitness boost, tactics ahead of WC 2026 campaign | Other Sports News
-

 Politics7 days ago
BBC slammed for ignoring author of The Fraud
-

 Tech6 days ago
How to back up your iPhone & iPad to your Mac before something goes wrong
You must be logged in to post a comment Login