
Crypto World
The Real Edge in DeFi Trading

Decentralized finance has a reputation for fast money, explosive yields, and dramatic price swings. Social feeds amplify entry signals, token calls, and screenshots of 10x gains. But beneath the noise lies something far more consistent — and far less glamorous.
The real edge in DeFi trading isn’t a secret indicator.
It’s an understanding structure.
DeFi Is a System of Incentives
Unlike traditional markets, decentralized finance runs on programmable incentives. Protocols aren’t just marketplaces — they are engineered ecosystems designed to attract, direct, and reward capital.
Capital flows based on:
When emissions are high, liquidity floods in. When rewards decline, capital rotates out. Price movements often follow these structural changes more than narratives or social sentiment.
In other words, DeFi participants — especially yield farmers — respond to return optimization, not brand loyalty.
If you track incentives, you track liquidity migration.
Liquidity Is More Important Than Price
Most retail traders focus on price charts. But in DeFi, liquidity is often the more critical variable.
Liquidity determines:
-
Slippage severity
-
Volatility intensity
-
Liquidation cascades
-
Manipulation risk
Thin liquidity environments amplify volatility. Large trades move markets aggressively. Stop losses get hunted. Liquidations cascade faster.
Deep liquidity environments, on the other hand:
Experienced traders look for liquidity pockets, not just price patterns. Because large players target liquidity zones — that’s where capital can enter or exit efficiently.
Volatility Is Often Engineered
In decentralized finance, volatility isn’t always organic. It is frequently linked to:
A major unlock can introduce supply pressure. A change in staking yield can alter token demand. A governance proposal can shift long-term value capture assumptions.
When traders understand these structural drivers, they can anticipate moves before charts fully reflect them.
The Role of Automated Systems
In DeFi, you are not trading against human emotion alone. You are interacting with:
-
Automated Market Makers (AMMs)
-
Liquidation bots
-
MEV (Maximal Extractable Value) searchers
-
Arbitrage algorithms
-
Yield optimization strategies
These systems operate on logic, not feelings. They react instantly to mispricings and inefficiencies.
If you do not understand how automated liquidity pools price assets or how liquidations are triggered, you are exposed to risks invisible on a standard chart.
Studying protocol mechanics often provides more edge than studying technical indicators.
Tokenomics Over Hype
Many DeFi tokens struggle not because the product fails, but because the token design is misaligned.
Critical factors include:
High emissions with low utility create sales pressure. Weak value capture models disconnect the token price from protocol revenue.
Understanding tokenomics helps determine whether appreciation is structurally supported — or temporarily subsidized.
Risk Management: The Unpopular Advantage
The most consistent performers in DeFi often rely on fundamentals that are not exciting:
-
Strict position sizing
-
Diversification across protocols
-
Tracking unlock calendars
-
Monitoring treasury and whale wallets
-
Entering during forced selling events
-
Exiting during peak incentive periods
DeFi markets can reward boldness, but they punish recklessness.
Volatility can multiply gains — or erase capital quickly. Sustainable trading requires structure, not adrenaline.
The Real “Hidden Secret”
There is no mystical alpha channel.
The consistent edge in decentralized finance comes from understanding:
DeFi is programmable finance. Its behavior is shaped by design.
Traders who study the architecture — not just the candles — operate with informational clarity. Those who trade only momentum often become liquidity for those who understand the system.
In the end, decentralized finance rewards structural awareness more than prediction.
And that’s the closest thing to a secret it has.
REQUEST AN ARTICLE

Bitcoin (BTC) holders are gradually becoming less prone to panic selling and instead building up cash buffers to deploy during discounted BTC buying opportunities. Onchain data supports this view, highlighting a large surge in stablecoin activity, with USD Coin (USDC) and Tether’s USDt (USDT) transfers reaching a combined $440 billion on March 22.
This shift in investor behavior aligns with the increasing risk-off approach seen in markets as the United States Federal Reserve dismissed near-term interest rate cut expectations, amid rising energy prices due to the ongoing US and Israel-Iran war.
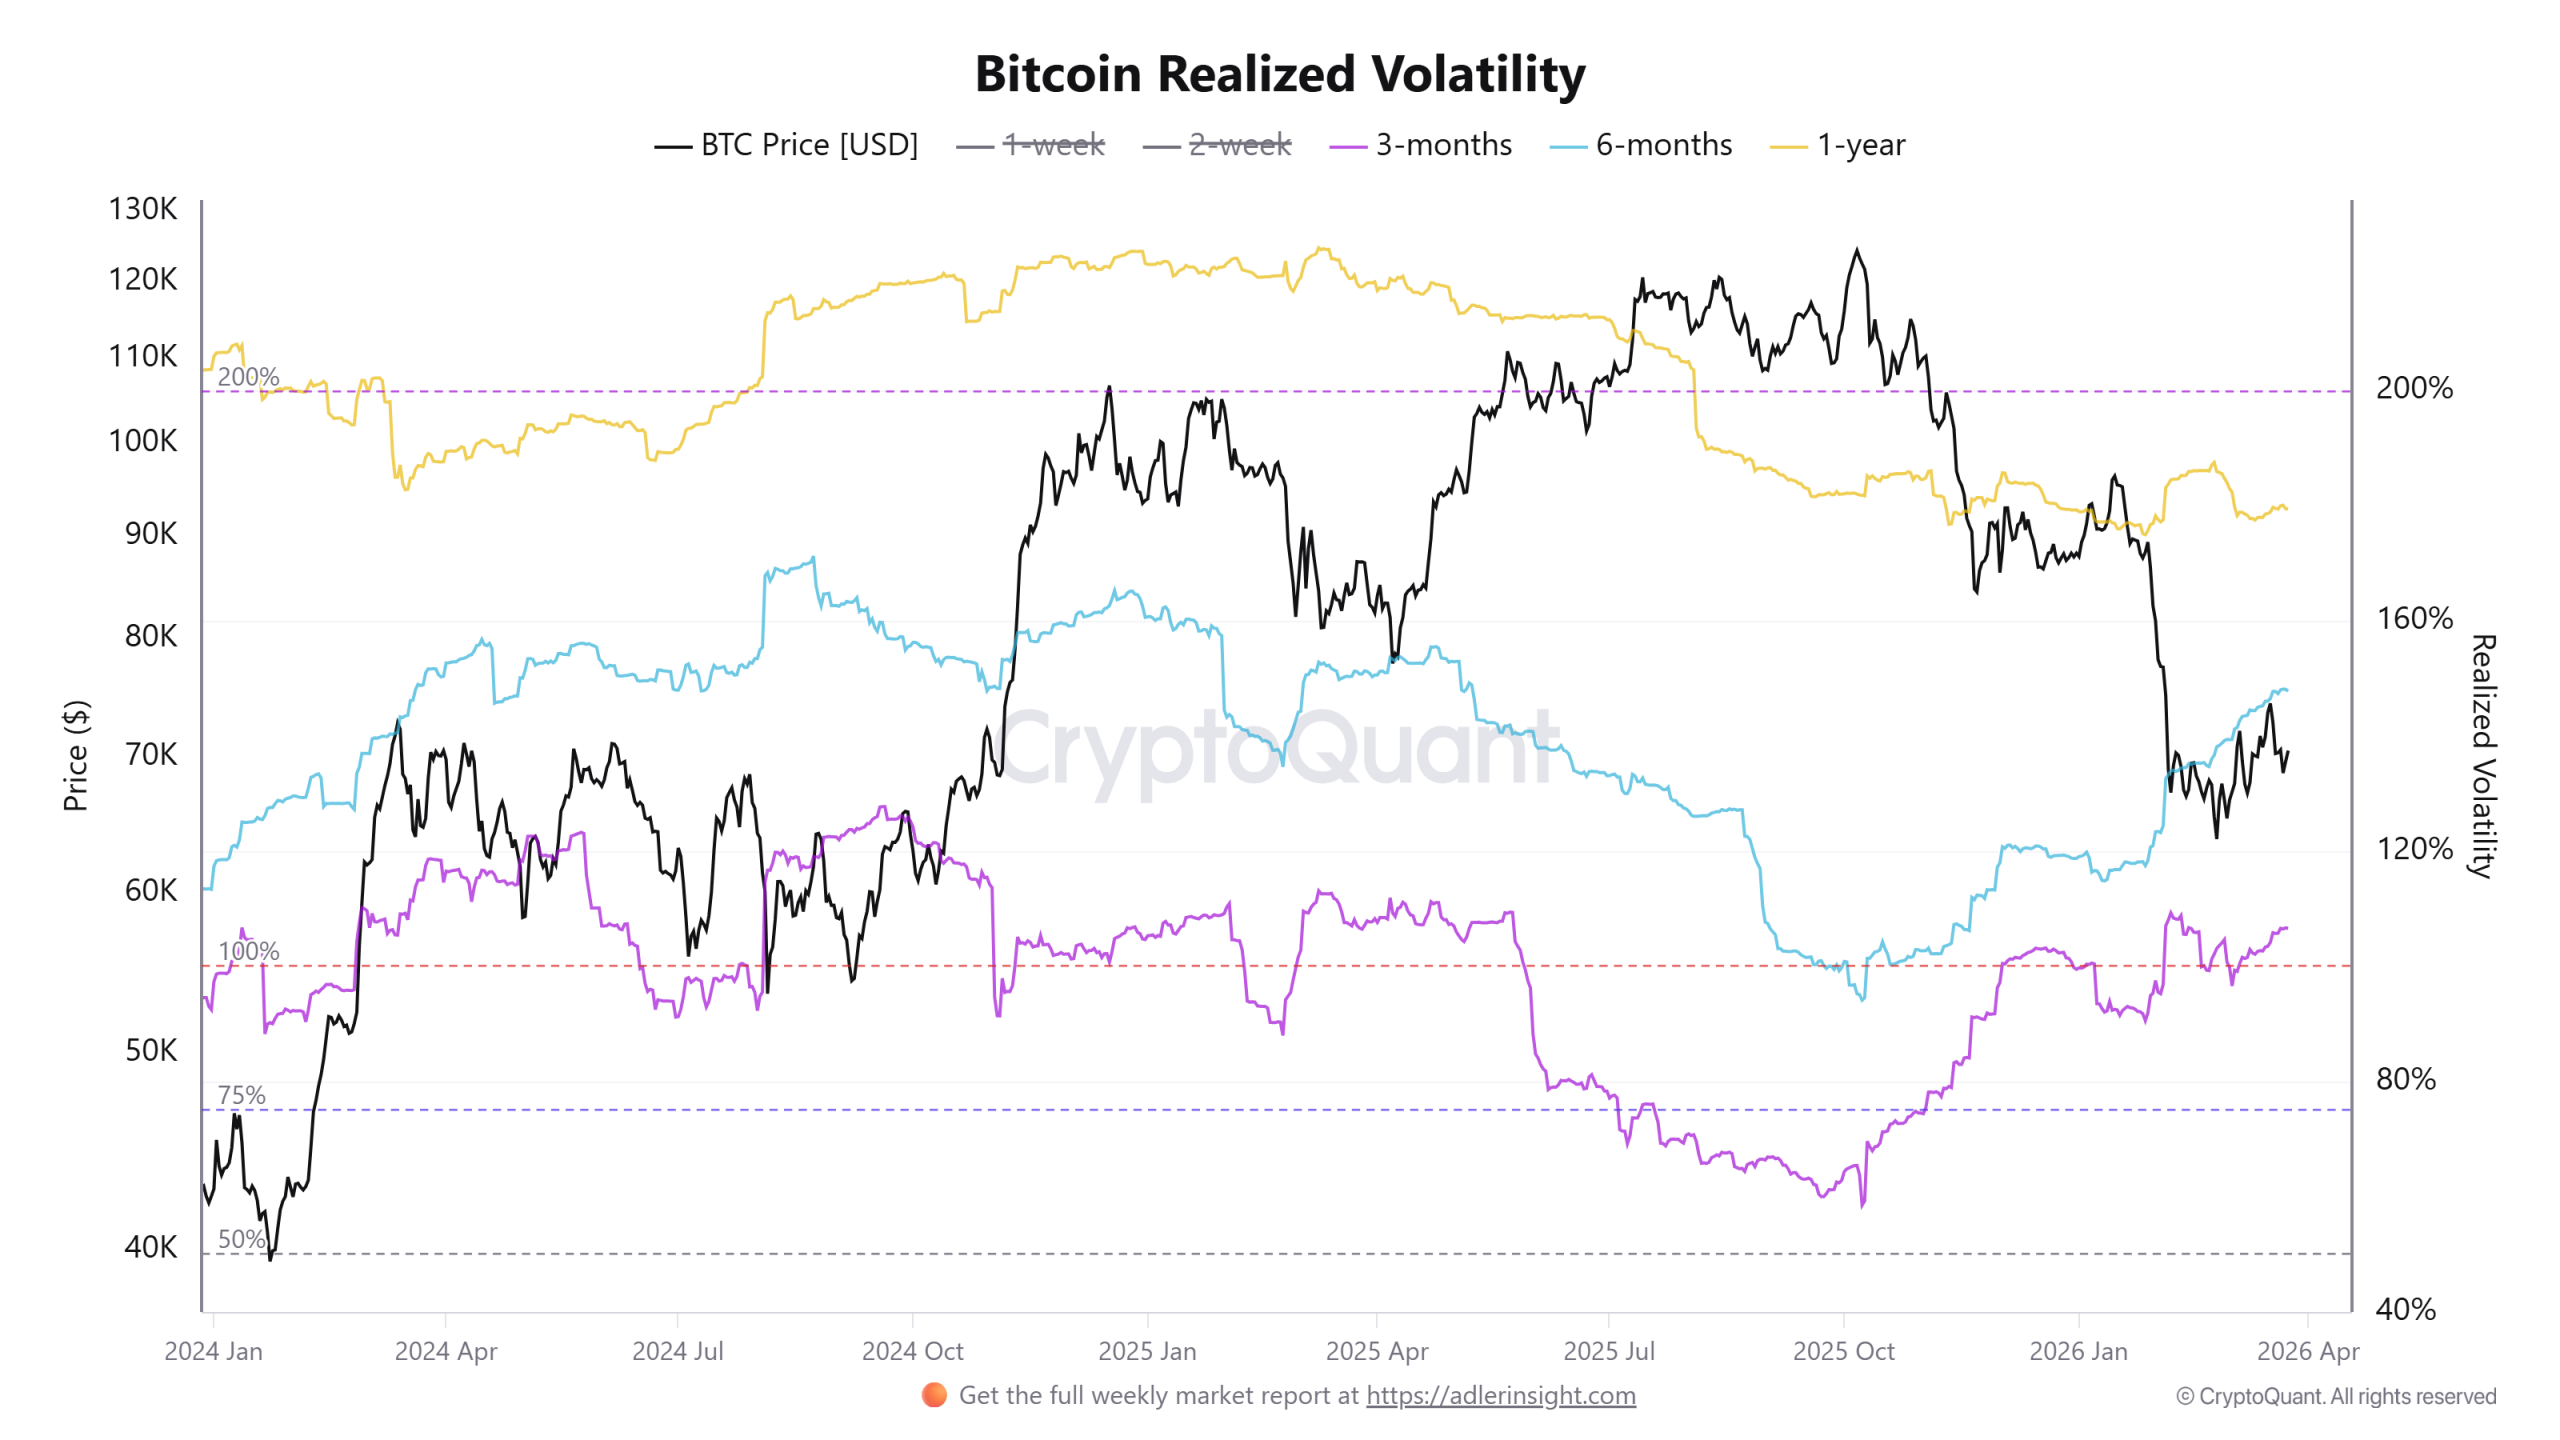
Bitcoin realized volatility expands, but investors are cool headed
Bitcoin’s recent price action highlights a volatile market. It dropped 3.75% to $67,300 on Sunday before rebounding above $71,700 on Monday, with the move largely driven by news around the US and Israel-Iran war.
As a result, BTC’s realized volatility, which measures how much the price has actually moved over a given period, remains elevated across multiple time frames. The three-month and six-month realized volatility measures have climbed to 107% and 148%, respectively, up from 60% and 94.5% over the past six months.

However, the long-term one-year realized volatility has remained unchanged near 180% during this period. That suggests the market isn’t in full panic mode, and it is dealing with uncertainty without widespread forced selling.
Stablecoin flows provide important context for this environment. On March 22, the total number of USDC tokens transferred surged to 368 billion, marking a roughly 2,081% daily increase to an all-time high, while USDT transfers on the Ethereum network reached 72 billion.

These stablecoin flows point to a rapid capital rotation and repositioning. The market participants are actively moving funds into stablecoins as a temporary store of value, creating a “cash buffer” that can be redeployed quickly.
This dynamic often emerges in volatile conditions, where traders may prioritize monitoring the price over high exposure.
Related: What happens to Bitcoin if US bond yields soar above 5%?
Spot and futures activity remain below bull market highs
Futures data further reinforces the current sidelined sentiment. BTC open interest (in USD) is down $19 billion over the past six months, indicating a steady reduction in leveraged exposure. This unwind reflects a market that is de-risking rather than building aggressive positions.

Aggregated funding rates have cooled to 0.01% from overheated levels near 0.1% in July-August 2025, occasionally flipping negative, while the perpetual futures premium continues to trade at a discount to spot.
Together, these signals point to subdued leverage demand and a market lacking strong directional conviction, with a slight bearish tilt.
The spot market activity paints a similar picture. Cointelegraph reported that Binance is on track to record its lowest monthly spot volume since September 2023, with volumes hovering near $52 billion.
The current participation levels align more closely with periods of reduced engagement seen during prior bear market cycles in 2022-2023.
Thus, the crypto market has strong liquidity, with capital actively moving through stablecoins, but it isn’t being deployed into Bitcoin yet, and BTC holders continue to observe the current market.
Related: Bitcoin value ‘off the chart’ as BTC price metric hits record lows in 2026
This article does not contain investment advice or recommendations. Every investment and trading move involves risk, and readers should conduct their own research when making a decision. While we strive to provide accurate and timely information, Cointelegraph does not guarantee the accuracy, completeness, or reliability of any information in this article. This article may contain forward-looking statements that are subject to risks and uncertainties. Cointelegraph will not be liable for any loss or damage arising from your reliance on this information.


Balancer Labs is shutting down operations. The corporate entity behind the DeFi protocol is winding down after a $128 million exploit on November 3, 2025, made the company a “liability” due to mounting legal exposure.
Co-founder Fernando Martinelli confirmed the decision Monday, stating that the protocol itself will continue under a decentralized structure. The immediate market reaction has been brutal, with liquidity providers exiting V2 pools as confidence in the centralized entity evaporates.
- Exploit Impact: A rounding error in swap logic drained $128 million from V2 pools across multiple chains.
- Restructuring Plan: Balancer Labs dissolves; core team migrates to a new OpCo subject to DAO approval.
- Protocol Viability: Despite the shutdown, the protocol generates over $1 million in annualized fees.
Balancer Labs $128M Exploit: How Attackers Broke the Vault
The November 3 attack was surgical.
Attackers exploited a rounding flaw in Balancer’s swap logic across V2 pools on 6 different blockchains. Within 30 minutes, $128 million in user funds was gone. The vector was a pricing error in stable pools manipulated to drain liquidity. Not a flash loan. A fundamental flaw in the vault’s math.
Balancer founder Fernando Martinelli did not sugarcoat the post-mortem. “What failed was not the technology,” he wrote. “What failed was the economic model wrapped around it.” The accumulated weight of security incidents has turned the corporate entity from a development shield into a litigation target.
The market signal is bearish. BAL is facing renewed sell pressure as holders digest the dissolution of the primary development entity. TVL has contracted sharply since November with capital rotating into Curve and Uniswap.
Two scenarios from here.
If the DAO cannot execute a swift tokenomics overhaul, $1 million in annualized fees will not sustain development. The protocol becomes a zombie chain. If the proposed elimination of BAL emissions and a buyback program lands correctly, the shutdown gets repriced as a bottom signal and the token resets.
DEX volume across aligned ecosystems is plunging. Liquidity is fragmenting. If Balancer cannot stabilize its TVL, capital flight accelerates into more defensive stablecoin pools elsewhere.
Sellers control the tape until the restructuring is finalized.
Contagion Risk: Who Is Exposed to the Collapse?
Shutting down Balancer Labs removes the legal target. It does not fix the credit risk.
Protocols building on Balancer’s programmable liquidity are now interacting with a headless entity run purely by governance. For institutional LPs, losing a corporate counterparty increases perceived risk. Martinelli confirmed it himself. The lab had become a liability operating without revenue. The old DeFi development model is dead.
The pivot is radical. Balancer Labs dissolves. Core team members transition to a new entity called Balancer OpCo, pending a governance vote. BAL emissions get zeroed out. The veBAL governance model, which had been dominated by bribe markets, gets scrapped entirely.
Martinelli’s argument is straightforward. The technology still works. The protocol is revenue-positive. The shutdown unbundles the code from the legal baggage of the exploit and hands control to the DAO.
The technology survived. The company did not.
Balancer is now a live test case for whether a major DeFi protocol can outlive its own corporate death and function purely as code. If the governance vote fails to establish the OpCo, the protocol does not fade gracefully. It drifts into irrelevance with no one left to steer it.
The vote is the only thing that matters right now.
Discover: The best new crypto in the world
The post Balancer Labs to Shut Down After $128M Exploit, Plans Lean Restructuring appeared first on Cryptonews.


A down day in crypto became slightly less so in the minutes since U.S. stocks closed for the session.
According to Israeli Channel 12, a one-month ceasefire could soon be announced as part of a package being negotiated by White House envoys Steve Witkoff and Jared Kushner.
Other terms of the deal reportedly include a dismantling of Iran’s existing nuclear capabilities and that country’s vow to “never seek” nuclear weapons.
The news was felt most immediately in the oil market, with Brent Crude dropping from $104 to below $100 in a few minutes.
Trading down throughout the day and sitting near $69,000, bitcoin quickly popped back to $70,000. U.S. stock index futures also posted small gains on the news.

TLDR
- Microsoft shares fell about 2.5% and traded near $373 during Tuesday’s session.
- Major U.S. indices moved lower as renewed geopolitical tensions pressured technology stocks.
- Reports said Iran started charging transit fees in the Strait of Hormuz, raising trade concerns.
- The Manufacturing PMI rose to 52.4, beating expectations of 51.5 and signaling expansion.
- Despite strong economic data, broader market weakness kept MSFT stock under pressure.
MSFT stock declined on Tuesday as broader markets retreated and geopolitical risks resurfaced. The stock fell about 2.5% to nearly $373 during the session. Traders reacted to renewed tension in the Middle East and weakness across major technology names.
MSFT Stock Drops as Geopolitical Tensions Weigh on Tech
MSFT stock moved lower as major U.S. indices reversed earlier gains. The Dow Jones, S&P 500, and Nasdaq each closed in negative territory. Reports tied the selloff to rising tensions linked to Iran. News from the Strait of Hormuz added pressure on global trade routes.
Authorities reported that Iran began charging transit fees for vessels in the region. That development raised concerns about shipping costs and energy prices. Consequently, large-cap technology stocks faced renewed selling pressure. Companies within the “Magnificent Seven” group traded lower during the session.
Nvidia, Apple, and Amazon have already posted declines between 12% and 13% this year. Those losses have trailed the broader S&P 500 index performance. Market participants often move these stocks together during uncertain periods. As risk appetite weakens, traders reduce exposure to high-growth sectors.
Microsoft traded in line with its mega-cap peers during the pullback. The company did not release new corporate updates on Tuesday. However, broader macro headlines influenced price action. As a result, the stock reflected general market direction rather than company-specific developments.
Strong PMI Data Fails to Lift MSFT Stock
The latest Manufacturing Purchasing Managers’ Index showed continued expansion. The PMI reading came in at 52.4 for the month. Economists had expected a reading of 51.5. The previous figure stood at 51.6.
A PMI reading above 50 indicates expansion in manufacturing activity. The latest data suggested stable demand and steady production levels. Despite the stronger reading, equities did not rally. Instead, geopolitical headlines dominated trading decisions.
Market analysts pointed to a shifting focus during the session. “Geopolitical risks are driving short-term sentiment,” one market strategist said. Economic data often supports long-term growth projections. However, traders prioritized global developments during Tuesday’s session.
Microsoft continues to expand its Azure cloud platform. The company also integrates automation tools across enterprise products. These initiatives support revenue growth targets. Still, Tuesday’s price movement reflected broader market conditions.
MSFT stock closed near $373 after the 2.5% decline. Trading volume remained consistent with recent sessions. The PMI report remains the latest major economic release influencing markets.

Chair Michael Selig said that the task force was an example of “future-proofing“ regulation at the Commodity Futures Trading Commission.
The US Commodity Futures Trading Commission (CFTC) is looking to embrace innovation in its regulatory approach to crypto and blockchain with the launch of a new Innovation Task Force, according to a Tuesday notice.
Chair Michael Selig said that the task force will work with the regulator’s Innovation Advisory Committee to create a framework focused on crypto, blockchain, AI, and prediction markets. The effort will be led by Michael Passalacqua, who joined the CFTC as a senior adviser in January after working on crypto and blockchain issues at international law firm Simpson Thacher & Bartlett.
“The idea behind our innovation advisory task force is really to create a space where innovators and builders can come in and talk to the staff,” Selig told attendees at the Digital Asset Summit in New York City on Tuesday. “It’s not just crypto — it’s going to be prediction markets, crypto, and AI. We think these three verticals are really important.”

The move comes more than a year after the US Securities and Exchange Commission (SEC) launched its own task force focused on crypto regulation, just one day after US President Donald Trump took office, and SEC Commissioner Mark Uyeda took the reins as acting chair from former Commissioner Gary Gensler. The SEC task force, headed by Commissioner Hester Peirce, included Selig as chief counsel at the time before he was nominated by Trump to chair the CFTC.
Related: SEC task force met with Trump-supporting firms to discuss crypto regulation
Regulators work on crypto rules as market structure legislation remains stuck
The CFTC’s announcement comes on the heels of an SEC interpretative notice last week that proposed that the agency would not consider most crypto asset securities under federal law. SEC Chair Paul Atkins called the measure a “bridge” to clarify crypto regulation in the absence of Congressional action on a comprehensive digital asset framework.
The market structure bill, called the CLARITY Act when it passed the House of Representatives in July 2025, has effectively been stalled in the Senate amid debates over stablecoin yield, ethics, tokenized equities, and other issues. While some proponents of the legislation have said policymakers were closer to reaching an agreement, it was unclear as of Tuesday if or when it would reach the Senate for a full floor vote.
Magazine: Banks want to run Vietnam’s crypto exchanges, Boyaa’s $70M BTC plan: Asia Express


Circle is partnering with Sasai Fintech to expand the use of its USDC stablecoin across African payment corridors, targeting remittances, business transactions and mobile wallet services.
According to Tuesday’s announcement, collaboration will integrate the second-biggest stablecoin into Sasai’s existing payments infrastructure, which supports cross-border transfers, enterprise payments and consumer wallets, with the aim of reducing costs and settlement times.
Sasai operates across multiple African markets, providing digital payments services that will integrate with Circle’s onchain infrastructure.
The companies said they will explore practical applications for USDC (USDC) using Circle’s full-stack platform, as stablecoin usage grows in Africa alongside rising demand for cross-border payments and mobile-first financial services.
The United Nations has set a target of reducing average remittance transaction costs to less than 3% globally. However, costs remain high, particularly in Sub-Saharan Africa, according to the World Bank. “Sierra Leone, Uganda, Angola, Botswana, and Zambia are among the economies with the highest transaction costs, all greater than 7% in 2023,” according to a World Bank June 2025 report.
Circle CEO Jeremy Allaire said the company is focusing on high-growth payment corridors in emerging markets, while Cassava Technologies Chairman Strive Masiyiwa said the integration could expand access to digital financial services for businesses and consumers.
Data from DefiLlama shows USDC is the second-largest stablecoin by market capitalization at around $78.6 billion, trailing only Tether’s USDT (USDT) at about $184.1 billion.
Related: Africrypt founders back in South Africa years after platform collapse: Report
The rise of crypto and stablecoins in Africa
Crypto adoption in Sub-Saharan Africa has accelerated sharply, up 52% in the 12 months through June 2025, with the region receiving more than $205 billion in onchain value, according to a Chainalysis report from September.
Nigeria accounted for over $92 billion of that activity, followed by South Africa, Kenya, Ethiopia and Ghana, with usage largely driven by remittances, cross-border payments and demand for hedging against currency volatility.
The growth is drawing increased interest from crypto companies expanding into the region. Earlier this month, Blockchain.com entered Ghana as part of its broader African push, following more than 700% growth in brokerage transaction volume in Nigeria since launching retail services there.
Regulators are also beginning to formalize the sector. In March, Ghana’s Securities and Exchange Commission approved 11 crypto trading platforms to enter a regulatory sandbox under its newly adopted Virtual Asset Service Providers Act.
At the user level, both Bitcoin and stablecoins are gaining traction for everyday financial use. In January, former UN under-secretary-general Vera Songwe said remittances have become “more important than aid” in Africa, with stablecoins emerging as a faster, lower-cost alternative to traditional transfers.
Speaking on Natalie Brunell’s Coin Stories podcast in March, Africa Bitcoin Corporation executive chairman Stafford Masie said Bitcoin is used as money in some local economies.
Magazine: Are DeFi devs liable for the illegal activity of others on their platforms?


Activity-based rewards are allowed, but anything ‘economically equivalent to interest’ is barred.
Crypto industry leaders reviewed the draft stablecoin yield language in the Digital Asset Market Clarity Act during a closed-door session on Capitol Hill on Monday, and the opening reaction was that the text was overly narrow and unclear, according to CoinDesk.
The draft, negotiated by Senators Thom Tillis (R-N.C.) and Angela Alsobrooks (D-Md.), bans yield payments for simply holding a stablecoin and restricts any structure that is economically equivalent to a bank deposit, CoinDesk reported. Activity-based rewards tied to loyalty programs, promotions, subscriptions, transactions, and platform use remain permitted, but the mechanics for determining what qualifies as a valid activity remain uncertain.
Circle shares fell 19%, while Coinbase dropped 8% on Tuesday after the draft raised the prospect of strict limits on stablecoin yield.
Coinbase CEO Brian Armstrong, who pulled the company’s support for the Clarity Act in January over yield restrictions, causing the Senate Banking Committee to postpone its markup, has yet to comment on the new text. Stablecoin-related revenue represented roughly 20% of Coinbase’s total revenue in Q3 2025.
The stablecoin yield question had been the single largest obstacle blocking the Clarity Act’s path through the Senate since January. Banks, led by the American Bankers Association, argued that stablecoin rewards could siphon deposits from traditional savings accounts. JPMorgan and Bank of America executives cited a Treasury study indicating that banks could lose up to $6.6 trillion in deposits if stablecoins offered unregulated yields, CNBC reported.
The GENIUS Act, signed into law in July 2025, barred stablecoin issuers from paying interest directly to holders but did not prevent third-party platforms from offering rewards — a gap that experts warned would become a key regulatory battleground.
What’s Next
The deal clears the primary hurdle for a Senate Banking Committee markup, now tentatively targeted for late April after the Easter recess. The bill had already been unlikely to advance before then, as Senate Majority Leader John Thune indicated earlier this month.
From there, the bill faces a full Senate floor vote requiring 60 votes, reconciliation with the Senate Agriculture Committee’s version passed in January, reconciliation with the House version that passed 294-134 in July 2025, and a presidential signature.
Polymarket currently prices the odds of the Clarity Act being signed into law in 2026 at roughly 63%.
This article was written with the assistance of AI workflows. All our stories are curated, edited and fact-checked by a human.


The new unit will coordinate policy development and work alongside the SEC’s Crypto Task Force.
The U.S. Commodity Futures Trading Commission (CFTC) on Tuesday announced the formation of an Innovation Task Force aimed at developing clearer regulatory frameworks for crypto assets, artificial intelligence, and prediction markets within U.S. derivatives markets.
“By establishing a clear regulatory framework for innovators building on the new frontier of finance, we can foster responsible innovation at home and ensure American market participants are not left on the sidelines,” Chairman Michael Selig said in a statement.
The unit will operate alongside the CFTC’s Innovation Advisory Committee, which was formed in February and includes more than 30 executives, including Kalshi CEO Tarek Mansour and Nasdaq CEO Adena Friedman.
According to the agency, the task force will concentrate on crypto assets and blockchain technology, artificial intelligence and autonomous systems, and prediction markets and event contracts.
The task force will also coordinate with other federal bodies, most notably the SEC and its Crypto Task Force, as both agencies continue to align their regulatory postures.
Interagency Alignment
The announcement extends a run of coordinated action between the two regulators. Earlier this month, the SEC and CFTC signed a memorandum of understanding formalizing their commitment to jointly oversee the digital asset sector.
That MOU followed the SEC’s March 17 interpretive release — arguably its most consequential crypto guidance to date — which classified 16 major tokens, including BTC, ETH, and SOL, as digital commodities that fall outside the SEC’s jurisdiction and are under the purview of the CFTC. The CFTC said it would administer the Commodity Exchange Act consistently with that framework.
Selig had telegraphed much of this agenda at the Milken Institute on March 3, where he said the CFTC was “modernizing” its rules to accommodate DeFi protocols and on-chain market infrastructure.
Prediction Markets in Focus
The inclusion of prediction markets as a core pillar of the task force underscores the CFTC’s intensifying push to assert federal jurisdiction over the rapidly growing sector. The agency launched a sweeping review of prediction markets on March 12 via an advance notice of proposed rulemaking.
Selig has also taken a combative stance against state gaming regulators that have challenged prediction market platforms, filing a friend-of-the-court brief in February in support of Crypto.com against the Nevada Gaming Control Board and warning that the CFTC “will no longer sit idly by” while states undermine its exclusive jurisdiction.
The momentum has coincided with major commercial developments in the space. Last week, Major League Baseball named Polymarket its exclusive prediction market partner and signed its own information-sharing MOU with the CFTC — a first for a professional sports league and the derivatives regulator.
The task force also arrives days after the CFTC granted no-action relief to Phantom, allowing the self-custodial Solana wallet to connect users to derivatives trading through registered market participants without having to register as a broker.
This article was written with the assistance of AI workflows. All our stories are curated, edited and fact-checked by a human.

Spanish authorities have taken a significant step in a high-profile, crypto-linked abduction case by detaining a suspect in Benalmádena, Málaga province, under a European arrest warrant issued by France. The man is accused of involvement in the kidnapping and torture of Ledger co-founder David Balland, with attackers demanding a 10 million euro ransom.
Balland was abducted from his home in central France on January 21, 2025, and held in captivity until a police operation freed him on the night of January 22. The case has since evolved into a cross-border pursuit, drawing in French and Spanish investigators as they unravel a network tied to the crime. French authorities had previously identified and arrested other members of the group, with the remaining suspect believed to have fled to Spain to evade capture, according to Spain’s Civil Guard.
The Civil Guard’s statement underscored the scale and risk of the operation, noting the suspect’s dangerousness and the potential for the criminal organization to attempt a violent rescue. The suspect was located in Benalmádena after authorities traced movements across several Spanish provinces, a thread that points to a coordinated, pan-European effort to dismantle the group behind Balland’s capture.
The arrest marks a notable juncture in a case that has drawn attention for its intersection with the broader crypto-security landscape in Europe. It also reflects an ongoing pattern of cross-border policing cooperation aimed at disrupting communities that leverage crypto networks for illicit activities. Balland’s kidnapping, and the ransom demand, amplifies concerns around the safety of prominent figures in the crypto space and the vigilance required by startups and investors alike. Cointelegraph previously reported on Balland’s abduction and release in January 2025.
Key takeaways
- The suspect was detained in Benalmádena, Spain, under a European arrest warrant issued by France, linked to the Balland kidnapping case.
- David Balland, Ledger co-founder, was abducted from central France on January 21, 2025, and released by police on January 22, with a ransom demand of 10 million euros.
- Investigators traced the suspect’s movements across Valencia, Seville, and Cádiz before the arrest, including use of rental apartments and a third-party bank card to avoid detection.
- The arrest comes amid a broader wave of crypto-linked crime in France during 2025, including a June arrest campaign involving 25 suspects in crypto-related kidnappings and other related incidents.
- The case illustrates the growing security risks facing crypto figures and the value of cross-border cooperation in pursuing organized criminal networks tied to the crypto ecosystem.
Cross-border pursuit: from France to Spain
Authorities described a long-running, transnational chase that culminated in the suspect’s detention in the Andalusian town of Benalmádena. The operation required substantial resources due to the suspect’s perceived danger and the risk of intervention by associates who might attempt to free him. The investigation traced the individual through the Valencia region, where he lived with a partner and a friend, and noted that the group had minimized their footprint by renting apartments via online platforms and using a third party’s bank card to obscure financial links.
French investigators had already identified several other members of Balland’s attackers and pursued leads across borders. The French side has emphasized that the remaining suspect initially fled to Spain in an attempt to dodge capture, highlighting the challenges inherent in coordinating legal processes across jurisdictions in time-sensitive, violent-crime scenarios.
Crypto-linked crime in France: a mounting challenge
The Balland case sits within a broader pattern of crypto-linked criminal activity that tightened its grip on Europe’s crypto scene in 2025. In June, French authorities charged 25 suspects in a spree of kidnappings and attempted abductions targeting crypto executives and investors, according to reporting on the period. In another incident, a crypto user was abducted and held for hours in France, with attackers seeking cash and access to a hardware wallet containing a sum of funds. Earlier in the year, the daughter and grandson of Pierre Noizat, former CEO of Paymium, were targeted in an attempted abduction; the victims resisted and escaped. These events collectively elevated concerns about personal safety for crypto figures and the security of crypto-linked assets in real-world spaces.
As authorities pursue these investigations, industry observers are watching for how such criminal activity might influence security practices, governance standards at crypto companies, and the broader risk management landscape faced by the sector. For investors and builders alike, the trend underscores the necessity of robust physical and cyber risk controls, as well as ongoing collaboration with law enforcement to protect personnel and assets involved in the crypto economy. Cointelegraph has covered these developments as part of a wider conversation about security threats in the crypto space.
Implications for the ecosystem and what to watch next
The Benalmádena arrest reinforces the reality that crypto-linked crime extends beyond digital schemes into violent, real-world actions, and it tests the interoperability of European legal frameworks in urgent, cross-border contexts. Stakeholders should monitor how this case informs anti-kidnapping and asset-seizure protocols, as well as the sharing of intelligence between French and Spanish authorities and their counterparts across the EU. The ongoing investigation could yield new details about the operational methods of the criminal network, including how they leveraged crypto-related assets and platforms to finance or conceal their activities.
For the crypto industry, the episode is a reminder of the non-technical risks that surround high-profile figures and firms. As jurisdictions tighten oversight and enforcement actions expand, companies may increasingly emphasize contingency planning, staff security training, and clear incident response playbooks. Observers will also be watching for any further cross-border action tied to Balland’s case and related crypto-crime activity, and for how authorities weigh sanctions, asset tracing, and criminal network disruption in future prosecutions. Earlier coverage by Cointelegraph noted Balland’s abduction and subsequent release, and industry coverage continues to analyze how these developments intersect with regulatory and security dynamics across Europe.
Readers should stay attentive to updates from French and Spanish authorities as the investigation unfolds, and to how prosecutors frame charges or reveal new connections within the broader network involved in crypto-linked violence.


CESR, the Composite Ether Staking Rate, is emerging as Ethereum’s reference rate, underpinning swaps, futures and risk models as institutions chase transparent on‑chain yield.
Summary
- CESR, the Composite Ether Staking Rate, has emerged as a key benchmark for Ethereum staking yields, tracking the mean annualized return earned by active validators.
- The rate captures consensus rewards and priority transaction fees, and is now referenced by institutional derivatives products such as Rho Labs’ ETH staking rate swaps and futures.
- Market participants say CESR is laying the groundwork for a full forward rate curve in crypto, mirroring how LIBOR and SOFR underpin trillions of dollars in traditional finance.
The Composite Ether Staking Rate, or CESR, is rapidly becoming Ethereum’s reference rate, giving institutions a transparent benchmark for staking yields that can underpin loans, swaps and structured products across the crypto market. CoinDesk Indices and CoinFund describe CESR as “a global floating rate benchmark derived from the daily transaction fees and staking rewards emitted from the Ethereum Proof of Stake blockchain,” designed to serve as a neutral yardstick for on-chain income.
CESR sets a staking yield benchmark for Ethereum
The index captures all relevant block rewards paid to validators, including new ETH issuance, transaction fees and maximal extractable value, while also accounting for withdrawals and slashing, and is calculated and published daily, seven days a week.
Chris Perkins, president of CoinFund, called CESR “a defining institutional reference rate for the crypto asset class,” arguing that it can “spur investment product growth and new opportunities for risk management across global finance.” Alan Campbell, president of CoinDesk Indices, said the benchmark is “a foundational piece of infrastructure to crypto-asset markets,” noting that it builds on the firm’s experience running some of the longest-standing digital asset indices. Both executives frame CESR as crypto’s answer to classic interest-rate benchmarks, capable of becoming a new discount rate and allowing assets “across the digital domain to be priced as a relative investment to CESR.”
The benchmark is already being put to work. FalconX said it completed “the first fixed-floating interest rate swap on Ethereum staking yields using CESR,” using the index to hedge and trade the path of staking returns. Rho Labs has launched a liquid staking-rates market that references CESR, with the protocol’s first futures contracts allowing institutional counterparties to lock in fixed returns or speculate on future ETH staking yields. Rho founder Alex Ryvkin said CESR lets traders “manage risk from Ethereum staking yields and transaction costs more efficiently, and lock-in fixed rates of return,” adding that staking yields are “table stakes for serious ETH-based products and services.”
Treehouse Finance notes that CESR effectively captures the mean, annualized staking yield of Ethereum’s validator set, providing a standardized rate that can be slotted into risk models and pricing frameworks alongside traditional benchmarks. Lukka, a provider of institutional crypto data, has also partnered with CoinDesk Indices to distribute CESR to asset managers and analysts, emphasizing that the index incorporates deposits, withdrawals and penalties to deliver “a complete and reliable benchmark” for institutional use. As Perkins put it, “staking rates are to crypto what interest rates are to traditional financial markets,” and CESR is intended to unlock the “$500 trillion traditional rates markets across the crypto industry” by giving yield-focused investors a single, trusted reference point.

Bitcoin Holders Move to Cash as Volatility Remains High

Miss J Alexander Still Open To Repairing Tyra Banks Relationship
Belfast Zoo to get new hop-on, hop-off accessible train


-
 Crypto World4 days ago
NIO (NIO) Stock Plunges 6.5% as Shelf Registration Sparks Dilution Worries
-

 Fashion4 days ago
Weekend Open Thread: Adidas – Corporette.com
-

 Politics4 days ago
Jenni Murray, Long-Serving Woman’s Hour Presenter, Dies Aged 75
-

 Crypto World3 days ago
Best Crypto to Buy Now: Strategy Just Spent $1.57 Billion on Bitcoin During Fear While Early Investors Quietly Enter Pepeto for 150x Potential
-

 News Videos6 days ago
RBA board divided on rate cut, unusually buoyant share market | Finance Report | ABC NEWS
-

 Crypto World3 days ago
Bitcoin Price News: Bhutan Sells $72 Million in BTC Under Fiscal Pressure, but the Smart Money Entering Pepeto Sees What the Market Does Not
-

 Politics6 days ago
The House | The new register to protect children from their abusers shows Parliament at its best
-

 Tech5 days ago
inKONBINI Lets You Spend Summer Days Behind the Register
-

 Crypto World6 days ago
Canada’s FINTRAC revokes registrations of 23 crypto MSBs in AML crackdown
-

 Sports1 day ago
Remo Stars and Kano Pillars Strengthen Survival Hopes in NPFL
-
 NewsBeat6 days ago
Residents in North Lanarkshire reminded to register to vote in Scottish Parliament Election
-

 News Videos6 days ago
PARLIAMENT OF MALAWI – PAC MEETING WITH REGISTRAR OF FINANCIAL ON AMARYLLIS HOTEL – INQUIRY LIVE
-

 Politics5 days ago
Gender equality discussions at UN face pushbacks and US resistance
-

 Business2 days ago
No Winner in March 21 Drawing as Prize Rolls to $133 Million for Next
-

 Business6 days ago
Who Was Alex Pretti? 5 Key Facts About the ICU Nurse Killed by Federal Agents in Minneapolis
-

 Sports1 day ago
Gary Kirsten Accuses Pakistan Cricket Board Of ‘Interference’, Mohsin Naqvi Responds
-

 Tech2 days ago
Give Your Phone a Huge (and Free) Upgrade by Switching to Another Keyboard
-

 Sports4 days ago
2026 Kentucky Derby horses, odds, futures, preview, date: Expert who nailed 12 Derby-Oaks Doubles enters picks
-
Sports6 days ago
Vikings Free Agency Enters Phase 2 with Key Questions
-

 Tech7 days ago
Subnautica 2 might finally be entering early access in May
You must be logged in to post a comment Login