
Crypto World
This Trending Meme Coin Explodes by 100% Weekly: What Comes Next?
Is this the new crypto sensation or just another scam?
The cryptocurrency market experienced a severe pullback in the past few weeks, culminating in a sharp crash on February 6.
The meme coin sector was significantly affected by the red wave, and most leading tokens in that niche have posted substantial losses. However, the lesser-known pippin (PIPPIN) defied the carnage and its valuation soared by over 100% in the past week.
Swimming Against the Tide
PIPPIN is a Solana-based meme coin that began trading in late 2024. It is themed around an AI-generated unicorn character named “Pippin,” which has become the logo of the token.
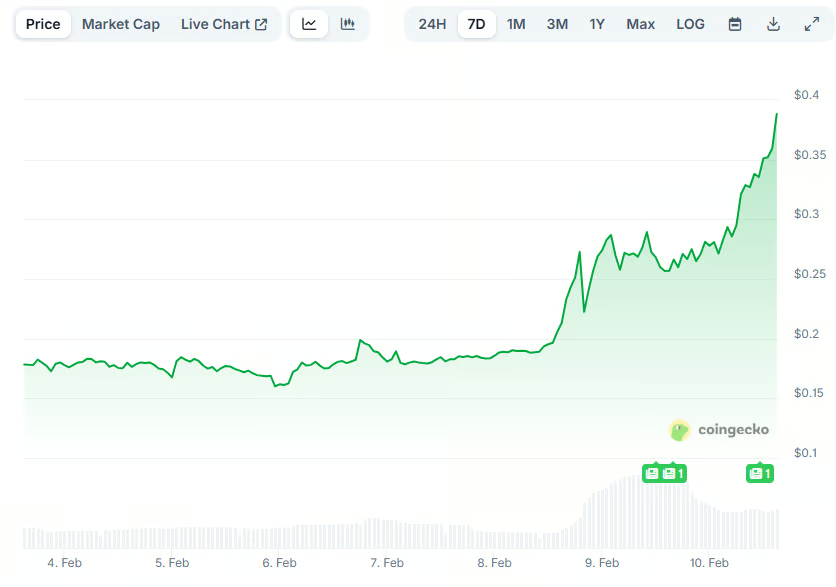
The meme coin had its glory days toward the end of 2025, when its price reached an all-time high of almost $0.60, and its market capitalization surpassed $500 million. While January was also positive, the beginning of February offered a deep correction.
In the past week, though, the asset entered another major uptrend, which contrasts with the overall bearish environment in the crypto market. As of press time, PIPPIN is worth roughly $0.38, or a 114% increase on a weekly basis.

Analysts are curious if the bull run is sustainable since there isn’t an evident catalyst driving the move north. X user ALTS GEMS Alert claimed the price has initiated a “strong bounce” from the demand zone at around $0.26, predicting that if buyers remain active, PIPPIN could soar to $0.40 and even $0.60.
Satori chipped in, too. The analyst told their over 700,000 followers on X that they have added the coin to their watchlist, arguing it has potential for much more impressive gains ahead.
You may also like:
A Ticking Time Bomb?
At the same time, some industry participants warned investors to stay away from PIPPIN, claiming its valuation is driven by pure speculation, and its utility is questionable.
X user Dippy.eth described the asset as “the largest scam of the past year,” arguing it has reached the first “take profit” zone. “0 technologies, 0 real metrics, 0 real users, 0 attention from real CT degens,” they added.
Crypto_Jobs is also pessimistic, envisioning a possible plunge to as low as $0.21. Some indicators, such as PIPPIN’s Relative Strength Index (RSI), support the bearish scenario. The technical analysis tool measures the speed and magnitude of recent price changes to help traders identify potential reversal points.
It ranges from 0 to 100, and readings above 70 suggest the valuation has risen too much in a brief period and could be due for imminent correction. Currently, the RSI stands at around 85.

SECRET PARTNERSHIP BONUS for CryptoPotato readers: Use this link to register and unlock $1,500 in exclusive BingX Exchange rewards (limited time offer).

Crypto World
Dogecoin Price Prediction as MemeCore Flips Shiba Inu in Market Cap, But Pepeto Draws the Same Energy, Is This The Next Dogecoin?

MemeCore just flipped Shiba Inu to become the second largest memecoin by market cap, surging 32% in a single week and proving that meme sector capital rotates fast when a new narrative catches fire according to BSC News. The dogecoin price prediction crowd watched the flip happen in real time while DOGE sat at $0.093 unable to break above $0.10 resistance.
The meme energy that created billions in value during past cycles is now visible around Pepeto, which raised more than $8.69 million with the Pepe cofounder and a Binance listing approaching. The dogecoin price prediction caps at $0.21 for 2026, but analysts project 100x from the presale.
Dogecoin Price Prediction Gets Context as MemeCore Overtakes SHIB and X Money Launches April
MemeCore flipped Shiba Inu’s market cap with an 8% single-day surge and 32% weekly gain, capturing the meme sector rotation that DOGE has failed to attract according to BSC News. Meanwhile, Elon Musk confirmed X Money launches in April with Visa integration across 40 US states and Smart Cashtags for crypto trading on the roadmap, but there is no official confirmation that DOGE will be included as a payment rail according to CryptoNews.
DOGE active addresses jumped 28% in one week from 57,000 to 73,000 according to NewsBTC, but the price has not responded. Meanwhile Qubic’s Dogecoin mining mainnet launched on April 1, promising to make DOGE mining three times faster according to BeInCrypto.
The DOGE forecast waits for X Money to confirm crypto integration, and the exchange that carries the same meme energy with verified tools already built is where the compressed return lives before the listing.
Where the Meme Rotation Meets an Exchange That Delivers What DOGE Never Built
Pepeto: The Next Dogecoin
Despite the correction, the industry pushes forward, and smart traders keep asking which entry gives them what DOGE gave its earliest holders in 2021. Pepeto, with its Binance listing approaching, is not just positioned for near term returns from one event, the exchange is built for daily use that DOGE never offered.
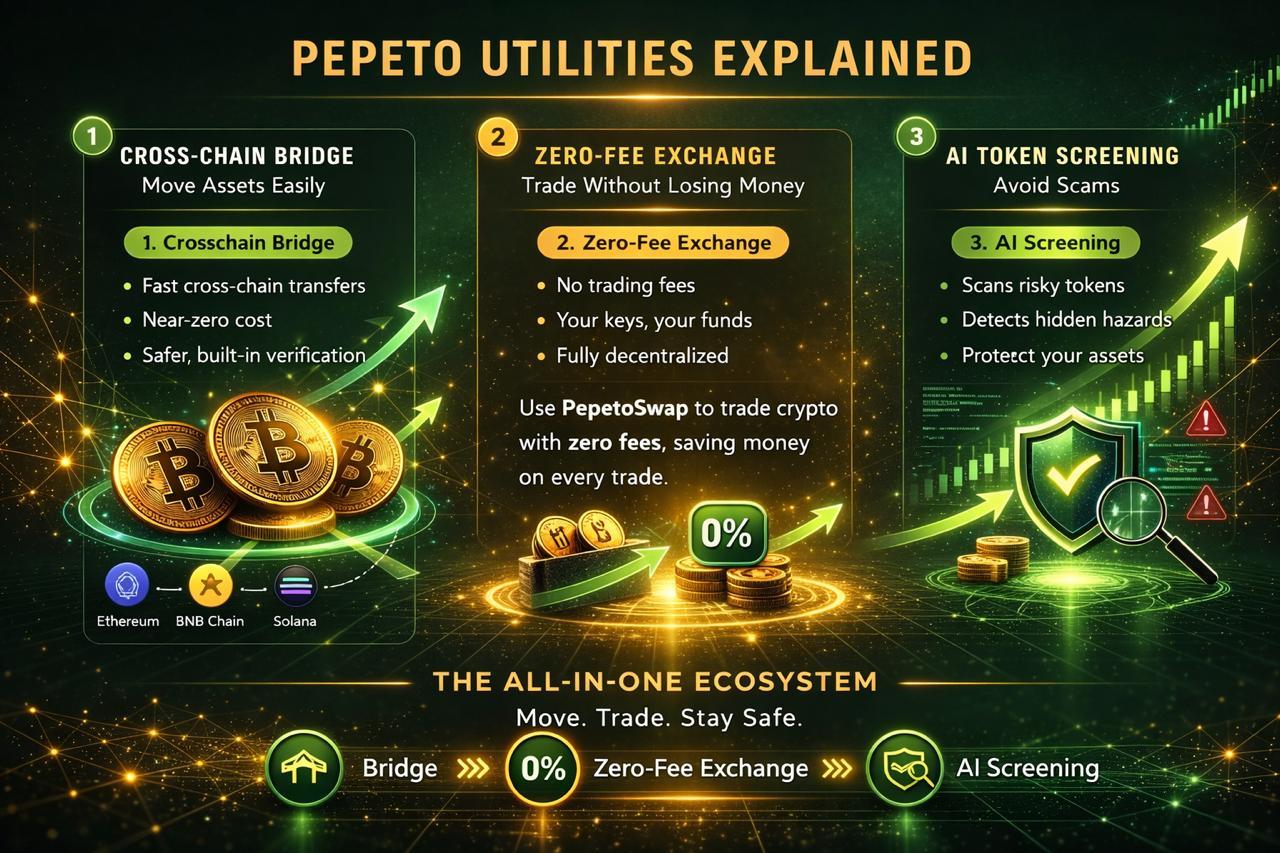
What drives the conviction. The utility works, it is designed for daily trading, and it already runs. The exchange gives verified answers on every contract, with the risk scorer catching traps before your capital moves and PepetoSwap handling every trade at zero fees while the cross chain bridge sends tokens at zero cost. The same meme energy that MemeCore used to flip Shiba Inu overnight is forming around Pepeto, but this time there is a verified exchange behind it that the dogecoin price prediction never had supporting it.
Conviction is peaking. More than $8.69 million entered at $0.000000186 during extended extreme fear, with 190% APY staking compounding early positions. The person who built the original Pepe coin to $11 billion on 420 trillion tokens created the exchange with a former Binance expert, and every contract passed SolidProof’s review. When meme energy alone flipped SHIB’s entire market cap in a single week, imagine what the same force does with a working exchange behind it.
The next Dogecoin Pepeto is the entry where meme energy and verified tools meet in a single project, and the Binance listing turns this presale into the story everyone talks about.
Dogecoin Price Prediction: Can DOGE Hold $0.093 as X Money and Meme Rotation Stay Active?
DOGE trades at $0.093 as of April 1 with the SEC commodity classification confirmed, the 21Shares DOGE ETF live on Nasdaq, and X Money launching in April, according to CoinMarketCap.
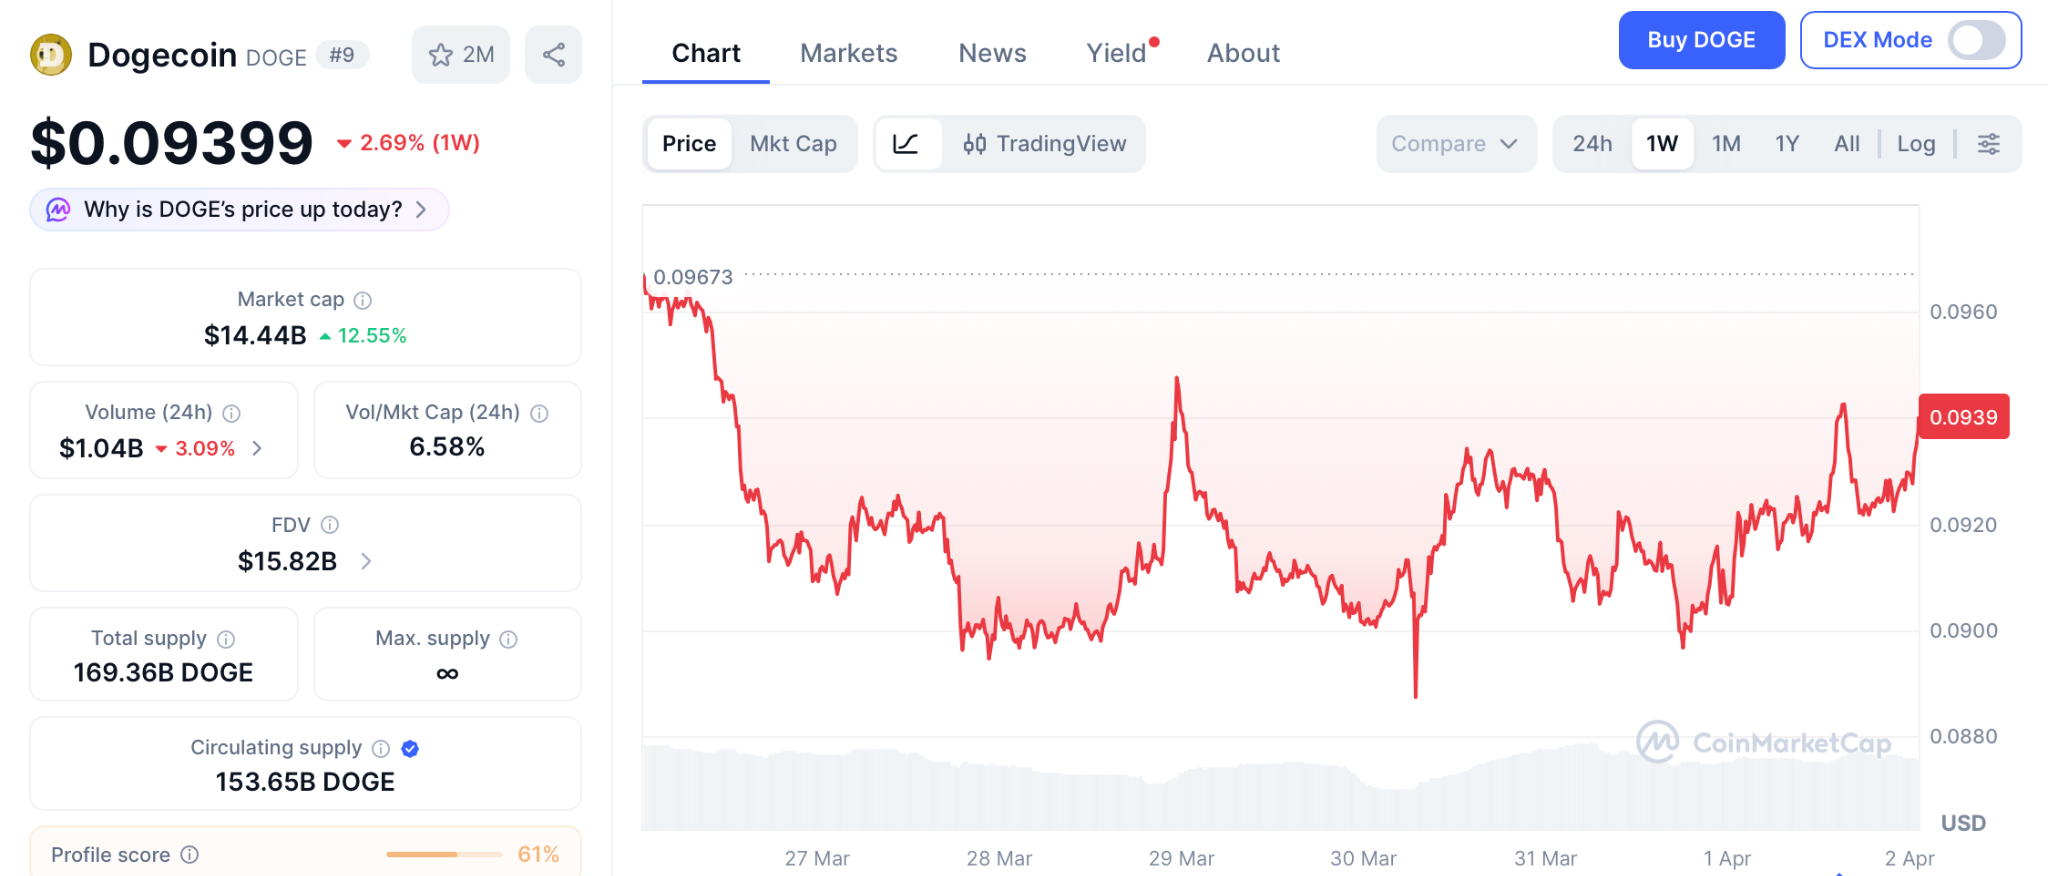
The dogecoin price prediction targets $0.10 as resistance with $0.21 as the 2026 ceiling according to CoinCodex. Support sits at $0.088 with $0.085 below. Active addresses jumped 28% in one week, but Fear and Greed at 8 keeps sellers in control.
The DOGE forecast depends on whether X Money confirms crypto, but even the bullish case takes quarters while the presale delivers 100x from one listing.
Dogecoin Price Prediction Confirms the Smart Money Already Calculated the Outcome and Following Them Is How You Collect
With X Money launching in April and MemeCore proving that meme sector capital rotates violently when a new project catches fire, the environment is the healthiest for meme energy to translate into real returns. Analysts project 100x from the Binance listing, and this may be the last window to enter something that delivers what DOGE delivered in 2021 but with a working exchange this time. More than $8.69 million raised during single digit fear proves the smart money already calculated the outcome.
The wallets that entered SHIB at $0.000007 all say they saw the signal before the crowd, and the same signal flashes now. The Pepeto official website is where following those wallets is how you collect when the listing opens, and entering now is how you capture returns from this cycle.
Click To Visit Pepeto Website To Enter The Presale

FAQs:
What does the dogecoin price prediction show after MemeCore flipped SHIB?
DOGE holds $0.093 while MemeCore overtook SHIB in market cap, with the 2026 ceiling at $0.21 and the next resistance at $0.10 while active addresses jumped 28%.
Will X Money launching in April affect the dogecoin price prediction?
X Money confirmed for April with Visa across 40 states, but crypto trading is only on the roadmap with no DOGE confirmation. The Pepeto official website is where the exchange with verified tools is still at presale pricing.
Is Pepeto the next DOGE based on the dogecoin price prediction pattern?
The same meme energy is building with a working exchange DOGE never had, the Pepe cofounder behind it, and a Binance listing confirmed with 100x projected by analysts.
Disclaimer: This is a Press Release provided by a third party who is responsible for the content. Please conduct your own research before taking any action based on the content.

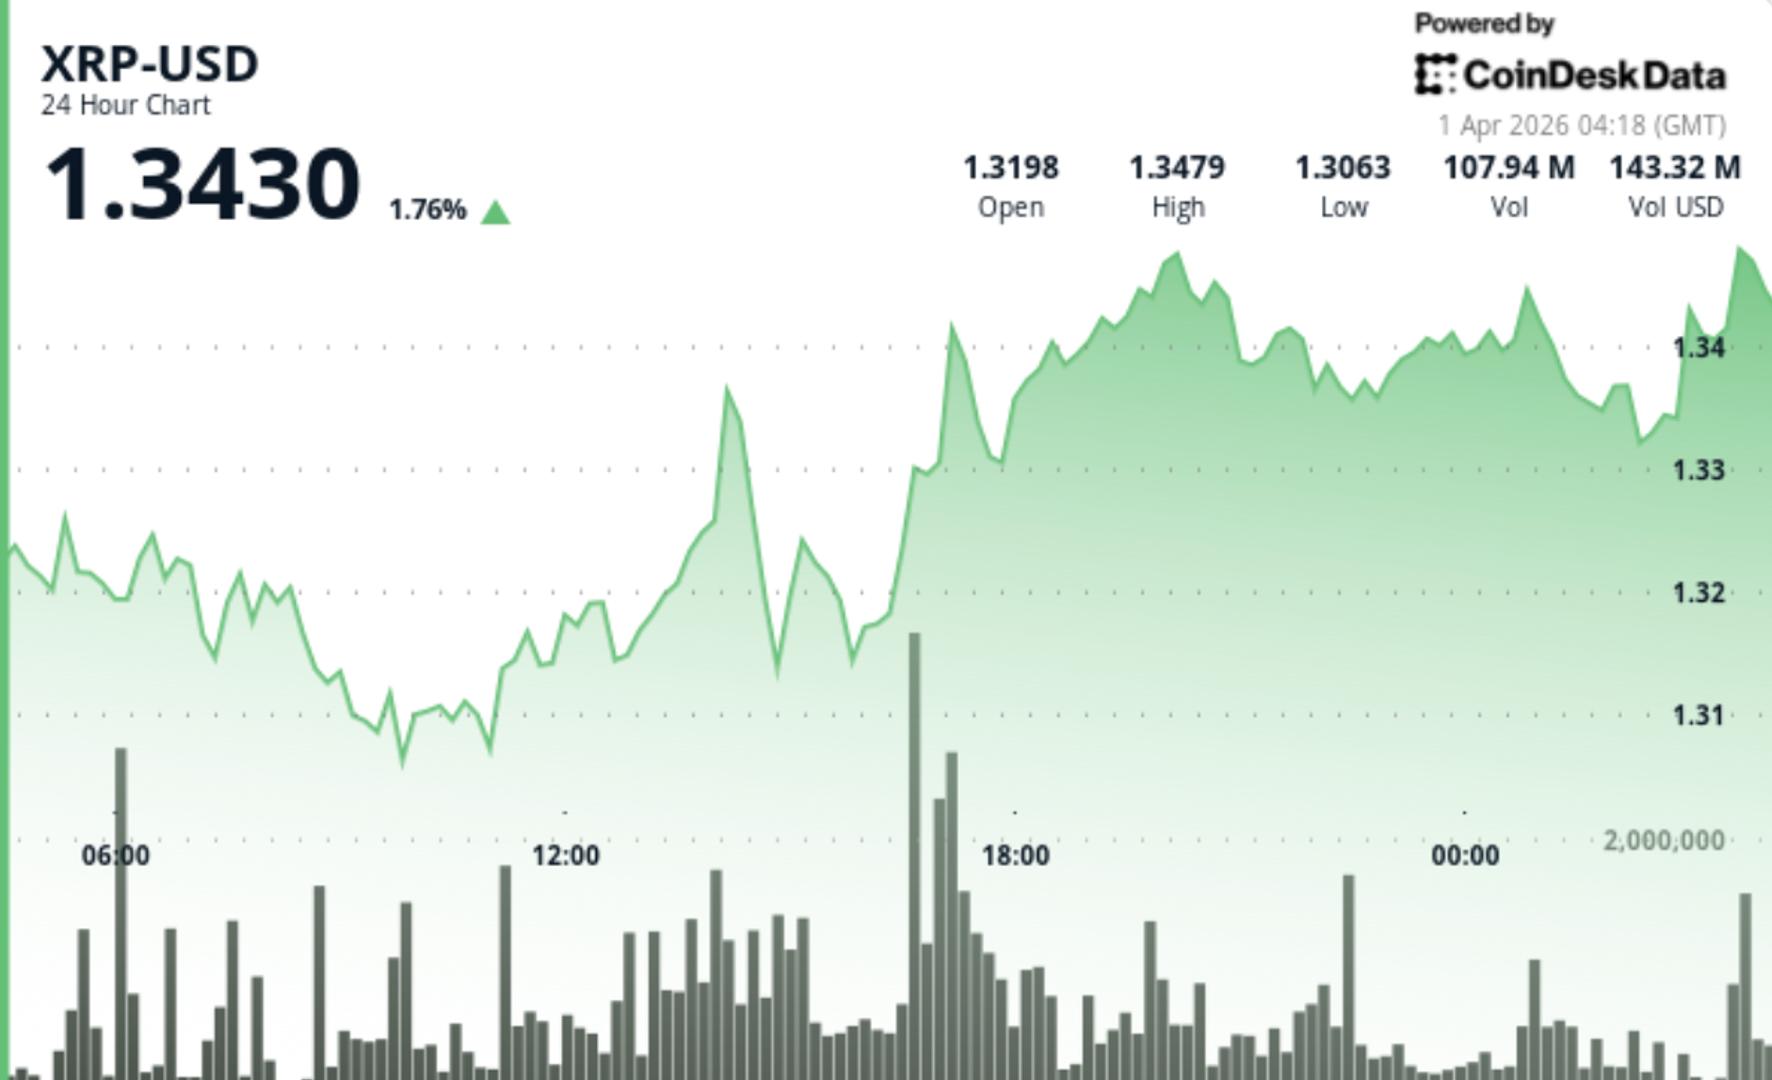

XRP is seeing large amounts of tokens leave exchanges, reducing available supply — but price isn’t responding yet. The token is hovering near $1.34 after a modest gain, creating a disconnect between tightening supply and muted price action that typically doesn’t last.
News Background
- XRP edged higher to $1.34 with volume rising 29% above its weekly average
- Around 7.03 billion XRP left exchanges in February, signaling supply compression
- Binance scarcity indicator climbed to 0.59, its highest level since 2024
Price Action Summary
- Price traded in a tight range, repeatedly testing the $1.33-$1.34 zone
- Early breakout attempts failed, with resistance forming just above current levels
- Buyers defended dips near $1.31, establishing a sequence of higher lows
- Late-session action showed steady buying, but no decisive follow-through
Technical Analysis
- The key setup is a mismatch: supply is tightening, but price isn’t expanding
- Large outflows usually reduce sell pressure, yet sellers are still capping rallies
- Elevated volume without price expansion points to positioning rather than conviction
- This kind of compression typically resolves with a sharper directional move
What traders should watch
- $1.34-$1.35 is the immediate trigger — a break opens room toward $1.42
- $1.31-$1.32 remains the key support zone holding structure intact
- If price continues to stall despite shrinking supply, it suggests sellers are still active overhead


SpaceX has reportedly filed confidential IPO papers with the SEC, eyeing a June 2026 listing at over $1.75T and up to $75B raised after its $1.25T xAI merger valuation.
Summary
- Elon Musk’s SpaceX has reportedly submitted a confidential IPO registration to the SEC, targeting a valuation above $1.75 trillion and a June 2026 listing.
- The listing could raise as much as $75 billion, eclipsing Saudi Aramco’s $29.4 billion offering, the current record for funds raised in an IPO.
- SpaceX’s recent $1.25 trillion valuation following its acquisition of Musk’s AI venture xAI positions it as the world’s most valuable private company ahead of its prospective debut.
SpaceX, Elon Musk’s rocket and satellite company based in the United States, has quietly filed a draft registration for an initial public offering with the Securities and Exchange Commission, in a move that could value the group at more than $1.75 trillion and bring the world’s biggest-ever listing to market as soon as June 2026.
People familiar with the process told Bloomberg that SpaceX is “targeting a confidential filing for an initial public offering as soon as next month,” a timetable that would keep the long-awaited flotation on track for a mid-year debut. Under U.S. rules, a confidential submission allows large issuers to work through several rounds of SEC comments before publishing an S-1 prospectus, limiting early scrutiny of detailed financials.
Insiders cited say the company has already submitted its IPO registration draft and is expected to go public in June, potentially the first of three so‑called “super IPOs” ahead of OpenAI and Anthropic, with banks including Bank of America, Citigroup, Goldman Sachs, JPMorgan Chase and Morgan Stanley lined up as lead underwriters. The same report suggests SpaceX could raise up to $75 billion in fresh capital, more than double the $29.4 billion Saudi Aramco raised in its 2019 IPO, which White & Case described as “the largest-ever initial public offering” at the time. In crypto markets, SpaceX’s looming deal follows similar large-cap listings that have intersected with digital assets, including Coinbase’s direct listing, and echoes recent coverage highlighting how major corporate treasuries are increasingly willing to hold assets like bitcoin alongside cash and bonds.
The IPO preparation comes just weeks after SpaceX acquired Musk’s artificial intelligence startup xAI in a record-setting all‑stock transaction that Reuters says values SpaceX at $1 trillion and xAI at $250 billion, creating a combined entity worth about $1.25 trillion. In a memo quoted by Reuters, Musk framed the tie‑up in typically expansive terms, writing that the merger “signifies not just a new chapter, but an entirely new book in the journey of SpaceX and xAI: expanding to create a conscious sun that comprehends the Universe and spreads the essence of awareness to the stars!” Coverage in the Financial Times and other outlets has stressed that the deal concentrates even more of Musk’s wealth and operational leverage into SpaceX just as bankers pitch investors on its satellite internet arm Starlink as the engine of long‑term cash flow.
The SpaceX listing adds to a pipeline of equity deals that could influence liquidity conditions across both traditional and digital asset markets, particularly if the company confirms reported bitcoin holdings or clarifies whether any related tokenized equity products will trade alongside the stock. In a previous crypto.news story, markets tracked how large technology listings and bitcoin‑linked balance sheets can amplify risk‑on sentiment across digital assets, while another story examined how Musk‑adjacent ventures have repeatedly acted as catalysts for renewed retail inflows into crypto during major funding milestones. With benchmark tokens like Bitcoin (BTC), Ethereum (ETH) and Solana (SOL), traders will be watching whether a SpaceX roadshow in early summer sharpens the bid for risk or drains liquidity into what could be the IPO of the decade.

Asian stocks posted their best day in months and S&P 500 futures jumped after the president said he would address the nation Wednesday night with an “important update” on Iran. Oil pared losses as the UAE reportedly prepares to help reopen the Strait of Hormuz by force.
Bitcoin traded at $67,950 on Tuesday, up 0.2% over 24 hours, as a wave of optimism over a potential end to the Iran conflict lifted risk assets across the board. Ether rose 1.6% to $2,100, its strongest daily move in weeks.
XRP gained 0.5% to $1.34, dogecoin added 0.5% to $0.09, and BNB edged up 0.4% to $616. Solana’s SOL was the notable laggard, dropping 0.7% to $83.14 and extending weekly losses to 8.7%.
The MSCI Asia Pacific Index surged 4%, its best session since the war began, with nearly 10 stocks rising for every one that fell. Asian tech jumped 6.5%, led by Samsung and SK Hynix surging more than 9% each. S&P 500 futures climbed, and the index notched its biggest single-day gain since May.
The catalyst was Trump telling reporters he expected the war to end within two to three weeks and that a deal with Iran was not a prerequisite for concluding the conflict. He announced a national address Wednesday at 9 p.m.
Eastern to provide what he called an “important update.” Iran’s president Masoud Pezeshkian told the EU Council president that Tehran has “the necessary will to end this war” but expects guarantees against future aggression.
Separately, the Wall Street Journal reported that the UAE is preparing to help the U.S. and allies reopen the Strait of Hormuz by force, which would make it the first Gulf state to enter the conflict as a combatant. Brent crude edged back above $105 after Tuesday’s decline.
The crypto market’s reaction was muted relative to equities, a pattern that has held for weeks. Bitcoin has spent the entire war grinding between $65,000 and $73,000 while equities swing violently on each headline. The gap between crypto’s sideways range and the stock market’s correction-level drawdown remains the most notable divergence in the cross-asset picture.
There were reasons for cautious optimism beyond geopolitics. Morgan Stanley received approval for a bitcoin ETF charging just 14 basis points, 11 below the category average. The product opens access to Morgan Stanley’s 16,000 financial advisors managing $6.2 trillion, a channel that has not previously had direct bitcoin ETF exposure.
Alex Blume, CEO of Two Prime, pointed to three catalysts that could drive bitcoin higher in Q2 — the Morgan Stanley ETF, continued success of Strategy’s STRC preferred equity product in funding bitcoin purchases, and a swift resolution to the Iran war.
“A lot of market uncertainty could be resolved soon,” Blume said in an email to CoinDesk. “Coupled with new buying power, a strong Q2 may be ahead.”
Gold advanced for a fourth straight day to near $4,700, though its nearly 12% decline in March was its worst monthly performance since October 2008. The precious metal’s ongoing weakness during an active war continues to break historical precedent.
Whether Trump’s Wednesday address produces an actual off-ramp or just another headline in a month that’s been full of them will determine if this rally holds. As one analyst put it, “I’m not convinced over the longer term. Investors will soon want concrete evidence that the end of the war is in sight.”
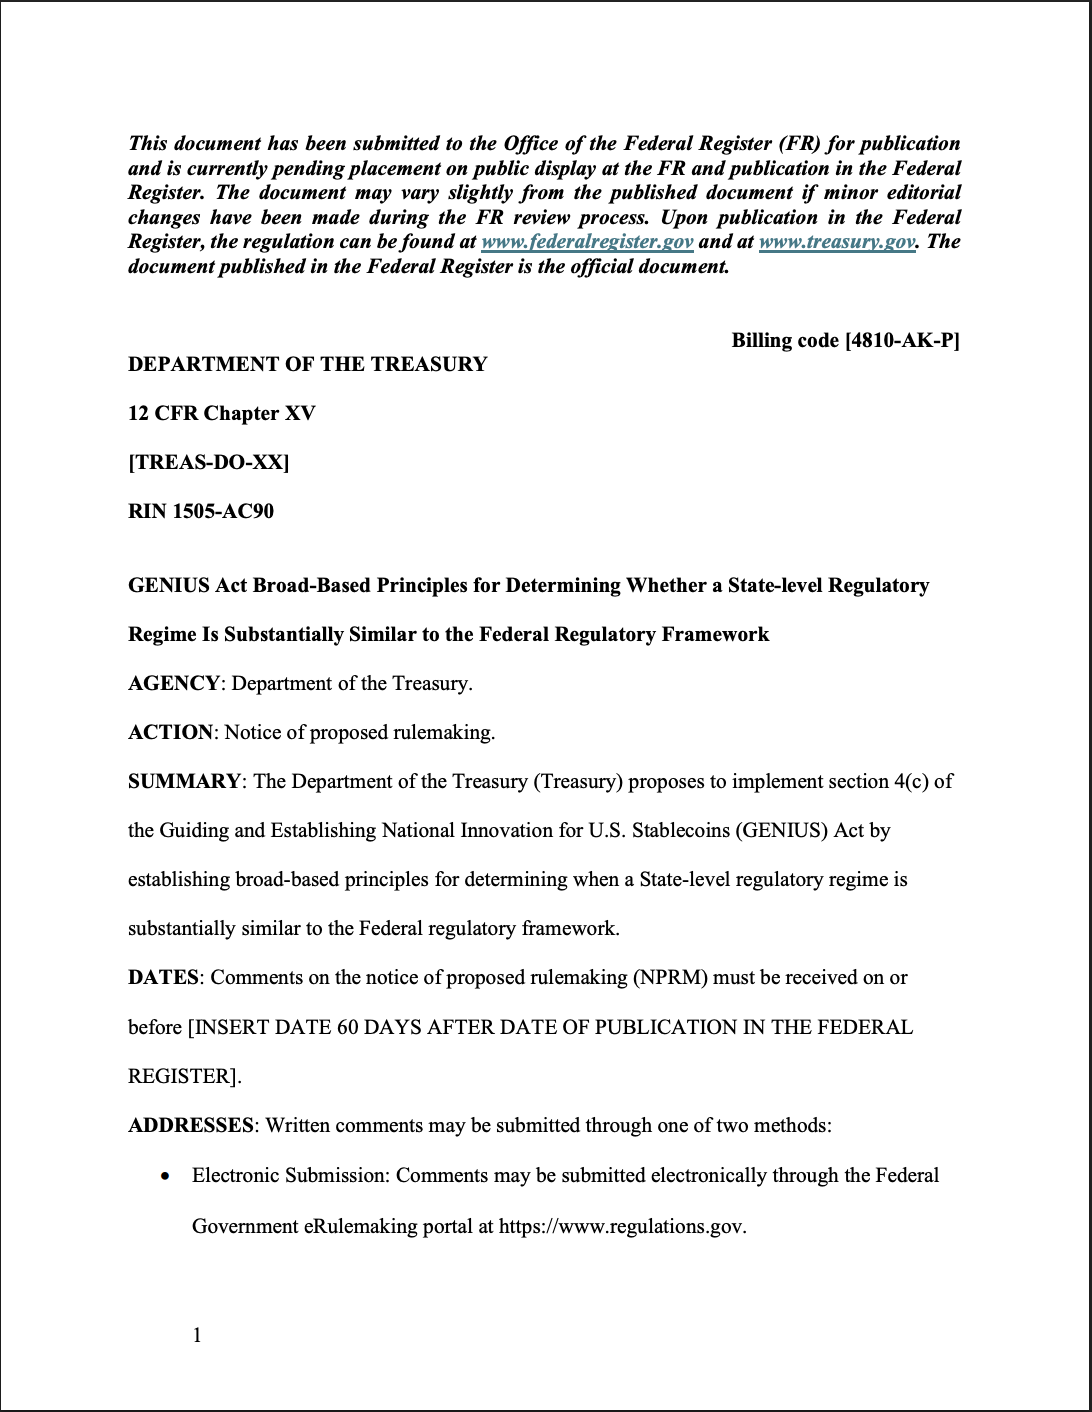
The US Department of the Treasury issued a notice of proposed rulemaking (NPRM) on Wednesday and is seeking public comment on proposed regulations for state-level stablecoin governance frameworks under the GENIUS Act.
The GENIUS stablecoin regulatory framework, also known as the “Guiding and Establishing National Innovation for US Stablecoins Act,” gives states the authority to regulate stablecoins with a market cap of less than $10 billion, as long as the regulations do not deviate significantly from federal policies.
The Treasury outlined several non-negotiable stablecoin regulations that must be in line with Federal regulations, including a 1:1 reserve backing with cash or high-quality cash equivalents and monthly reporting requirements.

States must also comply fully with federal anti-money laundering and sanctions policies for stablecoins, while upholding bans on token rehypothication, or using the same asset to support multiple claims.
Under the proposal, states are allowed to impose their own liquidity, reserve, risk management, regulatory procedures, enforcement and administrative rules, as long as the rules impose higher financial thresholds or are more restrictive than the federal regulations.
“State-level regulatory regimes must lead to regulatory outcomes that are at least as stringent and protective as the Federal regulatory framework,” the proposal said.
The public must submit comments within 60 days of the NPRM announcement. Once a stablecoin issuer passes the $10 billion threshold, it will automatically be under the regulatory jurisdiction of the federal government, meaning the largest stablecoin issuers will be regulated exclusively at the federal level.
Related: FSB flags dollar stablecoins as bigger risk for emerging markets in annual report
GENIUS Act becomes law, but uncertainty remains over yield-bearing stablecoins
US President Donald Trump signed the GENIUS Act into law in July, which was considered a landmark moment for crypto regulations.
Despite the landmark regulations, uncertainty about yield-bearing stablecoins and whether stablecoin issuers can share interest with token holders has stalled the CLARITY crypto market structure bill in Congress.
Some crypto companies, led by Coinbase, argue that yield-bearing stablecoins provide savers with a competitive alternative to traditional savings accounts, which typically have interest rates far below 1%.
The banking lobby continues to oppose yield-bearing stablecoins over fears that the tokens will cause deposit flight and erode the sector’s market share.
Magazine: GENIUS Act reopens the door for a Meta stablecoin, but will it work?
Crypto World
Caltech researchers project functional quantum computer feasible by 2030 with 10,000-20,000 qubits: Caltech

Caltech researchers estimate a working quantum computer could be operational before 2030 using far fewer qubits than previously thought, as crypto industry assesses vulnerability exposure.


Summary
- EthCC 2026 attendees reported noticeably fewer women at this year’s conference in Cannes, with industry participants linking the decline to market‑driven job cuts in marketing, PR and events roles
- Crypto recruiter PlexusRS says women still account for under 8% of crypto hires despite a 137% jump in female placements last year, underscoring how fragile recent diversity gains remain when markets turn.
- Broader corporate layoffs tied to artificial intelligence and cost‑cutting have hit non‑technical roles hardest across finance and technology, a pattern echoed in recent coverage by the Financial Times and Fortune.
Women’s visibility at Europe’s flagship Ethereum (ETH) conference appears to have taken a step backwards this year, as EthCC 2026 attendees in Cannes reported a marked drop in female participation just as crypto companies accelerate layoffs in marketing, PR and events. “There are less women this year because when the market turns the first jobs to get tinned are those where the female concentration is highest (events, marketing, PR),” wrote Sarah Akwisombe, a growth and community specialist, in a widely shared post from the conference, pointing readers to the Plexus “state of crypto hiring” report for further context. Other women in attendance echoed the sentiment on X, with user @ZoeCatherineF responding that they were “always the first to be binned – only the ‘essentials’ do the BD trips,” while another attendee, @Angel__Lou, said she had “definitely noticed it too.”
The Plexus State of Crypto Hiring report paints a stark statistical backdrop to those anecdotes, showing that women still account for less than 8% of all crypto hires despite a 137% year‑on‑year increase in female placements into Web3 roles. That concentration is especially pronounced in non‑engineering positions like marketing, community, communications and events, precisely the categories many crypto firms have targeted for cuts during the latest downturn and in response to structural shifts such as AI adoption. Research compiled by Plexus, based on more than 900 vacancies and over 300 hiring processes, concludes that while headline diversity metrics in crypto have improved, “the jobs market for women in Web3 remains disproportionately exposed to cyclical hiring freezes and non‑technical layoffs.”
The pattern emerging in crypto mirrors broader labour‑market pressures in technology and finance, where softer growth, rising rates and aggressive AI investments have combined to squeeze non‑technical roles. In March, Crypto.com announced plans to cut around 12% of its workforce, telling Bloomberg that it was integrating AI “across its business” and could therefore reduce headcount, in one of the latest examples of digital‑asset firms trimming staff outside core engineering and trading functions. A recent survey cited by Fortune found that 66% of large‑company CEOs plan to freeze or cut hiring through 2026 after more than 1.17 million jobs were eliminated in 2025, with labour‑market data showing a 30% drop in entry‑level listings and a 42% drop in middle‑management postings since 2022.
FT columnist Sarah O’Connor, who covers the world of work, has argued that such cuts often land first in “softer” functions like HR, marketing and communications, roles that tend to have higher female representation across industries. That dynamic appears to be playing out in crypto as well, compounding longstanding diversity gaps just as the market’s attention turns back to institutional adoption, regulation and infrastructure at events such as EthCC.
For women on the ground in Cannes, the impact is immediately visible. Akwisombe’s thread, posted from her @SarahAkwisombe account and tagged with @PlexusRS, noted that the roles most exposed to cuts are also those that had historically offered a pathway into crypto for people without a technical background. “The best events are always run by @lo_tech and I won’t hear otherwise,” she added in a follow‑up post, highlighting the outsized role women have played in shaping the social and cultural fabric of Ethereum conferences even as their headcount shrinks.
Industry data suggests the stakes extend beyond this year’s conference optics. CoinLaw’s 2026 employment statistics report that 28% of women in blockchain say they have experienced harassment or discrimination, while 60% of women in fintech have left jobs due to a lack of diversity. Combined with the cyclical vulnerability of non‑technical roles, those pressures risk entrenching a two‑tier crypto labour market in which engineering teams slowly diversify on paper even as women’s presence in public‑facing roles diminishes when markets tighten.

Solana’s meme coin launchpad, Bonk.fun, used April Fools’ Day to post a mock “feature launch” that quickly turned into a political jab, suggesting the platform would restrict access to users in Israel.
The post, framed as a new “Trench Guard” system, showed a geo-block screen with an Israel flag, implying users from the region would be blocked from trading.
Political Satire at Best
At face value, it looked like a typical compliance update. However, the tone and timing made it clear this was satire. The message wasn’t about a real feature. It was a pointed joke tied to current geopolitical tensions and how they spill into crypto.
The choice of Israel is doing most of the work here. Right now, Israel sits at the center of ongoing conflicts involving Gaza, Lebanon, and Iran. That has driven strong and often negative sentiment online. Bonk.fun taps into that mood and flips the usual script.
Typically, platforms block heavily sanctioned regions like Iran and Russia. Bonk.fun’s joke suggests: what if the “bad actor” label was applied differently? That’s the punchline.
The post is riffing on the idea that they’re blocking Israel because of how negatively Israel is being viewed by a lot of people online right now.
At the same time, the post takes a swipe at crypto’s “permissionless” narrative. In reality, many platforms already restrict users based on geography or regulation.
By exaggerating this with a controversial example, Bonk.fun highlights how political these decisions can feel.
In short, the post isn’t really about Israel alone. It’s using Israel as a symbol to mock how quickly crypto platforms can go from open access to selective control—especially when global politics gets involved.
The post Bonk.fun’s April Fools Joke Targets Israel, Sparks Debate appeared first on BeInCrypto.


Ten foreign nationals across four firms have been charged with orchestrating pump-and-dump schemes.


The market appears to be reassessing long‑term technological risks in crypto following Google’s major quantum computing research update on Monday.
While leading coins like bitcoin and ether (ETH) have seen only modest moves in the past 24 hours, several cryptocurrencies tied to the quantum‑resistant narrative have surged sharply, with some gaining more than 50%.
This outperformance of the so-called quantum-resistant tokens shows how quickly the market is pricing in potential technological risks, even if those are still theoretical. While quantum computers capable of attacking Bitcoin are still years away, traders are already signaling an appetite for “future-proof” assets.
Late Monday, Google’s Quantum AI team suggested that quantum computers could break the elliptic‑curve cryptography used by Bitcoin, with fewer than 500,000 quantum qubits, which is significantly less than previously estimated. This prompted some analysts to cite 2029 as a potential deadline for Bitcoin and the broader blockchain ecosystem to strengthen their defenses.
The study said that a sufficiently advanced quantum computer could attack Bitcoin within nine minutes. A separate report highlighted Ethereum’s vulnerabilities, identifying five potential attack vectors that could put an estimated $100 billion of assets at risk, including DeFi and tokenized holdings.
However, such machines do not exist and remain a threat that’s still a few years away.
Still, over the past 24 hours, the market has shown increased interest in cryptocurrencies and projects that emphasize post‑quantum cryptographic designs, research into future‑proofing security, or that appear relatively more resilient than legacy chains.
Notably, Quantum Resistant Ledger (QRL) and Cellframe (CEL) have surged 50%, reflecting growing market attention to truly post‑quantum protocols, according to data source Coingecko. Other tokens in the category, such as Abelian (ABEL), have risen 25%, while Qubic (QUBIC) and QANplatform (QANX) have each gained 10%, and even the privacy‑focused Zcash (ZEC) has added nearly 7% in the same period.
The market cap of this group, comprising 20 coins, has increased by 8% to $4.66 billion over the past 24 hours. It’s worth noting that ZEC is not yet truly quantum-resistant but is still included in the category by data sources because of its advanced cryptographic foundations, such as zero-knowledge proofs, and ongoing research into post-quantum secure ZK-SNARKs. These factors make it part of the “quantum-aware” narrative, even if it does not currently fully implement post-quantum cryptography.
While the risks remain largely theoretical, they have been influencing market behavior since last year. According to Charles Edwards, founder of Capriole Investments, concerns over quantum attacks contributed to Bitcoin’s decoupling from the rising stock market in the second half of 2025, with the cryptocurrency sliding from $126,000 to $80,000 in the final months of the year.
“We have already started to see quantum risk be priced into Bitcoin. It’s the primary reason Bitcoin is trading -50% against the S&P 500 and -90% against gold since the inaugural Bitcoin Quantum Summit seven months ago,” Edwards said in a report in February.
Coincidentally, this was exactly the period when ZEC staged a sharp rally. ZEC surged by over 1,200% in the second half of 2025, hitting a high of $744.

Hazel Court- York council Click Before You Tip latest

Nashville suburb sees growth from manufacturing, affordable housing market

Dogecoin Price Prediction as MemeCore Flips Shiba Inu in Market Cap, But Pepeto Draws the Same Energy, Is This The Next Dogecoin?


-

 News Videos7 days ago
Parliament publishes latest register of MPs’ financial interests
-

 Business6 days ago
Instagram, YouTube Found Responsible for Teen’s Mental Health Struggle in Historic Ruling
-
 Tech6 days ago
Intercom’s new post-trained Fin Apex 1.0 beats GPT-5.4 and Claude Sonnet 4.6 at customer service resolutions
-

 NewsBeat5 days ago
The Story hosts event on Durham’s historic registers
-

 Sports5 days ago
Sweet Sixteen Game Thread: Tide vs Michigan
-
Entertainment2 days ago
Fans slam 'heartbreaking' Barbie Dream Fest convention debacle with 'cardboard cutout' experience
-
 Entertainment4 days ago
Lana Del Rey Celebrates Her Husband’s 51st Birthday In New Post
-
Crypto World1 day ago
Dems press CFTC, ethics board on prediction-market insider trades
-

 Sports1 day ago
Tallest college basketball player ever, standing at 7-foot-9, entering transfer portal
-

 Tech3 days ago
The Pixel 10a doesn’t have a camera bump, and it’s great
-

 Crypto World2 hours ago
Gold Price Prediction: Worst Month in 17 Years fo Save Haven Rock
-

 Entertainment7 days ago
HBO’s Harry Potter Series Will Definitely Fail For One Big Reason, And It’s Not J.K. Rowling Or Snape
-

 Tech2 days ago
EE TV is using AI to help you find something to watch
-

 Fashion6 days ago
En Vogue in Brown Leather and Tailored Neutrals by Atelier Savoir, Styled by J Bolin
-

 Tech2 days ago
Apple will hide your email address from apps and websites, but not cops
-

 Politics2 days ago
Should Trump Be Scared Strait?
-

 Tech2 days ago
Flipsnack and the shift toward motion-first business content with living visuals
-

 Tech2 days ago
How to back up your iPhone & iPad to your Mac before something goes wrong
-

 Crypto World2 days ago
U.S. rule change may open trillions in 401(k) funds to crypto
-

 Fashion6 days ago
What Are Your Favorite T-Shirts for the Weekend?
You must be logged in to post a comment Login