

Crypto World
Trump-linked crypto venture WLFI taps Securitize for Maldives resort tokenization

World Liberty Financial is tapping real-world asset specialist Securitize to help tokenize loan interests tied to the Trump International Hotel and Resort in the Maldives.
Rather than direct equity in the properties, investors will be able to buy tokens tied to loan revenue, according to a Wednesday announcement timed for the privately held company’s Mar-A-Lago crypto conference.
World Liberty Financial is turning to one of the largest companies in digital securities. Securitize has worked with major asset managers such as BlackRock, Hamilton Lane and Apollo Global Markets to issue tokenized funds and private credit on public blockchains. BlackRock and Cathie Wood’s Ark Invest are also investors in the firm, which plans to go public by merging with a Cantor Fitzgerald-sponsored special-purpose acquisition company (CEPT).
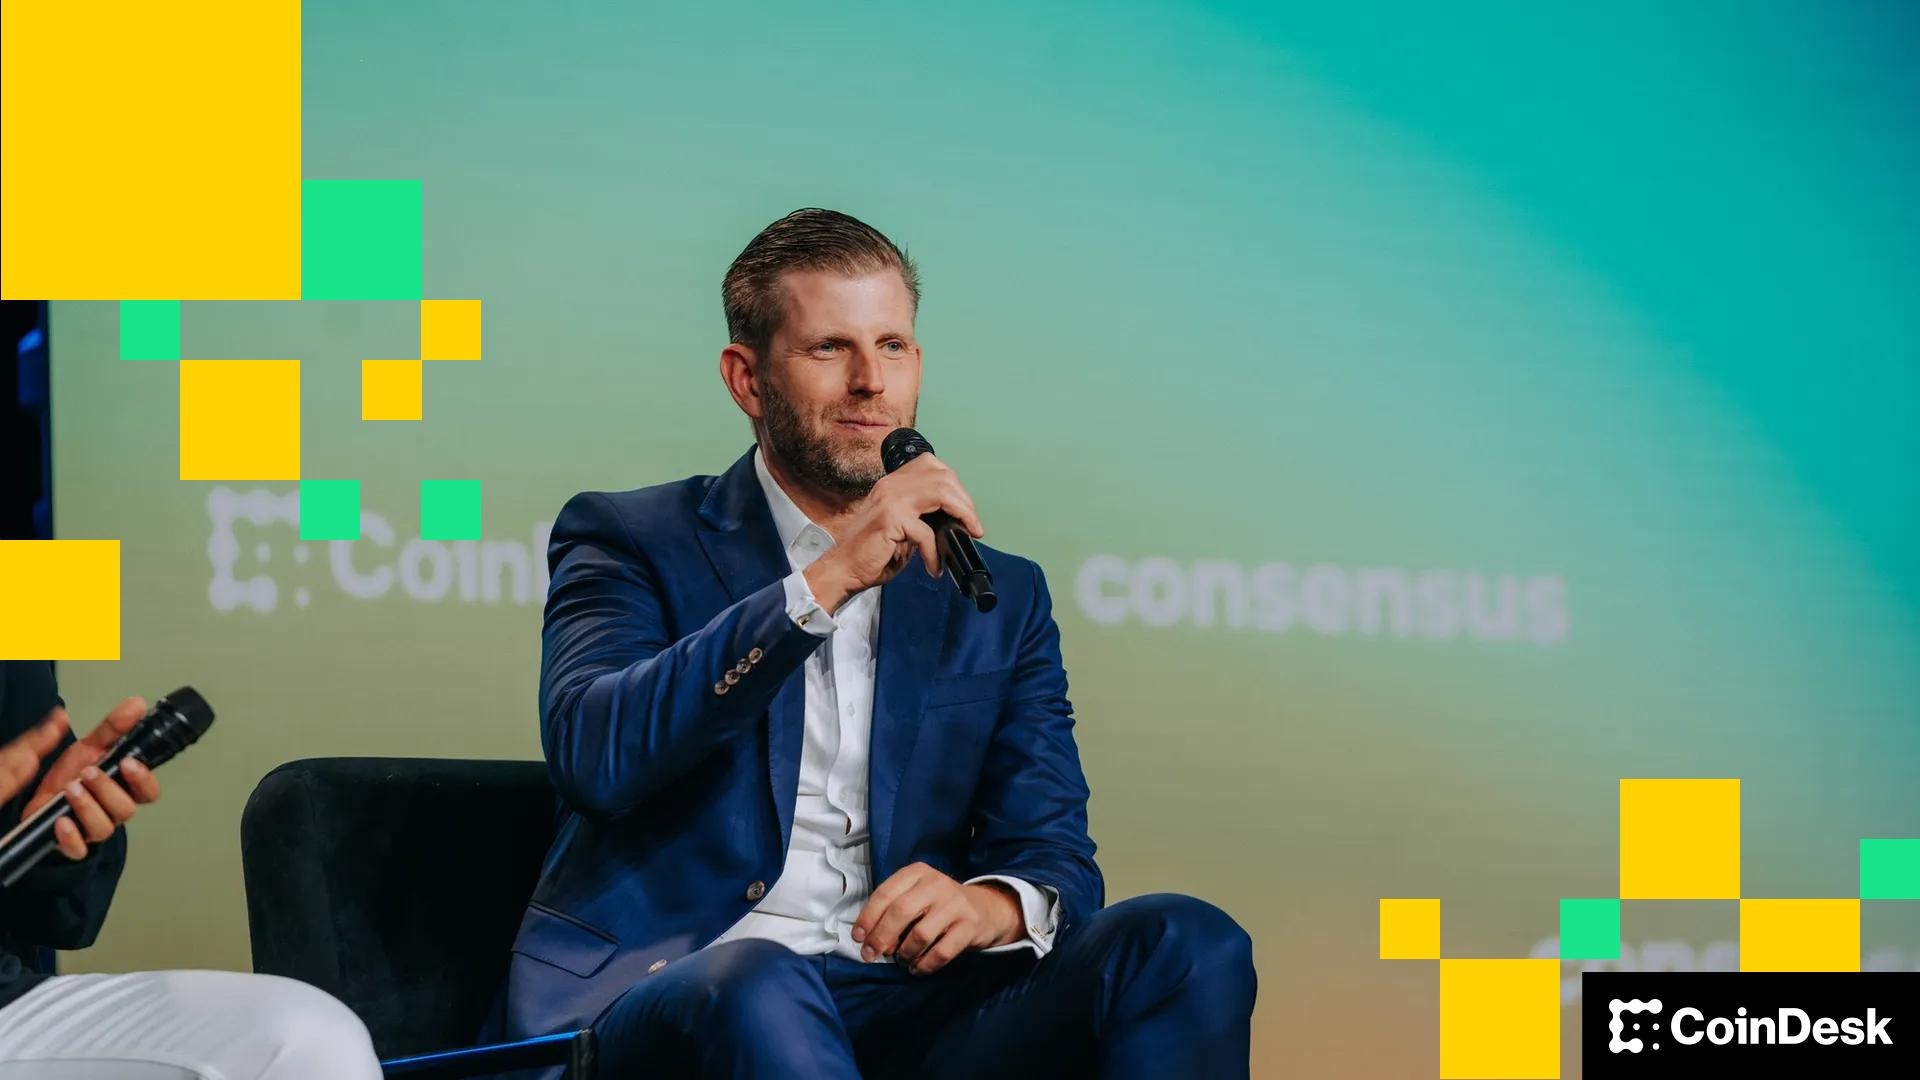
“We built World Liberty Financial to open up decentralized finance to the world,” said Eric Trump, a co-founder of the company. “With today’s announcement, we are now extending that access to tokenized real estate.”
Eligible accredited investors will receive a fixed yield and payments linked to the loan’s performance. The sale will take place under U.S. private placement rules, with restrictions on resale.
Plans to tokenize the Maldives resort were unveiled in November. The resort, developed by DarGlobal in collaboration with the Trump Organization, is expected to include about 100 beach and overwater villas and reach completion in 2030. In October, Eric Trump said on CoinDesk TV that WLFI planned to tokenize a new real estate project.
The latest announcement focuses on who will handle the mechanics. Securitize will oversee issuance and compliance for tokens representing interests in a development loan connected to the project.
While tokenization of traditional assets like stocks and funds has gained the attention of Wall Street firms, real estate represents a smaller slice of the $25 billion tokenized asset market. Proponents argue that blockchain rails can streamline property ownership records and settlement, but uneven regulation and thin secondary trading pose a risk, an EY report noted last year.
The company’s WLFI token has dropped 6.6% in the past 24 hours to 11.63 cents.


The latest Federal Open Market Committee minutes struck a hawkish tone, pressuring risk assets including cryptocurrencies.
Summary
- Policymakers warned inflation progress may be “slower and more uneven,” signaling rate cuts are not imminent and that hikes have not been fully ruled out.
- With Treasury yields rising and easing deemed potentially premature, high-beta assets like Bitcoin, Ethereum and XRP faced renewed selling pressure.
- BTC holds near $66.8K but remains below its 50-day SMA; ETH consolidates near $1,960 with weak inflows; XRP trades under key Bollinger resistance near $1.46.
Policymakers acknowledged that while inflation has cooled from its highs, progress toward the Fed’s 2% target “might be slower and more uneven than generally expected,” and warned that the risk of inflation remaining persistently above target “was meaningful.”
That language reinforced expectations that rate cuts are not imminent and that policymakers remain cautious about declaring victory over price pressures.
The minutes also revealed that several participants would have supported a “two-sided” description of risks, signaling that further rate hikes have not been fully ruled out if inflation reaccelerates. At the same time, officials indicated that additional policy easing “may not be warranted” until there is clear evidence that disinflation is firmly back on track.
While two members dissented in favor of an immediate cut, the broader message emphasized patience and vigilance, a stance that typically tightens financial conditions and weighs on high-beta assets such as crypto.
With Treasury yields climbing and expectations for near-term liquidity fading, digital assets faced renewed selling pressure. This sets the stage for a closer look at how Bitcoin (BTC), Ethereum (ETH) and XRP (XRP) are reacting on the charts.
Crypto price prediction: Bitcoin (BTC)
Bitcoin extended its pullback following the hawkish Fed minutes, briefly dipping toward $65,000 before stabilizing before staging a rebound. It is currently trading around $66,800, but remains well below the 50-day SMA near $82,600, which signals that the broader short-term trend is still bearish.
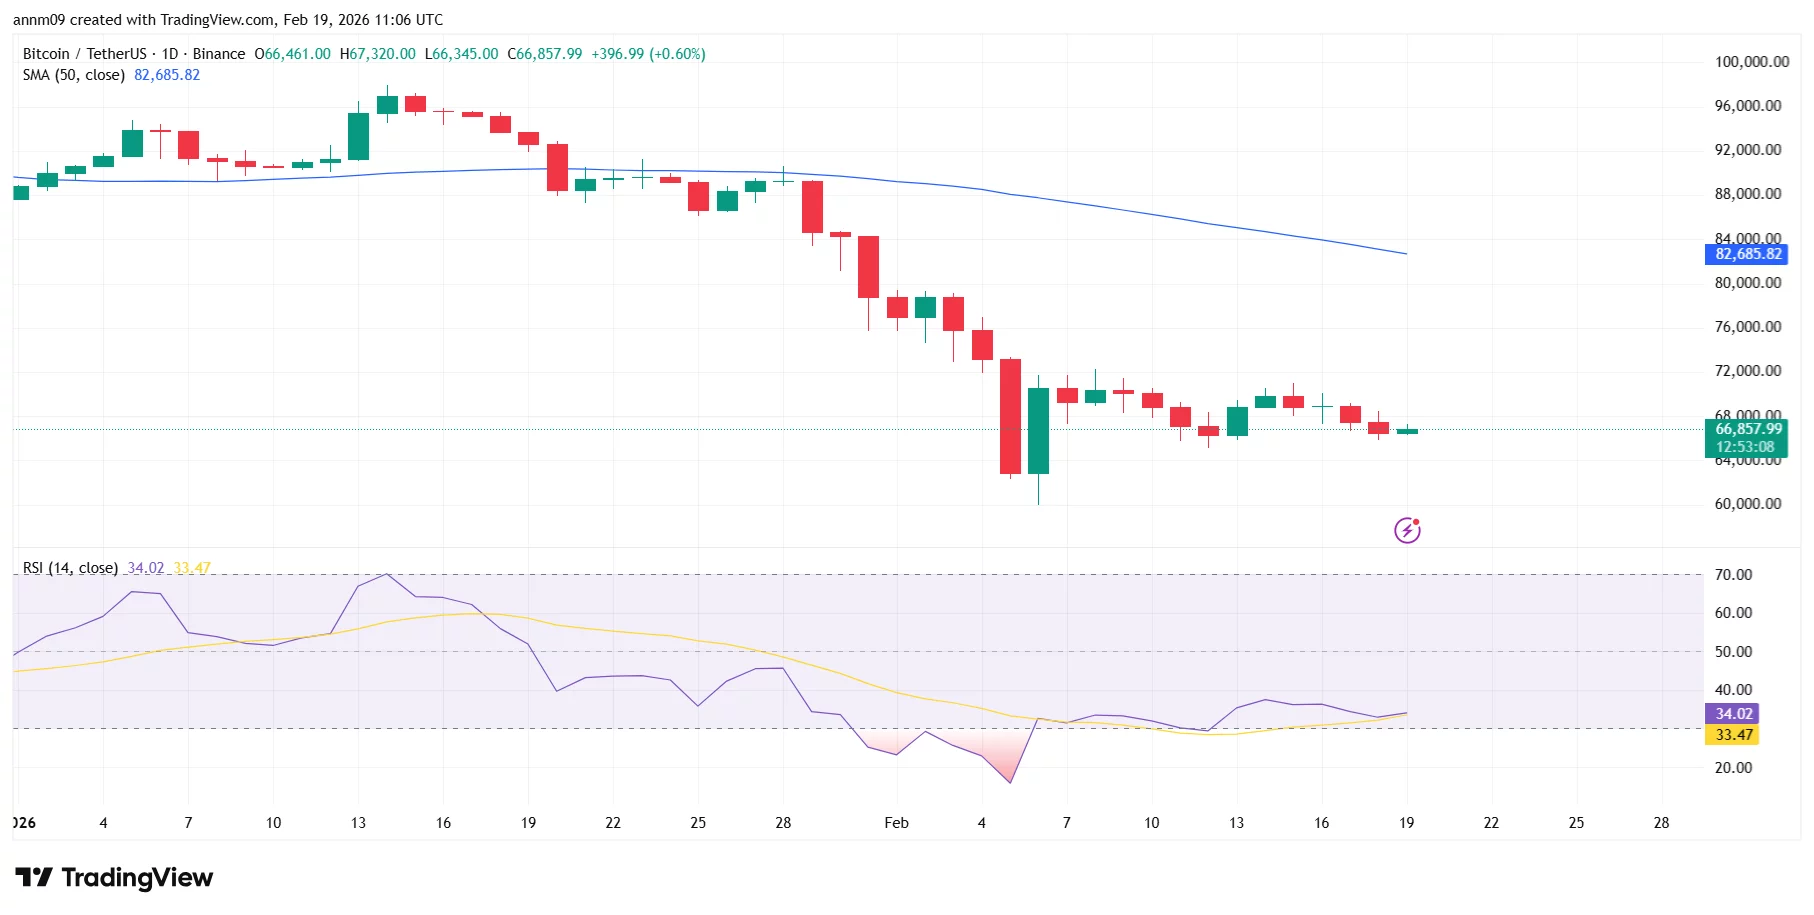
The RSI is hovering around 34, recovering from near-oversold territory but still below the neutral 50 level, suggesting weak momentum despite the bounce. Immediate support sits near $64,000, followed by the recent low around $60,000.
On the upside, resistance is seen near $70,000, with stronger structural resistance around $75,000–$76,000. Unless BTC reclaims those levels, rallies may continue to face selling pressure.
Ethereum (ETH)
Ethereum saw a sharp sell-off in early February, dropping toward the $1,900 zone before stabilizing. It is now trading around $1,960, consolidating in a tight range amid the Fed-driven volatility.
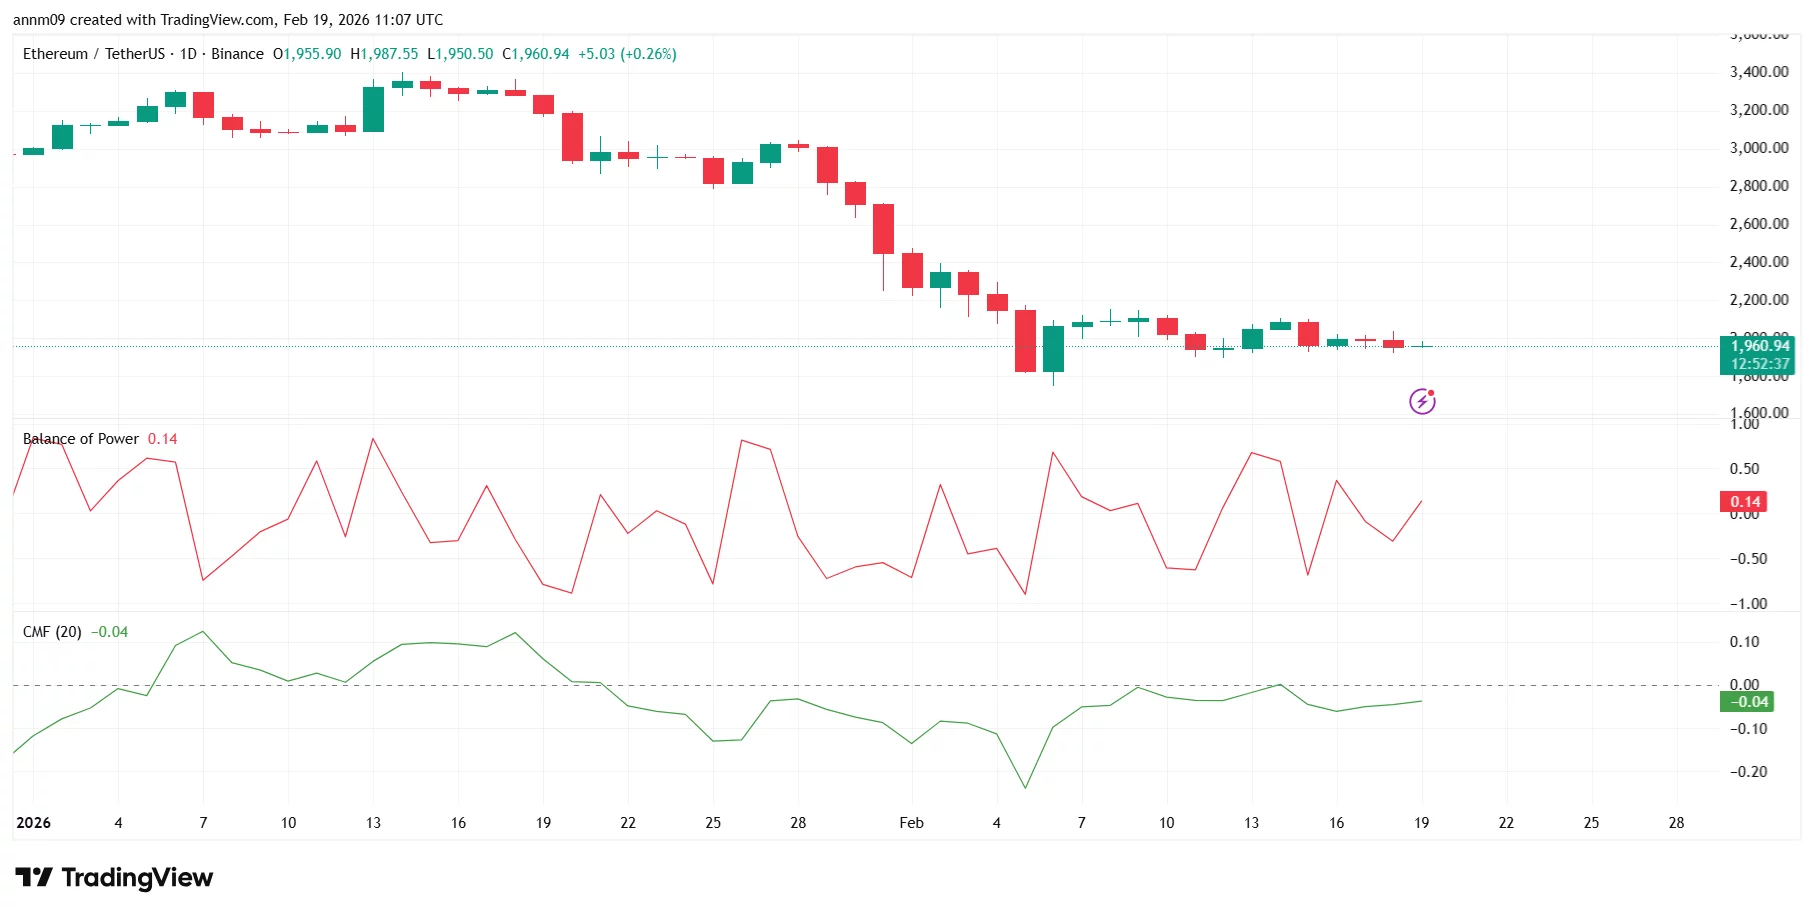
The Balance of Power indicator has turned slightly positive, hinting at mild buying pressure, but CMF remains marginally negative, suggesting capital inflows are still weak. Immediate support lies at $1,900, with a deeper floor around $1,800.
On the upside, ETH faces resistance near $2,050, followed by $2,200, where prior breakdown levels sit.
XRP
XRP remains under pressure compared to BTC and ETH. After sliding from above $2.00 earlier in the year, it recently bounced from the $1.20–$1.25 area and is currently trading near $1.41.
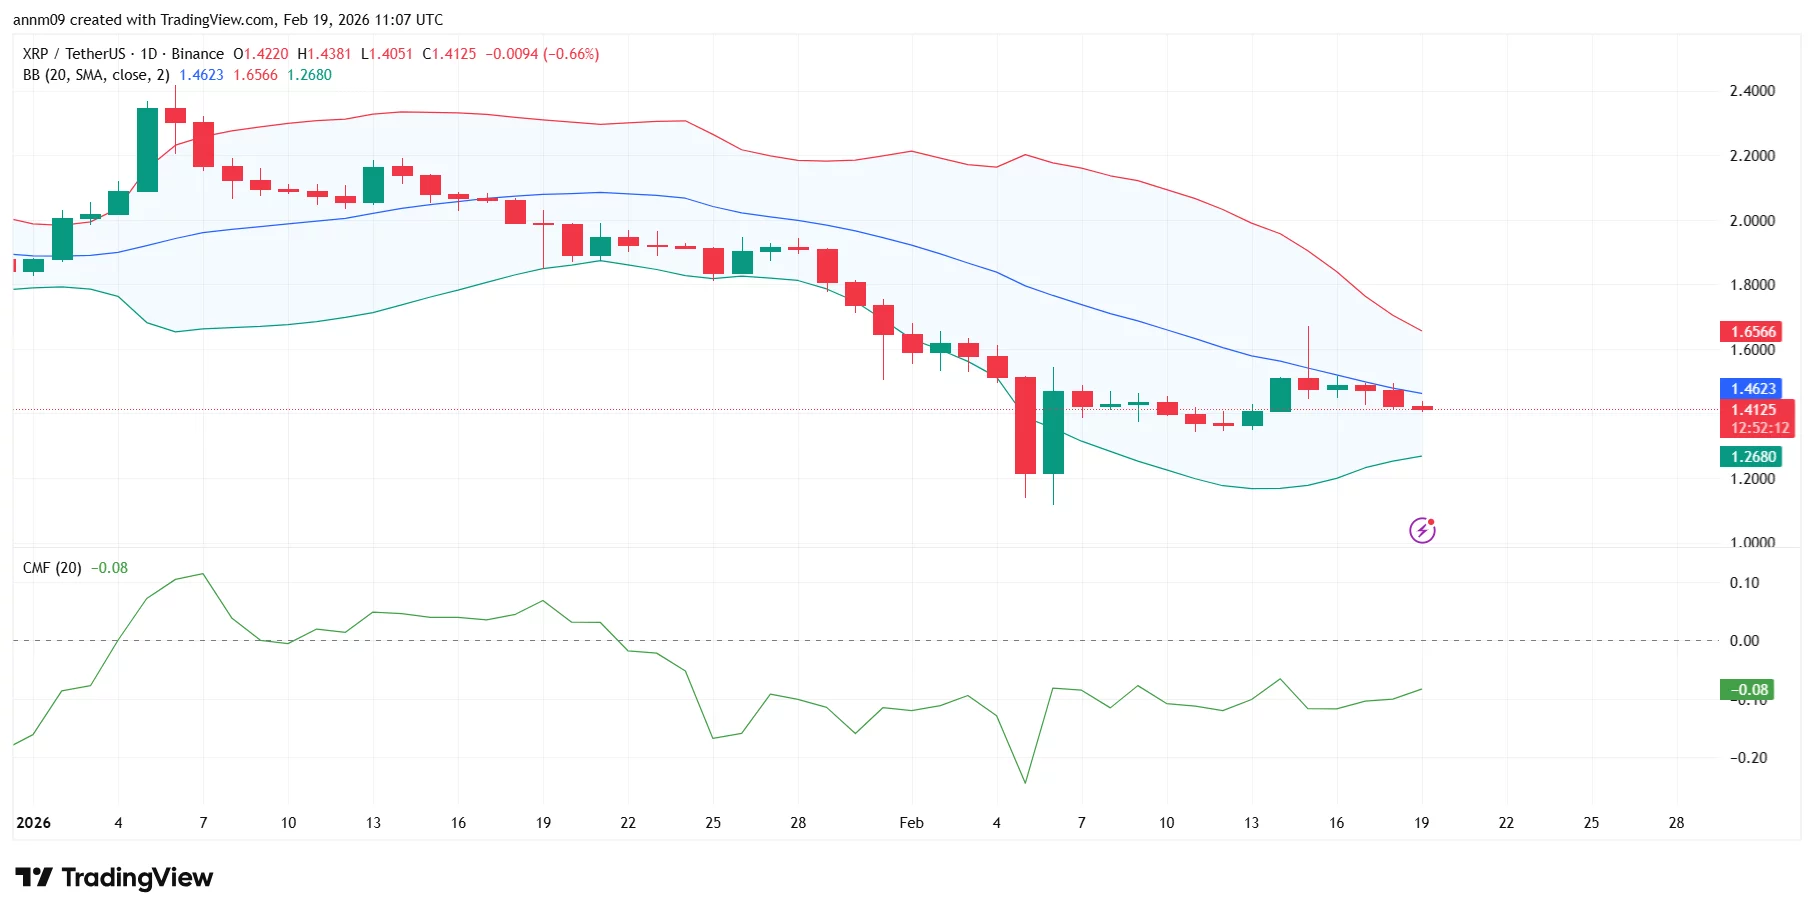
Price is sitting below the mid-Bollinger Band (around $1.46), while the upper band near $1.65 acts as dynamic resistance.
CMF remains slightly negative, indicating limited buying conviction. Immediate support rests at $1.35, followed by the recent swing low near $1.25. Resistance is seen at $1.46, with a stronger barrier at $1.60–$1.65.

TLDR:
- Nexo’s cumulative credit withdrawals hit an all-time high of $863 million between 2025 and 2026.
- Weekly retail withdrawals on Nexo surged 107%, climbing from $6.73M to $13.92M in just one month.
- CryptoQuant’s Estimated Leverage Ratio reset to healthier levels, pointing to reduced systemic risk across crypto markets.
- Bitcoin’s stabilization near $67,000 is lowering collateral risks, making crypto-backed borrowing more practical for users.
Nexo’s cumulative credit withdrawals have reached an all-time high of $863 million between 2025 and 2026. This record arrives as Bitcoin stabilizes near $67,000 following a -48% correction between October and February.
The broader crypto market is now shifting from sharp repricing toward steady consolidation. Weekly retail borrowing on Nexo nearly doubled from December 2025 to January 2026. This renewed activity points to growing confidence among crypto-backed liquidity users.
Retail Credit Withdrawals Signal a Market Shift
Nexo’s retail credit withdrawals declined through most of 2025, reflecting a broad risk-off trend. Many clients moved to tighten their balance sheets as crypto prices fell sharply.
However, the pace slowed considerably in late 2025 and early 2026. This leveling off suggests that retail participants have mostly completed their balance sheet tightening.
Weekly retail withdrawals grew from $6.73 million to $13.92 million between December 2025 and January 2026. That jump represents approximately 107% growth in just one month.
The data shows borrowing demand returned quickly once market conditions began steadying. Clients are clearly more willing to access crypto-backed credit in the current environment.
CryptoQuant’s Estimated Leverage Ratio has also been resetting to healthier levels during this period. Declining leverage across the market often creates a foundation for more sustainable borrowing activity.
As excess leverage clears, participants tend to re-engage credit markets with renewed conviction. This broader trend aligns with the withdrawal data now emerging from Nexo.
Bitcoin’s stabilization near $67,000 plays a direct role in this borrowing recovery. A steadier price environment lowers the risk of rapid collateral liquidation for active borrowers.
When the leading cryptocurrency consolidates, crypto-backed lending becomes a more practical financial tool. Nexo users appear to be responding directly to this change in market conditions.
Cumulative Withdrawals and the Path to Renewed Confidence
Nexo’s $863 million in cumulative credit withdrawals reflects consistent demand across multiple market cycles. This figure covers borrowing activity through both bullish and bearish price periods.
It confirms that appetite for crypto-backed liquidity holds up even during extended corrections. The milestone speaks to the resilience of Nexo’s lending model over time.
Open interest across the broader crypto market has declined from prior highs. Funding rates are also normalizing, and liquidation volumes have been subsiding in recent weeks.
These conditions are typical of a market absorbing the final stages of a correction cycle. They create a more stable ground for platforms offering crypto-backed credit solutions.
Selling pressure around Bitcoin has also weakened noticeably in recent weeks. Reduced sell-side activity supports a more stable price for collateral-backed borrowers.
Borrowers on platforms like Nexo benefit directly when Bitcoin holds within a tighter price range. Credit activity tends to pick up naturally as volatility subsides.
Recent data from Nexo suggests the market may now be entering a new borrowing phase. Weekly withdrawal growth and cumulative figures together tell a coherent recovery story.
Borrowing demand is returning as the correction cycle winds down. The broader crypto credit market appears to be stabilizing after months of contraction.

Bitcoin (BTC) is forming what may prove to be a fifth consecutive red monthly candle, which would be the longest losing streak since 2018. The silver lining is that data suggests that March may prove to be a profitable month for BTC.
Previous multimonth downtrends were followed by 300% price gains
Historical price data from CoinGlass confirms Bitcoin is now facing its fifth consecutive red month, down 15% this month after closing the previous four months in the red.
The last time this happened was in 2018, when it entered a bear market after reaching record highs in 2017.
“Last time this happened was in 2018/19 when we saw 6 red months,” analysts at macro investor outlet Milk Road said in an X post on Thursday.
This led to a reversal with over 316% returns over the following five months, the analysts said, adding:
“If history repeats, the reversal will begin on April 1st.”

Analyzing Bitcoin’s quarterly performance during the 2022 bear market provides a more cautious interpretation of BTC price history. The data shows Bitcoin recorded four consecutive red quarters during that year.
Losses stacked across the four quarters, bringing the total losses to 64% as the BTC/USD pair closed the year at $16,500 from an opening price of $46,230. This marked one of the harshest drawdowns in Bitcoin’s history.
As Cointelegraph reported, many analysts expect 2026 to be a bear market year, and a similar stretch of four losing quarters could extend the weakness below the 15-month low of $60,000.

Analyst Solana Sensei shared a chart that focused on Bitcoin’s weekly performance, with the price printing the fifth candlestick in a row.
This is the longest streak since 2022, making it the second-longest losing streak on record.
In 2022, BTC price saw nine red weeks, dropping to $20,500 from $46,800.

Therefore, while past monthly performance suggests an impending rebound, quarterly and weekly data from 2022 demonstrate that BTC price declines could last longer than expected.
Related: Bitcoin’s consolidation nears ‘turning point’ as $70K comes in focus: Analyst
The current market is “fundamentally different”
Veteran analyst Sykodelic argues that Bitcoin’s current bear phase is “fundamentally different” for several reasons, including the monthly relative strength index (RSI) having already reached the 2015 and 2018 bear market lows.
Sykodelic said that due to the lack of a true overbought expansion in the monthly RSI during the bull phase, market participants will be misguided to expect a symmetric contraction.
“This is yet again another situation in which we look a lot more like 2020 than any other period in time,” the analyst said in a post on X, adding:
“I am not seeing anything that tells me we are in the same style bear market as we have had previously, and everyone should be aware of these differences.”

This suggests the current bear cycle is not following historical patterns, and Bitcoin’s bottom and subsequent recovery could catch many traders off guard.
This article does not contain investment advice or recommendations. Every investment and trading move involves risk, and readers should conduct their own research when making a decision. While we strive to provide accurate and timely information, Cointelegraph does not guarantee the accuracy, completeness, or reliability of any information in this article. This article may contain forward-looking statements that are subject to risks and uncertainties. Cointelegraph will not be liable for any loss or damage arising from your reliance on this information.


One year has passed since Argentine President Javier Milei backed a project that drove hundreds of thousands of people worldwide to invest in Libra, a meme coin that turned out to be a rug pull.
Alfonso Gamboa Silvestre, a 25-year-old from Chile, was among the many traders who suffered steep losses. The token’s launch and swift demise cost him $10,000. Since that moment, he has left the crypto industry for good.
A Presidential Endorsement That Drove a Buying Frenzy
On Valentine’s Day last year, Gamboa Silvestre was trading on his computer. The day seemed normal until a notification popped up on his phone from one of the many crypto groups he had on Telegram.
He opened the message, which read something along the lines of “Argentina’s president just launched a crypto token.” Gamboa Silvestre ran to X (formerly Twitter) to see whether it was true.
At first, he thought Milei’s account had been hacked. But after carefully reading the president’s verified tweet and the “Viva La Libertad Project” website he included, Gamboa Silvestre ruled out the possibility.
So he bought the token. In total, he invested $5,000.
“I made two purchases. First, a smaller one. When I was totally sure it was [Milei’s] tweet, I made a bigger one,” Gamboa Silvestre told BeInCrypto in an interview in Spanish.
After that, Gamboa Silvestre left the house to go out to dinner with his family, but he couldn’t keep his eyes off his phone. Libra’s price kept dropping, and he didn’t know what to do.
Choosing what looked best on the menu and averting his family’s worried gaze was hard enough, so he locked himself in the restaurant’s bathroom.
“At first I thought the token was going to go down, and then it was going to go back up to infinity,” Gamboa Silvestre said. “But that didn’t happen. I saw that it was going down and down, and my February 14th ended up being a nightmare.”
As investors began withdrawing their money en masse, so did Gamboa Silvestre. He ended up doubling his original investment in losses.
The event also marked his permanent exit from the crypto ecosystem.
From Active Trader To Complete Exit
Gamboa Silvestre first ventured into crypto in 2016, mostly out of curiosity. However, he began to take it seriously in 2022 and became an active trader.
The meme coin sector had treated him well at first.
Gamboa Silvestre was among the first investors in TRUMP and MELANIA, the two tokens launched by US President Donald Trump and First Lady Melania Trump less than 48 hours before Trump assumed the presidency.
He fared well for himself, and he believed that the story would be similar with Libra.
“I thought that, since Milei had been having different meetings with Donald Trump and Elon Musk, I said, well, this is going down the same path, they’re going to do things right, and I’m going to be able to make money with that,” Gamboa Silvestre recalled.
But things didn’t turn out that way. Besides the money he lost, Gamboa Silvestre surrendered something that was even more important to him: his love for crypto.
“After what happened with Libra, I completely stepped away from that world. I stopped doing something that I really liked that had generated me a lot of profitability during that period,” he said. “In the future, I saw myself only living from that. But I lost all confidence.”
Today, the only ties that Gamboa Silvestre has left to the industry are his participation in a class action brought against Milei.
Data Disputes Milei’s Claims
Gamboa Silvestre is one of 212 investors seeking reparation for their losses in a lawsuit pending in Argentina.
Even though Milei has repeatedly dialled down the impact that LIBRA had on investors, the facts tell a different story.
According to data from Ripio, just one centralized exchange operating in the country, 1,329 citizens lost money. These numbers directly contradicted Milei’s previous claims that only a handful of Argentine investors had been affected.
Argentines weren’t the only ones who had lost money. The impact was international, affecting investors anywhere from Bosnia to Lebanon to Australia.
In the United States, a separate class action lawsuit is moving forward against Hayden Davis, the American investor and CEO of Kelsier Ventures, who has been accused of being the mastermind behind the project.
Trust Erodes As Investigation Continues
Despite it being a year since Libra launched, Milei has yet to provide a coherent explanation of his level of involvement in the token project.
According to Agustín Rombolá, one of the lawyers representing the complainants in the class action, Milei’s answers have varied greatly over the past year.
“He first told us it was a casino, that you don’t cry in the casino. Then he told us that he had the right to sell his opinions. And then he told us that he was not working as the president at the moment of the tweet. [After that], he told us he was scammed,” Rombolá told BeInCrypto.
According to Congressman Maximiliano Ferraro, one of the most outspoken critics in the Libra scandal, Milei has yet to address a key issue regarding his role in the case.
“There are still many questions unanswered. Who approached the President, and how did they give him that [smart contract address] that had more than 40 characters and did not have a public status?” Ferraro said in an interview in Spanish.
As the investigation into what happened continues, the financial damage is still being tallied, as is the loss of trust.
For Gamboa Silvestre and thousands of others, Libra was not just a failed investment but a turning point that reshaped their relationship with crypto altogether.
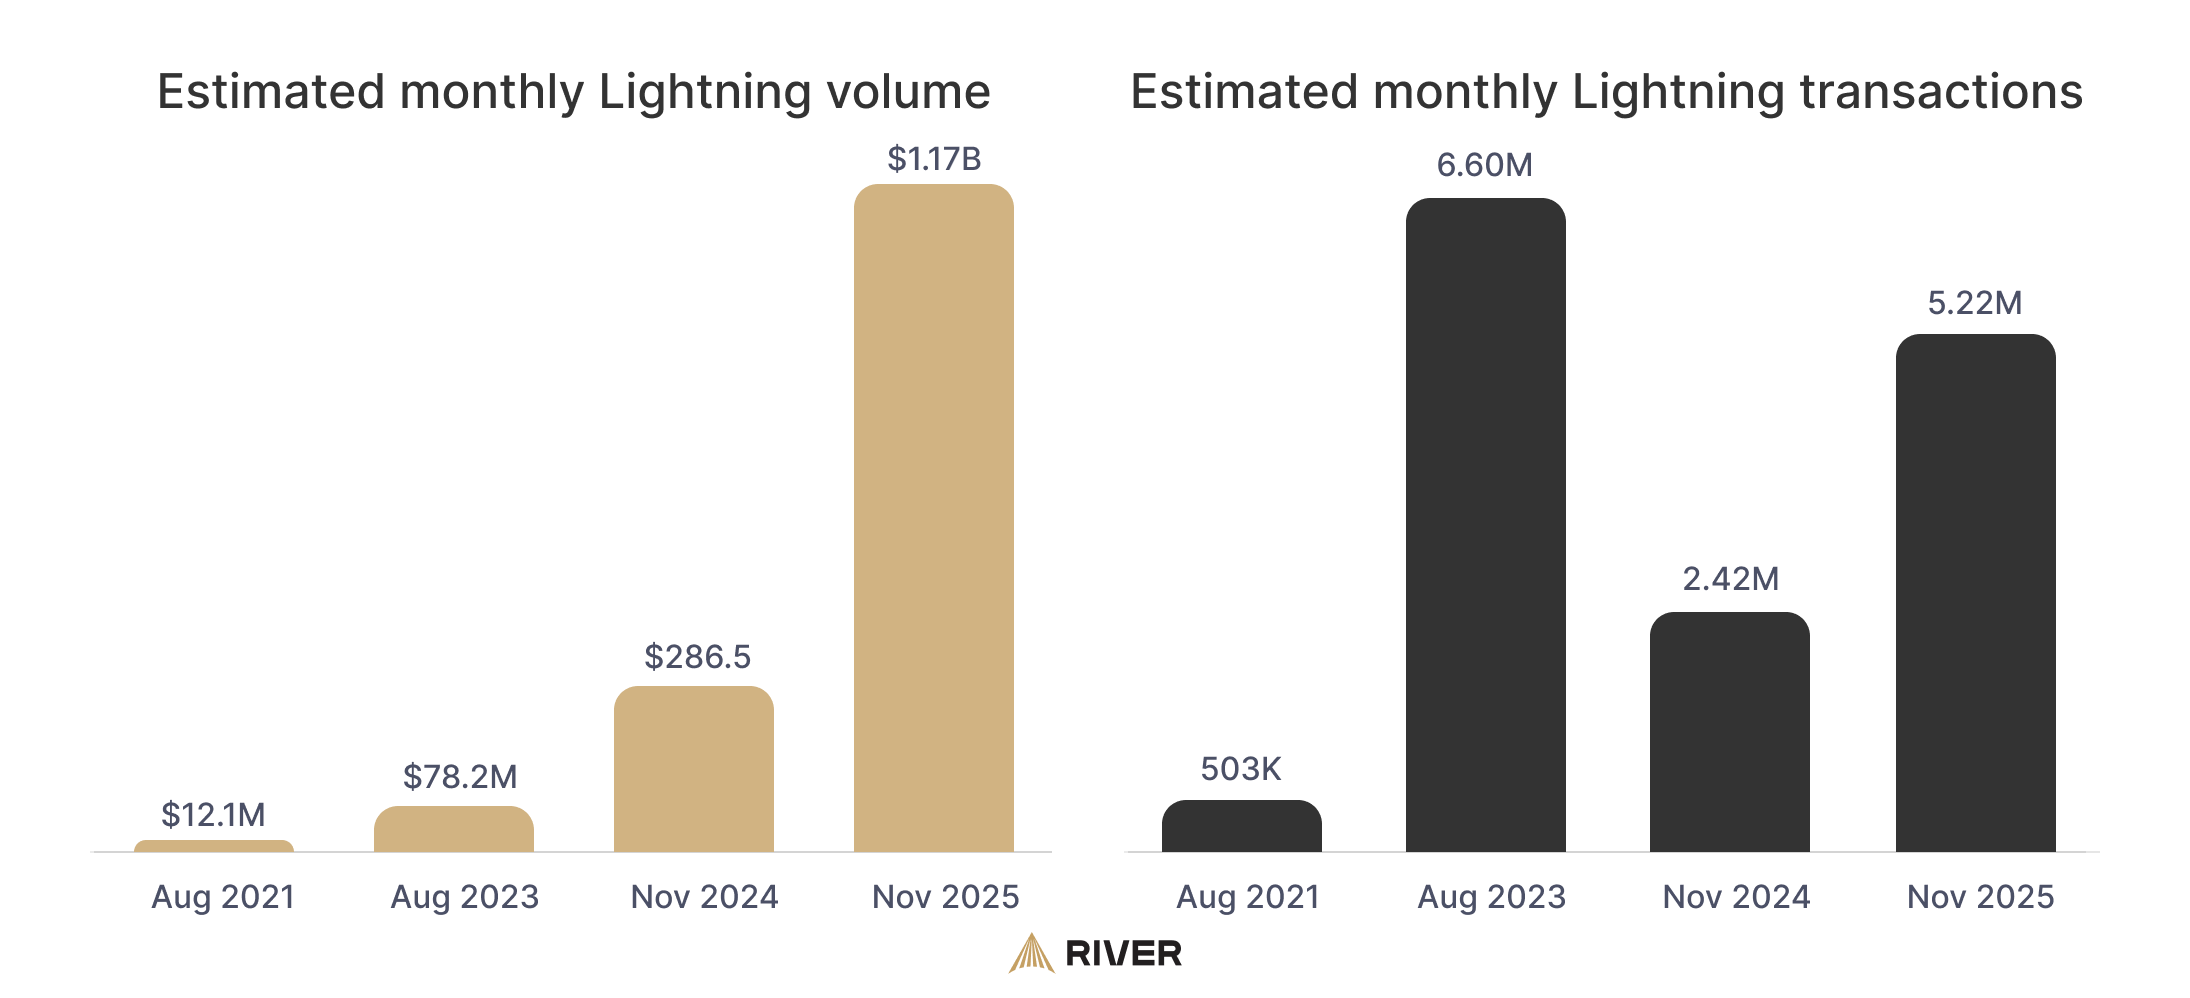
Monthly transaction volume on the Bitcoin (BTC) Lightning Network, a secondary layer for BTC that enables payment use cases, surpassed the $1 billion milestone in November 2025, according to a report from Bitcoin financial services company River.
Transaction volume on the Lightning Network hit an estimated $1.1 billion in November, across 5.2 million transactions, according to a report shared by Sam Wouters, River’s director of marketing. The report said:
“Lightning adoption happened despite the price declining all of November and generally not doing much in 2025. The adoption was largely driven by exchanges, as well as a growing number of businesses accepting bitcoin payments.”

However, the total transaction count in 2025 is lower compared with 2023, when monthly Lightning transactions peaked at 6.6 million in August of that year, which River attributed to experiments with micropayments in gaming and messaging apps.
The report forecast a similar surge in Lightning transactions as individuals and businesses experiment with AI payments.
The Bitcoin Lightning Network helps scale the Bitcoin network, enabling Bitcoin payments between parties that settle in seconds instead of minutes, encouraging Bitcoin’s use as a medium of exchange, instead of just a risk asset or store of value.
Related: Voltage rolls out USD-settled Bitcoin Lightning credit line for businesses
Exchanges and institutional clients adopt Lightning Network
The Lightning Network reduces transaction costs and settlement times by opening up a payment channel between two or more parties to handle transactions offchain, posting only the net balance of the channel to the Bitcoin ledger once it is closed.
Typically, Bitcoin blocks take 10 minutes on average to be added to the ledger, severely limiting BTC payments, particularly for smaller purchases at physical businesses.
In December 2025, the Lightning Network’s capacity, the total number of coins locked on the network for liquidity, reached 5,606 BTC, as more companies and institutions began using it.

Secure Digital Markets, an Institutional trading and lending company, sent crypto exchange Kraken $1 million in a Lightning transaction in February.
The transaction showed that large, seven-figure amounts can be transferred between institutional parties using Bitcoin’s layer-2 scaling network.
Magazine: Bitcoin may take 7 years to upgrade to post-quantum: BIP-360 co-author


The EF announced its 2026 Protocol priorities, emphasizing scalability, user experience, and security, as the network prepares for the Glamsterdam upgrade.
The Ethereum Foundation (EF) has outlined its Protocol priorities for 2026, focusing on scalability, improved user experience, and enhanced network security.
Over the coming year the EF looks to push its gas limit “toward and beyond” 100 million, lean into account abstraction and interoperability, and continue to “harden the L1” focusing on security, censorship resistance, and network resilience.
Today’s initiative release comes shortly after co-executive director Tomasz Stańczak announced his intent to step down at the end of the month. Stańczak indicated he will continue to spend his professional time in the Ethereum ecosystem, working closely with developers and founders. Bastian Aue is assuming interim co-executive director duties for the time being.
The Foundation established Protocol in June 2025 as an improved and more responsive path towards network development. This initiative potentially laid the groundwork towards Ethereum co-founder Vitalik Buterin’s new outlook on the Layer 2 ecosystem, and lays the foundation for future network upgrades like Glamsterdam and Hegota.
Glamsterdam, which is expected to ship in the first half of 2026, is comprised of up to 22 different Ethereum Improvement Proposals (EIPs) and focuses on Layer 1 scalability.
This article was generated with the assistance of AI workflows.


Russia plans liability for gray-market crypto after fraud-linked bank freezes.
Summary
- Central bank wants liability for crypto deals outside regulated segment, citing rising fraud complaints.
- Over 1,800 Russians sought help after bank account freezes tied to suspicious crypto inflows.
- Officials push legalization for cross-border crypto payments while preparing broader licensing regime.
Russia’s central bank has proposed new penalties for cryptocurrency operations conducted outside the country’s regulatory framework, according to statements reported by Russian state media on Wednesday.
Central Bank of Russia
Central Bank of Russia Governor Elvira Nabiullina said during a financial cybersecurity forum that prosecution of unregulated cryptocurrency transactions is necessary to address fraud concerns.
“Fraudsters are taking advantage of the gray market,” Nabiullina stated, according to the official TASS news agency. “A systemic solution is, of course, regulating cryptocurrency with the introduction of liability for transactions outside the regulated segment.”
The central bank chief added that the institution has submitted proposals to the government and is currently in discussions regarding the changes.
Nabiullina noted that Russians who sell cryptocurrency frequently face banking restrictions, with their accounts suspended when received funds are linked to fraudulent activities. More than 1,800 individuals contacted Russian law enforcement agencies in the past three months seeking restoration of banking services after being added to a state database for suspicious transactions, according to government newspaper Rossiyskaya Gazeta on Thursday.
During the same conference in Yekaterinburg, VTB Bank CEO Andrey Kostin called for accelerated legalization of cryptocurrency transactions, particularly for payment purposes. The executive of Russia’s second-largest bank said a significant number of clients, including major exporters, are requesting cryptocurrency payment options, according to news portal Gazeta.ru.
VTB, which is majority state-owned and subject to Western sanctions, announced plans last year to launch cryptocurrency trading through brokerage accounts once regulations are established.
Russia’s push toward cryptocurrency legalization has been driven primarily by the need for international settlement options. In October, the Ministry of Finance and the Central Bank agreed to legalize cryptocurrency payments in foreign trade, enabling Russian firms to circumvent financial restrictions imposed by Western nations over the conflict in Ukraine.
Moscow authorities aim to replace an experimental legal regime for such transactions with comprehensive legislation covering cryptocurrency activities, including investment and trading. The framework will be based on a regulatory concept proposed by the central bank in late December that would recognize cryptocurrencies and stablecoins as “monetary assets.”
Parliamentary Financial Markets Committee Chairman Anatoly Aksakov urged swift action on crypto market regulation at the Yekaterinburg forum, stating that the unregulated sector has resulted in significant financial losses.
Russian authorities have indicated plans to approve the legislation by summer, according to reports.
Industry analysts interviewed by business news outlet RBC this week suggested that Russian regulators may restrict access to foreign cryptocurrency exchanges such as Bybit and OKX once domestic regulations are implemented. Nikita Zuborev, senior analyst at crypto exchange aggregator Bestchange.ru, predicted such restrictions could occur after Russia begins licensing domestic cryptocurrency service providers, potentially by year-end.

Painful decline or a bull run to $1: what is next for PI?
Pi Network’s PI has been the best-performing top 100 cryptocurrency over the past week, with its valuation rising by almost 40%.
Although some market observers foresee additional short-term gains, one factor could dampen their enthusiasm by hinting at a renewed decline.
The Bears Are Coming Back?
PI has finally managed to reverse its massive downtrend over the last several months, posting an upswing to as high as $0.20 just days ago. Currently, it trades at around $0.18 (per CoinGecko’s data), placing it well in green territory on a seven-day and two-week timeframe.
With its market capitalization soaring to roughly $1.7 billion, the asset now ranks as the 47th-largest cryptocurrency. The evident recovery has put PI back in focus, making it one of the most-trending tokens on CoinGecko lately.
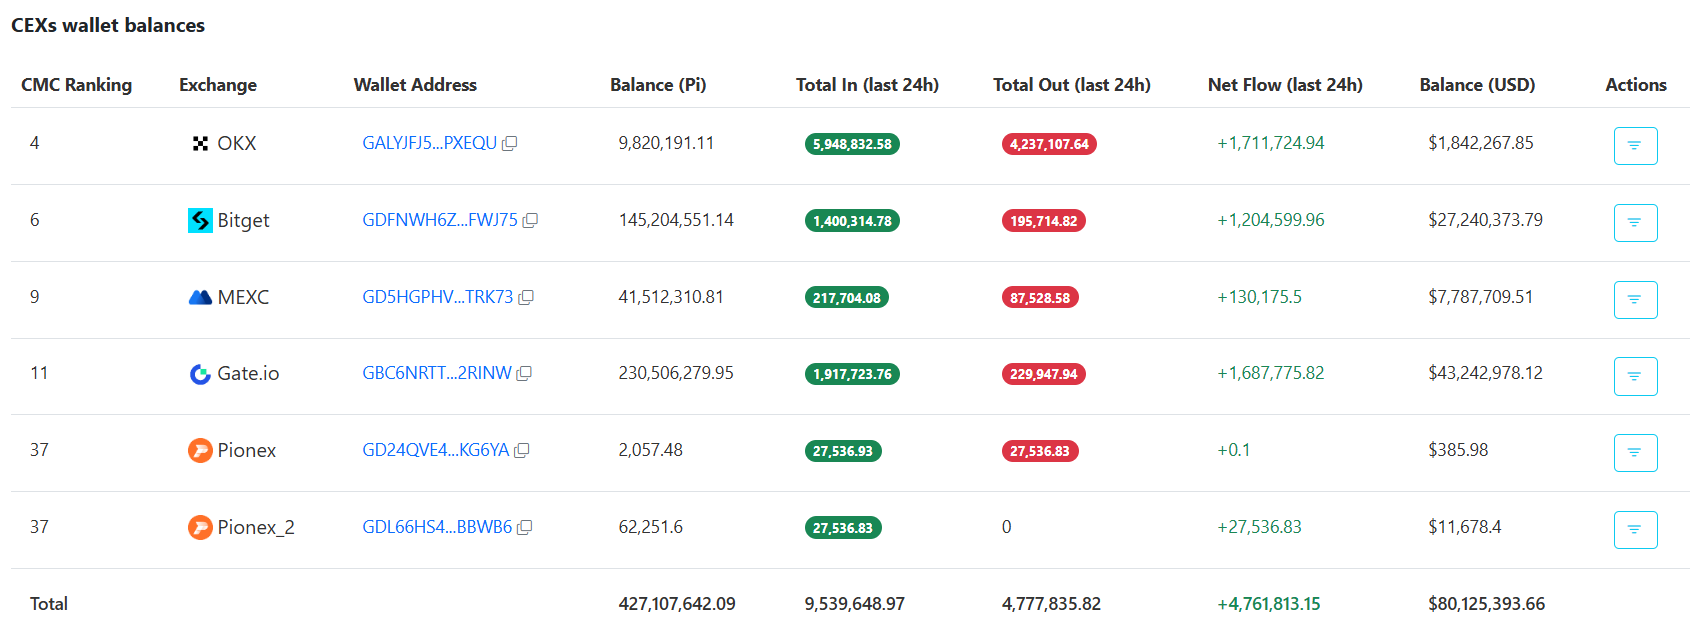
The good days, though, may be coming to an end because the amount of coins stored on crypto exchanges has risen sharply. Almost 5 million PI have been transferred to such platforms in the last 24 hours alone, bringing the total to approximately 427.1 million. More than half of that is held on Gate.io, while Bitget ranks second with approximately 145.2 million tokens.
While the shift from self-custody to centralized exchanges doesn’t guarantee a price correction, it is often viewed as a bearish signal, as it could be interpreted as a pre-sale step.
The aggressive token unlocks scheduled for the coming days should also serve as a warning to investors. Data indicates that daily figures will approach 15 million on several occasions before the end of February. After that, though, the process is set to slow down.
You may also like:

New Push From the Bulls?
Contrary to the aforementioned factors, some community members believe PI is on the verge of a more serious surge in the short term. X user Pi Network Academy argued that the asset “is warming up for another big pump,” predicting an explosion to $1.
For their part, Pi Global claimed that “momentum is building, utility is expanding, and community is stronger than ever.” That said, they wondered if the coin’s valuation could hit $0.50 before Pi Day. The date (March 14) is symbolic to Pi Network because it resembles the mathematical constant π (3.14).
Earlier this month, X user Captain Faibik also chipped in. The renowned crypto analyst revealed they had added some PI for the midterm, expecting a 500% rally.
SECRET PARTNERSHIP BONUS for CryptoPotato readers: Use this link to register and unlock $1,500 in exclusive BingX Exchange rewards (limited time offer).
Disclaimer: Information found on CryptoPotato is those of writers quoted. It does not represent the opinions of CryptoPotato on whether to buy, sell, or hold any investments. You are advised to conduct your own research before making any investment decisions. Use provided information at your own risk. See Disclaimer for more information.

Few cryptocurrencies are as polarizing as XRP. Critics across the crypto and DeFi ecosystem often claim XRP has no real utility. They argue it exists mainly as a speculative asset with limited real-world use.
At the same time, XRP maintains one of the largest and most vocal communities in crypto – The XRP Army. They believe the altcoin will eventually power global financial infrastructure.
The truth sits somewhere between those two extremes. XRP does have real utility, but its usage is more specific and narrower than many assume.
XRP is More Unique Than Any Other Cryptocurrency
XRP is the native token of the XRP Ledger, launched in 2012 with a clear purpose: enabling fast and efficient cross-border payments.
Unlike Bitcoin, which focuses on decentralized value storage, or Ethereum, which focuses on programmable smart contracts, XRP was designed primarily to move money between financial systems quickly and cheaply.
Transactions on the XRP Ledger settle in about three to five seconds and cost a fraction of a cent. This makes XRP particularly efficient as a bridge currency, allowing instant conversion between two different fiat currencies without requiring banks or payment providers to hold large reserves in foreign accounts.
Millions Hold XRP — But Most Usage Comes From Traders and Infrastructure
Retail investors make up the largest group of XRP users today. As of early 2025, the XRP Ledger had roughly 6 to 7 million funded accounts, which represent wallets holding XRP.
After adjusting for exchange custody and users holding multiple wallets, analysts estimate around 2 to 3 million individuals globally actually hold XRP.
Crypto exchanges are another major user. Platforms such as Binance, Bitstamp, Kraken, and Uphold use XRP for liquidity management and transfers.
XRP’s speed and low cost make it an efficient tool for moving funds between exchanges and managing trading liquidity.
Payment providers also represent a key real-world use case. Companies like SBI Remit in Japan and Tranglo in Southeast Asia use XRP through Ripple’s On-Demand Liquidity system to facilitate international remittances.
In these cases, XRP acts as a temporary bridge asset, allowing money to move across borders instantly without pre-funded foreign accounts.

Banks Use Ripple Technology, But Only Select Partners Actually Use XRP
Banks, however, present a more nuanced picture. Major financial institutions including Santander, Standard Chartered, and Bank of America have used Ripple’s payment infrastructure.
But most of them use Ripple’s messaging and settlement software without directly using XRP itself. Only select payment providers, rather than global banks broadly, use XRP directly for liquidity.
Beyond financial transfers, XRP also plays an essential technical role within its own network. Every XRP Ledger account must hold XRP, and all transactions require XRP to pay network fees.
XRP supports decentralized trading, token issuance, and asset transfers on the ledger.
So, XRP is neither useless nor universally adopted. Its utility exists in specific financial infrastructure roles, particularly in liquidity provisioning and payment settlement.
Understanding who actually uses XRP reveals a clearer picture—one grounded in real-world function rather than speculation.
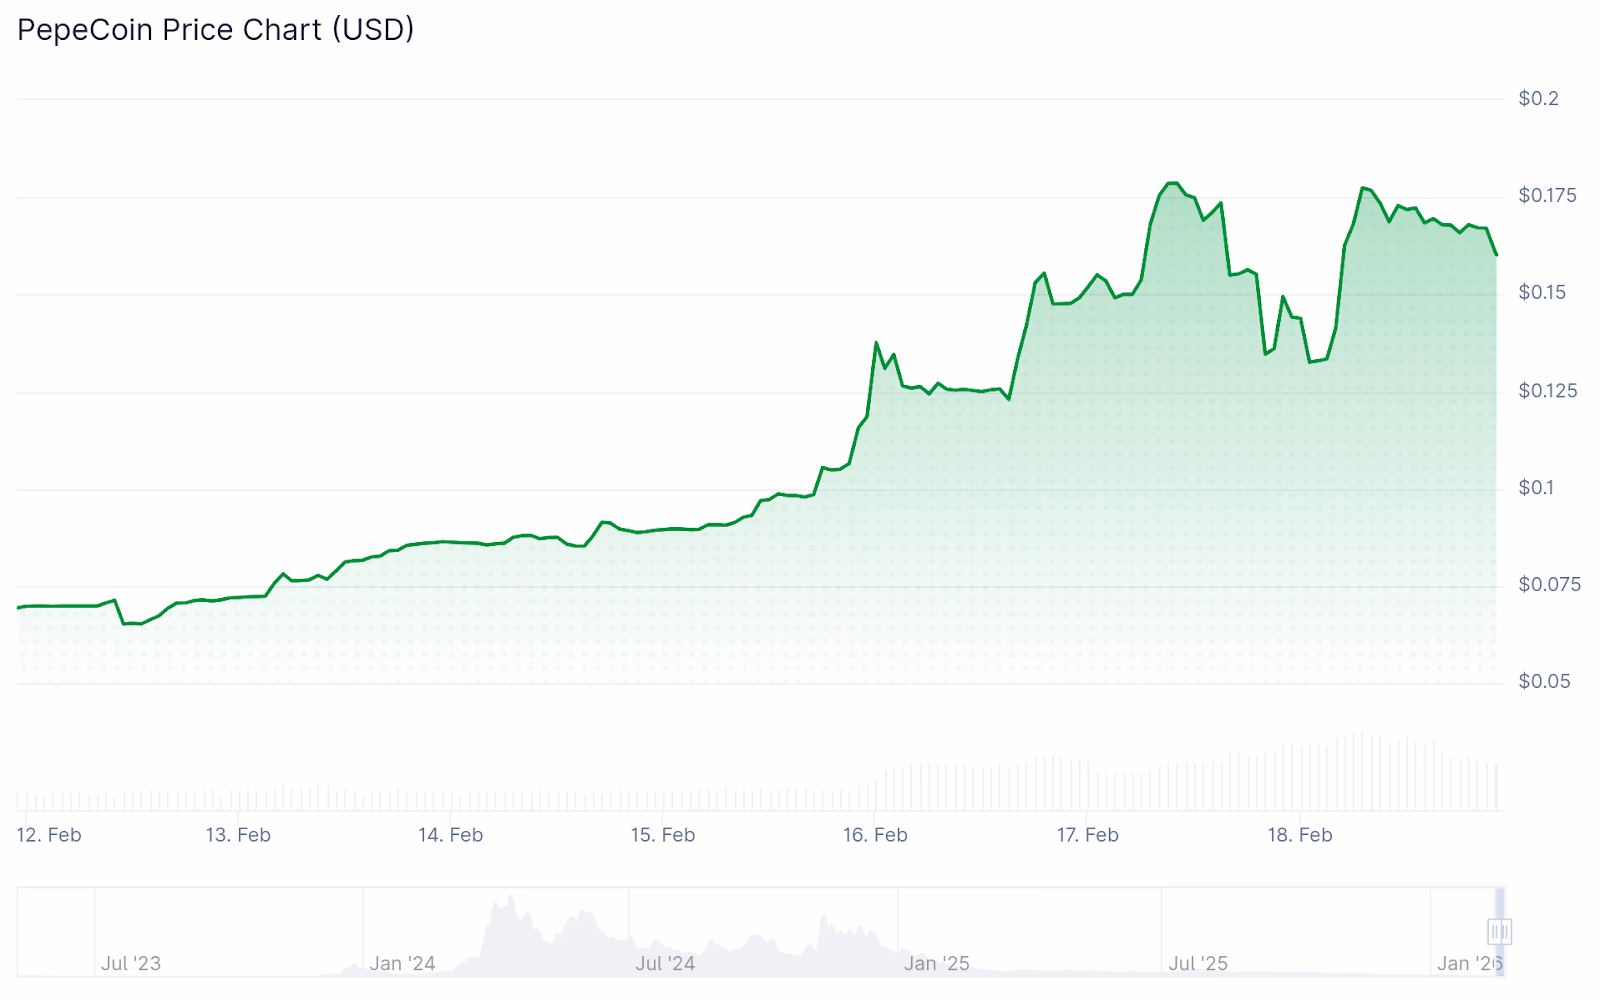
The acquisition closed on Friday and should enable Kraken to work closely with token teams early in development.
U.S.-based centralized exchange (CEX) Kraken announced its acquisition of token management platform Magna yesterday.
The deal closed on Friday and marks the CEX’s latest strategic move as it prepares for an initial public offering (IPO).
The move was reported by Fortune, which said Kraken declined to disclose the deal terms, but Kraken’s co-CEO Arjun Sethi told the news outlet that the acquisition will allow Kraken to support token issuer teams “early on in their life cycle,” indicating that it may provide Kraken a strategic leg up in terms of token listings.
While it is unlikely there is any connection, Kraken also moved to list and promote a memecoin from 2016, PEPECOIN, yesterday, which trades at just a $15 million market capitalization, and should not be confused with PEPE, which launched in 2023 and trades at a $1.7 billion market capitalization.
PEPECOIN is only up 7.6% since the announcement, indicative of the market’s risk-off environment.

Despite the market’s lack of enthusiasm for the listing, the Magna acquisition and the listing of a micro-cap token on the same day may indicate continued aggression from Kraken in expanding asset diversity on the exchange.

Alysa Liu wins women’s figure skating gold to cap glittering comeback story

Logitech G435 Lightspeed Wireless Gaming Headset Offers Great Performance at an Even Better Price
Which America’s Next Top Model Contestants Spoke Out About Netflix Documentary?


-

 Video3 days ago
Bitcoin: We’re Entering The Most Dangerous Phase
-

 Tech5 days ago
Luxman Enters Its Second Century with the D-100 SACD Player and L-100 Integrated Amplifier
-

 Crypto World3 days ago
Can XRP Price Successfully Register a 33% Breakout Past $2?
-

 Sports3 days ago
GB's semi-final hopes hang by thread after loss to Switzerland
-

 Video7 days ago
The Final Warning: XRP Is Entering The Chaos Zone
-
 Tech3 days ago
The Music Industry Enters Its Less-Is-More Era
-

 Business2 days ago
Infosys Limited (INFY) Discusses Tech Transitions and the Unique Aspects of the AI Era Transcript
-

 Entertainment1 day ago
Kunal Nayyar’s Secret Acts Of Kindness Sparks Online Discussion
-

 Video3 days ago
Financial Statement Analysis | Complete Chapter Revision in 10 Minutes | Class 12 Board exam 2026
-

 Tech2 days ago
Retro Rover: LT6502 Laptop Packs 8-Bit Power On The Go
-
 Crypto World6 days ago
Bhutan’s Bitcoin sales enter third straight week with $6.7M BTC offload
-
 Sports21 hours ago
Clearing the boundary, crossing into history: J&K end 67-year wait, enter maiden Ranji Trophy final | Cricket News
-

 Entertainment1 day ago
Dolores Catania Blasts Rob Rausch For Turning On ‘Housewives’ On ‘Traitors’
-

 Crypto World7 days ago
Kalshi enters $9B sports insurance market with new brokerage deal
-

 Business2 days ago
Tesla avoids California suspension after ending ‘autopilot’ marketing
-
 NewsBeat4 days ago
The strange Cambridgeshire cemetery that forbade church rectors from entering
-

 Crypto World1 day ago
WLFI Crypto Surges Toward $0.12 as Whale Buys $2.75M Before Trump-Linked Forum
-
 NewsBeat4 days ago
Man dies after entering floodwater during police pursuit
-

 Crypto World3 hours ago
83% of Altcoins Enter Bear Trend as Liquidity Crunch Tightens Grip on Crypto Market
-

 NewsBeat5 days ago
UK construction company enters administration, records show