
Crypto World
U.S. Senate housing bill includes CBDC ban

The Senate Committee on Banking, Housing and Urban Development included a provision temporarily barring the Federal Reserve from issuing a central bank digital currency in its bipartisan bill to boost housing in the U.S.
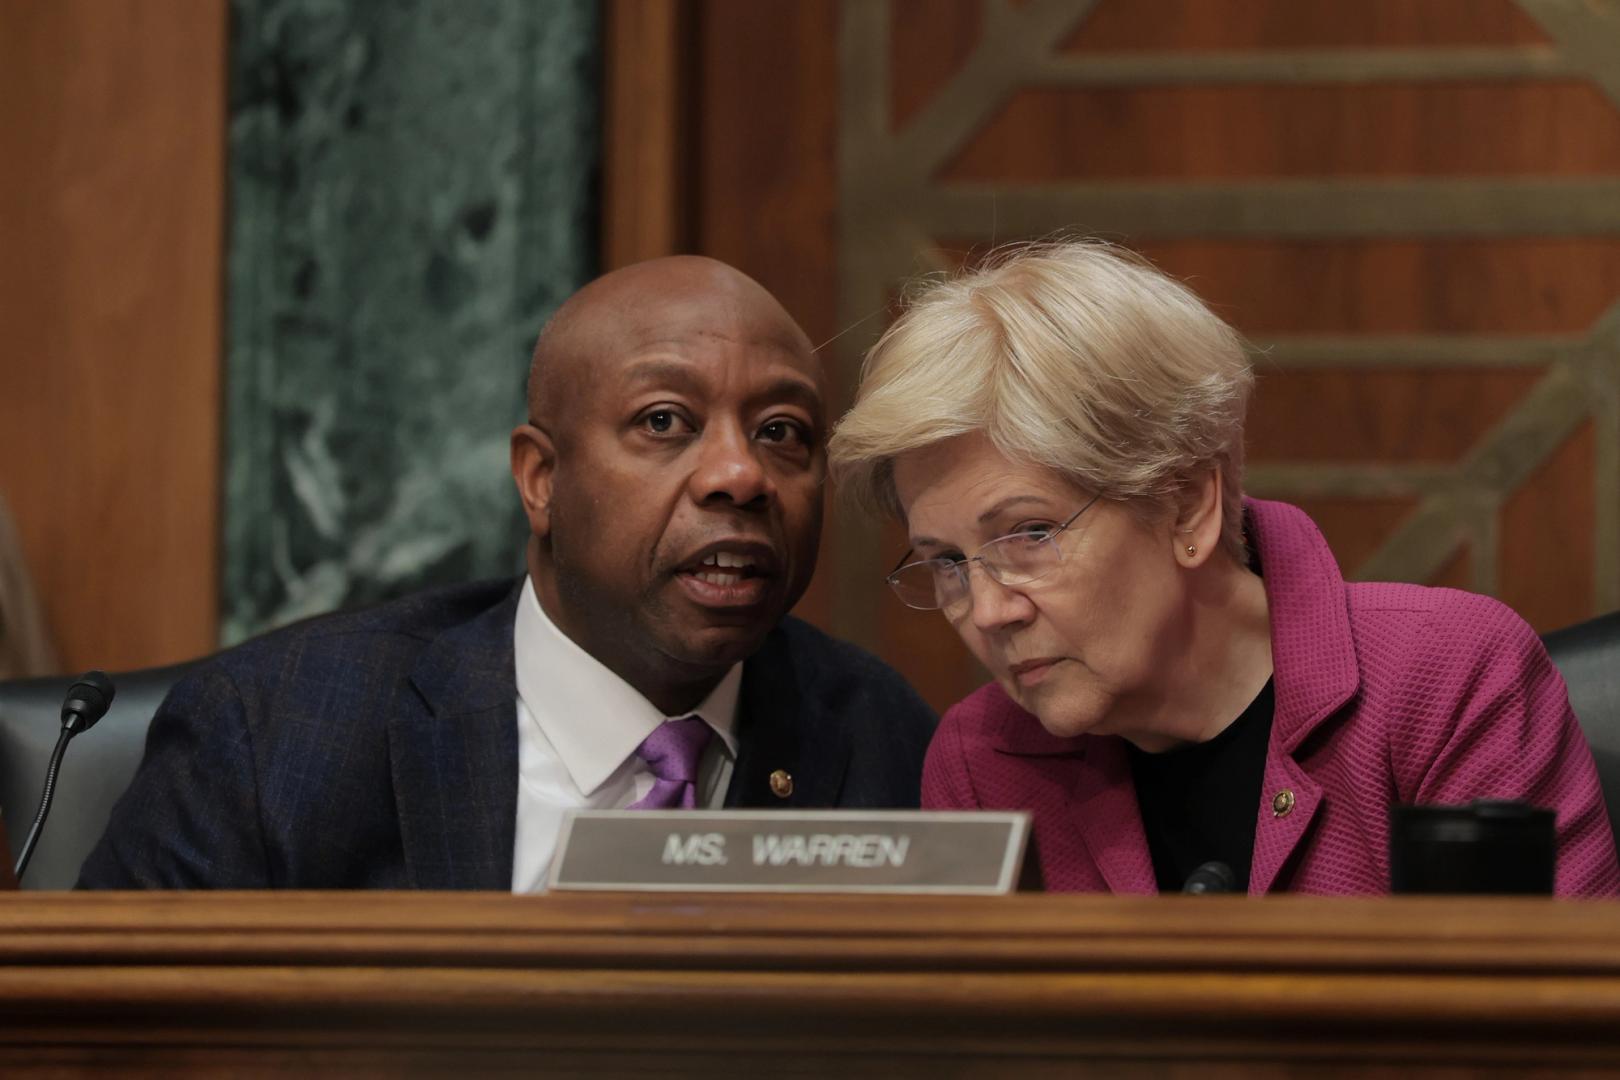
The “21st Century ROAD to Housing Act,” introduced Monday by Committee Chairman Tim Scott and Ranking Member Elizabeth Warren, respectively the top Republican and Democrat on the committee, aims to make it easier to build houses in the U.S.
“Not only is this bill about cutting regulatory red tape, lowering costs, and expanding housing supply while generating no new spending, but it’s about making sure people like the single mom who raised me in North Charleston, South Carolina, have even greater access to economic opportunity and the American dream of homeownership,” Scott said in a statement.
“The package includes the vast majority of the Senate’s unanimously supported ROAD to Housing Act, incorporates bipartisan housing ideas from the House, and takes a good first step to rein in corporate landlords that are squeezing families out of homeownership,” Warren said in her own statement.
Neither lawmaker mentioned the CBDC ban, which occupies just two pages in the 303-page bill. Lawmakers have included the ban in previous bills, and the House of Representatives passed it as a standalone bill last year, but it has so far not made it all the way through Congress.
“Except as provided in subsection (c), the Board of Governors of the Federal Reserve System or a Federal reserve bank may not issue or create a central bank digital currency or any digital asset that is substantially similar to a central bank digital currency directly or indirectly through a financial institution or other intermediary,” the section said.
It included a sunset provision for Dec. 31, 2030 and carved out an exception for permissionless, private “dollar-denominated” currencies that “fully preserve the privacy protections” of physical currency.
The White House published a “Statement of Administration Policy” supporting the bill, explicitly supporting the CBDC provision in the two-paragraph statement.
“The Administration highlights the inclusion of presidential priorities … to halt the development of a Central Bank Digital Currency that could be [sic] pose significant threats to personal privacy and liberty,” the statement said.

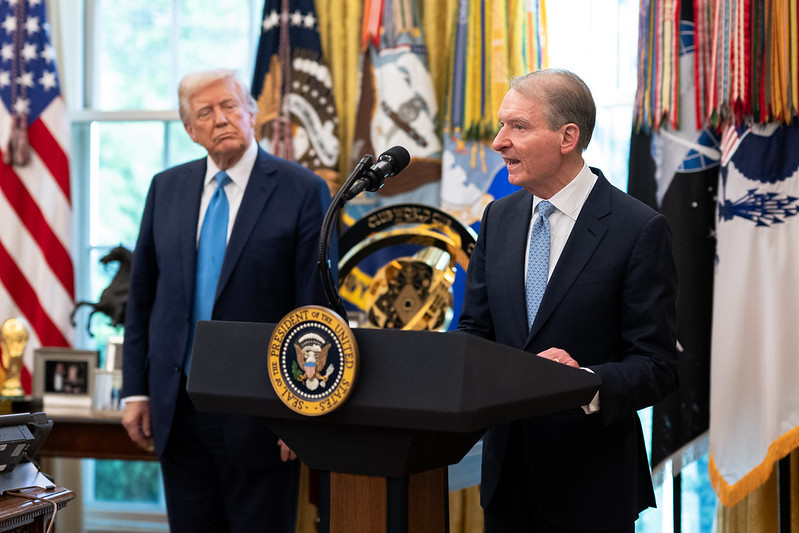
The US Securities and Exchange Commission’s former top enforcement official reportedly clashed with the regulator’s top brass before resigning last week, with part of the reason being how the agency handled cases involving those close to US President Donald Trump.
Margaret Ryan, the ex-director of the SEC’s Division of Enforcement, wanted to pursue fraud and other charges in cases involving those in Trump’s orbit, but was resisted by SEC Chair Paul Atkins and other Republican political appointees, Reuters reported on Monday, citing people familiar with the matter.
Two cases that created tension between Ryan and the SEC’s top officials involved crypto entrepreneur Justin Sun and Tesla CEO Elon Musk, both of whom have ties to Trump, with Musk serving as a special White House adviser.
Ryan resigned from the SEC on March 16 after just over six months in her role. An SEC announcement that day did not detail the reason of her resignation.
It comes as the SEC has been under increased scrutiny from Democratic lawmakers over its U-turn on crypto-related cases, as the agency under Trump has dropped or settled multiple cases launched under former SEC chair Gary Gensler.

The SEC did not immediately respond to a request for comment. Ryan could not be reached for comment.
Sun and Musk cases a major source of tension
The SEC’s case involving Sun was reportedly among the cases that frustrated Ryan. The agency ended its lawsuit against Sun and three of his companies earlier this month with a $10 million settlement.
The SEC first sued Sun in March 2023, alleging that he and three of his companies sold unregistered securities and engaged in manipulative wash trading. The settlement saw Sun and his companies neither admit nor deny the SEC’s allegations.
Sun became the largest investor in the Trump family’s crypto project, World Liberty Financial, in November 2024 after buying $30 million worth of its tokens. He increased his stake to a total of $75 million in January 2025.
Related: SEC sends proposed crypto interpretation to White House for review
An SEC enforcement official told Reuters that the case against Sun was complicated by shifting crypto guidance and pending crypto laws. It was their understanding that Ryan supported the settlement, but her signature did not appear on court documents.
Tron, a company named in the SEC’s lawsuit, did not immediately respond to a request for comment. It has previously denied commenting on pending legal matters.
The SEC’s case against Musk, filed in the final week of Gensler’s tenure, was also a sticking point for Ryan. The SEC sued Musk in January 2025, claiming he failed to disclose that he “acquired beneficial ownership” of Twitter, now X, in early 2022, allowing him to purchase shares at lower prices.
The SEC and Musk said in a joint court filing on March 17 that they were now in talks to settle the lawsuit. Both the cases against Sun and Musk were reportedly strong and had a good chance of the SEC winning in court, according to lawyers closely following the lawsuits.
Magazine: How crypto laws changed in 2025 — and how they’ll change in 2026
The company that built decentralized finance (DeFi) powerhouse Balancer is closing.
Balancer co-founder Fernando Martinelli announced Tuesday that Balancer Labs, the corporate entity that incubated and funded the decentralized exchange protocol, will be shutting down.
The decision comes roughly five months after a v2 exploit in November 2025 that drained approximately $110 million in digital assets, as CoinDesk first reported, including osETH, WETH, and wstETH, the third known security breach for the project and the one that created the legal exposure Martinelli cited as the reason for shutting down BLabs.
“BLabs, as a corporate entity, has become a liability rather than an asset to the protocol’s future and is just not sustainable as is without any sources of revenue,” Martinelli wrote in a governance forum post.
Martinelli added he “seriously considered” shutting everything down entirely. But he stopped short of calling for a full wind-down because the protocol still generates revenue.
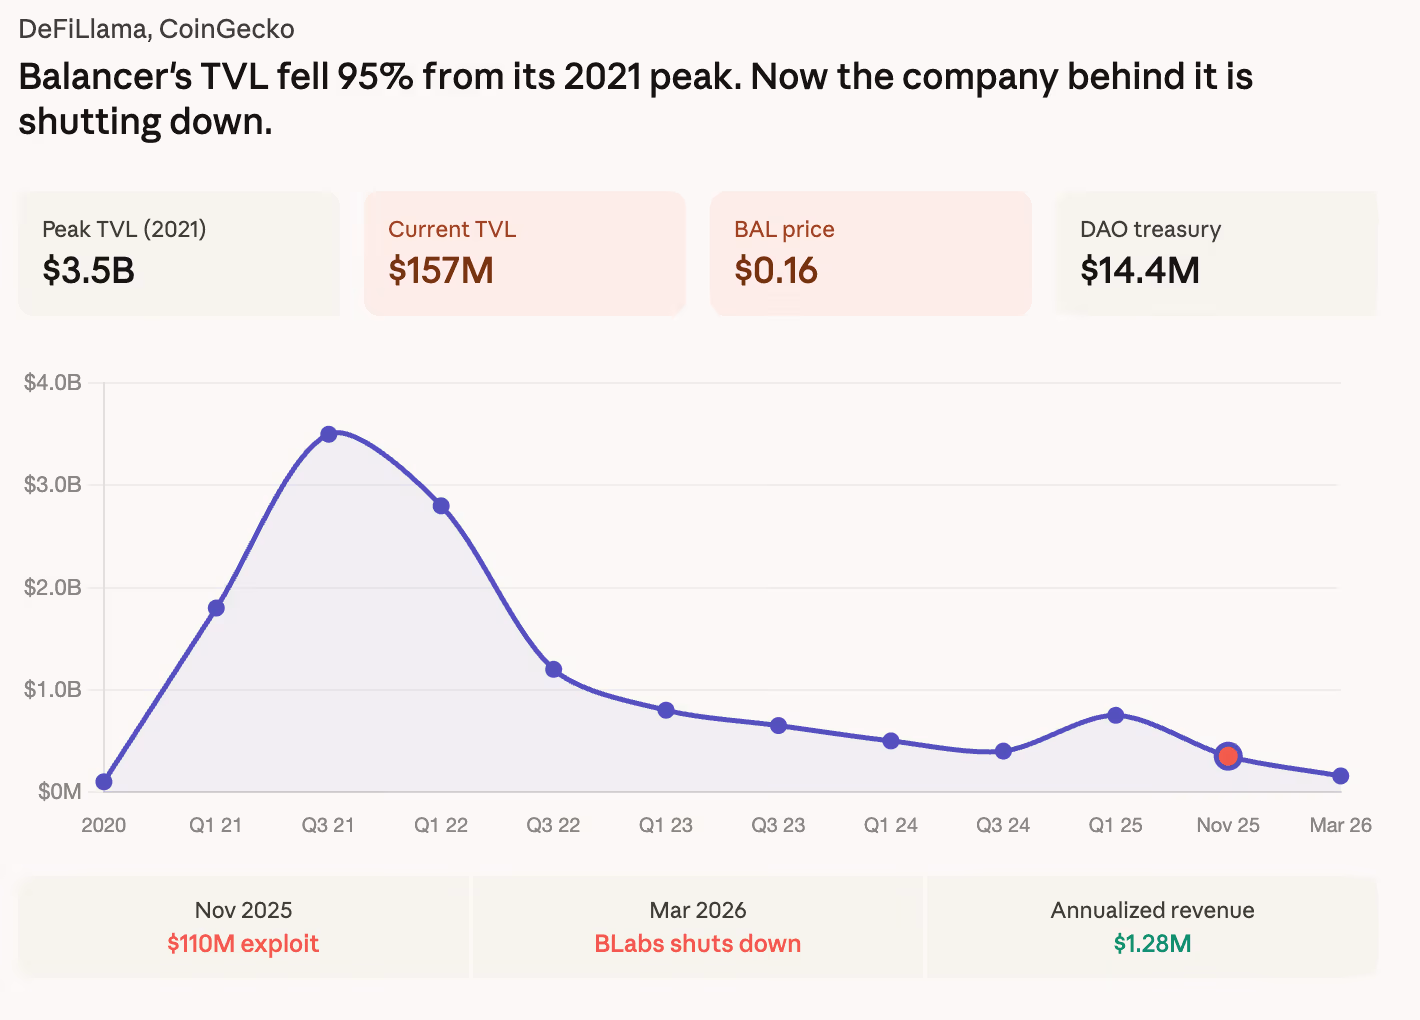
Balancer was one of the defining names of the DeFi boom. At its peak in late 2021, the protocol held nearly $3.5 billion in total value locked, putting it alongside Aave, Uniswap, and Curve as foundational infrastructure for decentralized trading.
DeFiLlama data shows TVL at $2.96 billion as of October 2021, with fees spiking above $6 million annualized. But the TVL now sits at $157 million, a 95% drop from peak.
The market cap has fallen to $10 million. BAL trades at $0.16 against a fully diluted valuation of $11 million, meaning it trades far below net asset value.

Balancer produced over $1 million in annualized fees over the past three months. That’s not enough to sustain the current operation, but it’s enough to sustain a much leaner one.
The restructuring plan the remaining team is proposing is aggressive. BAL emissions would be cut to zero, ending what Martinelli described as a “circular bribe economy that costs more than it generates.”
The veBAL governance model, which he said was captured by meta-governance protocols like Aura and bribe markets that made voting “unrepresentative of the actual Balancer front line,” would be wound down.
Protocol fees would be restructured so the DAO treasury captures 100% of revenue instead of the current 17.5%. The v3 protocol share would drop to 25% to attract organic liquidity. And a BAL buyback would offer holders exit liquidity at a fair price.
“If you believe in the restructured Balancer, you stay. If you don’t, you get a fair exit,” Martinelli wrote. “That’s honest dealing, and it clears the overhang.”
Essential BLabs team members would be absorbed into Balancer OpCo pending a governance vote. Martinelli himself will have no formal relationship with the protocol after the wind-down but offered to serve as an advisor.
The product scope is narrowing to five areas where the team sees differentiation: reCLAMM pools, liquidity bootstrapping pools, stablecoin and liquid staking token pools, weighted pools, and expansion to non-EVM chains. Everything else gets cut.
BAL was trading at $0.72 as of Tuesday morning, down roughly 88% from its all-time high.

Balancer Labs, the corporate backbone behind the Balancer DeFi protocol, is winding down after years of pressure and a devastating $116 million hack in November. Executives say the move is aimed at preserving the protocol’s long-term viability by shifting control to leaner, cost-efficient governance structures rather than preserving a non-revenue-bearing entity.
In a message from Balancer Protocol co-founders, Fernando Martinelli and Marcus Hardt, the plan is clear: Balancer Labs has become a liability rather than an asset to the protocol, and continuing its operations under the current model is unsustainable. “After careful consideration, I have decided to wind down Balancer Labs. This is not a decision I take lightly,” Martinelli wrote, underscoring that the corporate entity has been absorbing liabilities tied to past incidents without delivering commensurate value.
Hardt echoed the sentiment, acknowledging that the pace of liquidity acquisition came at a cost, diluting Balancer token holders (BAL) in the process. The team is proposing a pivot toward a lean continuation path, with governance moving to a Balancer Foundation and the protocol’s decentralized autonomous organization (DAO) framework. In their view, reducing operating costs and reconfiguring revenue capture could unlock more sustainable upside for the community and BAL holders.
Balancer’s journey from its heyday to today is a cautionary tale for DeFi protocols: a combination of ecosystem stress, security breaches, and shifting incentives can erode value even for blue-chip protocols. Balancer was among the prominent DeFi players during the 2020–2021 bull market, reaching a peak TVL of about $3.3 billion in November 2021. However, the landscape shifted dramatically in the following years, and Balancer’s total value locked has since deteriorated. By October 2025, Balancer’s TVL sat around $800 million, and after the November hack, another roughly $500 million exited within two weeks. Today, Balancer’s TVL is reported near $158 million, illustrating how difficult it remains for DeFi protocols to recover from major security incidents and reputational shocks.
Martinelli argued that the November exploit created real and ongoing legal exposure, making the burden of maintaining a corporate entity that carries the liability of past security incidents untenable. The practical implication is a shift of authority and responsibility away from a centralized corporate structure toward community-led governance that can react more nimbly to risk and opportunity.
Key takeaways
- Wind-down of Balancer Labs and shift to DAO governance: The Balancer Foundation and the protocol’s DAO would assume primary responsibility, moving away from the operating model of Balancer Labs.
- Debt, risk, and historical shocks as core drivers: A $116 million hack in November and ongoing legal exposure have pushed leadership to pursue a leaner, more cost-conscious structure.
- TVL deterioration since the 2021 peak: From a 2021 high of $3.3B to roughly $158M today, with a $500M drop in the two weeks following the November exploit, underscoring the fragility of DeFi liquidity post-crisis.
- Tokenomics under review: Two Balancer proposals are on the table—operational restructuring and a revamp of BAL tokenomics—to empower the DAO to capture revenue and align incentives.
- Revenue signal amid restructuring: Balancer reportedly generated just over $1 million in revenue across the past three months, suggesting real activity exists beneath a challenging economic overlay.
Strategic pivot: from corporate entity to governance-led continuity
The core strategic question facing Balancer is how to preserve the protocol’s value proposition—composability, liquidity pools, and automated market-making—while severing the liabilities associated with the old corporate structure. Martinelli’s framing centers on transforming Balancer’s future into a governance-driven enterprise. By transferring stewardship to the Balancer Foundation and the DAO, the project aims to unlock a more disciplined cost base and ensure that incentives align with long-term sustainability rather than short-term liquidity subsidies.
Hardt’s commentary reinforces this stance. He cautioned that the push to attract liquidity had grown disproportionately expensive relative to the revenue Balancer generated, a dynamic that ultimately diluted BAL holders. The proposed path forward emphasizes cost containment, lower operating expenses, and a revenue model that better channels yields to the DAO’s treasury and governance processes rather than a centralized corporate structure.
Economic realities and what changes on the ground?
The historical context matters for readers trying to gauge what “lean continuation” means in practice. Balancer’s ascendancy in 2020–2021 rested on robust liquidity and diversified pools, but the market eventually exposed fragilities in governance and tokenomics when external shocks hit. The November hack—paired with the legal exposure Martinelli cites—highlights a broader risk for DeFi firms that relied on centralized entities for continuity even as the core protocol operates in a decentralized manner.
Under the proposed framework, the Balancer Foundation would assume operational stewardship, while the DAO would govern protocol parameters through member-driven decisions. The two ballot items circulating among Balancer DAO members reflect the proposed reorganization: one addressing operational restructuring and the other focused on a tokenomics revamp for BAL. Although no exact timelines were provided, the proposals mark a formal step in transitioning from a traditional corporate governance model to a decentralized, community-led structure that could potentially reclaim incentives for users, liquidity providers, and token holders alike.
Despite the restructuring narrative, leadership remains focused on validating the protocol’s underlying utility. Martinelli stated that Balancer “still has real value to build from here.” He emphasized that the challenge lies not in the functionality of Balancer itself but in the economics surrounding the token and the cost structure that has weighed on the ecosystem. “That’s not nothing — that’s a functioning protocol buried under a broken tokenomics model and an overweight cost structure,” he noted, underscoring the possibility that a well-executed governance and tokenomics revamp could recalibrate Balancer’s market position without requiring a complete rebuild.
In a more forward-looking frame, Hardt reiterated optimism about a transition that could yield a stronger, more sustainable protocol on the other side. “Balancer still has real value to build from here. If we can make this transition work, we have a real chance to build a stronger and more sustainable protocol on the other side of it,” he said, signaling that the venture’s potential remains intact if governance and economics align with community incentives.
Implications for BAL holders and the broader DeFi community
For BAL holders, the shift toward DAO governance and a leaner mechanism for revenue capture represents both risk and potential upside. The current tokenomics, which critics have described as misaligned with the protocol’s growth trajectory, could be redesigned to better reward active participation, liquidity provision, and governance involvement. If the two ballot proposals gain traction, the resulting changes could recalibrate how BAL accrues value, potentially restoring confidence among participants who have watched the token’s price and utility drift amid structural changes.
From a broader industry perspective, Balancer’s move illustrates a growing trend: large DeFi protocols rethinking corporate versus community governance as they navigate liquidity headwinds and the consequences of security incidents. The tension between preserving a functioning, revenue-generating protocol and maintaining an agile, decentralized structure remains central to these debates. In practice, the governance pathway could become a litmus test for how effectively a DAO can steward a sophisticated liquidity protocol through a period of stress without sacrificing security or user trust.
Investors and builders should monitor how the Balancer Foundation and DAO approach risk, security, and revenue generation in the coming months. The balance between cost discipline, user incentives, and governance empowerment will likely shape Balancer’s ability to attract new liquidity, preserve its core utility, and demonstrate a model for other protocols facing similar crossroads.
Historically, Balancer’s story contains a recurring theme: the technology can be sound, but economics and governance determine whether a protocol can endure. The forthcoming ballots and any subsequent actions will reveal whether this is a pivot toward vitality or a transition toward obsolescence.
As the community awaits the outcome, readers should note that the questions are less about whether Balancer’s code works and more about whether the economics and governance can be aligned to sustain meaningful activity, liquidity, and value creation in a shifting DeFi landscape.
What remains uncertain is the timeline for the governance transition and the exact design details of the proposed tokenomics revamp. Yet the intent is clear: reframe Balancer as a lean, community-led platform that can endure beyond the current corporate-era constraints and deliver durable value to users and stakeholders alike.
In the coming weeks, observers will want to track the ballot results and any subsequent updates from the Balancer Foundation and DAO, as these will signal the protocol’s willingness to embrace this new governance paradigm and the potential trajectory for BAL’s future utility and distribution of value within the ecosystem.
Bitmine Immersion Technologies chairman Tom Lee has tipped an end to the “mini-crypto winter” impacting Ether, as the company bought another $139 million in ETH last week, bringing it closer to its goal of hitting 5% of the token’s total supply.
Lee said in a statement on Monday that Bitmine has maintained a higher buying pace over the last three weeks as it expects the end to a several-month-long Ether slump in its “base case.”
The crypto markets crashed in October last year, with Bitcoin (BTC) falling from its all-time peak above $126,000 during the month, while Ether declined from its August high of $4,946. Analysts have been debating when the crypto markets will see a meaningful rebound.
Lee pointed to positive catalysts, such as the CLARITY Act advancing in Congress and crypto’s relative stability despite recent turmoil in Iran, as signs that winter is starting to thaw.
“As many have noticed, crypto and particularly ETH have outperformed the broader market since the Iran war commenced, with ETH rising 18% and outperforming equities by 2,450 basis points,” he said.
“This is a marked contrast to Gold, a traditional store of value, which has fallen more than 15%. Crypto is demonstrating itself to be a good ‘wartime’ store of value,” Lee added.

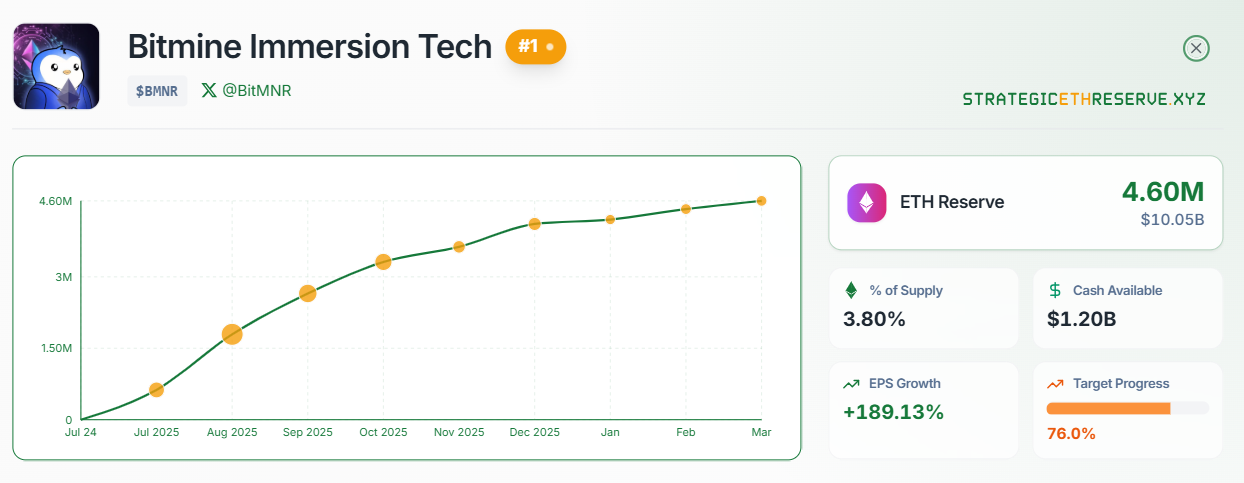
Lee’s statements came as Bitmine disclosed it had purchased an additional 65,341 Ether in the past week (worth $139 million), bringing total holdings to more than 4.6 million tokens.
Bitmine nears Ether accumulation goal
Bitmine has stockpiled roughly 3.86% of the total circulating supply of 120.6 million since announcing its crypto pivot eight months ago.
To reach its goal based on the current total supply, the company will need to buy roughly 1.4 million tokens, which, at current prices, would cost roughly $2.9 billion, according to CoinGecko.
Ether does not have a fixed supply; it can increase or decrease based on whether more is burned than issued.
Related: Early Ethereum whale rebuilds stack with $19.5M in ETH buys
The firm has also leaned heavily into staking, with more than three million of its Ether currently staked.
Bitmine also reported other holdings, including $1.1 billion in cash, 196 Bitcoin, a $200 million stake in Beast Industries, a media company founded by YouTuber Jimmy “MrBeast” Donaldson and a $95 million stake in e-commerce inventory management platform Eightco Holdings.
A flood of companies pivoted to crypto in 2025, with Bitmine rising to the second-largest behind Michael Saylor’s Strategy in terms of holdings. However, some, like the multinational bank Standard Chartered, predict that not all will survive in the long term, which may force them to adopt new strategies or fade away.
StrategicEthReserve is currently tracking 67 large treasury holders of Ether, with Bitmine leading by a large margin. SharpLink Gaming, which held the top spot before being surpassed by Bitmine, is second with 863,000 Ether, while Ether Machine ranks third with 496,000 tokens.
Magazine: Google flags crypto malware, retiree loses $840K in ‘expert’ scam: Hodler’s Digest, Mar. 15 – 21
Two Delaware lawmakers are working to establish stablecoin regulations as part of a broader package of regulatory proposals aimed at “modernizing” the state’s financial sector.
In a statement on Monday, the Delaware Senate Democrats announced that Senator Spiros Mantzavinos and Representative Bill Bush had filed the Delaware Banking Modernization Act (Senate Bill 16) and the Delaware Payment Stablecoin Act (Senate Bill 19).
“This legislative package sends a signal loud and clear: here in Delaware, we’re democratizing our financial services and lowering the barriers to entry, making it easier for all residents to send, receive and save money with just an internet connection,” said Delaware Governor Matt Meyer.
Delaware has generally had a friendly and proactive approach toward crypto and blockchain. As far back as 2016, former Governor Jack Markell launched the Delaware Blockchain Initiative to attract blockchain firms. It has also made minor regulatory adjustments to support the sector.
However, some technology and crypto firms left the state last year, including Coinbase, which reincorporated in Texas after expressing dissatisfaction with Delaware’s Chancery Court, which handles corporate law disputes.
These two bills could help the state re-attract some of these businesses.
“Our administration is focused on attracting the jobs of the future to the First State, and that includes continuing to foster an innovative banking ecosystem that will open doors not just for workers and companies, but for every single person who participates in our economy,” added Meyer.
Stablecoin Act proposes a licensing framework
The stablecoin-focused bill aims to create a licensing framework for stablecoin issuers and digital asset service providers operating in Delaware.
The bill adopts language and definitions from the US government’s Stablecoins Act (GENIUS Act) and “other federal models.”
The bill outlines potential guardrails, including reserve shortfall remediation cascades, mandatory redemption timing standards, capital standards and anti-money laundering obligations.
If approved, the State Bank Commissioner would be directed to implement the rules within a specified timeframe.

Meanwhile, the Delaware Banking Modernization Act primarily focuses on traditional finance, updating corporate governance and organizational requirements for local banking institutions. However, it also references digital assets.
The bill also seeks to update Delaware banking code by providing definitions of digital assets in a bid to offer regulatory certainty around the sector and how it relates to traditional finance.
“It’s been more than four decades since we’ve made any meaningful updates to our state’s banking laws, and in that time, the way people bank and conduct transactions has changed significantly,” said Rep. Bush, adding: “We need to make sure our laws are keeping up with those changes.”
Both bills are still a way off from becoming law. The next stage of progression will see the bills reviewed by the Senate Banking Committee and then debated on by the full Delaware Senate.
The announcement also stated that the lawmakers will file another regulatory proposal in the coming days called the Delaware Money Transmission & Virtual Currency Modernization Act.
It primarily aims to implement consumer protections and standardize the types of activities required for licensing.
US politicians push for crypto regulation and clarity
The Delaware lawmakers aren’t the only ones this week signaling intent to push crypto-related legislation.
Related: Banks push tokenized deposits as onchain cash race intensifies: Report
In an X post on Monday, US Senator Bill Cassidy said he plans to advance his bill at the federal level to bring US “crypto tax rules into the 21st century.”
The bill, introduced in partnership with Senator Cynthia Lummis in September, seeks to address crypto taxation challenges and support the adoption of digital assets in the US.
The bill proposes a $300 de minimis rule for crypto purchases, ending double taxation for miners and stakers and providing taxation parity with other financial assets, among other things.
“It is important for America to be in the driver’s seat on digital assets for both our economy and our national security,” Cassidy said on X.

On Friday, the US Securities and Exchange Commission (SEC) sent two proposed rules to the White House’s Office of Management and Budget for review, which include a proposal to have most of the crypto assets on the market not treated as securities under federal law.
The proposal would see the SEC potentially change its approach to the industry, and would also give primary oversight of crypto non-securities to the Commodities Futures Trading Commission (CFTC).
Commenting on the move via X on Monday, CFTC chairman Mike Selig said his agency and the SEC want to stop crypto being left in “limbo” and provide “clarity for the crypto markets.”
Magazine: Are DeFi devs liable for the illegal activity of others on their platforms?
TRON DAO has scaled up its artificial intelligence fund by a factor of ten, from $100 million to $1 billion, targeting investments in and acquisitions of early-stage startups building core infrastructure for the agentic economy.
The billion-dollar fund, announced on Monday, will focus investments in four areas: agent identity systems, stablecoin-based payment rails, tokenized real-world assets (RWA), and developer tooling for autonomous financial systems.
The expansion is built on Tron DAO’s theses dating back to 2023, which foresees stablecoins becoming the practical medium of exchange between AI agents, stablecoins becoming the natural payment layer for “AI-augmented people,” and the rise of tokenized equity.
Blockchains race to support agentic AI
Tron is just one of many crypto-native ecosystems to expand investment into AI by targeting the agentic payment economy. Solana and Base have also made moves to expand into this nascent field; others recently include Visa, Stripe, and World.
In September, the Ethereum Foundation formally entered the agentic AI race with the launch of the “dAI Team,” which aims to make Ethereum the “preferred settlement and coordination layer” for AI agents and the machine economy.
However, it is a notable contrast to TRON’s approach as Ethereum is positioning itself as a trust and coordination layer rather than a payments rail, leaning into its decentralization ethos rather than competing on speed and fees.

Tron scaling to support AI agents, Justin Sun says
Tron said its blockchain is positioned to serve the future agentic economy with 370 million user accounts, more than $21 billion in daily transaction volume, and over $85 billion in circulating USDt (USDT).
Tron founder Justin Sun previously told Cointelegraph that many AI agent use cases involve small, frequent transactions, “which require networks that are fast and inexpensive to use.”
Average confirmation times are about three seconds on TRON, compared with roughly 12 seconds on Ethereum, “making it well-suited for high-frequency transactions,” he said, citing an Arkham report.
Related: Agentic AI commerce may spell the end of internet ads: a16z Crypto
Regarding scaling, he said the real question is what happens if AI agents move from a handful of applications to mainstream machine-to-machine commerce.
“To support this shift, infrastructure is beginning to develop around the ecosystem,” he continued, mentioning an AI agent framework recently launched on TRON called AINFT, which is designed to help developers build and deploy autonomous agents.
Magazine: Google flags crypto malware, retiree loses $840K in ‘expert’ scam: Hodler’s Digest


Monday’s ceasefire trade lasted about 18 hours.
Bitcoin climbed 3.1% to $70,352 on Tuesday morning, recovering from the weekend’s slide below $68,000, with ether (ETH), solana’s SOL, dogecoin and xrp gaining between 2-4%.
The Wall Street Journal reported Tuesday that Saudi Arabia has agreed to give the U.S. military access to King Fahd Air Base, reversing its earlier position that its bases couldn’t be used to attack Iran. The UAE has taken similar steps.
Gulf states joining the war directly would transform the conflict from a U.S.-Israel operation into a broader regional coalition, a significant escalation from what markets had been pricing.
Iran’s deputy speaker ruled out talks with the U.S., echoing the Fars news agency denial from Monday evening. The Strait of Hormuz remains effectively shut with only a trickle of vessels making their way through.
Traditional markets responded immediately. S&P 500 futures fell 0.5%. European shares were set to drop 0.8% at the open. Brent crude jumped 4% to about $104. The dollar strengthened 0.3%. Gold fell 1.5%, extending what is now its longest daily losing streak on record.
The gold collapse continues to be the most disorienting signal in global markets. A safe-haven asset falling to record losing streaks during an active and widening war breaks every historical precedent.
The most likely explanation is forced selling by funds facing margin calls across other positions, with gold being the most liquid asset to sell. But whatever the cause, it makes bitcoin’s relative stability even more notable. The token that’s supposed to be the volatile one is holding a range while the one that’s supposed to be steady is in freefall.
The five-day window Trump gave Iran expires Saturday, but Saudi Arabia joining the conflict changes the calculus entirely. A regional coalition fighting Iran is a different war from a U.S.-Israel air campaign, and it puts oil infrastructure on both sides of the Gulf at risk.
Bitcoin is holding $70,000 on a Tuesday morning where everything else is deteriorating. Whether that’s resilience or just the market waiting for the next headline to react to is the question the rest of the week will answer.


Bitcoin’s mining concentration problem just showed up on the blockchain itself, triggering a small “reorg.”
Foundry USA, the largest bitcoin mining pool, produced seven consecutive blocks late on Monday and in the process orphaned two valid blocks mined by AntPool and ViaBTC.
Think of it as two checkout lines opening at the same time in a busy store. At first, both lines are moving, but suddenly, one of the line starts clearing customers faster. This leads everyone to shift to the faster line and the slower one gets abandoned.
That’s essentially what happened here: Dominant pool Foundry’s “line” moved ahead quickly with several blocks in a row, so the network followed it, leaving the other valid blocks by AntPool and ViaBTC behind.
Bitcoin miners compete to add new blocks of transactions to the blockchain, and sometimes two miners find a valid block at nearly the same time. When that happens, the network briefly splits, but it ultimately chooses one chain to continue – usually the one that grows faster.
A mining pool, such as Foundry, is a group of miners who combine their computing power to mine blocks and split the rewards,. Finding a block solo is like winning a lottery that individual miners can rarely win on their own.
Bitcoin’s consensus rule is absolute: the chain with the most cumulative proof of work wins. AntPool and ViaBTC’s two blocks became stale, permanently erased from the ledger, and those miners earned nothing for producing them.
The event was a 2-block chain reorganization, rare but not unprecedented, and the clearest on-chain signal yet that hashrate is concentrating into fewer hands as the industry contracts.
At block height 941,881, AntPool and Foundry found valid blocks within 12 seconds of each other, at 15:49:35 and 15:49:47 UTC respectively. Both were legitimate and the network briefly split, with some nodes following one chain and others following the other.
The race continued to block 941,882, where ViaBTC extended AntPool’s chain and Foundry extended its own.
That created two competing chains, each two blocks deep, running in parallel. Later on, blocks 941,883 through 941,886 all went to Foundry, making their chain the heaviest by a wide margin.
Transactions in the orphaned blocks weren’t lost, however. They return to the mempool and get included in future blocks. An orphaned block is a valid block that loses the race when two miners find blocks at nearly the same time, getting discarded permanently from the chain despite being perfectly legitimate.
Mining difficulty just dropped 7.76% on Saturday, the second-largest negative adjustment of 2026. Hashrate has retreated to roughly 920 EH/s from the 1 zetahash record hit in 2025.
Smaller and mid-sized miners are exiting because bitcoin at $70,000 sits well below the estimated $88,000 average production cost. Every operator that shuts down concentrates the remaining hashrate into fewer pools.
A 2-block reorg doesn’t threaten Bitcoin’s security. The network handled it exactly as designed, with the longer chain winning and consensus re-establishing within minutes.
But when fewer pools control more hashrate, the probability of a single pool finding multiple consecutive blocks increases, and with it the probability of competing chains when two large pools find blocks near-simultaneously.

Two leading prediction-market platforms have rolled out tighter guardrails on Monday to curb insider trading and suspected market manipulation in event-based contracts, as lawmakers in Washington step up scrutiny of a sector that blends finance, law and politics.
Kalshi and Polymarket argued that their updates are designed to prevent the exploitation of confidential information and to reduce the risk that markets skew the outcomes of real-world events. The moves come amid a broader policy push in the United States to regulate or restrict prediction markets that resemble gambling or sports betting.
Key takeaways
- Kalshi and Polymarket introduced new guardrails to combat insider trading and manipulation in event contracts.
- Kalshi will preemptively bar political candidates from trading on their campaigns and exclude individuals connected to college and professional sports from relevant markets.
- Polymarket expanded prohibitions to forbid trades based on stolen confidential information or those who can influence market outcomes.
- A bipartisan bill, the Prediction Markets Are Gambling Act, would bar CFTC-registered platforms from listing event contracts that resemble sports bets or casino-style games.
- The policy debate highlights tensions over jurisdiction, licensing and the boundaries between financial markets and entertainment-oriented betting.
Guardrails tighten as Congresseye rules intensify
Kalshi said it would preemptively ban political candidates from trading on their own campaigns, along with individuals known to be involved in college and professional sports—such as athletes, staff, and referees. The exchange described the move as part of a long-running effort to align with evolving regulatory guidance and proposed legislation addressing insider trading and market manipulation in prediction markets.
In a separate but related move, Polymarket unveiled broader prohibitions intended to close loopholes that could enable insiders to benefit from confidential information or influence the outcome of a contract. The company said its updated rules aim to make the market more resistant to manipulation and to protect the integrity of events traded on its platform.
The changes come on the heels of intense public debate about whether some well-timed bets on political or geopolitical events reflect legitimate market activity or exploit privileged information. In recent coverage, observers noted bets placed around high-profile events such as U.S. and Israeli actions in Iran and a U.S.-led operation related to Venezuela’s Nicolás Maduro, with some traders appearing to use multiple accounts to mask activity. The Guardian reported that the Iran-strike bets were made by users who could be perceived as having inside information, underscoring the ongoing concerns about insider knowledge shaping market outcomes.
Kalshi described its policy evolution as a proactive response to the regulatory environment and to proposed congressional action. The company, which is a member of the Coalition for Prediction Markets, argued that these guardrails are part of preparing for potential legal guidance and legislative developments that address insider trading and market manipulation in prediction markets.
Policy spotlight: bipartisan efforts and legal tensions
On Monday, Democratic Senator Adam Schiff and Republican Senator John Curtis introduced a bipartisan bill, the Prediction Markets Are Gambling Act, that would bar Commodity Futures Trading Commission-registered entities from listing event contracts that resemble sports betting or casino-style games. In their view, sports prediction contracts are effectively sports bets—an assertion Schiff has repeated to emphasize the public-law implications of these instruments when they resemble gambling more than information-driven markets.
The proposed legislation would withdraw a key allowance for platforms like Kalshi and Polymarket by limiting what contracts they may offer in the United States. Schiff’s office framed the issue as one of regulatory clarity and consumer protection, while Curtis stressed maintaining state authority over broader gaming and betting activities.
Kalshi’s chief executive, Tarek Mansour, reacted to the bill by framing the move within a broader “casino lobby” effort. He argued that the legislation is not about protecting consumers but about preserving entrenched monopolies, a line he shared publicly on social media. His comments underscore how industry actors view the political dynamic surrounding prediction markets and their place in the U.S. financial-regulatory landscape.
Legal tension has already surrounded prediction-market operators in several states, which have asserted that sports-event contracts constitute gambling that requires a state license. Platforms such as Kalshi, Polymarket andCoinbase have contended that their offerings are not illegal betting and, regardless, fall under the exclusive jurisdiction of the Commodity Futures Trading Commission rather than state authorities.
The policy debate is not theoretical for traders and developers who rely on prediction markets for hedging and information discovery. As reported by Cointelegraph, the U.S. Senate has been weighing bills aimed at curtailing or redefining the reach of these markets, alongside state-level actions that challenge the legality of specific contracts. The ongoing legal and regulatory discourse creates an environment of uncertainty, even as platforms push for clearer rules that would allow compliant operation in the United States.
For context, Cointelegraph’s reporting has highlighted instances where traders leveraged event-driven markets to capitalize on geopolitical developments, reinforcing concerns about information asymmetry and the potential for manipulation. The new guardrails by Kalshi and Polymarket are thus part of a broader effort to reconcile the commercial appeal of prediction markets with legitimate safeguards against abuse.
What to watch next in the evolving landscape
As lawmakers advance their proposals and courts consider disputes over jurisdiction and licensing, the trajectory of prediction markets in the United States remains uncertain. If the proposed act passes, CFTC-approved platforms could face tighter restrictions or even a narrowed set of permissible contracts, potentially dampening growth but improving trust and regulatory compliance.
For users, traders and builders, the key questions are how the guardrails translate into practical trading limits, whether state or federal rules will ultimately prevail, and how enforcement will unfold in a landscape that often intersects with political sentiment and sports governance.
The next chapter will likely hinge on legislative momentum in Congress and any legal clarifications from federal or state authorities. Watch for updates on whether the bipartisan bill gains traction, how the industry responds with further rule adjustments, and whether there are new developments in the ongoing legal actions against these platforms. The balance between innovation and integrity in prediction markets remains delicate, and investors should monitor both regulatory signals and platform-level safeguards as the market evolves.
Sources: Kalshi newsroom announcements on guardrails; Polymarket rule updates; U.S. Senate press releases announcing the proposed act; coverage of insider-trading concerns around event contracts; The Guardian reporting on Iran-strike bets; ongoing state-level legal actions against prediction-market operators.
Balancer Labs, the team behind the decentralized finance protocol Balancer, is shutting down after mounting financial pressure and a $116 million hack in November, with executives proposing continuation of the protocol under a leaner, more cost-effective structure.
“After careful consideration, I have decided to wind down Balancer Labs. This is not a decision I take lightly,” one of Balancer Protocol’s founders, Fernando Martinelli, said on Monday, adding that Balancer Labs has become a “liability rather than an asset to the protocol,” as it has been operating without revenue.
Balancer Labs CEO Marcus Hardt added that it was spending too much to attract liquidity relative to the revenue the protocol is making, a strategy that came at the cost of diluting Balancer (BAL) token holders.

Balancer was one of the more notable DeFi protocols during the 2020–2021 bull market, reaching a peak of $3.3 billion in total value locked (TVL) in November 2021.
However, that figure fell to $800 million by October 2025, with the hack leading to another $500 million TVL drop over the next two weeks. Balancer’s TVL has since fallen to $158 million, showing how challenging it is for DeFi protocols to recover from large-scale hacks.
Martinelli said the November exploit “created real and ongoing legal exposure” and that maintaining a corporate entity that carries the liability of past security incidents wasn’t sustainable.
Balancer Labs executives outline restructuring plan
Moving forward, Hardt and Martinelli are pushing for Balancer’s future to be managed by the Balancer Foundation and the protocol’s decentralized autonomous organization.
Martinelli advocated for Balancer to adopt a more “lean continuation path,” which involves cutting BAL emissions to zero, restructuring fees to enable Balancer’s DAO to capture more revenue, reducing the team as much as possible and targeting lower operating costs.
“Balancer still has real value to build from here. If we can make this transition work, we have a real chance to build a stronger and more sustainable protocol on the other side of it,” Hardt said.
Balancer DAO members have been asked to vote on two proposals reflecting possible changes in Balancer’s operational restructuring and BAL’s tokenomics.
Related: OP_NET launches Bitcoin DeFi push without bridges or wrapped BTC
Despite the tokenomics issues, Martinelli noted that Balancer is “still generating real revenue” at over $1 million across the past three months:
“That’s not nothing — that’s a functioning protocol buried under a broken tokenomics model and an overweight cost structure,” he said.
“The problem isn’t that Balancer doesn’t work. The problem is that the economics around Balancer aren’t working. Those are fixable.”
Magazine: Are DeFi devs liable for the illegal activity of others on their platforms?

Bedlington care home worker celebrates 15 years of dedicated work
Prolonged conflict could send crude prices soaring to $125: Peter McGuire

SEC Top Enforcer Clashed Over Trump Cases Before Resigning


-
 Crypto World3 days ago
NIO (NIO) Stock Plunges 6.5% as Shelf Registration Sparks Dilution Worries
-

 Fashion4 days ago
Weekend Open Thread: Adidas – Corporette.com
-

 Politics3 days ago
Jenni Murray, Long-Serving Woman’s Hour Presenter, Dies Aged 75
-
 Tech7 days ago
Are Split Spacebars the Next Big Gaming Keyboard Trend?
-

 Crypto World2 days ago
Best Crypto to Buy Now: Strategy Just Spent $1.57 Billion on Bitcoin During Fear While Early Investors Quietly Enter Pepeto for 150x Potential
-

 News Videos6 days ago
RBA board divided on rate cut, unusually buoyant share market | Finance Report | ABC NEWS
-

 Crypto World2 days ago
Bitcoin Price News: Bhutan Sells $72 Million in BTC Under Fiscal Pressure, but the Smart Money Entering Pepeto Sees What the Market Does Not
-

 Politics6 days ago
The House | The new register to protect children from their abusers shows Parliament at its best
-

 Tech4 days ago
inKONBINI Lets You Spend Summer Days Behind the Register
-
 Politics7 days ago
Real-time pollution monitoring calls after boy nearly dies
-

 Crypto World6 days ago
Canada’s FINTRAC revokes registrations of 23 crypto MSBs in AML crackdown
-

 Sports19 hours ago
Remo Stars and Kano Pillars Strengthen Survival Hopes in NPFL
-
 NewsBeat5 days ago
Residents in North Lanarkshire reminded to register to vote in Scottish Parliament Election
-

 News Videos6 days ago
PARLIAMENT OF MALAWI – PAC MEETING WITH REGISTRAR OF FINANCIAL ON AMARYLLIS HOTEL – INQUIRY LIVE
-

 Politics4 days ago
Gender equality discussions at UN face pushbacks and US resistance
-

 Business2 days ago
No Winner in March 21 Drawing as Prize Rolls to $133 Million for Next
-

 Business5 days ago
Who Was Alex Pretti? 5 Key Facts About the ICU Nurse Killed by Federal Agents in Minneapolis
-

 Sports18 hours ago
Gary Kirsten Accuses Pakistan Cricket Board Of ‘Interference’, Mohsin Naqvi Responds
-

 Tech1 day ago
Give Your Phone a Huge (and Free) Upgrade by Switching to Another Keyboard
-

 Sports4 days ago
2026 Kentucky Derby horses, odds, futures, preview, date: Expert who nailed 12 Derby-Oaks Doubles enters picks
You must be logged in to post a comment Login