

Crypto World
UniCredit warns of EU crypto bank crisis



UniCredit director Elena Carletti has warned Europe may struggle to contain a crypto bank crisis under MiCA rules.
Summary
- UniCredit’s Elena Carletti warned Europe lacks tools to backstop crypto-linked deposits the way US regulators did after SVB.
- MiCA pushes stablecoin issuers closer to banks but EU deposit insurance is capped at €100,000.
- Carletti cited Circle’s $3.3 billion stuck at SVB in 2023 as the model risk Europe has not solved.
UniCredit deputy vice chair Elena Carletti has warned that Europe may struggle to contain a crypto-linked banking shock under MiCA. The Italian bank executive said EU tools are weaker than the US emergency response of 2023.
The comments land as MiCA pulls stablecoin issuers closer to traditional lenders. Carletti, who chairs UniCredit’s board risk committee, said at an IESE Business School conference in Madrid that the same systemic-risk exception used to guarantee all SVB and Signature deposits “cannot be easily taken in Europe.”
Why MiCA creates a “double weakness”
MiCA requires stablecoin issuers, classified as electronic money tokens, to hold reserves in liquid assets including bank deposits and government securities. That ties stablecoin stability directly to bank balance sheets.
The link became visible during the March 2023 SVB collapse. Circle, issuer of USDC, disclosed $3.3 billion of reserves stuck at the failed bank, and the stablecoin briefly lost its dollar peg before US regulators guaranteed all deposits.
“The coverage and protection … was given to all deposits, including stablecoin companies, and that also allowed to maintain the stability of the stablecoin,” Carletti said. EU deposit insurance, capped at €100,000, cannot absorb stress from large stablecoin reserve accounts the same way.
What it means for Europe’s stablecoin push
Carletti’s warning comes as European banks lean further into stablecoins. UniCredit itself is a founding member of Qivalis, the consortium planning a MiCA-compliant euro stablecoin for launch in the second half of 2026.
Italy’s Banca Sella, another Qivalis founder, recently won Bank of Italy approval to offer crypto custody and transfer services under MiCA’s notification route for credit institutions. The full MiCA rollout tightens supervision of CASPs, stablecoin issuers and DeFi front-ends by July 2026.
Tether CEO Paolo Ardoino has previously argued MiCA’s 60% uninsured cash reserve requirement could itself trigger systemic risk, echoing Carletti’s concern from the issuer side.

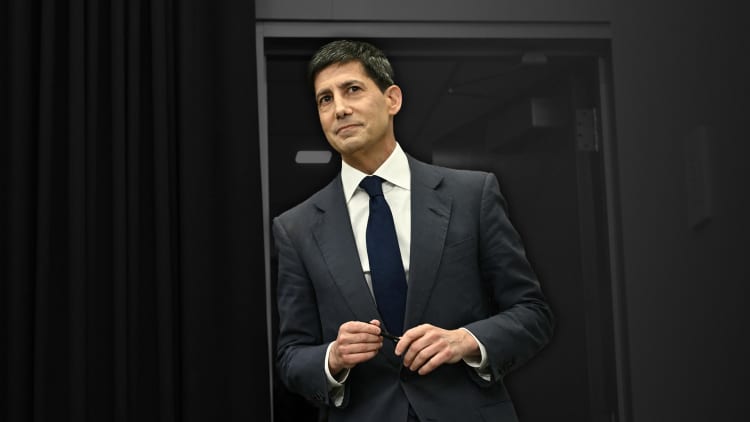
Federal Reserve Chair Kevin Warsh speaks to reporters during his first news conference since taking the helm at the central bank on June 17, 2026 in Washington, DC.
Chip Somodevilla | Getty Images
Federal Reserve Chairman Kevin Warsh’s first big announced changes point toward a quiet revolution, with task forces set up to rethink virtually everything done to set policy and the approach used to get there.
Following his first meeting at the helm Wednesday, Warsh outlined the plan — a sprawling, ambitious endeavor entailing five task forces that will utilize resources and experts within the Fed and from the outside.
The reviews amount to a comprehensive examination of all the areas that define modern monetary policy. No chair in recent history has launched a project that has matched the ambition of this one.
Their job will be to examine communications, data the Fed uses to measure the economy, the view on inflation and its causes, the impact of technology such as artificial intelligence and the size and composition of the Fed’s $6.7 trillion balance sheet and the potential path to cutting the holdings.
The task forces will “start with first principles, ask hard questions, examine current practice, consider alternatives, and ultimately propose next steps for policymaker consideration,” Warsh said.
“Each task force will serve an objective shared by everyone in the system, shared by everyone around that table that I sat with over the last couple of days: a Federal Reserve that is clear-eyed about its mission, fit for purpose, and focused on the future,” he added.

In announcing the task forces, Warsh was emphatic and deliberate.
But gone was the harsh rhetoric he has used to denounce the central bank over the past year.
Last July, Warsh, in a CNBC interview while he was campaigning for the job, called for “regime change” at the Fed and cited a “credibility deficit” caused by “incumbents” at the institution. In its place were comments about how “incredibly impressed” he was with what he’d seen in his first weeks on the job and how the meeting “exemplified the very best of the Fed’s traditions.”
What once looked like a potentially rancorous atmosphere inside the institution quickly become collegial as Warsh looks to carry through a fundamental rethink of how it does business.
“What I think we’re seeing is regime change, but in a velvet glove,” said Scott Clemons, chief investment strategist at Brown Brothers Harriman. The task forces “basically are going to review and maybe revise all the working aspects of Fed practice, from communications to data sources to the way they approach the balance sheet to the inflation framework. There’s a lot of potential regime change there.”
Warsh’s decision to take the positive view came as little surprise to Fed veterans, several of whom spoke in favor of the direction the new chairman charted.
“All those who’ve been in the Fed know that the way change operates is through just what he did, which is create task forces to build consensus,” former central bank Vice Chair Roger Ferguson told CNBC. “There are some things that one can get rid of that I think would be helpful and there are others where maybe he must be careful.”
Getting started
Former Cleveland Fed President Loretta Mester served on a communications subcommittee during her tenure that ran from 2014 to 2024, part of a nearly 40-year career at the central bank. She’s familiar with prior efforts the Fed made to enact change that perhaps weren’t quite as codified as the approach Warsh is taking.
“All the things he’s looking at are things that the Fed has looked at. But he’s organizing the work, and I think he’s putting it on a faster than typical timeframe for some of these projects that the Fed has undertaken before,” Mester said. “So, I think this is all good to be studying. Of course, we’ll have to see what then the recommendations are, and what changes he wants to make.”
One of the most visible areas Warsh has changed is communication.
The post-meeting statement eschewed much of the boilerplate language of its predecessors and instead offered a bare-bones view of what the committee decided and how it views current economic conditions. In format, the statement began with the actual rate action — unchanged, as expected — a callback to how the Fed used to formulate its statements prior to March 2009. Since the financial crisis-era period, the Fed had been starting the statements with an assessment on the economic state of affairs.
Mester said she has no problem with the Federal Open Market Committee returning to the prior format. However, the statement this week also deleted so-called forward guidance language, something she said officials may want to address with more information about the Fed’s “reaction function,” or the outline of how and why the Fed will adjust its position to economic factors.
“I like the fact that they got rid of a lot of what we would call boilerplate language that really wasn’t serving any purpose anymore,” she said. Mester added that the Fed has long had a “Hotel California problem.”
“Once a phrase or sentence got in there, it was very difficult to get it out. So this was a needed sort of purging,” she said.
Other areas likely to be explored will be the elimination of the “dot plot” rate forecasts from individual FOMC participants as well as a potential adjustment to the news conferences chairs have held for the past 15 years.
Other areas of reform
The task forces will take aim at a broad swath of Fed operations.
On the balance sheet, Warsh has long objected to the Fed’s large position in bond markets, which swelled during and after the financial crisis of 2008, as well as in the Covid pandemic in 2020.
There also will be a study of how the Fed gauges inflation after being above its goal for five years following the erroneous “transitory” call in 2021 and 2022. Artificial intelligence and its impacts also will be in focus, as will a comprehensive view of the metrics that the Fed is using to gauge the economy, with an expected look at further using data and analytics for guidance.
BlackRock fixed income chief Rick Rieder, himself a finalist for the nomination that Warsh won, called the chairman’s approach “a new era of monetary policy in the United States.”
“Building a sense of confidence in achieving monetary policy targets will only be enhanced by an impressive consideration of complex subject matter that could be very influential on the economy and Fed targets going forward,” Rieder said in a post-meeting note. “So, this time is different, we are hearing about a different philosophy, different tools, and potentially a very different policy ethos.”
One important way to make it all work is to provide clear lines about what will be moving monetary policy in the future, added Mester, the former Cleveland Fed president.
“It doesn’t have to be numerical, doesn’t have to be very prescriptive, but to get a sense of kind of what are they looking at, what kinds of things are going to persuade them one way or the other,” she said. “I think that’s something that we want our central bankers to be able to articulate to us. Otherwise it’s sort of ‘trust me,’ and ‘trust me’ is not good communication.”

Key Takeaways
- The electric vehicle maker reported its slowest quarterly delivery figures in a year during Q1 2026, falling short of analyst forecasts
- The energy storage segment is experiencing rapid expansion — projections show revenue climbing to $18.3 billion in 2026 from $12.8 billion in 2025
- Bearish analysts see TSLA reaching $74 by 2031; neutral outlook targets $374; optimistic scenario exceeds $1,100
- Analyst sentiment remains divided: 21 Buy recommendations, 19 Hold recommendations, 5 Sell recommendations — overall consensus leans toward Hold
- Weighted average projections point to $487 by 2031, translating to roughly 4% annual returns
Tesla (TSLA) remains among the most polarizing equities in today’s market, with valuation scenarios for this mega-cap company spanning an unusually broad spectrum.
The company’s shares command a valuation premium that its automotive operations cannot independently support. Profit margins on vehicles face persistent headwinds from aggressive pricing strategies, reduced government incentives, and intensifying rivalry across Chinese, European, and American markets.
Recent reporting from Reuters highlighted that Tesla began 2026 with its most disappointing quarterly delivery performance in more than twelve months, undershooting Wall Street projections. Diminishing domestic subsidies and fiercer international competition emerged as primary culprits.
This delivery shortfall carries significant implications. Automotive sales continue to represent the core of Tesla’s revenue stream, and weakening consumer demand increases pressure on alternative growth initiatives to compensate for the gap.
One such initiative is already showing promise. Tesla’s energy storage operations are expanding rapidly, with industry analysts forecasting approximately $18.3 billion in divisional revenue for 2026 — representing substantial growth from the $12.8 billion recorded in 2025. This momentum could eventually help counterbalance declining automotive profitability.
However, the most ambitious projections in long-range financial models depend on ventures that haven’t achieved commercial scale: advanced autonomous driving capabilities, fleet-based taxi services, Optimus humanoid robotics, artificial intelligence infrastructure, and subscription-based software revenue streams.
Three Distinct Projections Through 2031
Under pessimistic assumptions, automotive profitability remains compressed, electric vehicle adoption decelerates, and autonomous technology deployment extends beyond current timelines. Revenue projections approach $130 billion by 2031, though earnings face continued constraints. This scenario supports a potential stock price near $74.
A moderate outlook envisions Tesla maintaining growth momentum across vehicles, energy systems, software platforms, and service operations — though robotaxi deployment and robotics commercialization advance incrementally rather than explosively. Revenue could approach $220 billion with earnings per share around $6.80. Applying a 55x earnings multiple yields a 2031 price target near $374.
The optimistic scenario paints a dramatically different picture. Should autonomous driving, robotaxi networks, energy storage, artificial intelligence, and Optimus robotics all achieve meaningful commercial scale, revenue could surge to $350 billion with EPS climbing to $15. A 75x valuation multiple would justify share prices exceeding $1,100.
Blending these scenarios with probability weightings produces a composite target of $487 — moderately above current trading levels, though the implied annual return calculates to approximately 4%. That represents modest compensation relative to the substantial uncertainty involved.
Current Analyst Sentiment
The investment research community exhibits the same division reflected in these varied projections.
MarketBeat data shows Tesla currently carries 21 Buy ratings, 19 Hold ratings, and 5 Sell ratings. The prevailing consensus stands at Hold.
Optimistic analysts characterize Tesla as an artificial intelligence and autonomy platform company. Skeptical analysts view it as an overvalued automobile manufacturer confronting structural challenges with excessive future success already reflected in its current valuation.
Tesla’s first quarter of 2026 marked its weakest delivery performance in over twelve months.


Key Takeaways
- Recent quarterly revenue for Nvidia reached $81 billion, driven by data center sales exceeding $75 billion
- Management projects approximately $91 billion in revenue for the upcoming quarter, surpassing analyst expectations
- Analyst consensus features 51 Buy recommendations and zero Sell ratings, with a mean price target of $305.67
- The chipmaker secured $25 billion through its latest bond issuance, attracting $85 billion in investor interest
- Baseline forecasts suggest NVDA could trade around $630 by 2031, while optimistic projections exceed $1,100
The latest earnings report from Nvidia revealed quarterly revenue of $81 billion, with data center operations contributing over $75 billion. Management subsequently projected approximately $91 billion for the coming quarter, once again exceeding Wall Street expectations.
This track record of delivering results continues to position NVDA among the most favored stocks across Wall Street research desks.
Current analyst sentiment reflects 51 Buy ratings, 3 Hold ratings, and notably zero Sell ratings on MarketBeat. The consensus price target stands at $305.67.
For investors with longer time horizons, the critical question shifts from near-term quarterly performance to where shares might trade by the end of this decade.
2031 Price Projections: Three Distinct Paths
Financial analysts have constructed three distinct scenarios for NVDA, each reflecting different trajectories for artificial intelligence investment over the coming years.
The conservative scenario envisions a slowdown in AI infrastructure capital expenditures following the current expansion cycle. Increased competitive pressure compresses margins, growth decelerates, and revenue approaches $180 billion by 2031. This path suggests shares trading around $200.
The middle-ground projection assumes sustained AI integration across multiple sectors with Nvidia maintaining market leadership. Revenue climbs to roughly $350 billion, earnings per share reach approximately $18, and applying a 35x valuation multiple yields a price near $630.
The optimistic scenario positions AI as a transformative technology spending wave comparable to major historical cycles. Nvidia successfully penetrates additional markets, revenue surpasses $550 billion, and shares climb beyond $1,100. When weighted by probability across all three outcomes, the blended projection settles around $636.
Mounting Competitive Pressures
Despite its commanding market position, Nvidia faces legitimate competitive headwinds. Leading cloud providers — Microsoft, Google, Amazon, and Meta — are each developing proprietary AI accelerators. Meanwhile, AMD and Broadcom continue advancing their AI semiconductor offerings.
These initiatives represent potential threats to Nvidia’s market dominance over the medium to long term.
Yet Nvidia’s competitive advantage extends beyond chip architecture. The company’s comprehensive software infrastructure — encompassing CUDA, networking technologies, and developer platforms — creates substantial switching costs for customers. This ecosystem lock-in represents a critical element of the investment thesis.
CEO Jensen Huang regularly characterizes AI as foundational global infrastructure, highlighting robotics, self-driving vehicles, medical applications, and national AI initiatives as emerging demand catalysts.
From a capital markets perspective, Nvidia’s recent $25 billion bond issuance marked its first such offering in half a decade. The deal attracted approximately $85 billion in orders — representing 3.4x oversubscription — demonstrating robust institutional confidence.
The forthcoming quarter’s $91 billion revenue guidance serves as the most critical near-term benchmark for investors to monitor.

Key Takeaways
- OpenAI has submitted a confidential filing for its U.S. public offering, seeking a potential valuation reaching $1 trillion
- The company posted $5.7 billion in first-quarter 2026 revenue while spending $3.7 billion during that timeframe
- Anthropic submitted its IPO paperwork on June 1 following a $65 billion funding round at a $965 billion valuation
- Anthropic reported annualized revenues exceeding $30 billion, outpacing OpenAI’s previously announced $24 billion annual run rate
- Market experts indicate Anthropic could present a more attractive entry valuation given its enterprise focus and revenue pricing
The artificial intelligence sector is preparing for two landmark public offerings as both OpenAI and Anthropic have submitted confidential IPO filings with U.S. regulators. These parallel listings represent potentially the most significant tech market debut in years, though each company presents distinct investment propositions.
OpenAI carries stronger brand recognition globally. As the creator of ChatGPT, it has established unparalleled consumer awareness in the AI space. According to Reuters, the company is pursuing a valuation that could reach $1 trillion, with a possible market debut scheduled for September 2026.
Revenue figures demonstrate substantial commercial traction. OpenAI recorded $5.7 billion in revenue during the first quarter of 2026. However, operating expenses hit $3.7 billion in the identical period, revealing significant cash burn as the company scales.
This profitability gap represents a critical consideration for potential shareholders. While the brand commands impressive market position, the financial structure remains capital-intensive.
Why OpenAI’s Consumer Dominance Matters
ChatGPT stands as the most widely adopted artificial intelligence application globally. This market penetration provides OpenAI with consumer recognition that Anthropic cannot currently match.
OpenAI is expanding well beyond its flagship chatbot. The company is advancing into enterprise solutions, developer infrastructure, and platform-as-a-service offerings. This positions it as a diversified play on AI penetration across multiple industries.
The valuation presents the primary challenge. A $1 trillion market capitalization means investors would pay a substantial premium for anticipated expansion. This bet pays off if OpenAI maintains market leadership. The equation becomes problematic if rivals narrow the competitive gap.
Why Anthropic Emphasizes Enterprise Clients
Anthropic has pursued a more concentrated strategy. Its Claude language models have captured significant market share in corporate software, developer environments, and business process automation.
According to Reuters, Anthropic’s annualized revenue exceeded $30 billion, surpassing OpenAI’s previously reported $24 billion annual figure. While both companies measure revenue through different methodologies, the directional trend appears clear.
Anthropic completed a $65 billion funding round at approximately $965 billion pre-IPO valuation. This positions the company nearly on par with OpenAI in private market assessment.
Breakingviews analysis suggests Anthropic’s valuation translates to roughly 30x revenue. Depending on how OpenAI’s revenue run-rate is interpreted, this could position Anthropic as the less aggressively priced option at public debut.
Enterprise software companies typically command more predictable valuations than consumer-driven growth narratives. This dynamic favors Anthropic if its revenue composition remains stable.
Investors prioritizing entry valuation may view Anthropic as the more transparent opportunity. Its enterprise traction is demonstrable and its pricing may offer marginally better value relative to OpenAI’s anticipated debut price.
OpenAI represents the broader platform narrative with superior consumer penetration. Anthropic appears as the more conservative choice for investors emphasizing valuation discipline.
Both public offerings are anticipated to generate substantial investor demand upon market entry.

Key Takeaways
- In 2025, SpaceX recorded $18.7 billion in total revenue, with its Starlink division contributing $11.4 billion
- The Starlink segment delivered $4.4 billion in operating profit during 2025, demonstrating strong margin potential
- Wall Street analysts project an average 12-month SPCX price of $221.20, ranging from $115 on the low end to $401 at the high end
- When weighted by probability, the 2031 target reaches approximately $604, though significant execution challenges remain
- Scenario-based 2031 forecasts span from $64 in bearish conditions to beyond $1,400 in optimistic projections
Valuing SpaceX stock presents unique challenges. The company operates far beyond traditional aerospace boundaries, managing satellite internet services, commercial and government launch operations, defense initiatives, and emerging artificial intelligence ventures.
Space Exploration Technologies Corp., SPCX
This multifaceted business model explains the substantial variance in analyst opinions.
Current analyst consensus from MarketBeat places the average 12-month target at $221.20 per share. The most optimistic projection reaches $401, while the conservative estimate stands at $115. This considerable spread illustrates fundamental disagreement about the company’s core identity and trajectory.
Last year, SpaceX generated approximately $18.7 billion in revenue, representing growth from the prior year’s $14 billion. The Starlink satellite internet service accounted for $11.4 billion of total revenues and produced approximately $4.4 billion in operating profit, validating the division’s ability to achieve healthy profit margins.
Neverthstanding these revenue achievements, SpaceX reported a substantial GAAP net loss for 2025. Aggressive capital deployment toward Starship development, AI infrastructure buildout, and launch capability expansion continued to suppress bottom-line profitability.
Primary Growth Catalysts
Three key factors underpin the optimistic long-term investment thesis.
The first driver is Starlink expansion. Continued global subscriber growth positions the service as potentially one of the planet’s dominant connectivity networks.
The second factor involves launch market leadership. SpaceX maintains a commanding position in reusable rocket technology, providing cost efficiencies that traditional aerospace competitors have found difficult to replicate.
The third element centers on AI and data platform development. Market participants increasingly view SpaceX through a technology company lens rather than purely as an aerospace entity. This perception shift has meaningful valuation implications.
Elon Musk has indicated SpaceX might achieve $1 trillion in annual revenue by 2030. Goldman Sachs analysts have reportedly modeled approximately $470 billion for that timeframe, while Morgan Stanley’s projections cluster around $330 billion. Each scenario demands exceptional operational execution.
Five-Year Price Projections
The pessimistic scenario positions SPCX near $64 by 2031. This outcome assumes Starlink and launch services continue expanding, but premium valuation multiples prove unsustainable. AI expenditures remain elevated while margin improvement stalls.
The moderate projection estimates approximately $458 per share. Under this framework, Starlink achieves scale, launch dominance persists, Starshield expands steadily, and AI contributes meaningfully without becoming transformational. Total revenue in this case could approach $250 billion.
The optimistic forecast extends beyond $1,400 per share. This scenario requires SpaceX to successfully construct an integrated global platform spanning satellite communications, launch services, defense systems, and AI infrastructure, generating revenues near $500 billion with substantially improved profit margins.
When applying probability weights across these three scenarios, the composite 2031 target reaches approximately $604.
This figure suggests considerable appreciation potential from current trading levels — though the uncertainty between possible outcomes remains exceptionally wide.
According to MarketBeat’s current analyst tracking, SPCX carries a consensus price target of $221.20, with the most bullish Wall Street analysts setting their sights on $401 per share.
Bitcoin recovered above $64,000 over the weekend after Friday’s drop below $62,400, but the wider crypto market still showed limited momentum.
Summary
- Bitcoin reclaimed $64K after Friday’s pullback, but the wider market still showed limited weekend momentum.
- LAB and AERO led altcoin gains, while Ethereum, XRP and HYPE showed weaker momentum Sunday.
- ETF outflows and Hormuz risk kept Bitcoin traders focused on $62K support and $67K resistance.
According to crypto.news market data, Bitcoin traded near $64,166 at press time, up 0.77% over 24 hours.
The move came as traders watched U.S.-Iran ceasefire talks, renewed Strait of Hormuz risk and continued Bitcoin ETF outflows. Total crypto market value hovered near $2.29 trillion, while Bitcoin dominance stayed above 56%.
Bitcoin reclaims $64K after Friday’s pullback
Bitcoin started June under pressure after falling from $73,000 to near $59,100 within five days. Buyers later defended lower levels and helped the asset recover to $64,000 before another rally attempt pushed BTC to $67,200 earlier in the week.
That move faded after the FOMC meeting, and Bitcoin fell below $62,400 by Friday. The weekend rebound lifted the asset to about $64,400 before sellers slowed the move. Bulls now need a clean move above $67,000, while a failure to hold $62,000 would bring $60,000 back into focus.
Large-cap altcoins remain mixed
Most major altcoins moved slowly over the past 24 hours. Ethereum traded near $1,730, while BNB held close to $589. Solana was stronger, rising above $73 as buyers returned.
XRP stayed near $1.15, while Cardano slipped around 1%. Hyperliquid also moved lower after a strong weekly run. Chainlink was almost flat, showing that the weekend bid did not spread evenly across major tokens.
The mixed action shows that traders remain selective. A few tokens found buyers, but the market did not show broad risk-taking across large-cap assets. Bitcoin remains the main guide for market direction.
If BTC holds $64,000 and challenges $67,000 again, large-cap altcoins could see more relief. A rejection would keep the market focused on support levels and short-term liquidity.
LAB and AERO stand out
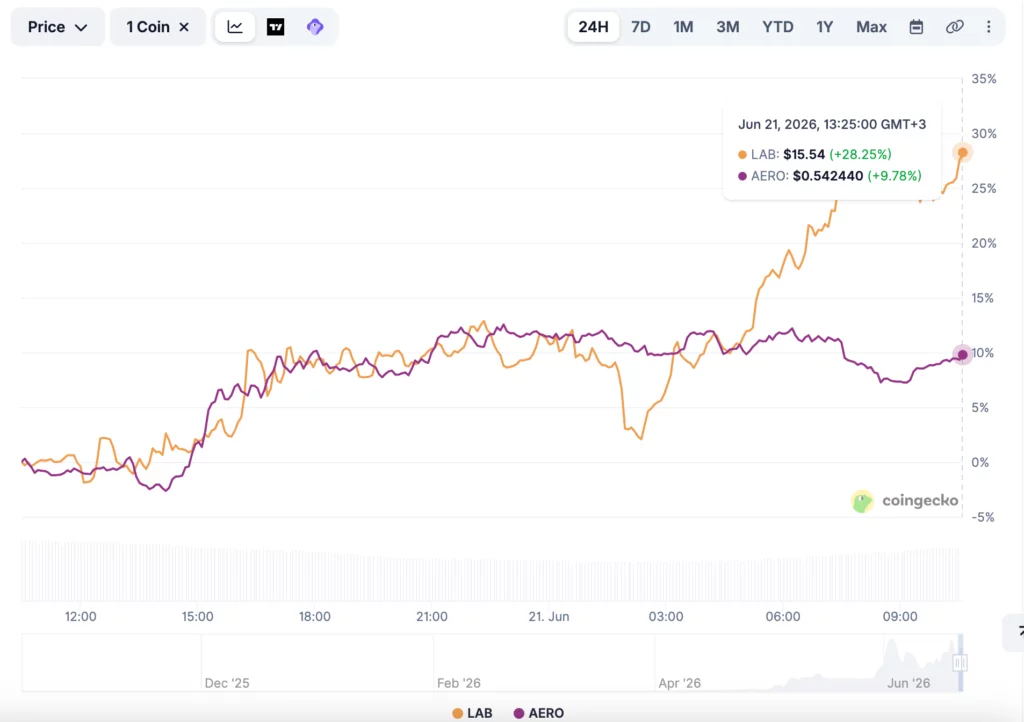
LAB was the strongest name in the weekend market watch, rising more than 28% on the day. The token traded above $15 after a monthly gain of about 230%, bringing it close to the top 20 altcoins by market value.
AERO also extended its strong week. The token gained about 10% over 24 hours and roughly 50% on the week, helping it enter the top 100 altcoins.
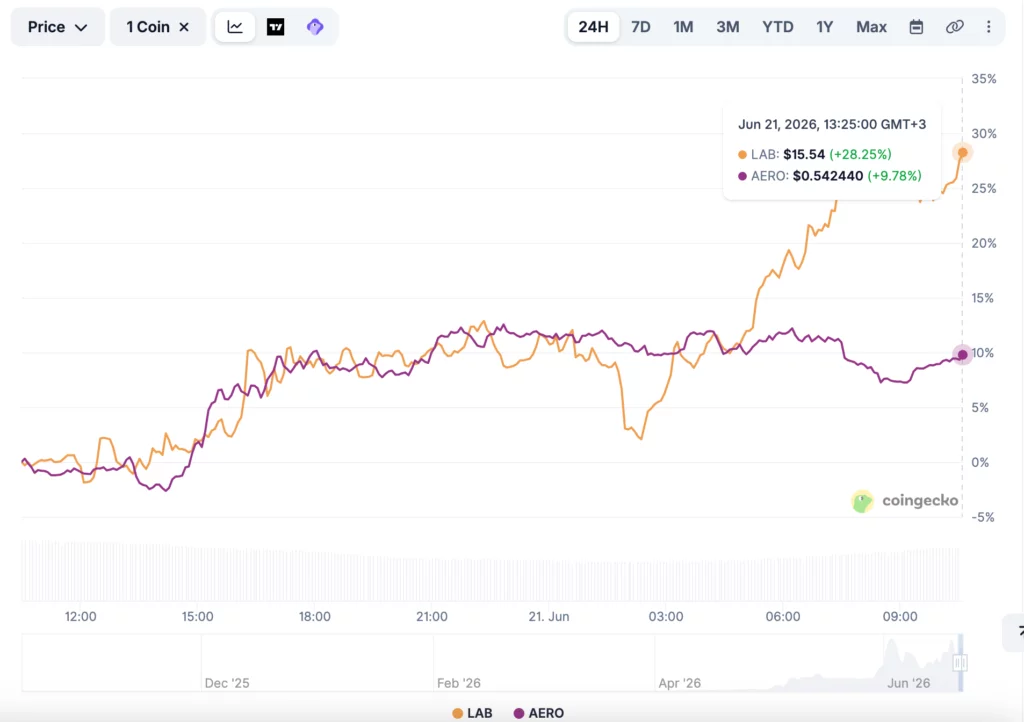
These moves stood out because most of the market stayed flat. The gains looked more like isolated strength than a full altcoin rally. Narrow rallies can reverse quickly if Bitcoin loses support or if liquidity leaves smaller tokens.
For now, LAB and AERO remain the weekend’s clearest winners. Their gains gave traders pockets of activity while the larger crypto market waited for a clearer signal.
Traders watch ETF flows and macro risk
Earlier today, crypto.news reported that Bitcoin was watching ETF outflows and Hormuz risk as two key pressure points. Galaxy Research also said U.S. spot Bitcoin ETFs posted $6.35 billion in net outflows over the latest 30-day window.
Macro news may decide the next short-term move. A durable U.S.-Iran ceasefire could ease oil worries and support risk assets. A real closure of the Strait of Hormuz could raise oil prices and pressure crypto again.
ETF flows also remain important. Stronger inflows could support Bitcoin’s next attempt at $67,000, while more outflows would make the rebound harder to sustain.
For now, the crypto market looks stable but uneven. Bitcoin has reclaimed $64,000, LAB and AERO are leading altcoin gains, and traders are waiting for stronger confirmation.
Disclosure: This article does not represent investment advice. The content and materials featured on this page are for educational purposes only.

A Japanese corporate pension fund that serves roughly 1,200 small and mid-sized businesses plans to earmark about 1% of its assets to cryptocurrency for fiscal year 2026, according to Nikkei.
The Nationwide Business Corporate Pension Fund, based in Okayama, reportedly intends to gain crypto exposure through a passive investment vehicle managed by a major hedge fund that holds multiple crypto assets. The pension fund manages about 21.3 billion yen (approximately $130 million), per the report.
Key takeaways
- The Nationwide Business Corporate Pension Fund plans an allocation of roughly 1% of assets to cryptocurrency for fiscal year 2026.
- Exposure would reportedly be obtained via a passive fund managed by a large hedge fund holding multiple digital assets.
- CoinPost reports the fund’s broader currency mix is 80% yen, 15% US dollars, and 5% other currencies.
- The pension allocation aligns with Japan’s broader push to bring crypto under a regulatory framework closer to traditional financial products.
Japan’s pension sector begins testing crypto exposure
According to CoinPost, the pension fund’s move is part of an effort to diversify its portfolio risk, with crypto added as one potential asset class alongside fiat currencies. While the planned allocation is relatively small, it is notable given the conservative profile typically associated with corporate retirement vehicles—especially in a market where most crypto access has historically been concentrated among retail investors and speculative trading venues.
The proposed approach also matters for how pension funds manage risk. Rather than selecting individual tokens or running active strategies internally, the plan points to a passive fund wrapper—something that could make governance, rebalancing, and operational oversight easier for institutions that are not structured around crypto trading.
Regulatory changes could make allocations easier to justify
The pension development arrives as Japan advances legislation intended to align crypto with mainstream securities rules. On June 11, Japan’s House of Representatives passed a bill that would bring crypto assets under the Financial Instruments and Exchange Act, subjecting them to a regulatory regime more similar to that applied to conventional financial products.
The legislation is expected to move forward to the House of Councilors. If adopted as anticipated, the path would likely clarify the compliance landscape for exchanges and intermediaries—an issue that becomes critical for institutions considering custodial arrangements, fund structures, and investor protections.
The bill has also been discussed in the context of tax reforms. The reporting notes the potential for a shift toward a 20% flat tax on digital-asset gains from the current maximum of 55%. Any change in the tax burden can alter the incentive structure for long-term participation and may make institutional and wealth-manager participation more predictable.
Broader institutional momentum: from banks to listed crypto players
Crypto’s institutional footprint in Japan is expanding on multiple fronts, suggesting the pension allocation is part of a wider trend rather than an isolated decision.
Earlier, SBI Shinsei Bank reportedly began testing a deposit-linked rewards program that issues vouchers redeemable for Bitcoin, Ether, or XRP, ahead of a planned permanent launch this autumn. While vouchers are not the same as a direct pension allocation, the mechanism reflects growing comfort among regulated financial institutions with distributing crypto-linked value to customers.
In parallel, Metaplanet—described as Japan’s largest publicly listed Bitcoin holder—agreed to acquire Siiibo Securities for 2.1 billion yen on June 12. The company said the acquisition is intended to support the development and distribution of Bitcoin-linked yield products through a newly formed securities arm. The move underscores how public crypto holdings are pushing into regulated product pipelines rather than remaining purely as treasury investments.
What investors should watch next
For markets, the key question is whether Japan’s legislative and product-building momentum translates into broader institutional allocations beyond pilots and small percentages. The pension plan is small relative to the fund’s total holdings, but it could be influential if other conservative retirement investors observe the framework and decide the operational and regulatory risks are manageable. Readers should watch the House of Councilors process for the crypto bill and any further detail on the pension fund’s crypto passive vehicle—particularly how it will handle custodial controls, valuation, and rebalancing once fiscal year 2026 approaches.


Polymarket paid mostly college-age creators to stage fake winning bets on copycat versions of its website. A Wall Street Journal investigation found none of the roughly $1.9 million in bets shown across 1,105 videos were real.
The findings run counter to the company’s core pitch. Polymarket settles every real trade on a public blockchain that anyone can audit. Its growth campaign relied on the opposite, staged trades on fake sites that no ledger could verify.
How Polymarket’s Alleged Fake Bets Worked
Real Polymarket trades run on the Polygon blockchain and settle in USDC. Markets resolve through UMA’s permissionless oracle, where anyone can propose or dispute an outcome by posting a $750 bond. Every position is public.
The marketing operation lived entirely off that ledger. The Journal reportedly reviewed 1,105 videos from 10 promoted creators between December and mid-May. Around 70% showed a bet, and none were genuine.
One video showed a creator winning $100,000 after Trump appeared to say the word McDonald’s in January. Trump never said it publicly that month, and the clip was older.
On the real market, public data shows more than 50 accounts made that bet, and all lost.
Many clips were filmed on dummy sites such as poiymarket.com, built to mirror the real platform. Across 118 videos, creators celebrated roughly $900,000 in fabricated wins. The same bets would have lost more than $166,000.
Creators earned about $2,000 to $3,000 a month and were told not to disclose the payments. A hired marketing firm then pushed the clips past 140 million views. The pattern echoes an earlier market resolution dispute that dented user trust.
Scandal Hits During Polymarket’s US Comeback
The timing is awkward. US regulators fined Polymarket $1.4 million in 2022 for running an unregistered market and ordered the winding down of non-compliant trades.
The company later reincorporated in Panama, with its headquarters reportedly a shared law office that also worked with FTX.
Polymarket has since won a regulated US market entry and now wants to bring its exchange onshore.
The fake campaign specifically targeted American users, who can still reach the offshore site through a VPN.
Trust questions are not new. A separate Journal analysis found most users lose money, even as the videos sold easy profit.
Now competing with regulated rival Kalshi, Polymarket said it will audit its promotional content.
That review, which is changing how regulators view its onshore push, may shape the next phase of the prediction market race.
The post Polymarket Accused of Using Fake Winning Bets to Fuel Viral Growth appeared first on BeInCrypto.

Key Takeaways
- Data center operations now represent AMD’s primary revenue catalyst, powered by EPYC server chips and Instinct AI accelerators
- Market share gains don’t require overtaking Nvidia — capturing a significant portion of explosive AI chip demand is sufficient
- Conservative 2031 projection points to approximately $704, while optimistic scenarios exceed $1,500
- Analyst sentiment remains constructive: 30 Buy recommendations, 12 Hold, 1 Sell — overall Moderate Buy rating
- Current trading levels exceed consensus price targets, suggesting near-term valuation concerns following recent gains
Advanced Micro Devices has emerged as a critical player in the artificial intelligence infrastructure expansion.
The firm’s first-quarter 2026 financial report illustrated this strategic shift unmistakably. Revenues climbed substantially, fueled by robust appetite for EPYC data center processors and Instinct GPU accelerators. The data center segment has displaced gaming and consumer processors as the company’s dominant growth driver.
Shares currently change hands near $537. This valuation reflects significant optimism already embedded in the market price.
Advanced Micro Devices, Inc., AMD
The optimistic investment thesis hinges on three critical factors. Cloud hyperscalers increasingly prioritize vendor diversification for AI silicon. AMD has established substantial positioning in server processors following years of systematically capturing territory from Intel. The company’s AI accelerator development timeline positions it as a viable alternative computing platform.
Nvidia maintains commanding leadership in AI acceleration hardware. However, AMD’s success doesn’t require outright victory in this competition. Even a substantial minority position in an explosively expanding market translates to dramatically increased business scale.
Three Potential Trajectories Through 2031
Financial analysts have constructed three distinct scenarios for AMD’s evolution over the next seven years.
Under pessimistic assumptions, AMD expands but struggles to secure adequate AI accelerator adoption. Revenues might approach $70 billion, yet margin compression limits profitability. Applying a 25x earnings multiple yields a stock price near $200.
The middle-ground projection presents more favorable conditions. AMD sustains data center penetration, expands Instinct GPU deployment, and achieves margin improvement. Revenue could reach $120 billion with earnings per share around $22. A 32x valuation multiple supports a price target of approximately $704.
The optimistic scenario envisions transformational success. Should AMD establish itself as the definitive second AI chip platform while simultaneously expanding CPU and enterprise computing presence, revenues might hit $180 billion. With EPS at $40 and a premium valuation, shares could trade beyond $1,500.
Weighting these scenarios by probability generates a blended target near $807 — representing roughly 50% appreciation from current levels, or approximately 8.5% annualized returns.
Current Wall Street Perspective
The analyst community maintains generally favorable views, albeit with important caveats.
AMD presently carries 1 Strong Buy, 30 Buy ratings, 12 Holds, and 1 Sell, per MarketBeat data. The aggregate rating stands at Moderate Buy.
The complication: average analyst price targets fall below AMD’s current market price. This gap suggests analysts appreciate the business fundamentals while believing the stock has outpaced near-term justification following its recent advance.
The Road Ahead for AMD
AMD’s EPYC processor family has systematically captured CPU market share from Intel over consecutive quarters. This provides the company with established data center relationships independent of Instinct GPU revenue contributions.
Executive guidance has previously outlined expectations for sustained multi-year expansion, anchored by data center growth. These projections form the foundation for 2031 valuation models.
For AMD to generate meaningful market outperformance from current levels, execution closer to the bullish scenario appears necessary. The base-case trajectory delivers returns roughly aligned with broader equity market expectations — respectable, but below the outsized gains growth-oriented investors typically seek.
First-quarter 2026 data center revenue established a new company record for quarterly performance.
XRP price traded near $1.14 on June 21, with the token still locked in a narrow range after failing to clear $1.20.
Summary
- XRP price traded near $1.14 as buyers defended the key $1.10 support zone after weak volume.
- Ripple adoption keeps growing through RLUSD, MXNB, Mastercard settlement links and AI payment tools.
- ETF inflows and low exchange reserves support the rebound case, but whale selling remains under pressure.
According to crypto.news data, XRP showed a 24-hour move of -0.34%, with price action between $1.13 and $1.15.
The token stayed almost flat over seven days but remained down more than 16% over 30 days. Trading volume stood near $872 million, while market value held around $70.97 billion, keeping XRP in sixth place among crypto assets.
The setup remains simple. Bulls need to protect $1.10, while a close above $1.20 would give the market a reason to revisit $1.25 and $1.30.
XRP price stays locked inside a tight range
Last week’s range view has held. XRP buyers pushed toward $1.20, but they did not secure a breakout with strong volume. Sellers also failed to break the $1.10 floor, keeping the token inside the same band.
That makes $1.10 the first level to watch. A clean move below that area could expose $1.05 and then the $1.00 zone.
The upside path also remains clear. XRP needs volume above $1.20 before bulls can target $1.25 and $1.30. Without that confirmation, the move looks more like consolidation than a new trend.
This range still matters. Long periods of flat trading often build pressure, but direction still depends on who wins the range. A breakout without volume would carry less weight than a close backed by stronger spot demand.
Ripple adoption supports the long-term case
Ripple’s ecosystem news gave bulls a stronger utility argument even as price stayed weak. The company has pushed RLUSD into more payment channels and recently backed Flutterwave’s Series E round to support stablecoin adoption in African payments.
Ripple also worked with Bitso on MXNB, a Mexican peso stablecoin on the XRP Ledger. Ripple is expanding RLUSD through Mastercard’s stablecoin settlement network and MXNB-powered cross-border payment infrastructure.
The XRP Ledger also moved deeper into automated payments. Crypto.news reported that Ripple launched the XRPL AI Starter Kit, allowing AI agents to use XRP and RLUSD for payments through the x402 protocol.
This does not guarantee higher prices. It does show that XRP’s utility story is moving beyond retail trading and into payments, stablecoins, settlement and machine-to-machine transfers.
CLARITY Act and reserves shape the catalyst
Regulation remains a key part of the XRP price analysis. As crypto.news reported, the CLARITY Act has cleared committee and now needs Senate votes, with the 60-vote threshold still ahead.
The bill matters for XRP because it could give institutions clearer rules for digital commodities and tokenized settlement. XRP is already being used in tokenized Treasury settlement pilots, but larger adoption still depends on legal certainty.
Supply data adds another layer. Crypto.news reported that XRP exchange reserves fell to a seven-year low near 1.6 billion tokens, down about 50% from October 2025. Low exchange supply can make price more sensitive when demand arrives.
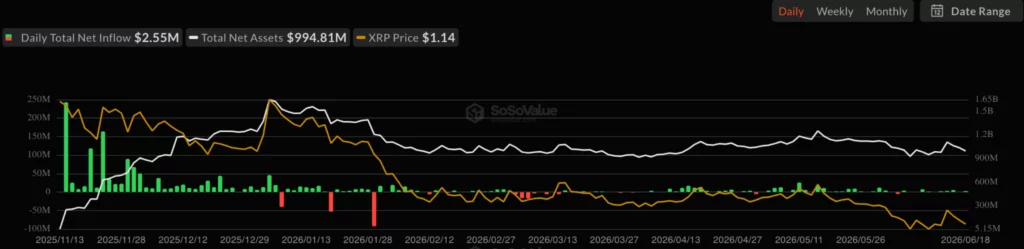
Fund flows are another support point. According to SoSoValue data, XRP-linked products recorded about $10.66 million in weekly net inflows for the week ending June 18, close to $10.68 million in the prior week. Cumulative net inflows rose to about $1.45 billion, while total net assets moved closer to $1 billion.
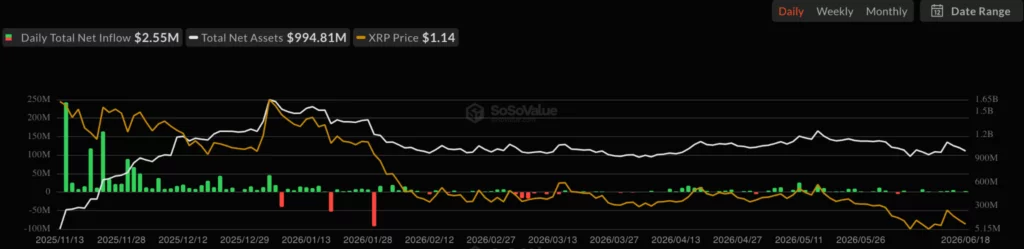
Still, whale activity keeps risk on the table. As previously reported, whales had distributed more than 30 million XRP in five days, while network activity weakened.
Analysts watch $1.10 and $1.20
Technical analysts remain split. EGRAG CRYPTO described the two-month XRP chart as “E is the battlefield,” pointing to a structure that could support a future breakout if buyers defend the current zone.
The analyst listed much higher cycle targets, including $9.50 to $17.23, with $13 as a main focus. Those targets remain speculative while XRP trades near $1.14 and below the $1.20 breakout area.
For now, the market does not need targets to define the next move. XRP needs to hold $1.10, reclaim $1.20 and then show stronger volume. A failure at $1.10 would keep sellers in control.
ETF flows, lower exchange reserves and Ripple adoption support the rebound case. Whale selling, weak activity and a stalled breakout support the cautious case. XRP is still waiting for a clean trigger.
Disclosure: This article does not represent investment advice. The content and materials featured on this page are for educational purposes only.

How Millions of Digital Home Devices Are Secretly Powering Cyberattacks

England vs New Zealand: Matt Henry ends hosts’ miserable fortnight

7 Underrated Fantasy Shows Worth Watching Over and Over


-

 Business7 days ago
No Jackpot Winner as $257 Million Prize Rolls Over to $269 Million Monday Draw
-

 Fashion2 days ago
Weekend Open Thread: Miami – Corporette.com
-
Crypto World6 days ago
Zimbabwe Requires Crypto Businesses to Register Annually Under New FIU Regulations
-
 Business1 day ago
Wall Street Week Ahead: Investors see Micron earnings as pulse check of AI rally momentum
-
 Entertainment7 days ago
Matt Damon’s Viral Sci-Fi Thriller Has Taken Over HBO Max
-

 Tech7 days ago
As AI companies race to go public, who else is along for the ride?
-

 Crypto World1 day ago
HIVE shares jump as $220M AI deal speeds Bitcoin mining pivot
-

 Business7 days ago
Anthropic staff to meet White House officials next week, Axios reports
-
 Crypto World7 days ago
Bitcoin could crash to $48,000, if this historical pattern is triggered
-
 NewsBeat7 days ago
what doctors are seeing in ebike crashes
-
 NewsBeat7 days ago
Warning of disruption as Cardiff Crossrail works to start
-
 NewsBeat7 days ago
Tributes to former deputy head teacher at Cambridge school among death and funeral notices
-
 Entertainment7 days ago
Kate Middleton Glare Goes Viral After Kids Booed At Royal Event
-

 Politics7 days ago
“Israel’s” ban on ICRC visits ruled illegal, but Knesset moves to stop them permanently
-

 News Videos7 days ago
Financial Accounting | Last Day Revision Strategy and Booster | CMA Inter – June 2026
-

 Crypto World7 days ago
XRP ETFs Outperform As Bitcoin And Ethereum Funds Extend Outflow Trend
-

 Tech6 days ago
Over 400 Arch Linux packages compromised to push rootkit, infostealer
-

 Business7 days ago
Invesco Quality Income Fund Q1 2026 Commentary
-

 NewsBeat7 days ago
Singer Oliver Tree dies aged 32 in helicopter crash in Brazil
-
 Crypto World7 days ago
Market Preview: SpaceX (SPCX) IPO Record, Federal Reserve Meeting, and Iran Nuclear Agreement
You must be logged in to post a comment Login