
Crypto World
US-Israeli war with Iran forces TOKEN2049 cancellation


TOKEN2049, which was due to take place in Dubai in April, has reportedly been cancelled amid growing concerns for conference goers’ safety due to the ongoing US-Israel war with Iran.
As reported by Wu Blockchain, a document was sent to TOKEN2049 sponsors warning that the event would be pushed back to April 2027 due to “current geopolitical conditions” and their impact on “international travel, participation, and event logistics.”
It claimed that preparations for the conference had been continuing and that the decision “was not taken lightly.”
Organizers said, “ensuring the global crypto industry can gather safely, and at the scale and quality that define TOKEN2049, remains our top priority.”
Read more: Is ‘cloud seeding’ behind Dubai floods that wrecked TOKEN2049?
It noted that sponsors for the 2026 event will be carried over to next year’s conference, and stressed that it remains committed to maintaining its “long term presence” in Dubai.
The cancelation comes just four days after TOKEN2049 told Fortune that the event would continue as planned and preparations were in full swing.
A separate conference for TON, a cryptocurrency once associated with Telegram, cancelled its May Dubai event yesterday due to the ongoing conflict.
Dubai arrests people filming Iran strikes in the country
The ongoing war in the Middle East has led to retaliatory attacks from Iran targeting US-Israel allied states in the Gulf, including the United Arab Emirates, specifically Dubai.
Drone attacks reportedly targeted the city’s financial centre earlier today, while drones fell near its airport earlier in the week.
It’s also been targeted by missile fire, and the Burj Al Arab and luxury Palm Jumeirah area, both situated near the intended TOKEN2049 venue, have been attacked.
Several people have been arrested and charged after filming and posting the attacks.
Read more: How bombing Iran shifted oil and bitcoin prices
Iran recently closed the Strait of Hormuz and has reportedly attacked at least 18 ships attempting to pass through it since the conflict began. The route was critical for shipping oil, and its closure has caused its price to skyrocket.
Got a tip? Send us an email securely via Protos Leaks. For more informed news and investigations, follow us on X, Bluesky, and Google News, or subscribe to our YouTube channel.

A new bill in Canada, if passed, would ban political parties and other third parties in elections from accepting cryptocurrency donations in a bid to prevent election interference.
The Strong and Free Elections Act would also ban contributions made by money orders and prepaid cards, citing these methods as difficult to track.
The bill notes the potential for foreign actors to influence elections through difficult-to-trace digital payment methods, ensuring Canadian elections “remain free, fair and secure at all times,” according to Government House Leader Steven MacKinnon.
Moreover, as the office of the Commissioner of Canada Elections told Cointelegraph, “The rapid and ongoing change in digital payments creates significant challenges and risks for law enforcement, including for our office.”
Crypto creates problems for election transparency, gov’t officials say
The rules for political financing in Canada are complex. Two offices, the Commissioner of Canada Elections and Elections Canada, play “distinct but complementary” roles under the Canada Elections Act’s (CEA). The bill banning crypto political donations would make changes to this Act.

Elections Canada, led by Chief Electoral Officer Stéphane Perrault, is responsible for conducting federal elections and administering the political financing regime.
The Commissioner of Canada Elections, currently Caroline J. Simard, “is responsible for ensuring that the rules under the Act are complied with and enforced,” a commissioner spokesperson said.
For both agencies, cryptocurrencies present challenges to maintaining free and transparent elections. For the commissioner’s office these include “potential difficulties associated with tracing the source of funding.”
Perrault shared a similar sentiment at an October appearance at the Procedure and House Affairs Committee.
“The problem with those instruments is that they do not provide transparency as to the original source of the contributor.”
He said that “a key principle of our system is that we know where the money comes from. There’s no, in my view, valid reason to use a prepaid instrument, a prepaid credit card, to provide money to a candidate or to a political party.”
Perrault acknowledged that they have legitimate uses elsewhere in the economy, “but in terms of financing parties and candidates, I do not believe they are appropriate.”
Crypto’s ‘non-moneyness’ creates an opening for foreign influence
Under current Canadian law, cryptocurrency qualifies as a legal, “non-monetary” contribution for political parties. Elections Canada told Cointelegraph they therefore must abide by certain reporting requirements.
“For contributions over $200, the political entity must report the contributor’s name and address in its financial return.”
However, contributions up to $200, if the donor is a Canadian citizen or permanent resident not in the crypto business, are deemed “nil.”
According to Perrault, the rules for non-monetary donations up to $200 were initially included in the CEA “to allow small-value gifts of goods and services—those valued under $200 and made by a person not in the business of providing such a good or service.” He gave an example of cooking food for campaign staff or lending the use of a personal vehicle.
This becomes more problematic when applied to crypto. Perrault said, “Although contributions of cryptocurrencies are non-monetary contributions under the CEA, the reality of cryptocurrency is that it functions increasingly like money.”
“If a contribution were made in cryptocurrency, it could be seen as a means by which unregulated resources could enter the federal political financing regime.”
He officially recommended that parliament “prohibit making contributions in cryptocurrency and untraceable instruments.”
While the potential for abuse is there, Elections Canada noted that “generally speaking, cryptocurrencies are not widely used to raise funds at the federal level in Canada.”
However, “the reporting framework for contributions does not currently require entities to disclose when a contribution was made via cryptocurrency, so Elections Canada does not have official figures on this.”
Crypto in Canadian politics: From convoys to Carney
Canada has displayed a relatively open, if cautious stance toward crypto. It became the first country to approve a spot Bitcoin exchange-traded fund in February 2021.
Crypto has appeared in the political discourse before as well. In 2022, a series of blockades and protests against COVID-19 vaccine mandates for truck drivers quickly ballooned into nationwide demonstrations. On Jan. 22 that year, the first convoy of over 1,000 vehicles departed for Ottawa. Over the next few weeks, crowds occupied the streets of downtown Ottawa to protest then-Prime Minister Justin Trudeau’s Liberal government.
When the government used the Emergencies Act to freeze convoy organizers’ bank accounts, they took donations in crypto. According to CBC, the convoy raised over $20 million in crypto donations, $8 million of which was still unaccounted for by April 2022.
Cryptocurrencies were hailed as a means to circumvent government control and take control over critical funding for the anti-vaccine protest movement.
Mathew Burgoyne, a digital currency lawyer based in Calgary, told the CBC, “There’s a huge limitation, as we’ve seen, with freeze orders when they relate to cryptocurrency wallets.”
Crypto entered the political arena again during the 2025 federal elections when Conservative candidate Pierre Poilievre made a number of statements and appearances promoting crypto and blockchain tech.
Related: Why Pierre Poilievre may not be Canada’s crypto savior
In one campaign lunch stop, he bought shawarma using the Bitcoin Lightning Network at Canadian chain Tahini’s, and he talked about Bitcoin while smoking hookah with the company’s vice president.
Under current Prime Minister Mark Carney, the Canadian crypto industry is growing, but with a “regulate first” attitude from policymakers. In November, Parliament introduced the Canada Stablecoin Act as part of the budget, giving the Bank of Canada the power to regulate stablecoins in the country.
As it concerns political donations, some in the industry believe there are higher priorities right now. One industry source at a Canadian crypto firm told Cointelegraph that issues like stablecoin regulation, tokenization and payments modernization take precedence over political donations, which are still quite marginal, in their estimation.
They said that the industry doesn’t support a ban, but there are other policy decisions that present clearer opportunities for the industry to make a difference.
Altura, a decentralized finance protocol founded by former Fidelity and PwC staff is launching an onchain gold arbitrage strategy aimed at retail investors, targeting 20% annualized returns, according to a Thursday release shared with Cointelegraph.
According to Altura, the product pools user deposits into a vault that recycles capital through short-duration physical gold trades. Unlike platforms like Robinhood or Revolut that offer passive gold price exposure, Altura claims to be tokenizing the underlying arbitrage process itself.
The company says it has raised $4 million in funding and has already facilitated the movement of about 185 kilograms of gold, representing roughly $28.5 million in cumulative transaction volume, per the release.
Matthew Pinnock, co-founder and chief operating officer of Altura, told Cointelegraph the goal is to “bring an institutional-style gold strategy onchain in a way that retail investors can actually access.”
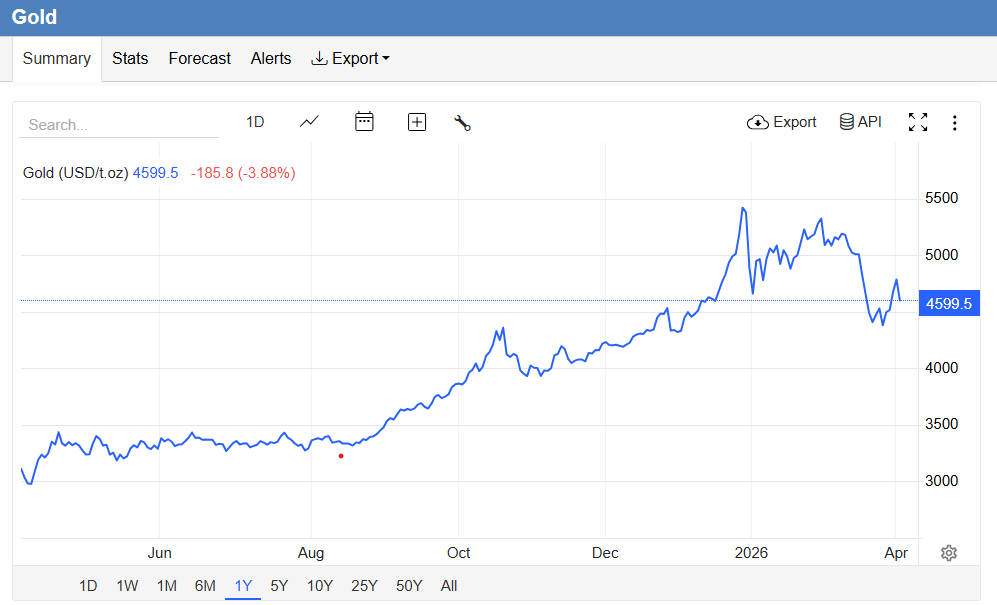
The launch comes as spot gold trades near record levels after surging to an all-time high above $5,300 an ounce in January, though it has since pulled back sharply. Altura’s launch points to a new phase in tokenized real-world assets, where projects are no longer just offering passive exposure to commodities but are trying to package institutional trading strategies as onchain DeFi yield products for retail users.
A strategy typically reserved for institutional traders
Pinnock said Altura’s “revenue-generating trading strategy” was historically used by institutional commodities desks, and that high capital requirements, legal complexity and counterparty risk in traditional bullion arbitrage have effectively kept smaller investors out of this type of trade.

Gold purchased on behalf of Altura by its trading partner Inessa is tokenized at acquisition, Pinnock said, with those tokens escrowed through each trade and custody transitions recorded via dual cryptographic signatures. Depositors do not hold direct title to bullion but gain exposure to returns generated by the trade flow, he added.
Altura’s setup depends on a network of offchain actors. The company says it is working with Aurellion Labs and Inessa, which in turn partners with air-cargo specialist Zeal Global, to execute and verify trades.
Related: Gold hits record high over $5K, further diverging from Bitcoin
On the targeted 20% yields, Pinnock said the strategy is structured to be “close to delta-neutral,” with trade terms agreed before logistics execution begins so that returns come from price discrepancies between counterparties rather than directional bets on the gold price.
Each arbitrage cycle typically completes within one to two days, allowing capital to be recycled multiple times and limiting exposure to spot moves, he said, while acknowledging that yields would compress if pricing inefficiencies narrow.
Related: Tokenized gold drives weekend price signals while CME futures are closed
Rising interest in real-world yields
The launch comes amid rising interest in “real-world” DeFi yields, as tokenized asset and RWA protocols grew to roughly $17 billion in total value locked in December 2025, according to DefiLlama data.
However, a joint report by RWA.io and Veritas Protocol in that same month found that losses from onchain operational failures in tokenized RWA markets rose to $14.6 million in the first half of 2025, a 143% increase from the previous year, highlighting how complex offchain structures can still translate into user losses.
Magazine: Bitcoin’s ‘biggest bull catalyst’ would be Saylor’s liquidation — Santiment founder
Murad Mahmudov, a crypto trader also known as the “Memecoin messiah,” has lost nearly $60 million across his bets in the past nine months. Still, he expects a bullish reversal.
Key takeaways:
-
Mahmudov thinks SPX6900, which is 96% of his memecoin portfolio, will rise 400,000%.
-
SPX6900 chart technicals signal another 20% decline in the coming weeks.
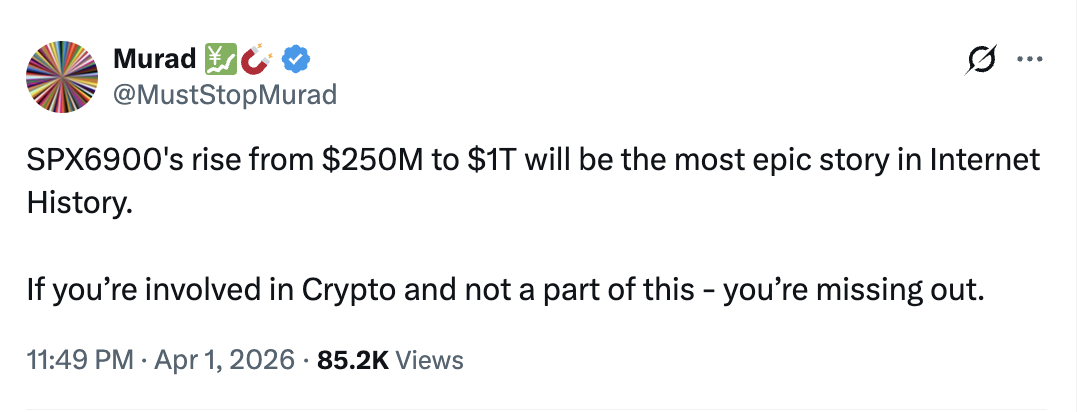
SPX6900 will reach $1 trillion market cap, claims Mahmudov
On Wednesday, Mahmudov said the market capitalization of SPX6900 (SPX), a memecoin on a mission to overtake the US benchmark S&P 500 index, will grow to $1 trillion from its current valuation of around $250 million, a nearly 400,000% increase.

For context, Bitcoin (BTC) is the only cryptocurrency that has been able to hit a $1 trillion mark so far, led by growing institutional demand.
Mahmudov’s publicly labeled wallets, tracked under the entity “Muststopmurad” by Arkham Intelligence, currently hold approximately 29.964 million SPX, valued at roughly $7.79 million.

This single position accounts for about 96% of his total tracked portfolio, currently valued at around $8.1 million.
At its peak in July last year, the same portfolio was worth around $67 million.
The drop since then amounts to an unrealized loss of roughly $60 million, as the broader memecoin sector, including SPX, corrected by more than 80% from its highs.
Mahmudov still holds SPX6900 and other memecoins
Mahmudov does not appear to be locking in the memecoin losses.
Portfolio tracker DropsTab shows no meaningful sales of SPX6900 or his other major positions, with realized profits and losses on the tracked holdings still at zero.

Importantly, the trader appears to be holding more than $6.22 million in unrealized gains instead of taking a profit.
Mahmudov’s refusal to sell also stands out because the broader memecoin market has been brutal toward its dedicated holders.
In a January report, CoinGecko said that 53.2% of all cryptocurrencies tracked since 2021 were inactive, with 11.6 million token failures recorded in 2025 alone that particularly “affected the memecoin sector.”
Related: Memecoins and art market share similar economics — Ki Young Ju
Mahmudov’s smaller wallet holdings also reveal the limits of memecoin conviction.
Public DEX data for ticker-level matches, including RETARDMAXX, HONK and CHAD, shows that some of these names are barely functional.
One RETARDMAXX pair had roughly $44,000 in liquidity but just six transactions and $89 in daily volume, while CHAD showed $842 in liquidity with zero trades and zero makers.

One HONK pair, meanwhile, had just $1 in liquidity and no recorded activity. Those tokens may still print a price on screen, but in a selloff, they offer little evidence of dependable exit liquidity.
SPX900 breakdown hints at more losses ahead
On the three-day chart, SPX6900 appears to be breaking down from a rising wedge, a bearish pattern that typically resolves lower after price slips below support.
SPX has already started losing the wedge’s lower trendline near $0.26 and remains below its 20-, 50- and 100-period exponential moving averages, underscoring weak momentum.

If the breakdown confirms, the measured move points to $0.205, about 20% below current levels.
A 20% drop in SPX would cut roughly $1.56 million from Mahmudov’s memecoin portfolio.
This article is produced in accordance with Cointelegraph’s Editorial Policy and is intended for informational purposes only. It does not constitute investment advice or recommendations. All investments and trades carry risk; readers are encouraged to conduct independent research before making any decisions. Cointelegraph makes no guarantees regarding the accuracy or completeness of the information presented, including forward-looking statements, and will not be liable for any loss or damage arising from reliance on this content.
French blockchain-based stock exchange Lightning Stock Exchange (Lise) is preparing to host what it describes as a fully onchain initial public offering (IPO), listing aerospace and defense SME ST Group as its inaugural company.
The company called the deal the first IPO on a natively tokenized exchange, where shares are issued and traded as digital tokens rather than recorded through traditional market infrastructure, according to a Thursday announcement shared with Cointelegraph.
CEO Mark Kepeneghian said it could fundamentally change “how markets are built, how companies raise capital, and how investors connect to the real economy.”
The IPO is scheduled for April 9 and is being structured with support from Allinvest Group, acting as both financial adviser and bookrunner. The platform introduces a first-come, first-served allocation for IPO orders and removes subscription and custody fees.
The IPO will test whether tokenized issuance can solve real capital market problems for smaller companies, rather than simply showcase blockchain-based market plumbing. Tokenized securities have long struggled with liquidity, investor access and regulatory friction, and it remains unclear whether a new venue can attract meaningful trading activity or operate smoothly at scale.
Related: NYSE taps Securitize for 24/7 tokenized securities platform
Lise secures license from French regulators
Lise said it holds multiple regulatory approvals, including an investment firm license from the French Prudential Supervision and Resolution Authority and a DLT Pilot Regime authorization from the European Securities and Markets Authority, allowing it to run trading and settlement on blockchain infrastructure, a company spokesperson told Cointelegraph.
Cointelegraph previously reported that the European Commission had proposed extending the DLT Pilot Regime as part of broader efforts to support tokenized financial markets in Europe.
“Lise operates both a Multilateral Trading Facility (MTF) and a Central Securities Depository (CSD) within a single unified platform, built natively on Hyperledger Besu (a private, permissioned blockchain),” the spokesperson said, adding that shares issued on Lise are born as security tokens on the DLT. “The DLT is the golden source for the securities registry,” they said.
Related: Franklin Templeton, Ondo to launch tokenized ETFs with 24/7 trading via crypto wallets
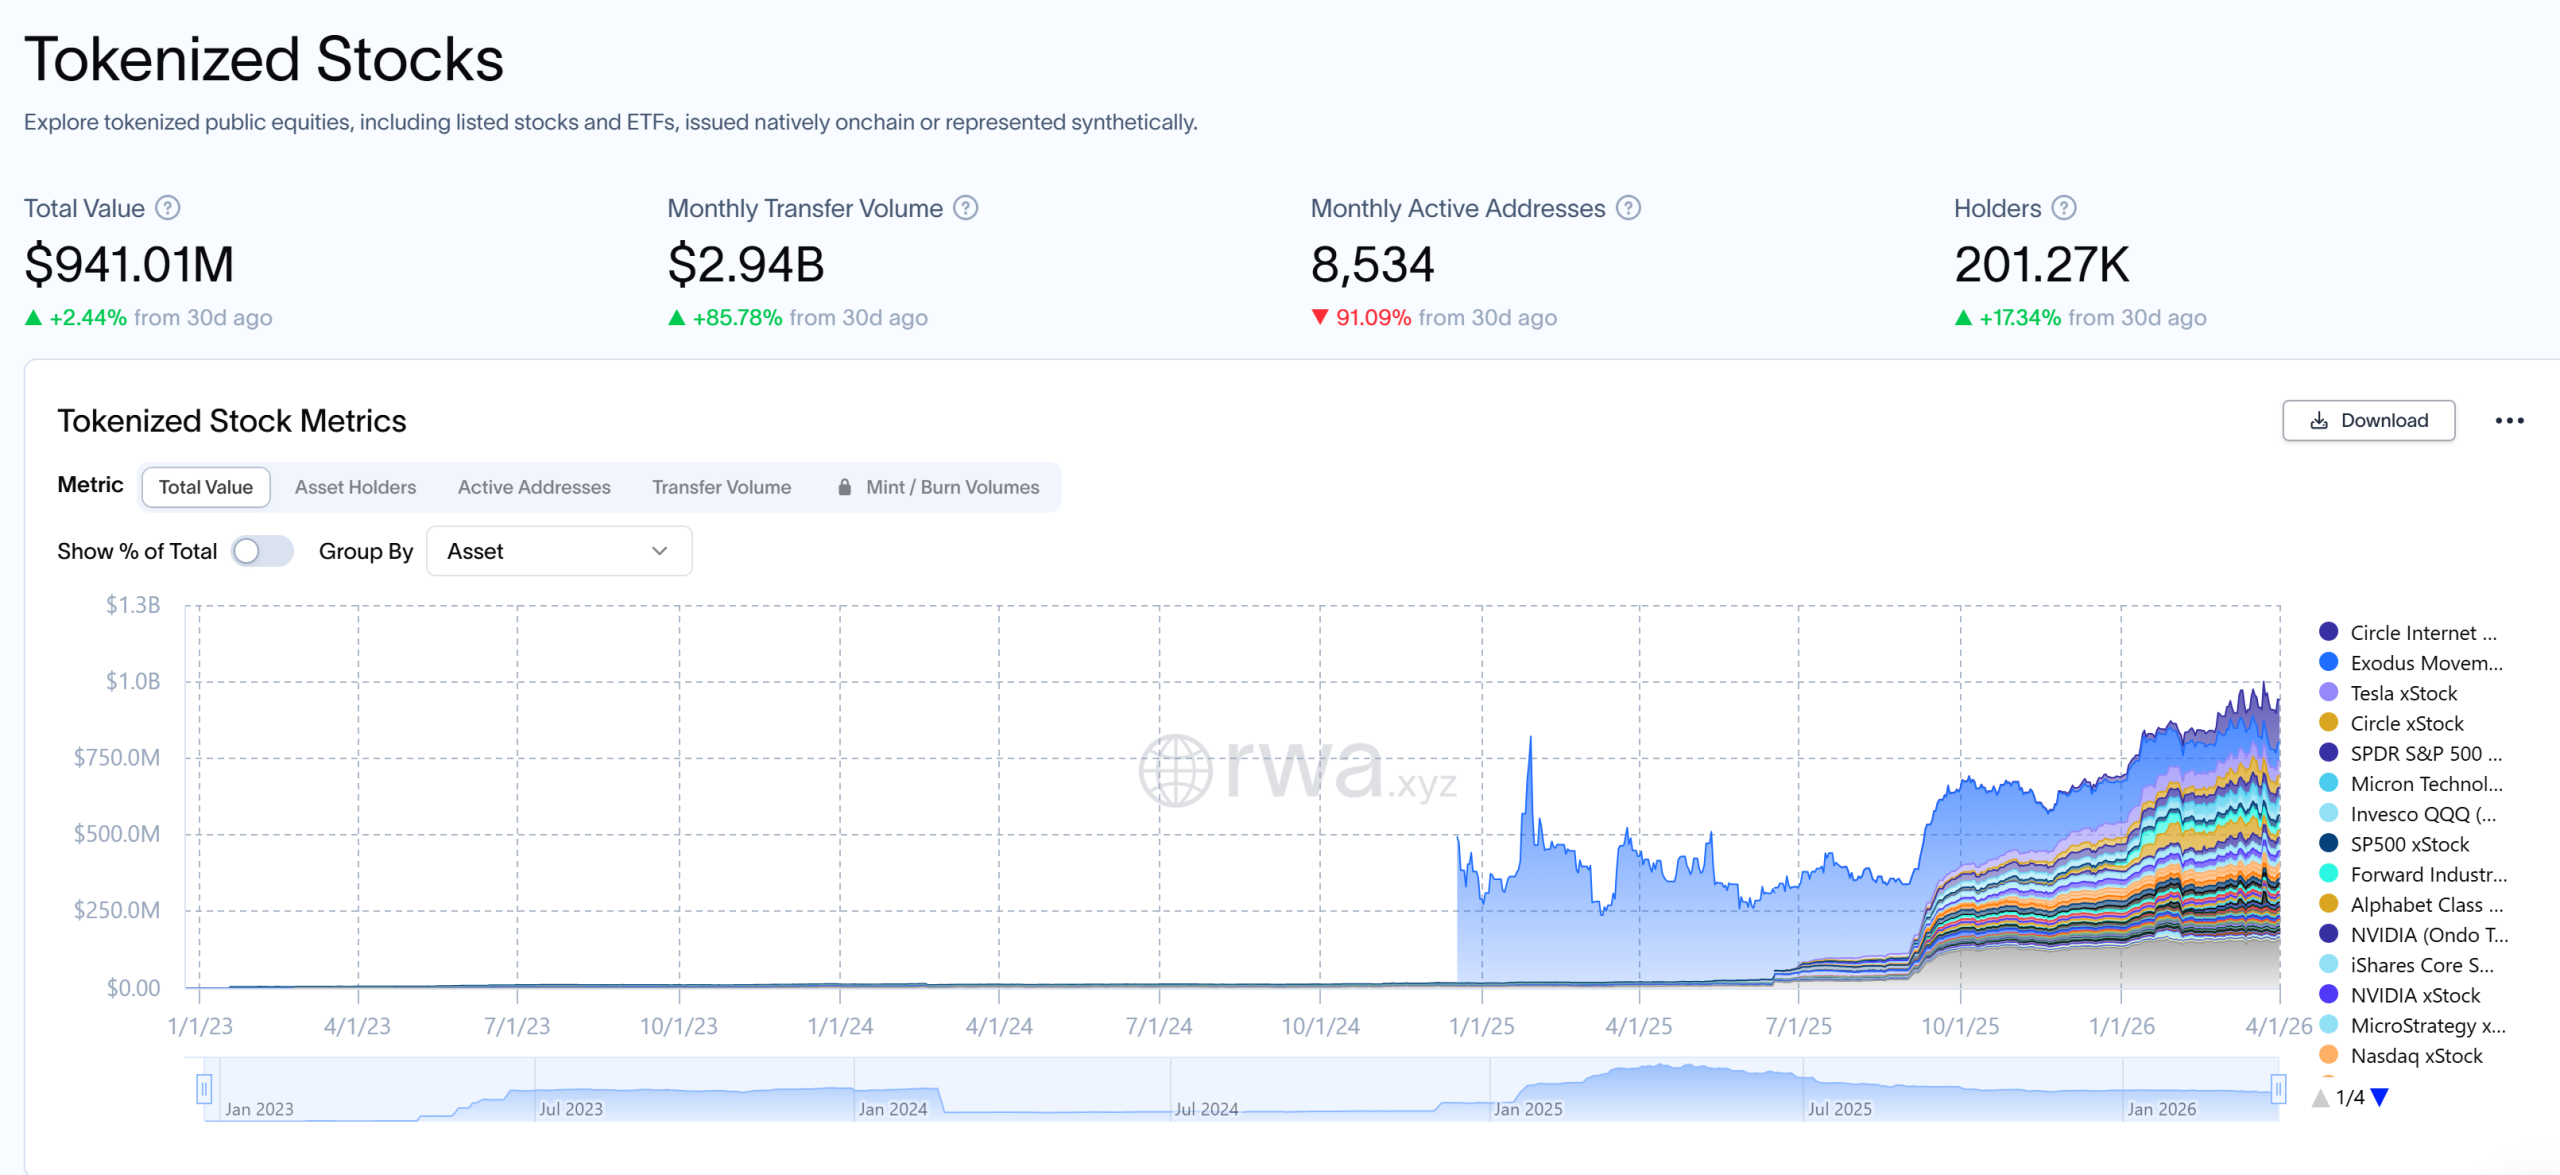
Tokenized stocks near $1 billion
Investor demand for blockchain-based tokenized stocks is picking up, with total market value nearing the $1 billion mark. Tokenized equities reached about $941 million in total value, up 2.4% over the past 30 days, according to data from RWA.xyz.

Activity has grown sharply in some areas. Monthly transfer volume jumped 85% to $2.94 billion, while the number of holders climbed 17% to more than 201,000.
Magazine: Bitcoin may take 7 years to upgrade to post-quantum — BIP-360 co-author
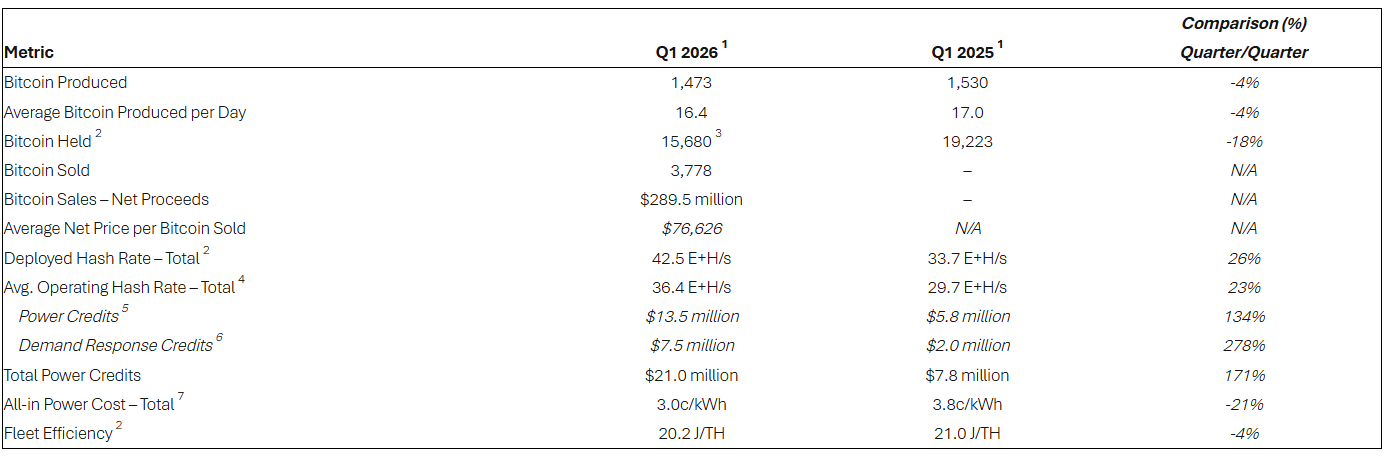
Bitcoin miner Riot Platforms sold 3,778 Bitcoin in the first quarter, adding to a recent wave of sales by crypto firms amid tough market conditions.
The Bitcoin (BTC) was sold at an average price of $76,626, netting Riot $289.5 million, according to the miner’s operational update released on Thursday. Bitcoin was trading at $66,867 as of Friday.
The miner produced 1,473 Bitcoin for the quarter and had 15,680 coins on its books at the end of Q1. Blockchain intelligence platform Arkham also flagged a 500 Bitcoin outflow from a wallet it attributed to Riot Platforms on Thursday.
It adds to a number of crypto miners and firms that have sold Bitcoin in recent months. In the last week, companies including MARA Holdings, Genius Group and Nakamoto Holdings revealed they had sold a combined 15,501 Bitcoin, with the lion’s share coming from MARA.

Kadan Stadelmann, a blockchain developer, investor and co-founder of AI company Compance, said miners are selling due to rising energy costs, which have worsened because of the war in the Middle East.
“Miners are selling off Bitcoin due to increasing energy costs, highlighted by the ongoing oil price shock, which represents one of the main costs of mining Bitcoin. As energy costs rise, the miners are forced to sell off their Bitcoin in an attempt to cover their operational costs.”
The Middle East conflict, which escalated in February, has driven oil prices higher while pushing cryptocurrencies and broader markets lower.
Less efficient miners are turning off rigs
Stadelmann said that less efficient miners are going offline because of mounting costs and predicted further capitulation, leaving larger operators to pick up the slack.
“This leads to a fall in hashrate and difficulty in Bitcoin mining. This makes it easier and more profitable to mine Bitcoins for those miners who remain online,” he told Cointelegraph.
The Bitcoin mining difficulty dropped on March 20 from around 145 trillion to 133 trillion, while the hash rate has also dropped since the start of the month from 1.16 zettahash to around 990 exahash as of Friday, according to CoinWarz.
Related: Bitfarms loss widened to $285M as Bitcoin fell, but shares jump anyway
However, Stadelmann also said a potential drop in energy prices and an increase in Bitcoin’s price could see less efficient miners return.
“Hashrate and difficulty could increase if efficient miners expand their operations as a result of the friendlier mining environment, possibly through investments in hardware or acquisitions of other miners. Alternatively, energy prices could decline, leading to the return of less efficient miners,” he added.
Magazine: Bitcoin may take 7 years to upgrade to post-quantum — BIP-360 co-author
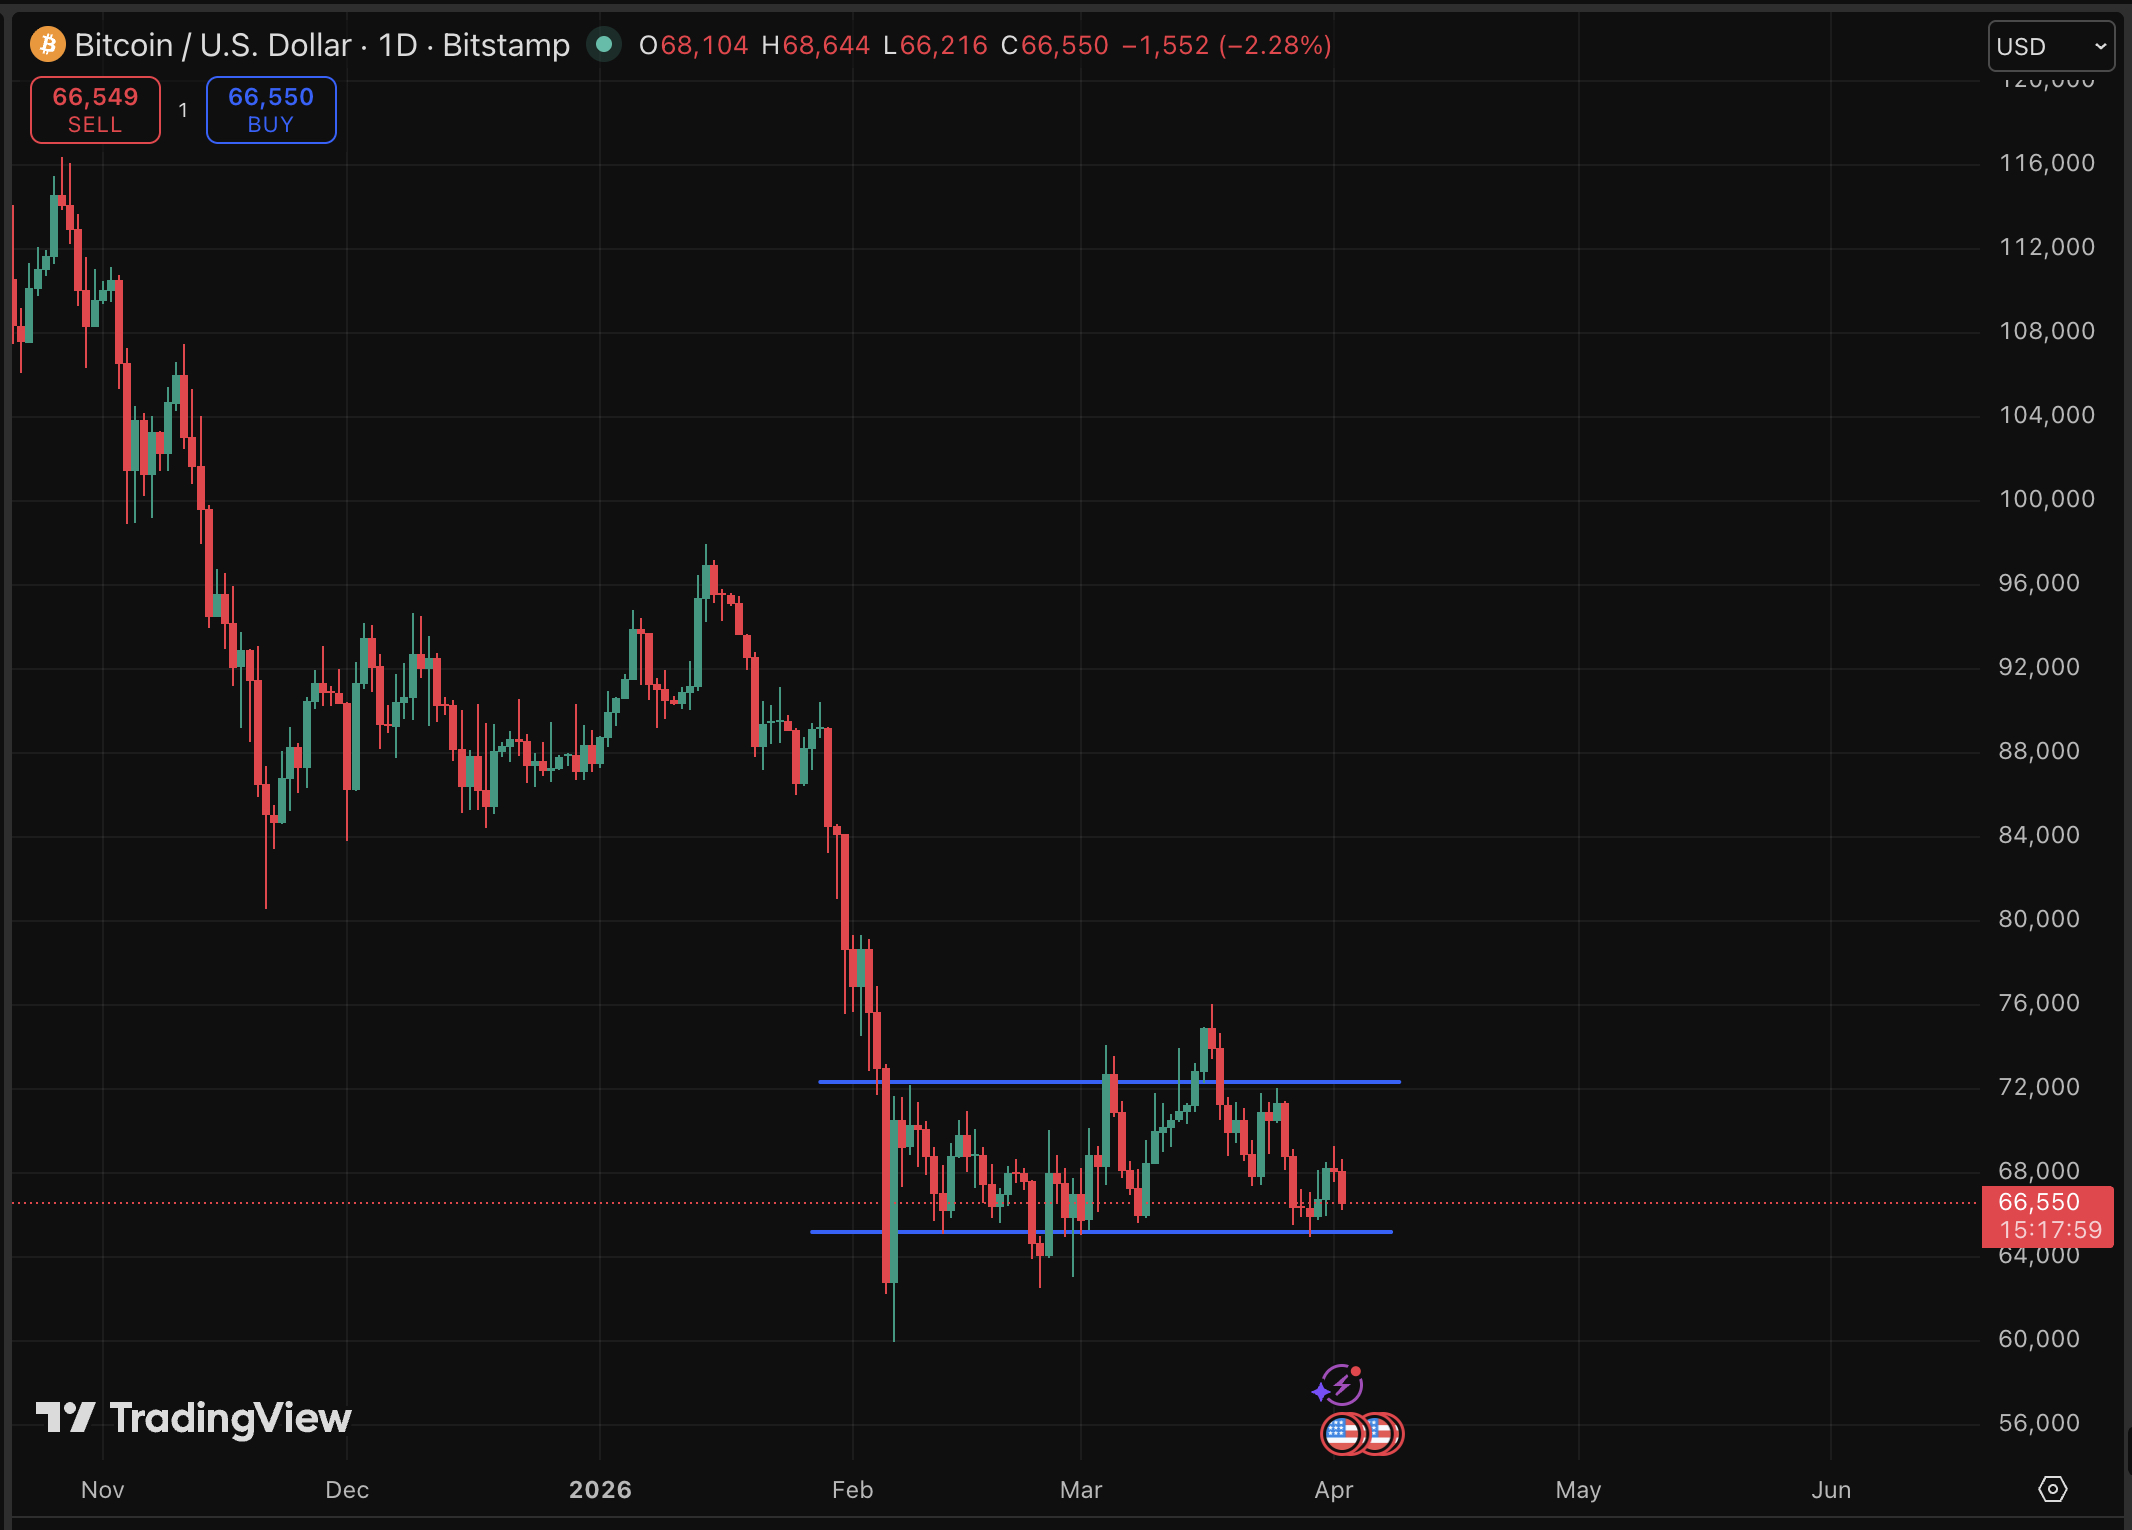
Bitcoin slipped sharply Wednesday as President Trump addressed the nation on the US-Iran conflict, dragging BTC price down by 3% to $66,600 during the speech amid bearish prediction. The asset now seems to stabilize, but BTC is still down 4.9% over seven days.
Trump told the nation last night that Operation Epic Fury has effectively dismantled Iran’s nuclear and naval capabilities while crippling its drone and missile infrastructure, and claimed the US military is “very close” to finishing the job, but still need more weeks, with more fire power.
Markets moved instantly. Crude oil spiked back above $100 per barrel to $108 as traders repriced geopolitical risk upward. Trump simultaneously signaled openness to a deal, describing Iran’s new leadership as “less radical and much more reasonable,” a note of optimism buried inside an otherwise hawkish speech. This ambiguity is precisely the macro fog that keeps risk assets pinned.
Equities, crypto, and commodities have all traded in lockstep with Middle East headlines for months. Until the Iran situation resolves cleanly in either direction, Bitcoin is unlikely to decouple.
Discover: The best crypto to diversify your portfolio with
Bitcoin Price Prediction: Reclaim $71,500 or Another Pain Coming?
Bitcoin closed Q1 2026 near $68,000, a weak finish that confirmed sustained selling pressure. The current structure shows no major structural levels reclaimed, with downward-sloping moving averages pressuring price from above.
Support still sits at $66,000 and $63,000, below that zone would mark a deep retest of prior cycle structure. Resistance clusters at $69,000 and $72,000, where moving average resistance and prior breakdown levels converge.

Can Bitcoin force a leg up? Only if Iran deal confirmed, oil retreats below $90, and risk-on flows return, which then BTC reclaims $68,000 with volume. In that scenario it can target $72.000.
However, with dragging conflict, BTC will likely oscillate between $66,000 and $68,000, frustrating both sides. Or, peace talks collapse, oil accelerates, inflation expectations spike. BTC loses $66,000 support and tests $63,000, a level that has not been tested since the Q4 2025 breakdown.
Long-term holders are reportedly increasing demand despite the volatility, but analyst consensus is clear: without a $72,000 reclaim, the path of least resistance remains down.
Discover: The best pre-launch token sales
Early Mover Potential as Bitcoin Tests Key Levels
For now, spot BTC at this market cap needs enormous capital inflows to move meaningfully. Early-stage infrastructure plays within the Bitcoin ecosystem carry a different risk profile entirely, and a different upside math.
Bitcoin Hyper ($HYPER) is positioning itself as exactly that: the first-ever Bitcoin Layer 2 with Solana Virtual Machine (SVM) integration, claiming faster transaction performance than Solana itself via extremely low-latency processing. The project targets Bitcoin’s three core structural weaknesses, slow transactions, high fees, and zero programmability, while preserving Bitcoin’s underlying security.
The presale has now raised $32 million mark at a current token price of low $0.0136, with a 36% bonus in staking rewards active for early participants. A Decentralized Canonical Bridge handles BTC transfers natively.
Traders looking to rotate while Bitcoin consolidates can research Bitcoin Hyper here.
This article is for informational purposes only and does not constitute financial advice. Cryptocurrency investments are highly volatile. Always conduct your own research before investing.
The post Bitcoin Price Prediction: Bitcoin Drops, Oil Rises, Trump Positive on Iran appeared first on Cryptonews.

SOL USD is bleeding. Solana price is at $78, down almost 6% in the day, extending a brutal 11% weekly decline that marks the steepest drop among major crypto coins, after an ugly prediction popped post Trump’s comment on Iran war.
Drift Protocol, one of Solana’s premier perpetual trading platforms, confirmed a devastating exploit today. A malicious actor gained unauthorized access through a novel attack involving durable nonces, executing a rapid takeover of Drift’s Security Council administrative powers.
— MSB Intel (@MSBIntel) April 1, 2026
 JUST IN: Drift Protocol on Solana suffers suspected $200M+ exploit, with nearly 980,000 SOL drained from the protocol according to on-chain monitoring.
Estimated losses sit at above $200 million, making this one of the largest hacks in Solana’s ecosystem since 2022. The platform confirmed the breach directly, and on-chain data has since shown accelerating outflows across the network.
Discover: The best crypto to diversify your portfolio with
Can Solana Price Recover Above $85 Despite the Bearish Prediction?
SOL is in breakdown mode. The $78 support zone is a level that has historically attracted accumulation but now risks becoming a ceiling if bulls fail to reclaim it quickly. Resistance clusters at $85, the prior week’s high, with the all-time high of $293 now a distant 73% above current levels.
Volume is elevated, with 24-hour trading volume hitting $5.2 billion, signaling panic selling. High-volume drops of this magnitude often produce violent bounces, but only after capitulation completes. Total value locked on Solana fell to $6.544 billion, with major protocols Jito (-4.3%), Raydium (-4.33%), and Sanctum (-3.83%) all posting outflows. DEX volumes have declined 40% since January. It’s just not good for Solana at the moment.
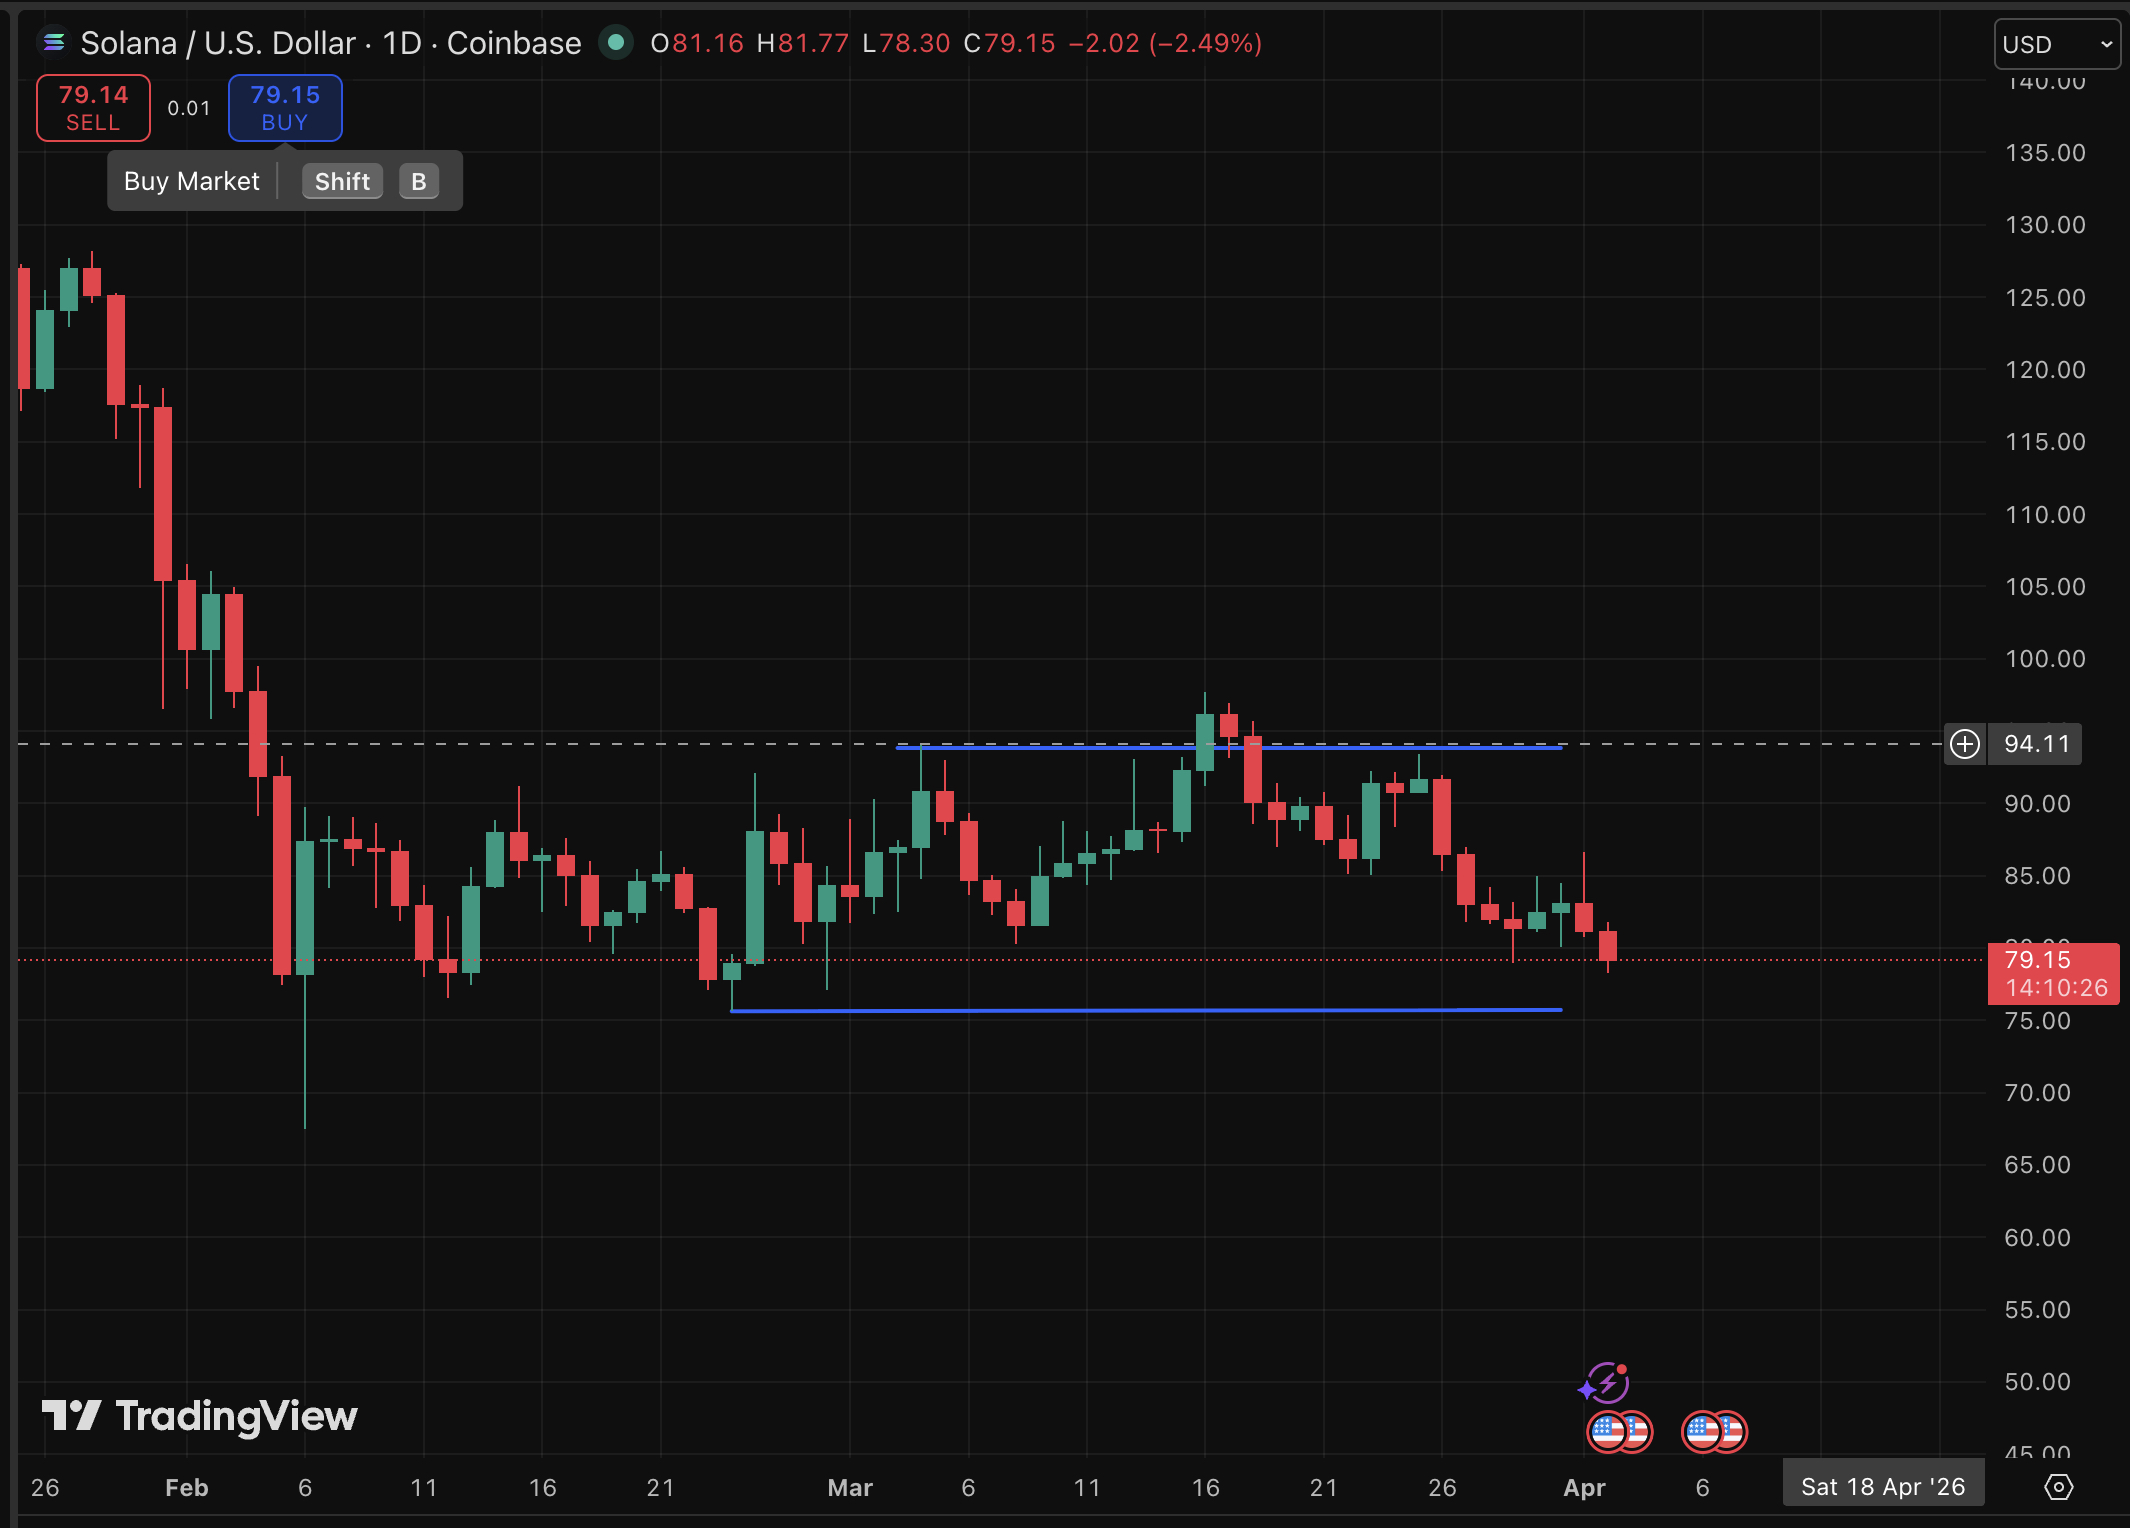
For Solana holders, the best scenario is for Bitcoin to stabilize above $65,000, Drift Protocol publishes a credible recovery plan, and SOL reclaims $85, opening a path toward $95–$100 within two weeks. But if $78 support fails on sustained volume. Next meaningful floor sits near $65, a level that would push SOL’s year-to-date loss beyond 50%.
Discover: The best pre-launch token sales
Maxi Doge Targets Early Mover Upside as Solana Tests Key Levels
When a top-10 asset drops 13% in a week, and a major DeFi platform loses $200 million overnight, the question isn’t whether confidence is shaken; it’s where rotational capital goes next. Some traders have been answering that question with early-stage presales, where entry prices sit far below any meaningful market cap pressure.
Maxi Doge ($MAXI) is one presale absorbing that interest. Built on Ethereum as an ERC-20 meme token, the project leans hard into a 240-lb canine juggernaut persona, think gym-bro culture applied to leverage trading, with the tagline “Never skip leg-day, never skip a pump.”
The mechanics underneath the meme are structured: holder-only trading competitions with leaderboard rewards, a Maxi Fund treasury allocated to liquidity and partnerships, and a dynamic staking with 66% APY bonus for committed holders.
Current presale price stands at $0.0002811, with more thasn $4,7 million raised to date.
For those prepared to research the position, the details are available at the official Maxi Doge presale page.
This article is not financial advice. Cryptocurrency investments carry significant risk. Always conduct your own research before making any investment decision.
The post Solana Price Prediction: $200M Exploit and 5.5% Drop appeared first on Cryptonews.
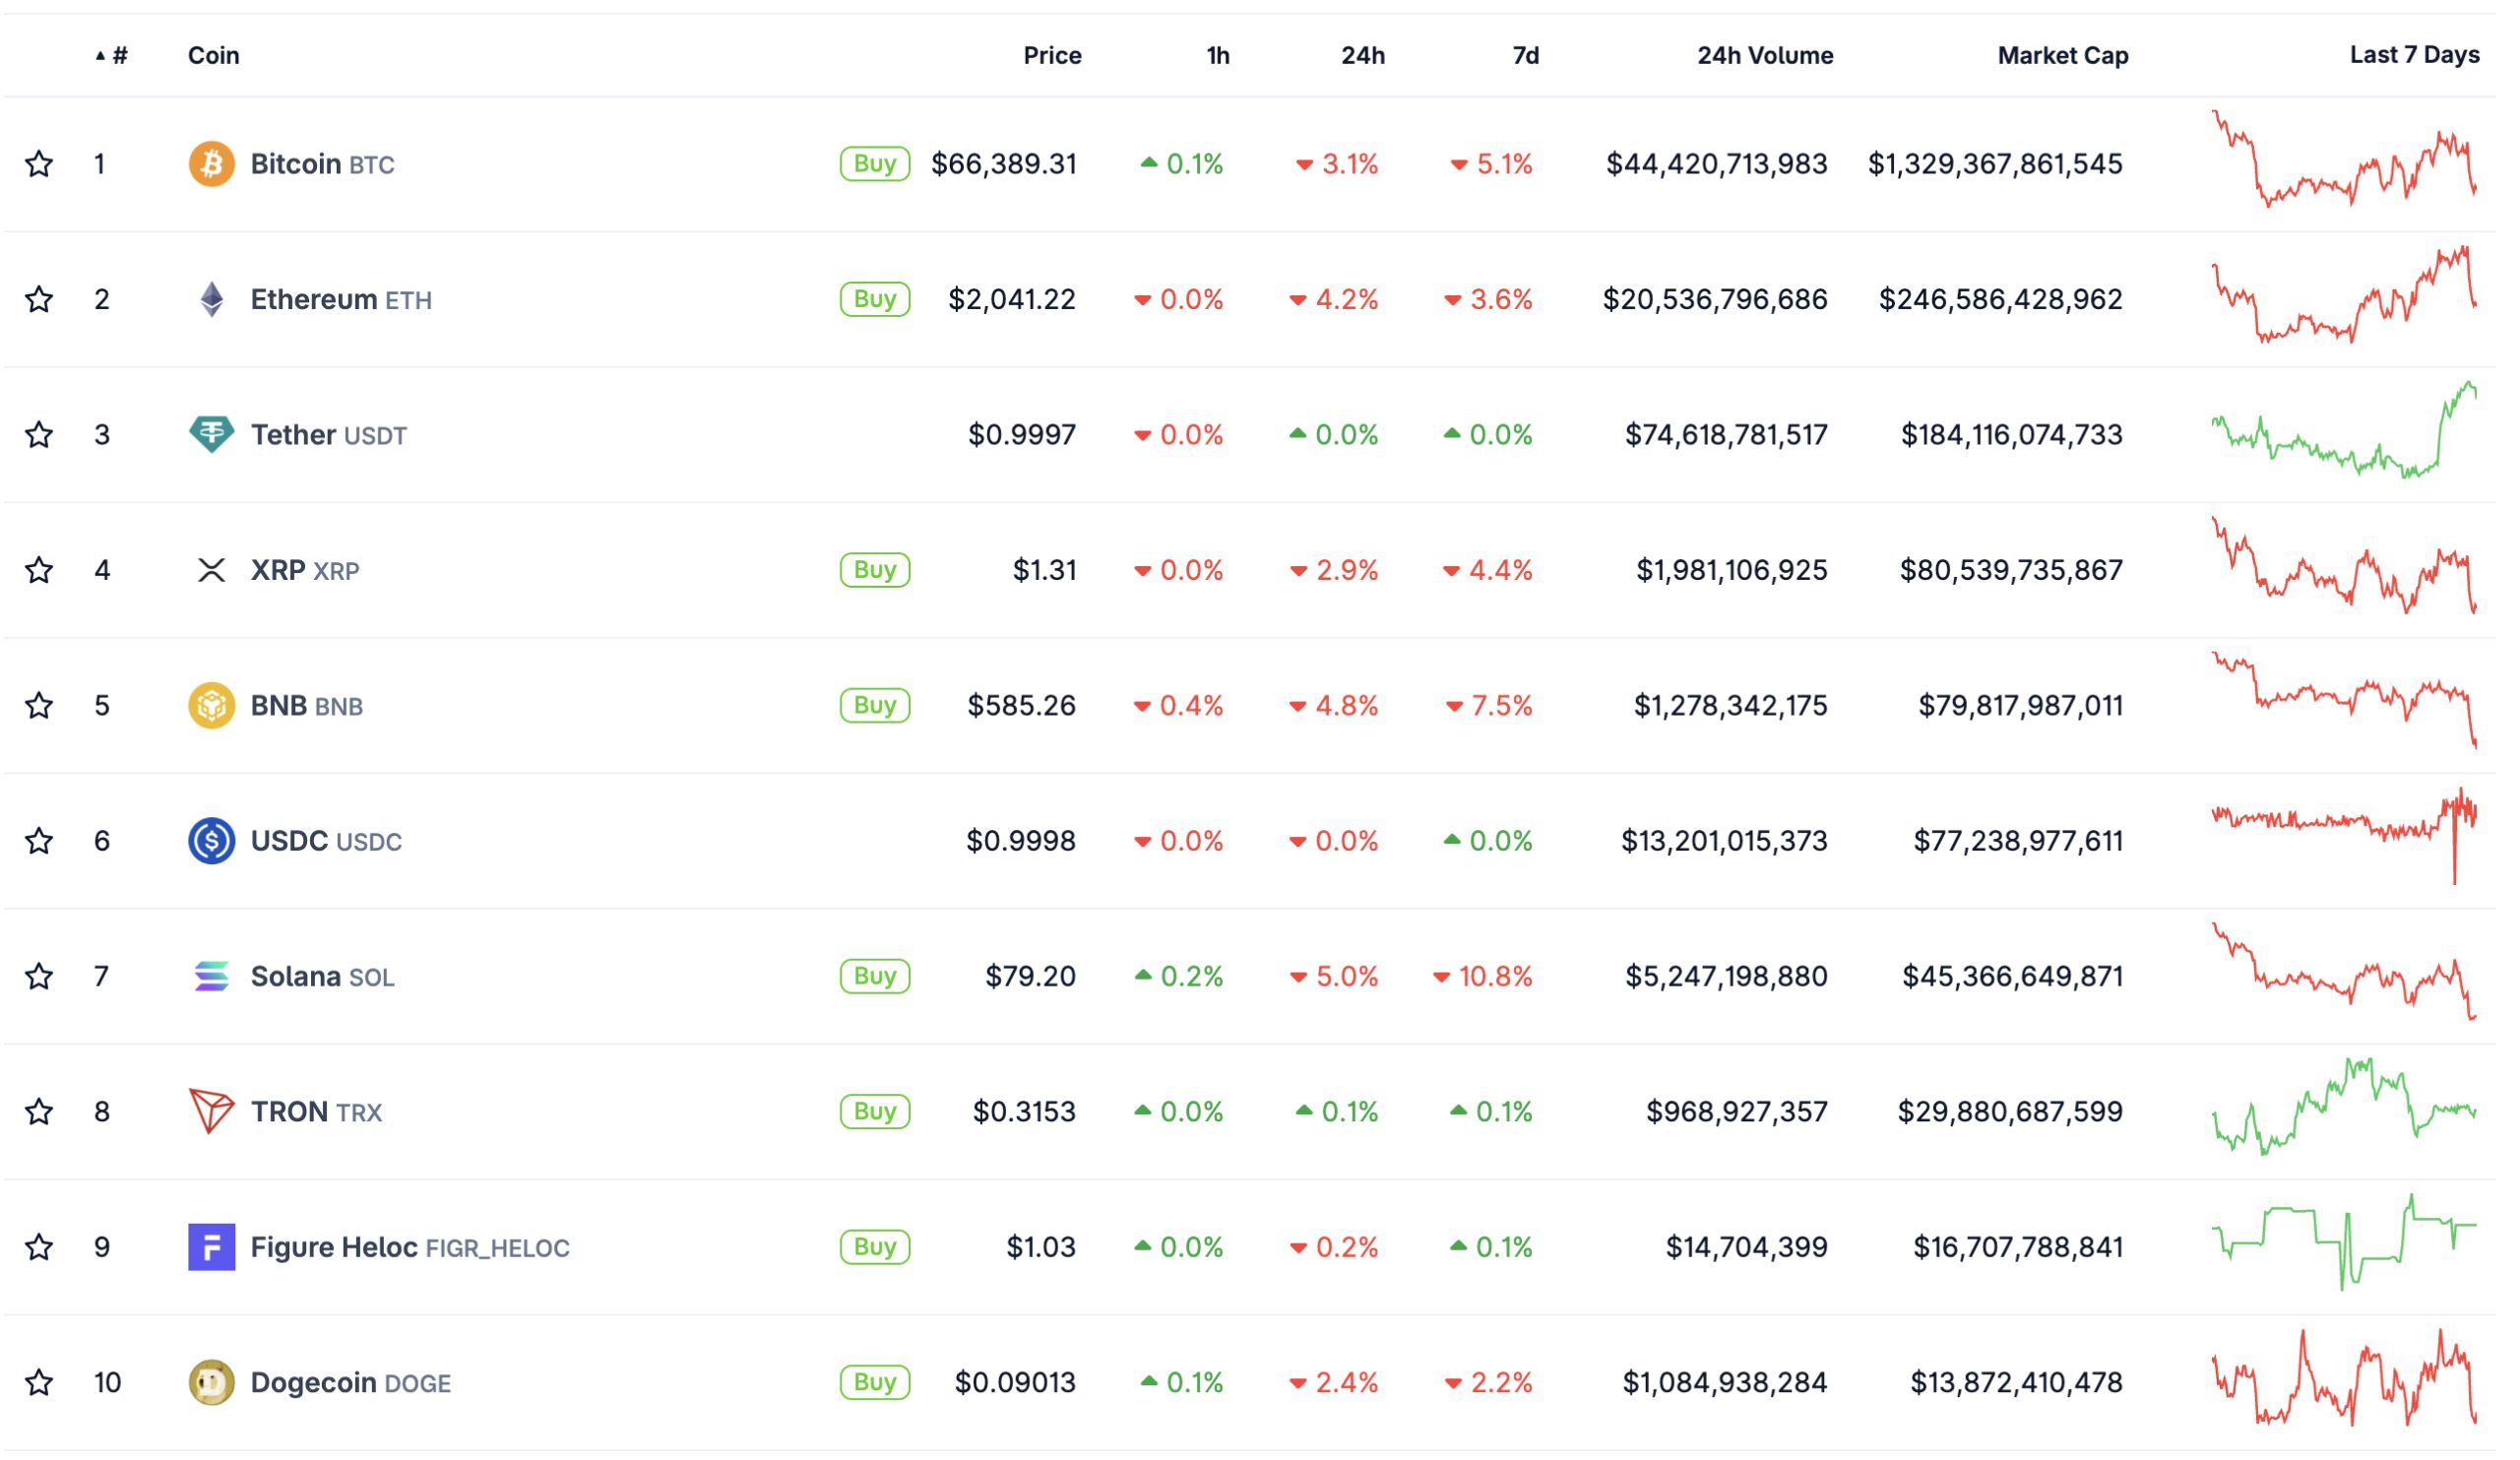
Crypto markets got gutted today. Bitcoin slid as much as 3% on the session after President Trump signaled escalating military action against Iran, crushing the fragile optimism that had briefly lifted crypto earlier this week.
Trump’s remarks reversed a short-lived rally built on hopes he might end the Iran conflict and reopen the Strait of Hormuz. Instead, investors got harder-line rhetoric. Ether cratered 4%, Solana shed almost 6%, and Brent crude surged more than 5% to above $106 a barrel. It’s a stark reminder that oil shocks move crypto these days.
“Stock and commodity markets continue to whipsaw according to Trump’s latest comments on geopolitical developments,” said Caroline Mauron, co-founder of Orbit Markets. “Bitcoin is largely following stocks’ direction, though in the past few weeks it has shown reduced sensitivity to both good and bad news.”
Bitcoin had actually been holding up relatively well, ending March up 2%, snapping a five-month losing streak, while gold dropped more than 11% over the same period amid energy-supply inflation fears.
Discover: The best pre-launch token sales
Trump Moves Crypto with War?
Today’s selloff tests whether that resilience has a floor, or whether geopolitical pressure finally cracks it. The Iran-oil nexus has rattled Bitcoin before, and the pattern is reasserting itself fast.
Bitcoin is trading near $66,500 at the time of writing, with intraday lows testing that level as selling pressure accelerated through the London morning session. The broader trend remains damaged: BTC sits roughly 45% below its October peak of $126,000, and demand metrics haven’t recovered.

According to CryptoQuant data cited in recent market analysis, apparent Bitcoin demand, the gap between demand and newly mined supply, was negative by approximately 63,000 BTC as of late March. That’s not a small number.
The CLARITY Act Senate Banking Committee markup, expected mid-April, remains the highest-impact regulatory catalyst on the horizon. If that progresses well, it could provide a sentiment floor. For now, the macro tape controls price, and crypto moves on Trump’s comments.
Discover: The best crypto to diversify your portfolio with
Bitcoin Hyper Unbothered By Geopolitics
Bitcoin Hyper ($HYPER) is positioning as the first Bitcoin Layer 2 with full Solana Virtual Machine (SVM) integration, with faster execution than Solana itself, with sub-second finality, low-cost smart contracts, and a Decentralized Canonical Bridge for seamless BTC transfers. And the best part, it doesn’t need a good geopolitical condition to be profitable.
The pitch is direct: fix Bitcoin’s three core failure modes—slow transactions, high fees, and no programmability, without sacrificing Bitcoin’s underlying security. The presale has raised $32 million at a current price of $0.0136, with staking rewards already live. The $32M milestone came alongside ETF inflows, and the presale has shown momentum through volatile conditions.
This article is for informational purposes only and does not constitute financial advice. Crypto assets are highly volatile. Always conduct your own research before investing.
The post Crypto News Today: Trump to Hit Iran Harder, Crypto Butchered appeared first on Cryptonews.


Disclosure: This article does not represent investment advice. The content and materials featured on this page are for educational purposes only.
Crypto mining shifts toward infrastructure and efficiency as Bitcoin stabilizes and institutional demand holds.
Summary
- Rising mining costs and difficulty are pushing users toward cloud mining as a simpler crypto income alternative.
- Demand grows for free mining platforms as users seek passive income without hardware or technical barriers.
- AngelBTC gains traction with transparent contracts and free hashpower rewards, offering accessible entry for beginners.
In 2026, the crypto mining landscape is no longer driven by retail speculation — it’s shaped by infrastructure, efficiency, and accessibility.
Over the past quarter, Bitcoin has remained relatively stable within a consolidation range, while global mining difficulty continues to rise. At the same time, institutional inflows into Bitcoin-related products have stayed consistent, signaling long-term confidence in the asset class.
But behind the scenes, something more important is happening:
Traditional mining is becoming less accessible.
High hardware costs, rising electricity prices, and increasing technical barriers are pushing users toward a simpler alternative — cloud mining platforms.
This is why search demand for terms like “free crypto mining platforms 2026”, “cloud mining without investment”, and “daily passive income crypto” is growing rapidly.
Below are seven platforms worth attention this year.
1. AngelBTC
AngelBTC has quickly gained traction in 2026 by focusing on one core principle: transparent mining contracts with real earning logic.
Unlike older platforms that rely on vague profit claims, AngelBTC structures its mining system around clearly defined contracts, including hashrate, duration, and expected returns.
New users can access daily sign-in rewards that provide free hashpower, making it one of the more accessible entry points for beginners.
Advantages
- Transparent contract structure (clear returns and duration)
- Daily payouts every 24 hours
- Renewable energy-backed mining (hydro, wind, geothermal)
- Low entry barrier with free hashpower system
Drawbacks
- Higher-tier contracts require capital commitment
- Not designed for users seeking ultra-short speculative gains
2. ECOS
ECOS is one of the few platforms operating within a regulated mining environment, which makes it appealing for users prioritizing compliance and stability.
It offers a free trial model, allowing users to explore mining before committing funds.
Advantages
- Regulated mining infrastructure
- Beginner-friendly interface
- Predictable long-term contracts
Drawbacks
- Limited earning potential from free tier
- Less flexible than newer platforms
3. NiceHash
NiceHash takes a different approach by acting as a hashpower marketplace instead of a traditional cloud mining provider.
Users can buy or sell computing power based on market conditions.
Advantages
- Flexible pricing model
- No fixed contracts required
- Suitable for experienced users
Drawbacks
- Complex for beginners
- Earnings depend heavily on market fluctuations
4. BitFuFu
BitFuFu is positioned closer to institutional mining services, offering structured mining products backed by large-scale infrastructure.
Advantages
- Strong infrastructure support
- Focus on Bitcoin mining efficiency
- Stable contract offerings
Drawbacks
- Limited free access options
- Higher entry barrier
5. StormGain
StormGain integrates mining with trading, making it attractive for users who want an all-in-one crypto platform.
Advantages
- Mobile-friendly experience
- Built-in mining feature
- No upfront hardware required
Drawbacks
- Mining rewards are relatively low
- Requires platform engagement to maximize earnings
6. BeMine
BeMine introduces a hybrid model where users can own fractional shares of mining equipment.
Advantages
- Hardware-backed mining exposure
- Long-term earning potential
- Transparent ownership model
Drawbacks
- Less liquidity
- Not ideal for short-term users
7. Kryptex
Kryptex remains popular among beginners who prefer mining using their own computers.
Advantages
- Easy setup
- No contract commitment
- Works with existing hardware
Drawbacks
- High electricity consumption
- Lower profitability compared to cloud mining
2026 industry shift: From hardware mining to cloud access
The biggest shift in 2026 is not about price — it’s about structure.
Mining has transitioned from GPU-based home setups to large-scale industrial operations
As a result, cloud mining platforms are becoming the dominant model.
Users are no longer asking how to build rigs—they are searching for:
- best cloud mining platforms 2026
- free bitcoin mining without investment
- passive income crypto daily payouts
This shift is also driven by:
- Rising mining difficulty
- Increased competition among miners
- Demand for predictable earnings
What users are actually searching
Understanding search intent is critical for choosing the right platform.
High-volume keywords in 2026 include:
- free crypto mining platforms
- cloud mining without investment
- legit bitcoin mining sites
- daily passive income crypto
- best cloud mining platform for beginners
Platforms that align with these queries—especially those offering free entry + transparent contracts—are capturing the majority of organic traffic.
Risks not to ignore
While cloud mining simplifies access, it does not eliminate risk.
Users should always consider:
- Market volatility affecting mining rewards
- Platform credibility and transparency
- Contract lock-in periods
- Unrealistic return promises
A good rule is that if a platform cannot clearly explain how earnings are generated, it’s not worth the risk.
FAQ: Free crypto mining platforms in 2026
Is free crypto mining really possible in 2026?
Yes—but not in the traditional sense. Most platforms now offer free access through bonuses, trials, or limited hashpower rather than unlimited mining.
Which platform is best for beginners?
Platforms with simple onboarding and free entry mechanisms, such as those offering daily rewards, are typically the easiest starting point.
How often are mining rewards paid?
Most modern platforms distribute earnings every 24 hours, depending on the contract structure.
Is cloud mining more profitable than traditional mining?
For most users, yes. It eliminates hardware costs, maintenance, and electricity expenses, making returns more predictable.
Final thoughts
Crypto mining in 2026 is no longer about technical skill—it’s about choosing the right platform.
As the industry becomes more competitive and capital-intensive, accessibility and transparency are becoming the real differentiators.
For users entering the space today, platforms that combine free entry mechanisms, structured mining contracts, and daily payouts are not just more convenient—they represent the future of mining itself.
Disclosure: This content is provided by a third party. Neither crypto.news nor the author of this article endorses any product mentioned on this page. Users should conduct their own research before taking any action related to the company.
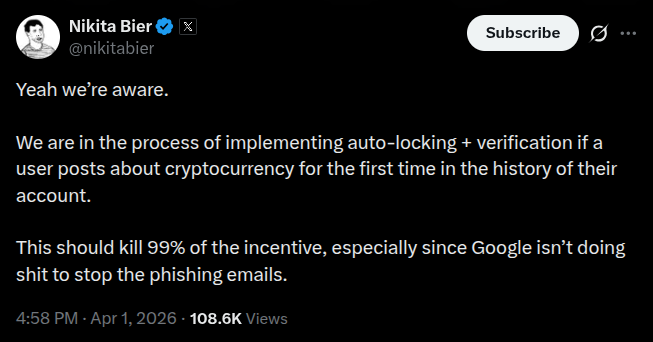
Social media platform X is considering implementing new rules for first-time user posts about crypto in an effort to crack down on scammers using phishing attacks to gain access to accounts.
Nikita Bier, the head of product at the platform formerly known as Twitter, made the announcement on Wednesday amid reports that a scammer pretending to be a veterinarian previously responsible for the health of a 193-year-old tortoise named “Jonathan” conned social media users into buying crypto before the truth was revealed.
Bier said that X could auto-lock accounts mentioning crypto for the first time and require them to go through verification. “This should kill 99% of the incentive, especially since Google isn’t doing shit to stop the phishing emails,” read his post.
A scammer pretending to be the veterinarian responsible for Jonathan reportedly posted a link to a Solana-based memecoin before the BBC and other news outlets revealed the truth on Thursday.
Data from CoinMarketCap showed the price of the Solana-based memecoin, called JONATHAN, surged by more than 6,000% amid the social media posts before sharply dropping. At the time of publication, the token was priced at $0.00007043.
Related: Alleged Huione money-laundering boss extradited to China

Crypto scammer faked death report of world’s oldest tortoise
According to the BBC report, a scammer on the social media platform X, pretended to be veterinarian Joe Hollins, posting that the tortoise had died on the British territory of Saint Helena, an island in the Atlantic. The account reportedly linked to a Solana blockchain memecoin based on Jonathan’s death.
“Jonathan the tortoise is very much alive,” said the real Hollins in a statement to The Guardian. “I believe on X the person purporting to be me is asking for crypto donations, so it’s not even an April fool joke. It’s a con.”
Many scammers have used anonymous or pseudonymous accounts on social media platforms to convince users to send crypto based on false pretenses. Although impersonating an animal like Jonathan is unusual, people have created unauthorized memecoins based on Japanese Prime Minister Sanae Takaichi, US President Donald Trump, and many other public figures.

Many hackers have used X accounts or gained access to legitimate accounts to post scams like fake memecoins or claims to “double your money.”
Our modern vision evolved from an ancient one-eyed worm creature

Puzzle 1749 Solution, Hints and Analysis for Today’s Five-Letter Word

Crypto Donations a Challenge for Canadian Election Transparency


-

 NewsBeat6 days ago
The Story hosts event on Durham’s historic registers
-

 NewsBeat9 hours ago
Steven Gerrard disagrees with Gary Neville over ‘shock’ Chelsea and Arsenal claim | Football
-

 Sports6 days ago
Sweet Sixteen Game Thread: Tide vs Michigan
-
Entertainment4 days ago
Fans slam 'heartbreaking' Barbie Dream Fest convention debacle with 'cardboard cutout' experience
-
 Entertainment5 days ago
Lana Del Rey Celebrates Her Husband’s 51st Birthday In New Post
-
Crypto World3 days ago
Dems press CFTC, ethics board on prediction-market insider trades
-

 Crypto World1 day ago
Gold Price Prediction: Worst Month in 17 Years fo Save Haven Rock
-

 Tech4 days ago
The Pixel 10a doesn’t have a camera bump, and it’s great
-

 Sports2 days ago
Tallest college basketball player ever, standing at 7-foot-9, entering transfer portal
-

 Tech3 days ago
EE TV is using AI to help you find something to watch
-

 Fashion5 days ago
Amazon Sundays: Soft Spring Layers
-

 Business4 hours ago
No Jackpot Winner and $194 Million Prize Rolls Over
-

 Business1 day ago
Login and Checkout Issues Spark Merchant Frustration
-

 Tech3 days ago
Apple will hide your email address from apps and websites, but not cops
-

 Politics3 days ago
Should Trump Be Scared Strait?
-

 Crypto World3 days ago
U.S. rule change may open trillions in 401(k) funds to crypto
-

 Tech3 days ago
How to back up your iPhone & iPad to your Mac before something goes wrong
-

 Tech3 days ago
Flipsnack and the shift toward motion-first business content with living visuals
-

 Tech4 days ago
Avatar Legends: The Fighting Game comes out in July and it looks pretty slick
-

 Tech5 days ago
Elon Musk’s last co-founder reportedly leaves xAI
You must be logged in to post a comment Login