
Crypto World
Vietnam Draft Rules Set Sights on 0.1% Tax on Crypto Transfers

Vietnam is moving to formalize how crypto transactions are taxed and regulated, signaling a push toward a tightly controlled but economically significant digital asset market. A draft circular circulated by the Ministry of Finance would impose a 0.1% personal income tax on the value of each crypto transfer executed through licensed service providers, aligning digital asset activity with the country’s securities trading framework. While transfers and trading would be VAT-exempt, the plan taxes turnover, applying the levy to investors regardless of residency. For institutions, crypto-related income would be taxed at 20% corporate rate, calculated after deducting purchase costs and related expenses. The measures also set a high bar for exchanges, including a 10 trillion dong charter capital threshold and a 49% foreign-ownership cap, reflecting a cautious approach to market infrastructure.
The draft circular, released for public consultation, also formalizes a definition of crypto assets as digital assets issued, stored or transferred using cryptographic or similar technologies. It arrives as Vietnam accelerates a broader, five-year pilot program for a regulated crypto-asset market that began in September 2025. By October 2025, officials indicated no companies had applied to participate in the pilot, underscoring barriers related to capital requirements and eligibility criteria. Separately, authorities have begun opening licensing windows for digital asset trading platforms, signaling that the regulatory framework could start to take shape in early 2026.
As the policy discussion unfolds, Vietnam’s approach appears to be balancing tax revenue opportunities with stringent oversight of who can operate and how financial flows are monitored. The Ministry of Finance’s draft circulates alongside ongoing regulatory experiments and a push to bring crypto activity into formal channels, while the broader ecosystem weighs the implications for retail investors, institutions, and technology providers. The Hanoi Times highlighted the 0.1% PIT as the centerpiece of the tax framework, noting that the tax would be levied on transfers through licensed providers and would mirror the existing stock-trading levy in form and function. The article also points to a clear distinction between value-added tax treatment and turnover taxes, a nuance that could influence how exchanges structure their operations and how tax authorities monitor cross-border activity.
Vietnam formally defines crypto assets
In what appears to be a step toward regulatory clarity, authorities described crypto assets as digital instruments that rely on cryptographic or analogous technologies to issue, store and verify transfers. This definitional move is a precursor to stricter licensing criteria and more predictable tax treatment, which in turn could attract legitimate players while screening out speculative, non-compliant activity. The proposed regime sets a higher capital bar for exchanges than many industries require for traditional banks, signaling an intent to ensure resilience and risk controls in markets that are closely linked to global capital flows.
Under the proposed rules, operators seeking to run a digital asset exchange would need substantial capital, with charter requirements set at 10 trillion dong (about $408 million at current exchange rates). Foreign ownership would be allowed but capped at 49% of an exchange’s equity, limiting influence from outside the country while still enabling international participation. Such thresholds underscore the government’s preference for domestic guardianship of critical financial infrastructure, even as it permits foreign-backed ventures to participate under strict caps and regulatory oversight.
The broader regulatory arc has been visible since Vietnam launched a five-year crypto market pilot in September 2025, a landmark shift intended to test how a regulated ecosystem could coexist with a growing domestic economy. By early October, authorities acknowledged that no companies had yet submitted applications to join the pilot, a reflection of the substantial entry hurdles and careful qualification criteria in play. This admission came alongside reports that the pilot’s scope would eventually be complemented by formal licensing for trading platforms, a move that would bring crypto activity under formal government supervision and pave the way for standardized reporting and consumer protections.
Vietnam opens licensing for crypto exchanges
In the lag time between policy signals and practical rollout, Vietnam began accepting applications for exchange licenses, marking a tangible step toward operationalizing a regulated crypto market. The State Securities Commission of Vietnam (SSC) stated that applications would be accepted starting January 20, 2026, framing the licensing process as a deliberate, multi-year effort to bring crypto activities into a formal regulatory framework. The liquidity and risk-management requirements implied by the licensing window are designed to channel legitimate market participants into a controlled environment, potentially reducing fraud and improving transparency for investors and policymakers alike.
Key takeaways
- The Ministry of Finance’s draft circular would impose a 0.1% personal income tax on the value of each crypto transfer conducted through licensed providers, aligning crypto transfers with the country’s stock-trading levy.
- Crypto transfers and trading would be exempt from value-added tax, while turnover-based taxation would apply to investors regardless of residency status.
- Institutional investors earning income from crypto transfers would face a 20% corporate income tax on profits after deducting costs and expenses.
- Exchanges would face a high capital requirement of 10 trillion dong (roughly $408 million) and foreign ownership would be limited to 49% of equity.
- A formal definition of crypto assets would anchor regulatory rules, helping separate compliant activity from informal or illicit use cases.
- The country has launched a five-year pilot for a regulated crypto market (Sept 2025) with licensing for exchanges anticipated to begin in 2026, although initial participation had not materialized by Oct 2025.
Market context: The policy comes as many jurisdictions reassess how to regulate crypto markets, balancing tax revenue with consumer protection and financial stability. Vietnam’s approach leans toward rigorous control, reflecting a global trend toward centralized oversight while still signaling potential for regulated participation by international players under strict conditions.
Why it matters
The package signals a deliberate attempt to integrate crypto activity into the formal economy, with taxes and licensing acting as primary levers to enhance oversight. For retail investors, the PIT on transfers through licensed providers creates a clear tax path that will influence trading behavior and cost considerations. Institutions face a defined tax regime and a high bar for market entry, potentially filtering participants to those willing to navigate substantial capital prerequisites and regulatory compliance obligations.
From a market infrastructure perspective, the 10 trillion dong charter capital threshold and 49% foreign-ownership cap set a high ceiling for domestic exchanges, aiming to safeguard the financial system while still inviting foreign expertise. The definitional clarity around crypto assets helps align Vietnamese rules with broader financial standards, reducing ambiguity for developers, exchanges, and custodians seeking to establish local operations. Observers will watch how this framework interacts with ongoing pilot programs and whether the regulatory appetite broadens to accommodate more players over time.
For policymakers, the balance between revenue collection, investor protection, and market growth is delicate. Vietnam’s approach suggests a patient, data-driven trajectory: tax structures that incentivize compliance, capital requirements that deter low-capital risk, and licensing that creates an auditable, auditable market foundation. If successful, the model could influence neighboring economies contemplating similar regulated pathways for digital assets, especially in a region where adoption is uneven and regulatory certainty remains a key obstacle for institutional participation.
What to watch next
- January 20, 2026: Applications open for digital asset exchange licenses, establishing a formal entry point for market participants.
- Public responses to the draft circular: Feedback from domestic and international stakeholders could shape final text and practical implementation.
- Details on how PIT and corporate tax will be administered across different crypto products and services, including calculation methodologies and reporting requirements.
- Progress of the five-year pilot: uptake, participant eligibility, and any regulatory adjustments arising from early pilot findings.
- Any updates to foreign ownership rules or capital thresholds as exchanges begin building their local presence under clarified regulatory conditions.
Sources & verification
- Draft circular on crypto taxation and licensing circulated by Vietnam’s Ministry of Finance for public consultation.
- The Hanoi Times report outlining the 0.1% personal income tax on crypto transfers through licensed providers.
- Five-year crypto market pilot launched in September 2025, with a status update stating no applicants as of October 6, 2025.
- State Securities Commission of Vietnam (SSC) statement on the licensing window for digital asset exchanges and the January 20, 2026 start date.
- Coverage of Vietnam opening licensing for crypto exchanges and related regulatory developments referenced in contemporaneous reporting.


TLDR:
- AVAX trades near $9 as price consolidates above key support within a multi-year descending triangle structure
- Strong buyer activity appears around $8–$10, with reduced volatility signaling a possible accumulation phase
- Resistance between $13 and $16 remains critical, with a breakout needed to shift short-term momentum
- A confirmed move above the descending trendline could open a path toward the $60–$80 price range
Avalanche (AVAX) is trading near a key support zone as its weekly chart shows a long-term descending triangle. Price action suggests buyers are stepping in, with consolidation forming near the lower boundary of the structure.
AVAX Holds Key Support as Buyers Step In
AVAX has remained within a broad downtrend since its 2021 peak above $130. The weekly chart shows a clear pattern of lower highs, guided by a descending resistance trendline. This structure has kept selling pressure active during each rally attempt.
According to analyst Butterfly on X, AVAX is bouncing from the lower edge of the triangle. The post added that buyers are showing interest near this support, with early signs of control shifting toward bulls.
Price is now hovering around $9.18, just above a strong support zone between $10.5 and $11. This area has been tested several times, making it a key level for market participants. Below this, the $8 to $9 range has acted as a short-term accumulation zone.
The chart also shows reduced volatility within this range. Price movement has tightened, forming a consolidation pattern. This behavior often appears when selling pressure slows and buyers begin absorbing available supply.
Volume data supports this view. Larger spikes appeared during earlier sell-offs and rebounds. More recently, volume has stabilized, with no sharp increase in selling activity. This trend suggests that the market may be entering a transition phase.
Resistance Levels Define Next Direction
While support has held, several resistance levels remain in focus. The first barrier sits between $13.5 and $16.5, where recent price rejection occurred. A move above this range could shift short-term momentum.
Beyond that, the $20.5 to $25.5 range represents a mid-level resistance zone. This area aligns with the previous price structure and could slow movement upward if reached. The descending trendline near $30 remains the most critical level.
A breakout above this trendline would change the long-term structure. It would end the pattern of lower highs and open the path for a broader recovery. Projections from the chart suggest that such a move could push the price toward the $60 to $80 range.
On the downside, a break below $8 would weaken the current setup. In that case, price could move toward the $6 to $7.5 region. This level has served as support in the past and may attract new buying interest.
For now, AVAX remains in a narrow range between $8 and $12. This zone has become a key area where both buyers and sellers are active. The longer the price stays within this band, the stronger the next move could be.
Market participants are watching closely as the structure approaches a decision point. The repeated defense of support suggests ongoing demand. At the same time, resistance levels continue to cap upward movement.
The weekly chart reflects a market in balance, with both sides waiting for confirmation. A move beyond these defined levels will likely set the next direction for AVAX.

Crypto World
Bitcoin Dips Below $75,000 as Strait of Hormuz Sees Zero Oil Tankers for First Time in History
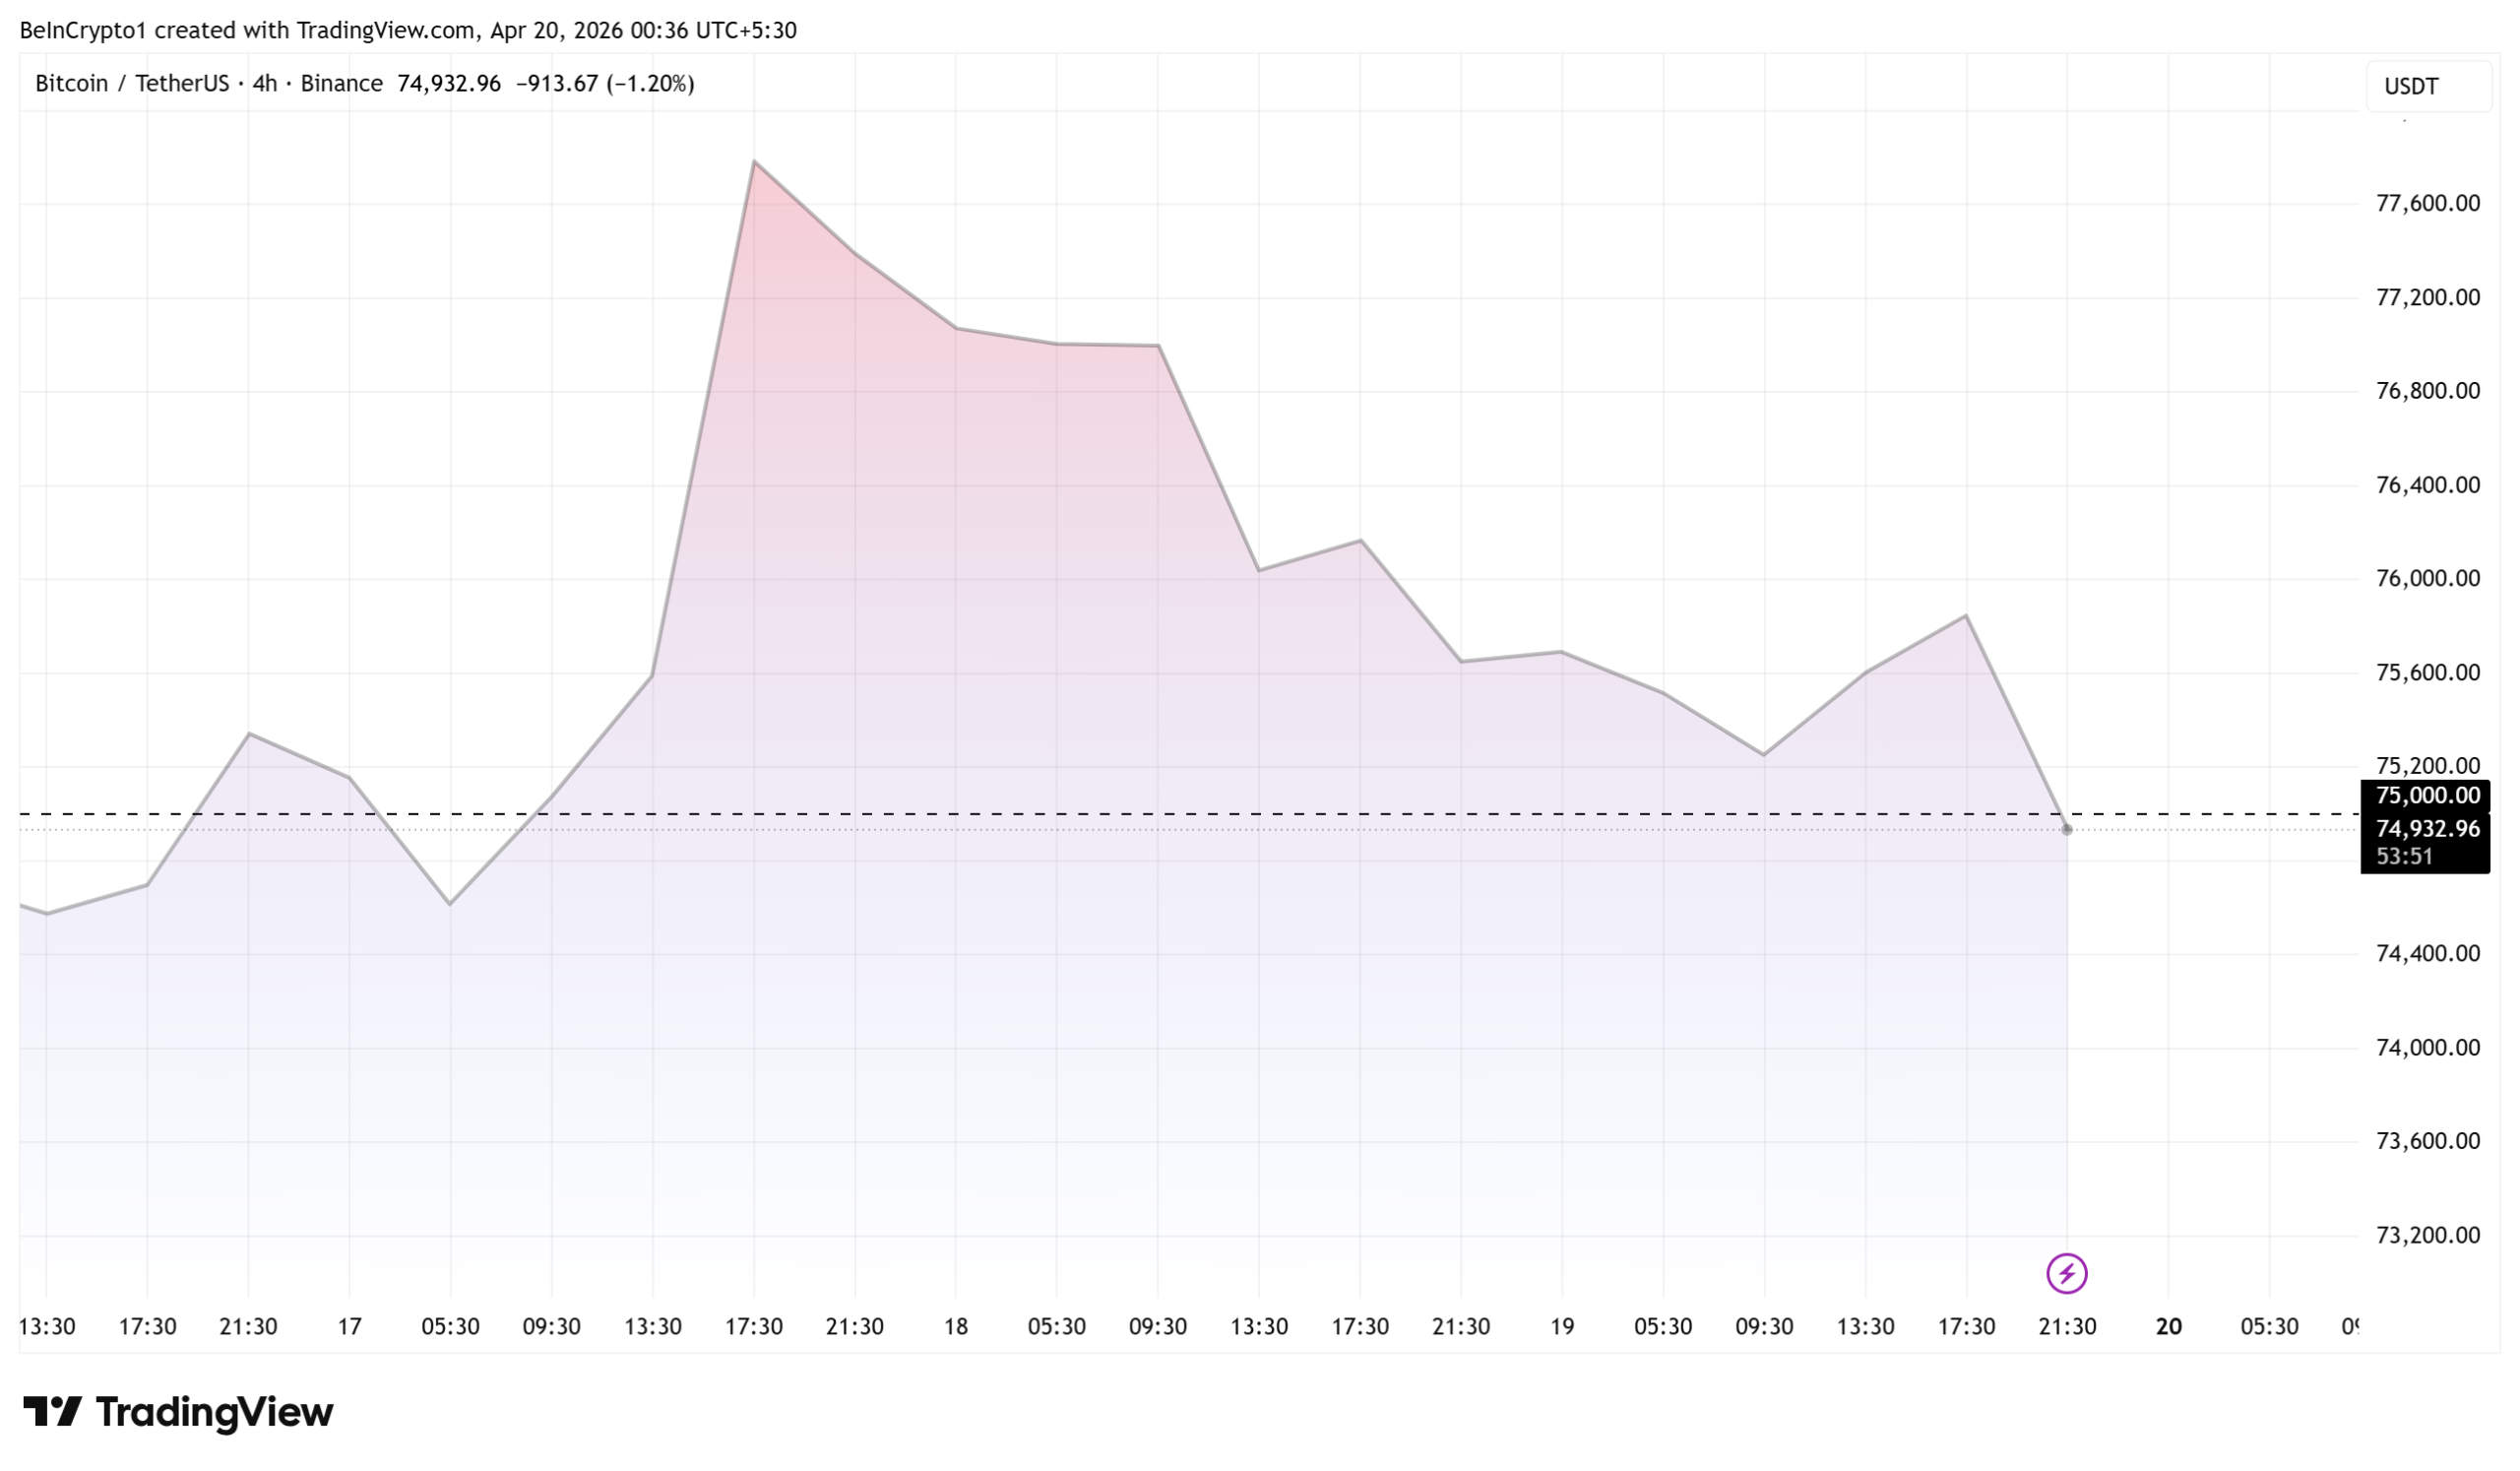
Bitcoin (BTC) dropped below $75,000 on April 19 as the Strait of Hormuz shut down entirely and Iran rejected a second round of negotiations with the United States.
The developments mark a sharp escalation in the US-Iran standoff, with zero oil tankers passing through the strait and diplomatic channels appearing to collapse.
Strait of Hormuz Shuts Down as Diplomacy Stalls
No oil tankers passed through the Strait of Hormuz, effectively closing the waterway that handles roughly 20% of global seaborne oil trade.
“It appears that the Strait of Hormuz is now completely closed for the first time in history. The US “blockade” and Iran’s closure are in full force,” wrote The Kobeissi Letter.
Reportedly, thirteen tankers had already turned back mid-route the day before, freezing shipping flows through the critical chokepoint.
Iran’s state media confirmed that Tehran rejected participating in a second round of talks with Washington. Iranian officials cited what they called “deception” from President Trump, pointing to “inconsistency with what is actually happening” during negotiations.
The rejection came after the first round of talks in Islamabad ended without an agreement last week.
Trump Escalates Threats Against Iran
President Trump accused Iran of firing on ships in the strait in violation of the ceasefire agreement. He threatened to “knock out every single Power Plant, and every single Bridge, in Iran” if Tehran refuses a deal.
General sentiment is that both countries are on the verge of a new round of escalation, with futures markets set to open within hours.
Bitcoin has faced sustained pressure from the US-Iran conflict since February 28. The pioneer crypto previously fell from above $100,000 when Iran first moved to close the strait earlier this year. Amid Sunday’s risk-off sentiment, the king of crypto fell below $75,000 for yet another time.

Rising oil prices and inflation fears have repeatedly pushed investors toward traditional safe-haven assets over crypto.
The coming hours may prove critical as futures markets open and traders price in the diplomatic breakdown.
The post Bitcoin Dips Below $75,000 as Strait of Hormuz Sees Zero Oil Tankers for First Time in History appeared first on BeInCrypto.
TLDR:
- Solana’s monthly chart shows a cup-and-handle pattern forming after a long recovery from 2023 lows.
- Price remains inside a descending channel, with $70–$80 support acting as a key short-term level.
- Resistance between $240–$280 marks the breakout zone needed to confirm the bullish continuation pattern.
- A breakdown below $70 may weaken the structure, while holding support keeps the consolidation phase active.
Solana’s monthly price structure is drawing attention as it continues to form a classic cup-and-handle pattern. The asset remains within a consolidation phase, with price currently moving inside the handle range after a strong recovery from earlier lows.
Long-Term Structure Shows Gradual Recovery
Solana’s macro chart reflects a rounded bottom that formed between 2021 and 2024. Price peaked near $240–$260 in 2021 before entering a prolonged decline. It later found support near $10–$12 in early 2023, marking the cycle low.
Bitcoinsensus describes this structure as a developing cup-and-handle pattern on the monthly timeframe.
The post notes that the recovery from the 2023 lows formed a rounded base, which is often linked to steady accumulation rather than rapid speculation.
From that bottom, price climbed steadily toward the previous highs, completing the cup formation. This move established a broader bullish structure, supported by higher highs during the recovery phase. The return to the $240–$260 range defined the upper boundary of the cup.
Since reaching that zone, the price has not broken out. Instead, it has entered a controlled pullback. This phase forms the handle portion of the structure, which typically follows a rounded recovery.
The handle appears as a downward-sloping channel. Current price action remains within this range, with resistance near $180–$200 and support around $70–$80. At the time of observation, the price traded near $89.97, closer to the lower boundary.
Consolidation Phase Keeps Market in Balance
The handle structure reflects short-term pressure, although the broader trend remains intact. This phase often involves reduced volatility compared to the earlier recovery. Price movement within this channel suggests a pause rather than a confirmed reversal.
Key resistance levels remain clearly defined. The descending channel top sits near $170–$200, acting as immediate resistance. Beyond that, the $240–$280 range marks the major breakout zone tied to the cup formation.
On the downside, the $70–$80 region serves as critical support. A breakdown below this level could shift market structure. In such a case, the price may move toward $60 or lower, weakening the current pattern.
The broader structure remains intact as long as support holds. The cup-and-handle pattern traditionally requires a breakout above the rim for confirmation. In this case, that level lies near $240–$280.
If price moves above this zone with strong momentum, the pattern projects a larger upside range. The depth of the cup suggests a possible extension toward $450–$550. However, such movement depends on sustained strength and a confirmed breakout.
For now, the price continues to move within the handle. This keeps the market in a neutral position, with both upward and downward scenarios still open.
A hold above support may allow a move toward channel resistance. A break below support could delay further recovery.
The current phase remains focused on consolidation. Market participants continue to watch the $70–$80 support and the descending resistance line for direction. Movement beyond these levels will likely define the next stage of the trend.
TLDR:
- Money market funds recorded a $172.2B weekly outflow, the largest ever, far exceeding typical April withdrawal trends.
- Equity funds attracted $11.3B while bond funds saw $7.9B inflows, showing a shift toward diversified allocations.
- Crypto and gold funds each gained $1.2B, reflecting steady demand for alternative assets during capital rotation.
- Seasonal tax payments and portfolio adjustments drove withdrawals, pushing the four-week average to early 2024 levels.
Money market funds recorded a historic weekly outflow as capital rotated across asset classes. Recent data shows a sharp withdrawal trend, with funds moving into equities, bonds, and alternative assets during a period that often aligns with seasonal tax payments.
Record Outflows Reshape Short-Term Liquidity Trends
Money market funds saw a weekly outflow of $172.2 billion, marking the largest drawdown ever recorded. The scale of withdrawals exceeded typical April averages, reflecting an unusual shift in short-term liquidity positioning.
According to a post shared by The Kobeissi Letter on X, the weekly outflow was over 320% above the average April movement seen in recent years.
The data also showed that the four-week moving average dropped to negative $30.0 billion, reaching levels last seen in early 2024.
This change in flow patterns coincided with capital moving into other financial instruments. Equity funds attracted $11.3 billion, while bond funds recorded inflows of $7.9 billion during the same period. These figures suggest that investors adjusted allocations rather than exiting markets entirely.
At the same time, alternative assets saw moderate interest. Gold and crypto-related funds each received $1.2 billion in inflows. While smaller in size compared to equities and bonds, these inflows indicate continued diversification across asset classes.
April often brings seasonal liquidity changes due to tax obligations. As a result, part of the outflow from money market funds was linked to tax-related withdrawals. This pattern tends to repeat annually, although the magnitude this time stands out.
Capital Rotation Signals Broader Allocation Shifts
The movement of funds into equities and bonds points to a broader reallocation strategy. Investors appear to be balancing short-term liquidity needs with longer-term positioning across markets.
Equity inflows suggest a willingness to maintain exposure to risk assets despite recent volatility. Meanwhile, bond inflows indicate continued interest in fixed-income securities, often used for stability during uncertain conditions.
The inflows into gold and crypto funds, although smaller, add another layer to the overall picture. These assets are often viewed as alternative stores of value, especially during periods of shifting liquidity trends.
The decline in the four-week moving average of withdrawals also provides context. It shows that while the weekly outflow was large, the broader trend reflects sustained but less extreme withdrawals over time.
Taken together, the data show that capital is not leaving the financial system but moving between asset classes. Seasonal factors, combined with changing market preferences, continue to shape these flows.
As April progresses, similar patterns may continue, especially if tax-related withdrawals remain active. However, the redistribution of funds suggests ongoing engagement across multiple markets rather than a retreat from risk.
TLDR:
- Institutional Bitcoin buying continues across cycles, with cost basis rising steadily toward the $75K range
- Large purchase clusters at higher prices reflect increased capital deployment during bullish momentum phases
- The $75K level aligns with average cost, making it a key support zone for current market positioning
- Bitcoin price near cost basis signals a decision point as market direction remains uncertain in the short term
Bitcoin accumulation trends tied to large institutional buyers continue to draw market attention as price action tests key levels.
A recent dataset shared publicly outlines long-term purchasing behavior, cost basis movement, and evolving strategy across multiple market cycles up to April 19, 2026.
Institutional Accumulation Strategy Expands Across Market Cycles
A post by Michael Saylor introduced the chart with a brief statement urging larger thinking. The shared data tracks a “Strategy Tracker,” presenting Bitcoin purchases over time alongside price movement and average cost trends.
The dataset shows total holdings of 780,897 BTC valued at $59.10 billion. The average acquisition cost stands at $75,577 per Bitcoin.
Meanwhile, cumulative tracked purchases reach 8,780,897 BTC across 106 events, reflecting long-term accumulation behavior.
Early accumulation occurred when Bitcoin traded between $10,000 and $40,000. During this period, purchases remained consistent but relatively small.
As a result, the average cost line moved gradually upward, showing controlled exposure during lower price levels.
As prices declined toward the $20,000 to $30,000 range, buying activity continued. This phase reflects steady accumulation during market weakness. The average cost stabilized before rising again, indicating continued capital deployment without hesitation.
Later, Bitcoin entered a strong upward move, climbing beyond $100,000. During this phase, purchase sizes increased, and buying frequency rose. The average cost also climbed sharply, signaling a shift toward momentum-driven accumulation.
Price Levels and Cost Basis Shape Market Positioning
The chart outlines key price zones that now frame market structure. The $75,000 to $80,000 range aligns closely with the average acquisition cost. This level now serves as a central support zone tied to institutional positioning.
Below that, the $60,000 to $65,000 range marks a previous consolidation area. This zone acted as a base before the breakout that pushed prices higher. These levels remain relevant for traders assessing downside scenarios.
On the upside, $100,000 continues to act as a psychological barrier. The price has tested this level multiple times. Above that, the $120,000 to $130,000 range represents the recent peak and a clear resistance zone.
The relationship between price and average cost remains central to the current setup. When Bitcoin trades above the cost basis, positions remain in profit. When price approaches this level, it becomes a decision point for market participants.
Recent data shows Bitcoin hovering near this cost level. This places the market in a narrow range where direction remains uncertain. At the same time, continued buying during both rallies and pullbacks reflects a steady approach.
Purchase markers on the chart also show larger allocations at higher price levels. This pattern suggests increasing capital commitment over time. It also reflects a willingness to accumulate regardless of short-term price fluctuations.
The absence of selling activity across the timeline reinforces a long-term positioning strategy. Rather than reacting to price swings, the approach remains focused on building exposure across cycles.
Future price movement now depends on how Bitcoin behaves around the $75,000 level. Holding above this range may support another move toward $100,000 and beyond. However, a breakdown below this level could shift short-term market direction toward lower support zones.
The chart presents a structured view of accumulation, cost growth, and price interaction. It captures how institutional participation has evolved alongside Bitcoin’s expanding market cycle.
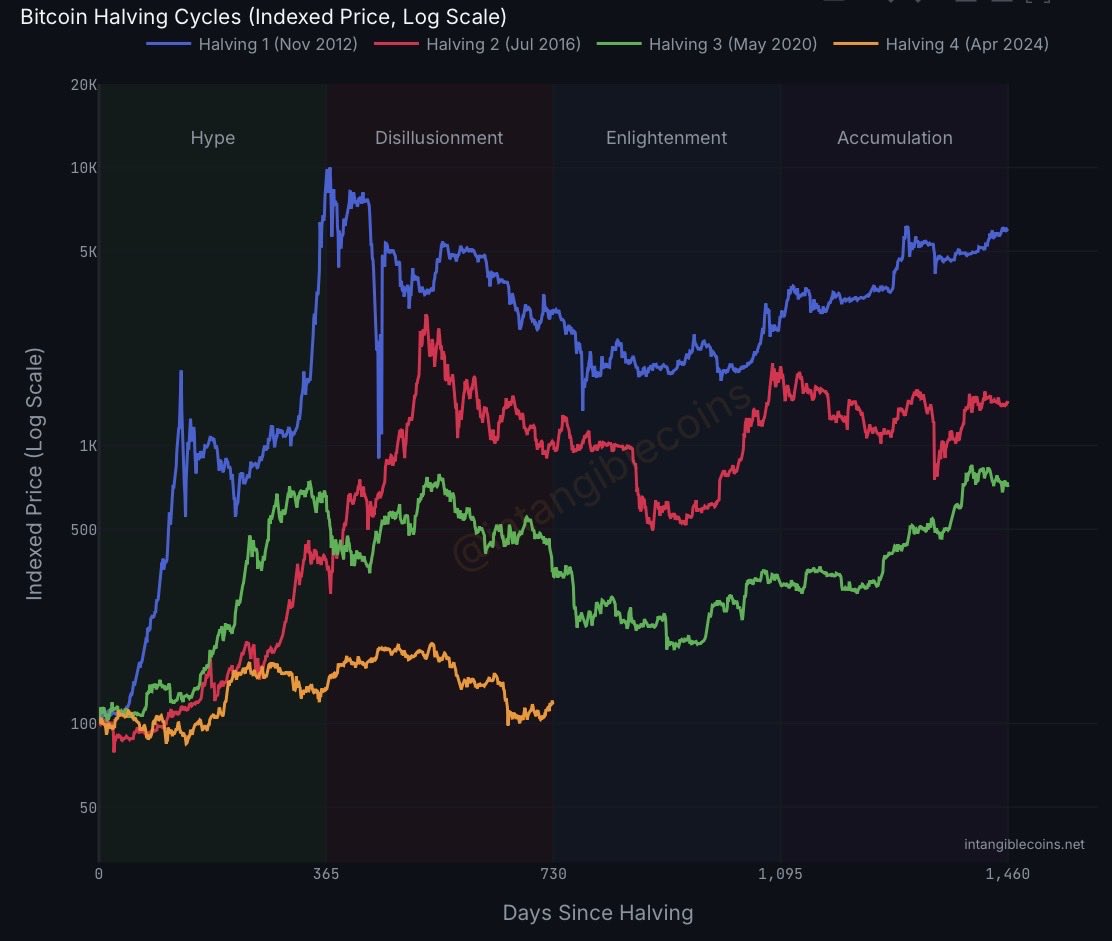
The current Bitcoin (BTC) market cycle is “dramatically” weaker than the three previous cycles, according to Alex Thorn, the head of firmwide research at investment firm Galaxy.
Thorn compared price action since the April 2024 Bitcoin halving to cycles triggered in 2012, 2016 and 2020; the current cycle shows significantly dampened volatility and lower upside. The all-time high above $125,000 on Oct. 5, 2025 was only 97% above the 2024 halving price around $63,000.
BTC’s price increased by about 9,294% during the 2012 halving cycle, reaching a high of about $1,163, and climbed by about 2,950% during the 2016 halving cycle, reaching a high of about $19,891. The 2020 halving saw a price increase of about 761%.

“Cycle four is dramatically underperforming prior cycles,” Thorn said in an X post, asking, “Is this the new normal, or is it the new normal until it isn’t?”
The decreasing volatility in each successive BTC halving cycle suggests that traditional market dynamics are changing and that BTC’s price may start to be influenced more by other factors, rather than the halving or the four-year cycle market theory.
The 30-day Bitcoin Volatility Index, which spiked to 9.64% on April 2, 2020, has not been above 3.11% in the current cycle, a reading last tipped on Aug. 24, 2024. At last look, the latest 30-day estimate for that volatility gauge is 1.75%, according to Bitbo data.
Related: Bitcoin bull run ‘still too early’ to call as demand lags exiting capital: Analyst
Critics say current cycle performance ignores the premature all-time high before 2024’s halving
BTC reached what was then the all-time high above the $70,000 level in March 2024 — one month before the April 2024 halving.
The approval of spot Bitcoin exchange-traded funds (ETFs) in the United States in January 2024 was the primary catalyst for the price pump.

This historic anomaly of BTC hitting a new all-time high before the halving skewed the current cycle’s price performance, critics of Thorn’s analysis said.
Bitcoin drawdowns have also become less severe, as volatility has declined, according to Fidelity Digital Assets.
Previous Bitcoin bear markets have seen declines between 80% and 90%, according to Zack Wainwright, a Fidelity Digital Assets research analyst.
However, Bitcoin’s crash to $60,000 from the all-time high above $125,000 represents a decline just north of 50%, Fidelity’s analysis noted.
In March, Jan van Eck, CEO of asset management company VanEck, said that BTC is close to bottoming out and that he expects the price to begin gradually rising again in 2026.
At last look, the biggest crypto was trading at about $74,703, up almost 5% in the last seven days, according to TradingView data.
Magazine: Bitcoin will not hit $1M by 2030, says veteran trader Peter Brandt


Attacker minted unbacked rsETH through Kelp’s LayerZero bridge, then borrowed WETH on Aave V3 and V4 before markets could freeze.
In 46 minutes on Saturday evening, DeFi lost more money than it had in any single event this year, and left Aave to face its biggest challenge yet. The mechanics took roughly one transaction.
At 17:35 UTC on April 18, an attacker sent a crafted message to Kelp DAO’s LayerZero-powered cross-chain bridge. The bridge accepted it as legitimate and released 116,500 rsETH, worth about $293 million and roughly 18% of the token’s entire circulating supply, to a wallet that had been funded through Tornado Cash ten hours earlier. No ETH ever changed hands on the other side, which means rsETH was effectively spun out of thin air.
The attacker did not try to sell it. They deposited it into Aave V3 as collateral and borrowed real wrapped ether against it, then repeated the trick on Aave V4. By the time Kelp’s emergency multisig froze the protocol’s core contracts 46 minutes later, the WETH was gone.
Two follow-up attempts at 18:26 and 18:28 UTC, each trying to drain another 40,000 rsETH, reverted into the pause, but the first hit was already reverberating across DeFi.
Twenty-four hours later, Aave is carrying between $177 million and $236 million in bad debt, its TVL has dropped by roughly $6 billion, according to DeFiLlama, its WETH market is pinned at 100% utilization, and the AAVE token is down more than 18%.
SparkLend, Fluid, and Upshift have all paused or frozen rsETH. rsETH on more than 20 chains is of uncertain backing. Ethereum itself has barely moved.
It is now, by size, the largest DeFi exploit of 2026.
How it happened
rsETH is Kelp’s liquid restaking token. Every rsETH is supposed to represent a real claim on ETH deposited into Kelp and restaked across EigenLayer operators. That one-to-roughly-one relationship is why some money markets have been willing to treat rsETH as ETH-correlated collateral.
rsETH lives on more than 20 networks and moves between them through a LayerZero messaging layer. When a user locks rsETH on one chain, the bridge on the destination chain is supposed to mint or release an equivalent amount only after it verifies a valid message from the source.
The attacker found a way to make that verification accept a message that corresponded to no real deposit, so that 116,500 rsETH were released without the corresponding ETH being locked anywhere. Kelp’s vault reserves did not move, but its liability, denominated in rsETH, grew by 18%.
How Aave became the exit door
This is where the story gets uncomfortable for Aave.
Kelp’s bridge is the proximate cause of the mint. But the reason this turned into $200 million of hard damage rather than a localized, recoverable incident is that Aave had, by design, made rsETH one of the most capital-efficient collateral types in DeFi.
Supply caps were large enough to accommodate an entire $292M deposit. Borrow caps on WETH were sized such that a single attacker could withdraw well over $200M of real ether in a handful of transactions. Liquidation thresholds assumed rsETH would trade at or near peg.
The listing reviews and parameter tuning by Chaos Labs, Block Analitica, and LlamaRisk treated rsETH as what it had been in practice: a conservatively collateralized liquid re-staking token (LRT) with a boring price history.
That’s why the attacker was able to use a single forged message on a bridge to drain real assets out of the largest lender in DeFi.
Billions of WETH left Aave
After the attacker borrowed WETH against unbacked rsETH, WETH suppliers started to withdraw their own funds, likely on speculation that first-movers would be made whole while last-movers would eat the residual loss. By Sunday morning, $5.4 billion of ETH and WETH had left Aave.
WETH pool utilization hit 100%, which means WETH depositors can no longer withdraw.
The borrow positions are effectively unliquidatable. The collateral cannot be redeemed at Kelp and will not trade near peg once the scale of unbacked supply is fully digested. No profitable liquidation path exists.
Aave Labs said on X that Aave’s contracts were not compromised. But “no bug” doesn’t necessarily mean “no problem.”
Aave’s Umbrella insurance fund holds about $50 million. Aave-specific bad debt is roughly $196 million concentrated in the rsETH / WETH pair on Ethereum. The gap is where the next few weeks of governance will happen.
The waterfall, in order: aWETH Umbrella stakers absorb the first slice via automatic slashing; WETH suppliers take a pro-rata haircut on their deposits; stkAAVE holders are next if governance activates a deeper slash; and the DAO treasury could fund a repayment proposal.
Aave’s Guardian froze rsETH and wrsETH across every deployment. Aave V4’s Security Council disabled supply and borrow on both the Core Hub and the Kelp E-Spoke. A Risk Stewards proposal to reduce the WETH Slope1 is already live, aimed at pulling new supply back in.
Contagion spreads
SparkLend, Fluid, and Upshift froze rsETH within hours. The exception is Morpho: CEO Paul Frambot said exposure is about $1 million across two isolated markets, with other vaults entirely unaffected. Morpho’s architecture isolates each market so bad debt in one pair cannot propagate.
rsETH itself now has a backing problem across 20-plus chains until Kelp publishes a clean reconciliation of reserves against outstanding supply. Any protocol that accepts wrsETH as collateral is exposed until that accounting is public.
LayerZero’s messaging layer will also take scrutiny as the path manipulated in Kelp’s bridge is not unique to Kelp.
Kelp follows the $285 million Drift hack on April 1, the $80M Resolv Labs exploit in March, and a string of infrastructure-level compromises. Cumulative DeFi losses for 2026 are between $450 and $482 million across roughly 45 protocols.

As readers of this newsletter may be aware, Congress has spent the past few months debating market structure legislation, but crypto policy discussions encompass so many more issues than just the one: taxes, decentralized finance regulations, the midterm election, states and so much more. CoinDesk’s Consensus Miami conference next month is going to examine each of these issues in depth.
You’re reading State of Crypto, a CoinDesk newsletter looking at the intersection of cryptocurrency and government. Click here to sign up for future editions.
This newsletter has noted in the past how significant policy changes around digital assets have become. Last year saw U.S. President Donald Trump sign the first significant crypto-specific piece of legislation. Regulators have completely changed their approach to enforcement actions. Congress has spent the past few months debating not the broad contours of what a market structure bill could look like nor whether we’ll even have a bill, but the finer details of issues like the treatment of stablecoin yield.
In other words: Crypto’s made it.
This was true last year, to be fair. The crypto industry, fresh off of its electoral wins in 2024, took a victory lap as bitcoin’s price soared to over $120,000 and legislation seemed imminent. Things have soured a little bit this year; crypto prices have been largely stagnant amid broader economic stresses and time is running out for Congress to pass market structure legislation in its current form. It’s not all bad news: regulators have begun proposing rules for stablecoin companies based on last year’s GENIUS Act, lawmakers are seriously considering reforms to U.S. crypto tax policy and it really does seem that this industry has cemented itself to the point where it cannot be dismissed.
So what’s next? The industry’s still seeking tax reform, with a de minimis exemption for crypto transactions, hoping the market structure bill will become law without overly burdening the industry and — of course — looking ahead to November, when the U.S. will pick the next Congress.
We’ll be picking up these threads next month at Consensus Miami, our annual shindig bringing together basically everyone.
You’ll hear from leading lawmakers like Senators Kirsten Gillibrand and Ashley Moody, regulators like CFTC Chairman Mike Selig and the White House point man on crypto Patrick Witt, and Congressional staffers across the three-day conference. Congressman Steven Horsford (D-Nev.), who recently introduced a new version of the Parity Act to address crypto taxations, will participate in a discussion about the bill. We’ll also host a meetup for folks interested in chatting about the election or just generally about the policy landscape.
And we are bringing back the Policy & Regulation Summit: an entire day, and an entire stage, dedicated to exploring key policy and regulatory issues in-depth.
The policy summit is designed to explore some of the biggest questions lawmakers, regulators, compliance officers and/or builders have to answer right now, including whether or how decentralized finance can comply with anti-money laundering rules, how to deal with taxes in the new 1099-DA era, what the deal is with the Clarity Act and how states are approaching this sector.
We’ll have an entire series of sessions focused on the 2026 midterm election, including how the crypto industry is engaging with the election and what we can expect next year when the new Congress takes over.
Along the way, we’ll hear from folks deeply embedded in the policymaking process, such as SEC Crypto Task Force chief Taylor Lindman, former IRS officials Seth Wilks and Raj Mukherjee and the National Futures Association’s Lucy Hynes, among so many others.
We’re going to close the Policy Summit — and all of Consensus really — with a debate on one of the biggest topics in the country right now: prediction markets. Are they just gambling? Or are prediction markets a novel financial instrument? And who should regulate these products?
These questions are likely to wind up before the U.S. Supreme Court, but we’re going to preview the arguments for you on May 7. Come on through (discount code in the link) and say hi.
Tuesday
- 14:00 UTC (10:00 a.m. ET) The Senate Banking Committee will hold the nomination hearing for Kevin Warsh, Donald Trump’s pick to helm the Federal Reserve.
If you’ve got thoughts or questions on what I should discuss next week or any other feedback you’d like to share, feel free to email me at nik@coindesk.com or find me on Bluesky @nikhileshde.bsky.social.
You can also join the group conversation on Telegram.
See ya’ll next week!
TLDR:
- XRP ETFs saw $55.39M inflows, reflecting steady demand but not strong institutional conviction yet.
- Price action shows rejection near $1.445, reinforcing a strong resistance zone in the short term.
- Long liquidations dominate recent data, signaling pressure on bullish traders and weak momentum.
- Sustained ETF inflows and a breakout above resistance are needed to confirm a stronger trend.
XRP exchange-traded funds recorded $55.39 million in net inflows last week, marking their strongest weekly performance this year.
The figure signals improving investor interest, although broader data shows a measured pace rather than an aggressive shift in institutional positioning.
ETF Inflows Show Measured Demand Growth
Sosovalue data points to a steady but controlled rise in capital entering XRP-linked investment products. Weekly inflows of $55.39 million represent roughly five percent of the estimated $1 billion in total assets under management across these funds. This level reflects moderate participation rather than rapid accumulation.
A tweet from Whale Insider reported the weekly inflow figure while framing it as the strongest performance of 2026. The post drew attention to XRP ETFs offered by firms such as Bitwise and Grayscale, alongside futures-based products from ProShares and Teucrium.
The composition of these inflows remains a key factor in assessing market direction. Spot-based ETFs often indicate longer-term positioning, while futures-based funds can reflect short-term strategies or hedging activity. Therefore, without a clear breakdown, the inflow figure alone does not define investor intent.
Consistency in fund flows remains an important measure. A single week of stronger inflows does not establish a sustained trend. Market participants continue to watch whether similar levels persist across multiple weeks, especially in spot-focused products.
XRP Price Action Reflects Short-Term Pressure
At the time of observation, XRP traded at $1.4238, posting a daily decline of 0.81 percent. Intraday movement ranged between $1.415 and $1.445, showing a narrow but active trading band. The session opened with sideways movement, indicating limited conviction among traders.
Midday trading introduced sharper selling pressure, pushing the price toward the $1.415 level. This zone marked the lowest point of the day and attracted renewed attention as a short-term support area. The move suggested liquidation activity or a shift in short-term sentiment.
Later in the session, XRP rebounded toward $1.445 but failed to maintain upward momentum. The rejection near this level reinforced it as a resistance zone. Price action then returned closer to $1.42, reflecting continued hesitation among buyers.
Short-term performance metrics remain slightly negative, with losses across both four-hour and daily timeframes. Meanwhile, the seven-day performance shows a gain of nearly five percent, indicating a partial recovery phase. However, longer-term data continues to reflect a broader downward trend.
Liquidation data adds further context to recent movements. Over the past 24 hours, long positions accounted for the majority of liquidations, exceeding short liquidations by a wide margin. This pattern suggests that leveraged bullish trades faced sustained pressure during recent price swings.
Repeated tests of the $1.42 support level may weaken its strength over time. Meanwhile, resistance between $1.435 and $1.445 continues to limit upward movement. Traders are monitoring whether price consolidates within this range or breaks toward new levels.
Market activity remains closely tied to liquidity flows and broader sentiment. While ETF inflows provide one layer of insight, price structure and liquidation trends continue to shape near-term direction.


The average Web3 VC pitch sounds like ours did three years ago. “We have deep relationships across the ecosystem.” “We add value beyond capital.” “Our network is our edge.” It’s not that any of these statements is a lie; it’s that everyone says them, which makes them effectively meaningless.
Liquidity providers (LPs) have heard this pitch so many times that the words have lost all shape. And yet somehow, the industry just keeps photocopying the same deck. Impressive logo slide. Vague thesis. Three bullet points about “value add.” A track record that, for most emerging managers, doesn’t yet exist. Repeat until funded, or not.
My colleagues and I at TBV spent a lot of time asking ourselves what we actually had that no one else did. The answer, eventually, was humbling: not much. So we built something different.
Here’s the thing that the data keeps trying to tell the industry and the industry keeps ignoring: emerging managers actually outperform. Studies consistently show they reach top-quartile performance more often than established funds and deliver materially higher returns on average. The upside is real. The problem is entirely structural — emerging managers can’t communicate a clear reason to clients to back them over others, so capital flows to brands rather than potential.
When we built TBV, we decided the pitch had to be a product, not a promise. The question we kept returning to was: what does a fund actually own? Not who it knows. Connections are not defensible. What has it built, what data has it generated, and what platform value does it create for founders? That’s defensible.
The answer we landed on was events. We weren’t looking for just a networking play or branding exercise. We wanted to develop a people-centric deal engine. Web3 runs on conferences. Everyone already knows this. Founders travel thousands of miles to shake hands at side events. VCs pay enormous sponsorship fees for access to people they could probably have reached by email. The ROI calculus has always been fuzzy at best. What we wanted to do was flip the model: instead of paying for access, build the environment. Own the data. Create the relationships at scale and feed them directly back into sourcing, diligence and value for everyone involved.
In 2025, our event series drew over 43,000 attendees and more than 100 partners. That didn’t happen by accident, and it wasn’t just a marketing stunt. It was deliberate infrastructure. Every interaction, every connection, every emerging trend spotted in those rooms feeds into TBX, our AI-driven deal engine. The events and the fund are the same flywheel.
“We’re not the only ones rethinking this. What’s interesting is how different the approaches are and how few of them look anything like a traditional fund.”
Another VC firm, Outlier Ventures, figured this out from a different angle. They leaned into the accelerator model — building a genuine platform of support around early-stage founders rather than just writing checks and showing up for board meetings. The result is a fund with over 300 portfolio companies and a real reason for founders to choose them over others with just more AUM. Paradigm went in a completely different direction: they got technical. They don’t just invest in protocols; they contribute to them. That kind of depth is genuinely hard to replicate, and LPs can see it.
What these models share, and what the next generation of interesting managers will share, is that the fund itself is a product with utility beyond capital. The question isn’t “how do we tell a better story?” It’s “how do we build something that makes the story self-evident?”
The good news is there isn’t just one answer. The events model works for us. The accelerator model works for Outlier. Deep technical contribution works for Paradigm. What doesn’t work, what has never really worked, and what LPs are increasingly unwilling to pretend works, is a pitch built entirely on relationships you can’t show and value you can’t measure.
Web3 moves fast enough that the managers who build real infrastructure now will be very hard to displace later. The ones still writing decks about their networks in three years will find the room has quietly emptied out around them. I’m genuinely curious to see what other models emerge. Competition in this space, when it’s actually focused on doing something different, is the best thing that could happen to it.

BNY Mellon Appreciation Fund Q1 2026 Commentary
AVAX Tests Key Support as Descending Triangle Signals Possible Trend Reversal Ahead

Greatest Sequel In Movie History Is Free To Stream

Why Israel is blocking foreign journalists from entering

Bitcoin: We’re Entering The Most Dangerous Phase

Alan Cumming Brands Baftas Ceremony A ‘Triggering S**tshow’

90% Finanzierung unter 4%? Achtung Details! (16.04.2026) #baufinanzierung

Eugenie marriage crisis as Jack Brooksbank refuses financial audit pressure

*NEW* THE SEC JUST SHOCKED EVERYONE! XRP MASSIVE INDICATOR! RAVE DAO (HOW HIGH CAN IT GO?)
-
 NewsBeat7 days ago
Pep Guardiola and Gary Neville agree over Arsenal title problem that benefits Man City
-

 Crypto World6 days ago
The SEC Conditionalises DeFi Platforms to Be Avoided for Broker Registration
-

 Fashion2 days ago
Weekend Open Thread: Theodora Dress
-

 Crypto World6 days ago
SEC Signals Exemption for Crypto Interfaces From Broker Registration
-

 News Videos4 days ago
Secure crypto trading starts with an FIU-registered
-

 Sports2 days ago
NWFL Suspends Two Players Over Post-Match Clash in Ado-Ekiti
-

 Crypto World6 days ago
SEC Proposes Certain Crypto Interfaces Don’t Need to Register as Brokers
-

 NewsBeat5 days ago
Trump and Pope Leo: Behind their disagreement over Iran war
-

 Business5 hours ago
Powerball Result April 18, 2026: No Jackpot Winner in Powerball Draw: $75 Million Rolls Over
-

 Politics2 days ago
Palestine barred from entering Canada for FIFA Congress
-

 Crypto World2 days ago
Russia Pushes Bill to Criminalize Unregistered Crypto Services
-

 Sports6 days ago
NWFL opens Pathway for new Clubs ahead of 2026 Season
-
 Entertainment6 days ago
Brand New Day’ Footage Reveals the Devastating Impact of ‘Now Way Home’
-
 Business3 days ago
Creo Medical agree sale of its manufacturing operation
-

 Politics10 hours ago
Zack Polanski demands ‘council homes not luxury flats for foreign investors’
-

 Crypto World6 days ago
Trump whales load up ahead of Mar-a-Lago luncheon.
-
Crypto World7 days ago
Sei Network Enters Quiet Reset Phase as On-Chain Metrics Signal a Slowdown in 2026
-
Business6 days ago
Kering slides after Morgan Stanley downgrade, Gucci woes loom
-

 Tech6 days ago
Google adds E2E encryption to Gmail for iOS and Android enterprise users
-

 Tech7 days ago
Apple glasses won’t go brand shopping like Meta did with Ray-Ban and Oakley
You must be logged in to post a comment Login