

Crypto World
Vitalik Buterin outlines ‘DVT-lite’ plan to simplify distributed Ethereum staking


Vitalik Buterin has outlined a plan to simplify distributed staking infrastructure on Ethereum, arguing that running validator nodes should not require specialized technical expertise.
Summary
- Vitalik Buterin outlined a “DVT-lite” approach designed to simplify distributed Ethereum staking infrastructure.
- He argued that complex validator setups are “anti-decentralization” and should be replaced with easier deployments.
- The goal is to enable simple, near “one-click” distributed staking, particularly for institutions holding large amounts of ETH.
In a recent social media post, Buterin discussed how the Ethereum Foundation is using a simplified “DVT-lite” setup to stake 72,000 ETH, describing the effort as part of a broader push to make distributed validator technology easier to deploy.
Distributed validator technology, or DVT, allows multiple machines or operators to collectively run a validator using a shared key, rather than relying on a single server or operator. The approach is widely viewed as a way to improve network resilience and reduce the risk of validator outages.
Buterin said his goal is to make deploying such infrastructure “maximally easy,” particularly for institutions that hold significant amounts of Ether but may lack the technical capacity to operate complex validator systems.
“My hope for this project is that in the process, we can make it maximally easy and one-click to do distributed staking for institutions,” he wrote.
Under the concept he described, node operators could run a validator through a simple containerized setup, such as a Docker container or a similar environment. Each participating node would use the same validator key and automatically discover the other nodes in the cluster.
Once the nodes connect, the networking setup and distributed key generation process would run automatically before staking begins.
Buterin also criticized the perception that operating blockchain infrastructure requires professional-level expertise.
“The idea that running infrastructure is this scary complicated thing where each person participating must be a ‘professional’ is awful and anti-decentralization,” he said.
According to Buterin, simplifying distributed validator deployment could help spread authority over Ethereum staking across a wider set of participants. He added that he personally plans to use the setup and hopes more large Ether holders will adopt similar distributed staking configurations.

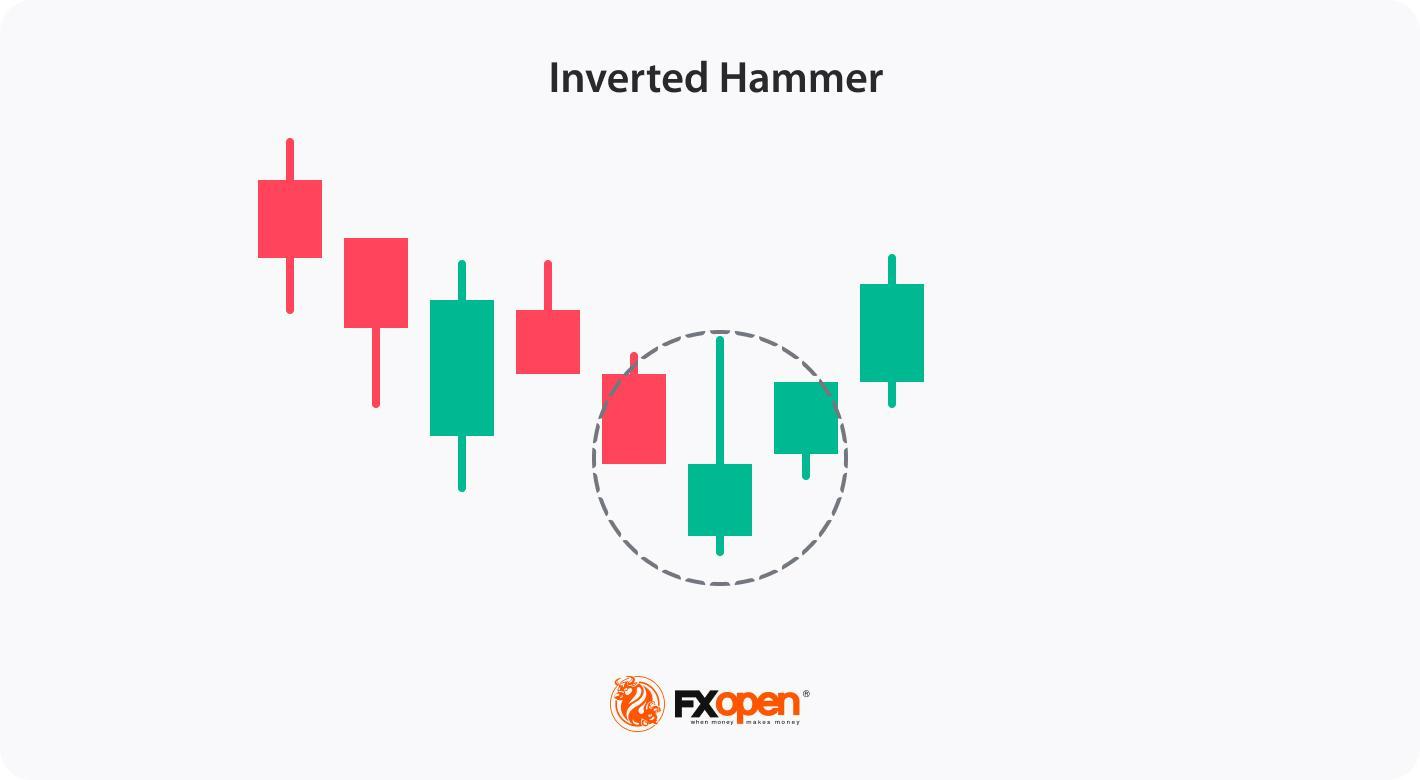
Candlestick patterns are widely used in technical analysis to identify potential shifts in market sentiment and price momentum. One formation that traders frequently monitor during market declines is the inverted hammer candlestick pattern.
An inverted hammer is a single-candle formation characterised by a small real body near the lower end of the price range and a long upper shadow, typically at least twice the length of the body, with little or no lower shadow. It usually appears after a downtrend and may indicate that buyers attempted to push prices higher during the session, suggesting that selling pressure could be weakening.
In this article, we explain the meaning of the inverted hammer candlestick, examine its key characteristics, outline how traders identify it on charts, and discuss common ways it may be incorporated into technical analysis and trading strategies.
What Is an Inverted Hammer?
An inverted hammer is a candlestick pattern that appears at the end of a downtrend, typically signalling a potential bullish reversal. It has a distinct shape—a small body at the lower end of the candle and a long upper wick that is at least twice the size of the body. This structure suggests that although sellers initially dominated, buyers stepped in, pushing prices higher. While the inverted hammer alone does not confirm a reversal, it’s often considered a sign of a possible trend change when followed by a bullish move on subsequent candles.
The pattern can have any colour so that you can find a red inverted hammer candlestick or upside down green hammer. Although both will signal a bullish reversal, an inverted green hammer candle is believed to provide a stronger signal, reflecting the strength of bulls.

One of the unique features of this pattern is that traders may apply it to various financial instruments, such as stocks, cryptocurrencies*, ETFs, indices, and forex, across different timeframes. To test strategies with an inverted hammer formation, you may consider using FXOpen’s TickTrader trading platform, which provides access to over 700 markets.
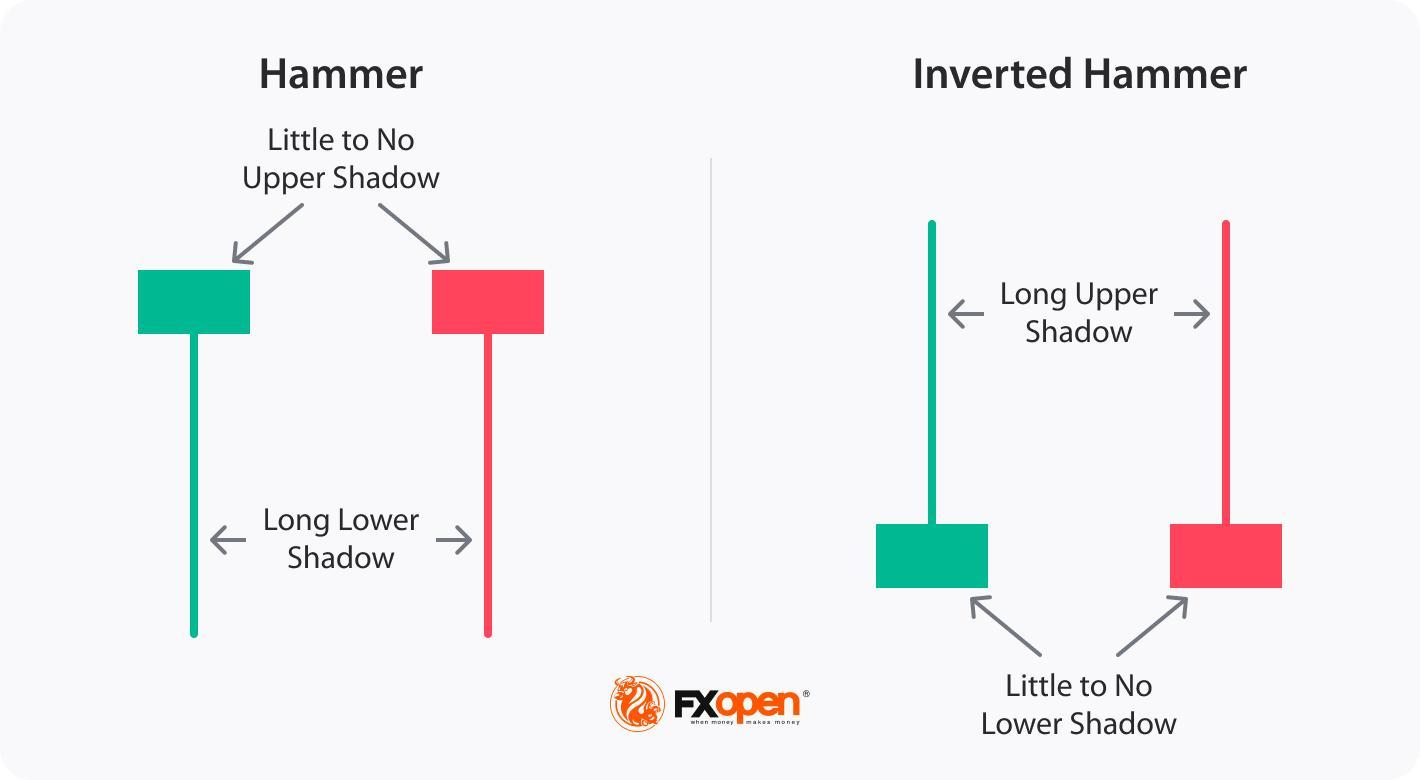
Hammer Candlestick vs Inverted Hammer
The hammer candlestick pattern and inverted hammer are both single-candle patterns that appear in downtrends and signal potential bullish reversals, but they have distinct formations and implications:
- Hammer: The reversal hammer candle has a small body at the top with a long lower wick, indicating that buyers pushed prices back up after a period of selling pressure. This bullish hammer pattern shows that sellers were initially strong, but buyers regained control, potentially signalling a reversal.
- Inverted Hammer: The inverted hammer, by contrast, has a small body at the bottom with a long upper wick. This structure indicates initial buying pressure, but sellers prevented a complete takeover. This pattern suggests that buyers may soon regain strength, hinting at a possible trend reversal.
Both patterns signal possible bullish sentiment, but while the green or red hammer candlestick focuses on buyer strength after selling, the inverted hammer suggests buyer interest in an overall bearish context, needing further confirmation for a trend shift.
How Traders Identify the Inverted Hammer Candlestick in Charts
Although the inverted hammer is a recognisable pattern, traders often apply additional rules to potentially strengthen the reversal signal it provides.
Step 1: Identify the Pattern in a Downtrend
- Traders ensure the market is in a downtrend, as the inverted hammer is only significant when it appears after a period of sustained selling pressure.
- Then, they look for a candlestick with a small body at the lower end and a long upper wick that’s at least twice the size of the body. This upper shadow shows initial buying pressure followed by selling, suggesting a potential reversal in sentiment.
Step 2: Choose Appropriate Timeframes
- The pattern can appear across various timeframes, but higher timeframe charts are more popular among traders, as shorter timeframes, like 5 or 15-minute charts, may provide false signals.
Step 3: Use Indicators to Strengthen Identification
- Volume: A rise in bullish trading volume after the inverted hammer can indicate stronger interest from buyers, increasing the likelihood of a trend reversal.
- Oscillators: Oscillators like Stochastic, Awesome Oscillator, or RSI showing an oversold reading alongside the candle can further suggest that the asset might be due for a reversal.
Step 4: Look for Confirmation Signals
- Gap-Up Opening: A gap-up opening in the next trading session indicates buyers stepping in, giving further weight to the bullish reversal.
- Bullish Candle: Following the inverted hammer with a strong bullish candle confirms that buying pressure has continued. This is a key signal that a trend reversal may be underway.
By following these steps and waiting for confirmation signals, traders might increase the reliability of the inverted hammer’s signals.
Trading the Inverted Hammer Candlestick Pattern: Real-Market Examples
Inverted hammer trading is based on a systematic approach to potential bullish reversals. Here are some steps traders may consider:
- Identify the Inverted Hammer: Spot the setup on a price chart by following the rules discussed earlier.
- Assess the Context: Analyse the broader market context and consider the pattern’s location within the prevailing trend. Look for support levels, trendlines, or other significant price areas that could strengthen the reversal signal.
- Set an Entry: Candlestick patterns don’t provide accurate entry and exit points as chart patterns or some indicators do. However, traders can consider some general rules. Usually, traders wait for at least several candles to be formed upwards after the pattern is formed.
- Set Stop Loss and Take Profit Levels: The theory states that traders use a stop-loss order to limit potential losses if the trade doesn’t go as anticipated. It may be placed below the low of the candlestick or based on a risk-reward ratio. The take-profit target might be placed at the next resistance level.
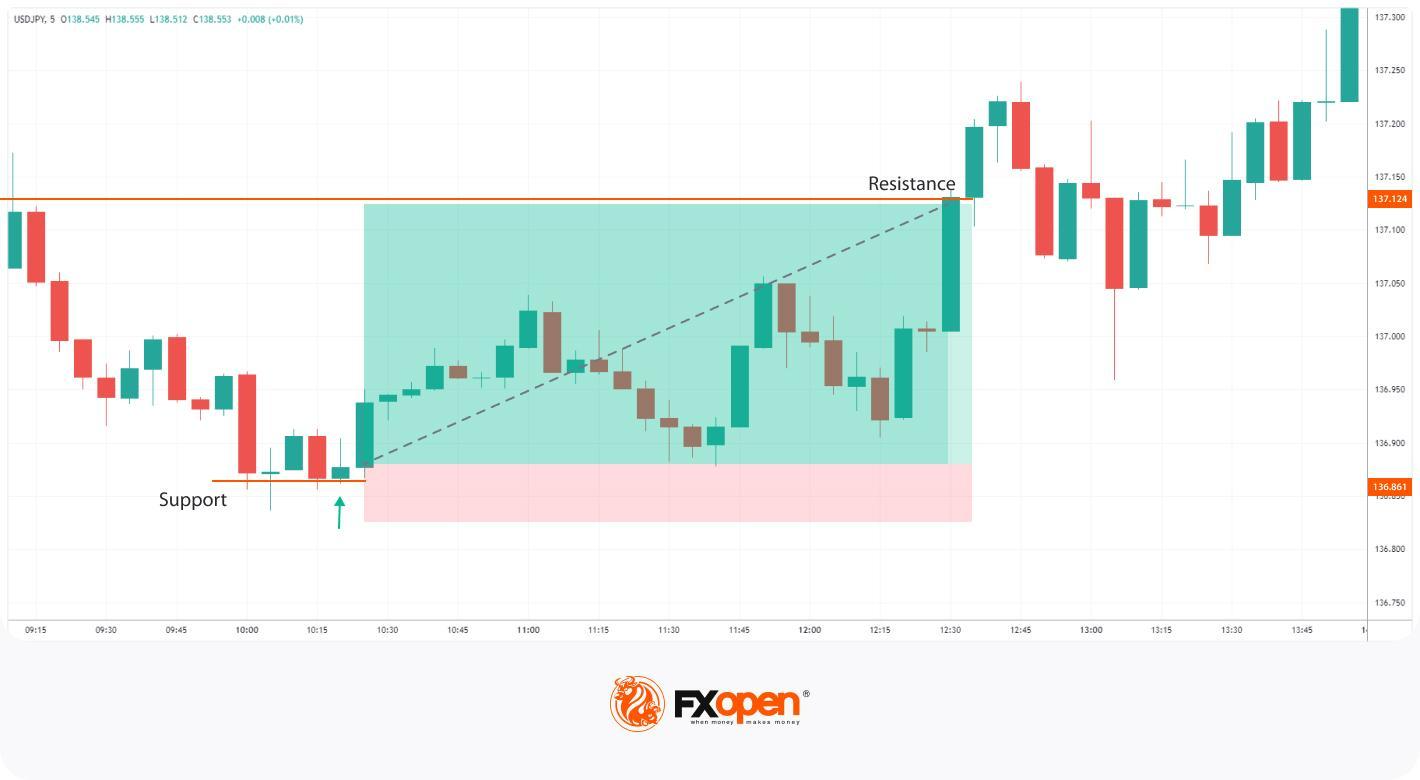
Inverted Hammer Candlestick: Live Market Example
The trader looks for a bullish inverted hammer on the USDJPY chart. After a subsequent downtrend, the inverted hammer appearing at a support level signals a potential trend reversal. They enter the market at the close of the inverted hammer candle and place a stop loss below the support level. Their take-profit target is at the next resistance level.
A trader could implement a more conservative approach and wait for at least a few candles to form in the uptrend direction. However, as the pattern was formed at the 5-minute chart, a trader could enter the market too late or with a poor risk-reward ratio.
Advantages and Limitations of the Inverted Hammer
The inverted hammer has its strengths and limitations. Here’s a closer look:
Advantages
- Recognisable: The pattern has a unique shape, making it accessible for traders at all experience levels.
- Can Be Spot in Different Markets: The candle can be found on charts of different assets across all timeframes.
- Clear Idea: When it appears on a chart, it reflects a trend reversal, allowing traders to incorporate it into broader trading strategies, especially when there are additional confirming signals.
Limitations
- Reliability Depends on Confirmation: The candle alone does not guarantee a market reversal; it requires confirmation from the next candlestick or other indicators. Without this, the reversal signal may be weak.
- Works Only in Strong Downtrends: The pattern might be more useful in strong downtrends; in ranging or weak trends, it generates less reliable signals.
- False Signals Can Occur: False signals are possible, especially in volatile markets. Over-reliance on this pattern without additional analysis may lead to poor trade outcomes.
Final Thoughts
While the inverted hammer can provide valuable insights into potential trend reversals, it should not be the sole basis for trading decisions. It is important to supplement analysis with other technical indicators and tools to strengthen the overall trading strategy. Also, risk management is crucial while trading this formation.
If you want to develop your own trading strategy, you may consider opening an FXOpen account and access over 700 markets with tight spreads from 0.0 pips and low commissions from $1.50.
FAQ
Is an Inverted Hammer Bullish?
Yes, it is considered a bullish reversal pattern. It indicates a potential shift from a downtrend to an uptrend in the market. While it may seem counterintuitive due to its name, the setup suggests that buying pressure has overcome selling pressure and that bulls are gaining strength.
How Can an Inverted Hammer Be Traded?
When using an inverted hammer, traders wait for confirmation in the next session, such as a gap-up or strong bullish candle. They usually open a buy position with a stop-loss below the low of the pattern to potentially manage risk and a take-profit level at the closest resistance level.
Is the Inverted Hammer a Trend Reversal Signal?
It is generally considered a potential trend reversal signal. An inverted hammer in a downtrend suggests a shift in market sentiment from bearish to bullish. An inverted hammer in an uptrend does not signify anything.
What Happens After a Reverse Hammer Candlestick?
After a reverse (or inverted) hammer candle, there may be a potential bullish reversal if confirmed by a strong bullish candle in the next session. However, without confirmation, the pattern alone does not guarantee a trend change.
Can an Inverted Hammer Candlestick Be Traded in an Uptrend?
In an uptrend, an inverted hammer isn’t generally considered significant because it’s primarily a reversal signal in a downtrend.
Are Inverted Hammer and Shooting Star the Same?
No, the inverted hammer and shooting star look similar but occur in opposite trends; the former appears in a downtrend as a bullish reversal signal, while the latter appears in an uptrend as a bearish reversal signal.
What Is the Difference Between a Hanging Man and an Inverted Hammer?
The hanging man and inverted hammer differ in both appearance and context. The former appears at the end of an uptrend as a bearish signal and has a small body and a long lower shadow, while the latter appears at the end of a downtrend as a bullish signal and has a small body and a long upper shadow.
What Is the Difference Between Red and Green Inverted Hammer Candlesticks?
A bullish (green) inverted hammer candlestick closes higher than its opening price, indicating a stronger bullish sentiment. A bearish (red) inverted hammer candlestick closes lower than its opening, which might indicate less buying strength, but both colours may signal a reversal if followed by confirmation.
*Important: At FXOpen UK, Cryptocurrency trading via CFDs is only available to our Professional clients. They are not available for trading by Retail clients. To find out more information about how this may affect you, please get in touch with our team.
This article represents the opinion of the Companies operating under the FXOpen brand only. It is not to be construed as an offer, solicitation, or recommendation with respect to products and services provided by the Companies operating under the FXOpen brand, nor is it to be considered financial advice.

Key Highlights
- Blockchain.com officially enters Ghana to deliver regulated crypto solutions.
- Stablecoin USDT experiences explosive growth for remittances and inflation hedging.
- Bitcoin trading accelerates across Nigeria and Ghana for savings and payments.
- TRON emerges as popular choice for international transfers and e-commerce.
- Platform builds local infrastructure with dedicated teams and regulatory frameworks.
Blockchain.com has officially entered the Ghanaian market, marking a significant milestone in its West African expansion strategy. The crypto platform intends to deliver compliant and accessible digital asset solutions to users throughout the region. This move builds on successful operations in neighboring markets and demonstrates a sustained commitment to African crypto growth.
Stablecoin Demand Explodes Across Nigerian and Ghanaian Users
The demand for USDT has reached unprecedented levels on Blockchain.com’s platform in West Africa. Nigerian trading volumes have skyrocketed by more than 700% since retail services became available. Stablecoins serve critical functions in facilitating international payments and lowering transfer fees.
Users throughout the region increasingly turn to USDT as a hedge against local currency devaluation, while merchants integrate it into payment systems. Blockchain.com is building out its workforce with regional talent to enhance technical capabilities and service offerings. The platform maintains strict adherence to regulatory standards to guarantee safe and legitimate access to cryptocurrency products.
Even prior to official operations, Ghana demonstrated 140% expansion in platform participants. Rising stablecoin transaction activity reflects widespread appetite for blockchain-secured monetary alternatives. Blockchain.com focuses on delivering dependable, region-appropriate tools for West African financial needs.
Bitcoin Trading Reaches New Heights in West African Markets
Bitcoin continues to dominate trading activity on Blockchain.com’s Nigerian platform, generating unprecedented brokerage transaction volumes. The company indicates that BTC serves dual purposes as both an investment vehicle and remittance channel. Regional staffing expansions support operational scaling and enhanced customer service capabilities.
Nigeria’s smartphone-dominated population and unstable currency conditions fuel sustained Bitcoin engagement. Ghanaian market participants have similarly increased their Bitcoin trading frequency, revealing strong regional appetite. Blockchain.com combines Bitcoin services with complementary digital assets to broaden financial inclusion.
International fund transfers leverage Bitcoin’s deep liquidity pools, enabling rapid and cost-effective value movement. Blockchain.com systematically expands its technical infrastructure while maintaining rigorous security protocols. Regional programs emphasize user education, strategic partnerships, and market-specific crypto solutions.
TRON Network Gains Significant Momentum Throughout African Operations
TRON-based transactions have accelerated notably on Blockchain.com, especially within Nigerian markets. The platform observes expanding use cases spanning payments, wealth preservation, and online commerce applications. Blockchain.com bolsters technical resources to accommodate user requirements and evolving market dynamics.
The rise of TRX adoption aligns with the company’s strategic initiative to broaden its digital asset portfolio. Blockchain.com employs local market knowledge to refine service quality and regulatory compliance practices. Usage statistics confirm that TRON is becoming increasingly viable for remittances and business transactions.
Ghana displays promising early TRX trading activity despite awaiting complete platform activation. Blockchain.com’s emphasis on secure, user-friendly digital infrastructure cultivates confidence among participants. West African expansion enables the company to nurture developing cryptocurrency ecosystems throughout the continent.
Blockchain.com currently maintains operations across more than 70 international jurisdictions, having facilitated over $1.2 trillion in cryptocurrency transactions. The service has generated upwards of 90 million digital wallets and authenticated 40 million individual users. Ghana’s integration underscores Blockchain.com’s strategic vision for advancing financial services and cryptocurrency accessibility across the African continent.


Thailand’s crypto ecosystem is facing intensified scrutiny as authorities push a stricter regime on digital asset transactions. Operators in the country report that more than 10,000 accounts suspected of laundering funds have been frozen in the wake of tightened screening rules. The changes aim to slow dubious transfers and require additional Know Your Customer checks before higher-risk movements are completed, according to reporting from the Bangkok Post. The move marks a broadening effort by regulators and industry associations to curb illicit activity in a market that has seen a surge of compliance measures in recent years.
Key takeaways
- Thai licensed digital asset operators froze over 10,000 accounts identified as suspect mule accounts after the rollout of new screening measures and enhanced KYC checks for higher-risk transfers.
- The tightening builds on coordinated efforts by the Securities and Exchange Commission (SEC) of Thailand and the Thai Digital Asset Operators Trade Association (TDO), with support from the Bank of Thailand and various law enforcement agencies.
- Earlier in 2025, operators reportedly froze a much larger pool of mule accounts, with 47,692 identified in the period and handled within the Thai digital asset framework.
- Authorities have signaled a broader push to close money-laundering loopholes by enforcing the Travel Rule for digital asset transfers and enhancing data-sharing between crypto operators, banks, and law enforcement.
- Regulatory momentum in Thailand continues to unfold alongside actions against “gray money” in gold markets, reflecting a comprehensive tightening of financial oversight across asset classes.
Market context: The crackdown mirrors broader regional and global moves toward stricter AML/CFT standards for crypto activities. It comes as regulators push for clearer guidelines and cross-agency cooperation to curb illicit flows while balancing innovation and investor protection in Southeast Asia.
Why it matters
The Thai authorities’ approach signals a more disciplined regulatory environment for digital assets in Southeast Asia. By pairing tighter screening with explicit Know Your Customer procedures, officials aim to choke off the so-called mule accounts that move funds through multiple layers before reaching illicit destinations. For operators, the measures translate into deeper onboarding checks and stricter controls on high-risk transfers, potentially increasing compliance costs but also reducing reputational risk stemming from association with crime.
For investors and users, the evolving framework could bring greater transparency and predictability, albeit with heightened friction on some transactions. The Travel Rule enforcement adds another layer of customer-identification requirements, particularly for wallet-to-wallet transfers routed through exchanges. This aligns Thailand with a growing set of jurisdictions prioritizing traceability in digital-asset movements, even as the sector seeks to maintain smooth access to finance and capital markets for legitimate participants.
From a policy perspective, the collaboration between the SEC, the TDO, and federal and local enforcement bodies illustrates a mature, multi-agency approach to crypto regulation. The joint efforts to expand data-sharing, tighten screening, and standardize suspicious-activity responses demonstrate a willingness to move swiftly when red flags arise, while still engaging industry stakeholders in crafting practical safeguards.
What to watch next
- Outcomes from the February 2025 SEC–TDO workshop, including new guidelines for monitoring and investigating mule accounts and any published expedited measures.
- follow-up steps on expanded data-sharing between crypto operators, banks, and law enforcement to prevent transfers to suspected mule accounts.
- Any additional rounds of mule-account identification or freezes, and whether these actions target specific platforms or market segments.
- Regulatory guidance on broader digital-asset safeguards, including potential updates to the Travel Rule and related compliance requirements.
Sources & verification
- Bangkok Post: crypto-operators freeze 10,000 suspect accounts — https://www.bangkokpost.com/business/general/3213543/crypto-operators-freeze-10000-suspect-accounts
- SEC statement on collaboration with TDO and other agencies to tighten safeguards — https://www.sec.or.th/EN/Pages/News_Detail.aspx?SECID=11581&rand=113627
- Bangkok Post: SEC to expand digital asset framework — https://www.bangkokpost.com/business/investment/3180638/sec-to-expand-digital-asset-framework
- Pattaya Mail: Thai PM orders tighter oversight of gold and digital asset transactions to close financial loopholes — https://www.pattayamail.com/thailandnews/thai-pm-orders-tighter-oversight-of-gold-and-digital-asset-transactions-to-close-financial-loopholes-532051?utm_source=chatgpt.com
Thailand tightens mule accounts crackdown across digital assets
The Thai crypto ecosystem has entered a phase of heightened vigilance as regulators press for greater integrity in digital-asset markets. The most visible development so far is the publicized freeze of more than 10,000 accounts flagged as mule accounts—vehicles used to launder illicit funds or mask the origin of criminal proceeds. This action followed the implementation of stricter screening measures designed to slow down suspicious transfers and require additional Know Your Customer checks before completing higher-risk transactions. The Bangkok Post highlighted these changes, noting that operators have started to identify and freeze a substantial number of accounts as a consequence of the enhanced due-diligence regime.
Industry participants at the helm of Thailand’s digital-asset scene point to a broader, ongoing effort to curb illicit activity. Att Thongyai Asavanund, chief executive of KuCoin Thailand and chairman of the Thai Digital Asset Operators Trade Association (TDO), described the current phase as a direct response to evolving risk indicators. He said the tightened screening process enabled exchanges and brokers to identify and freeze more than 10,000 mule accounts, reflecting a concerted push by the sector to uphold compliance standards while continuing to serve legitimate traders and investors.
The collaboration between regulators and the industry has grown more structured over time. In February 2025, the SEC disclosed that it had worked with the TDO, the Bank of Thailand, the Cyber Crime Investigation Bureau, the Central Investigation Bureau, the Anti-Money Laundering Office, and the Thai Bankers’ Association to develop additional safeguards against mule accounts. This multi-agency effort underscores the Thai government’s intent to close gaps that criminals exploit—particularly as the country’s digital asset market expands and becomes increasingly integrated with traditional financial systems.
Earlier summaries from Thai authorities and media reported a broader, systemic approach to combatting mule accounts, with a sequence of enforcement actions that extended into 2025. Reports indicated 47,692 mule accounts had been frozen by Thai digital asset operators in 2025, signaling a sustained and data-driven approach to identifying risk and applying countermeasures. The TDO, which represents licensed digital-asset operators, continues to advocate for balanced governance that protects consumers while enabling legitimate innovation in the sector. As the sector broadens, exchanges and brokers alike are expected to tighten onboarding, enhance monitoring, and cooperate with law enforcement in real time.
The regulatory push also intersects with efforts to crack down on “gray money” flows in other asset classes. Thailand recently launched a comprehensive campaign aimed at closing money-laundering loopholes in both physical gold markets and crypto assets, emphasizing a holistic approach to financial crime prevention. In parallel, the government has pushed to strictly enforce the Travel Rule, requiring licensed crypto-asset service providers to collect and transmit identifying information about the sender and recipient of certain digital-asset transfers—particularly for wallet-to-wallet transfers facilitated via exchanges. This alignment between crypto, banking, and law-enforcement bodies marks a decisive step toward comprehensive oversight that aims to deter illicit activity while maintaining market resilience for compliant participants.
The evolving regulatory landscape in Thailand signals a broader shift in how Southeast Asian markets approach crypto compliance. With multiple agencies coordinating and industry groups actively participating in rule-making, the region appears to be moving toward more interoperable standards that can withstand the pressure of illicit finance while still accommodating legitimate innovation and investment.
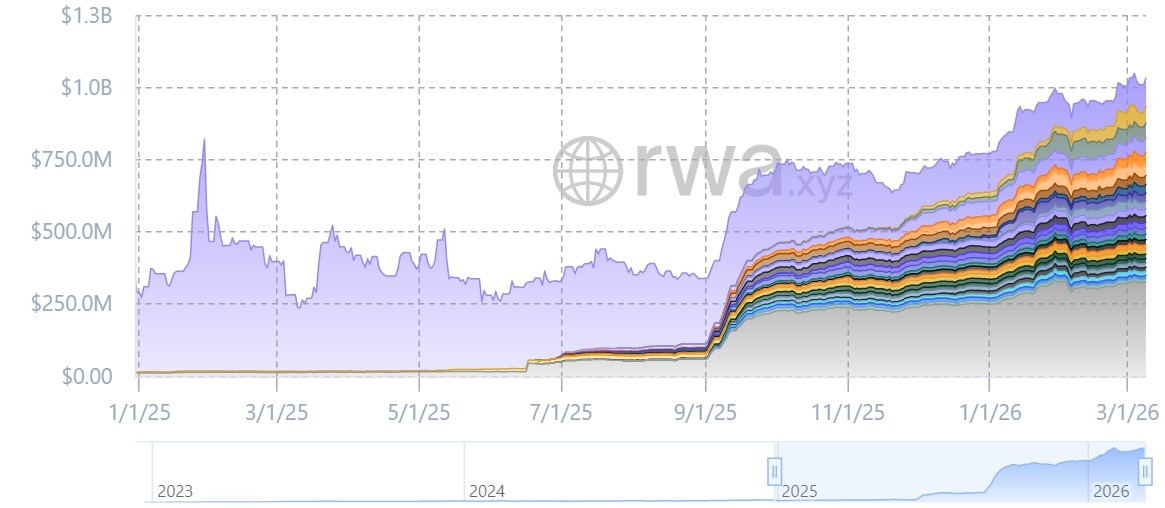
Tokenized stocks have surpassed $1 billion in total value on-chain, marking a new milestone for the fast-growing real-world asset (RWA) sector.
Data from RWA.xyz shows the value of tokenized equities climbing past the $1 billion mark, as platforms offering blockchain-based exposure to traditional stocks attract more trading activity and liquidity.
Much of that activity is concentrated among a small number of players. RWA.xyz data and a report released Tuesday by Foresight Ventures show Ondo as the largest tokenized stock platform by value, while xStocks products account for another significant share of the market.
On Tuesday, Foresight Ventures released a report arguing that the market is consolidating around these early leaders, citing regulatory barriers, liquidity advantages and differing tokenization models as key factors shaping competition in the sector.

Tokenized stocks form an early duopoly
RWA.xyz data shows that Ondo holds roughly 58% of the market, while tokenized stock products issued under the xStocks platform account for about 24%, forming an early duopoly in the sector.
Alice Li, an investment partner at Foresight Ventures, told Cointelegraph that the early leaders gained an edge by making clear structural choices around liquidity, legal frameworks and distribution.
“Building one of these platforms requires liquidity infrastructure, multi-jurisdiction legal rights, and DeFi composability, and those three things pull against each other,” Li told Cointelegraph.
Li said Ondo and xStocks got to where they are because they “made a clear architectural bet early and built deep around it.”
Related: Tokenized RWAs climb 13.5% despite $1T crypto market drawdown
Market concentration is not unique to tokenized equities. In a post on X, DeFiLlama founder 0xngmi said revenue across several DeFi sectors is increasingly flowing to the top two platforms.
He cited data from the analytics platform showing similar patterns in stablecoins, derivatives and decentralized exchanges.

Tokenized assets continue to expand across crypto markets
The growth of tokenized equities comes amid broader momentum in blockchain-based RWAs.
According to RWA.xyz data, the total value of tokenized RWAs excluding stablecoins has climbed to roughly $26 billion, reflecting growing demand for blockchain-based representations of traditional financial instruments.
On Feb. 26, the tokenized US Treasury market surpassed $10.8 billion in market capitalization. At the time of writing, the sector’s overall value is at $11.13 billion, indicating continued growth.
Trading activity has also accelerated for tokenized RWAs. On March 6, trading volumes in tokenized stocks and exchange-traded funds routed through the 1inch aggregator’s integration with Ondo exceeded $2.5 billion since the partnership launched in September 2025.
Magazine: China’s ‘50x’ blockchain boost, Alibaba-linked AI mines Bitcoin: Asia Express
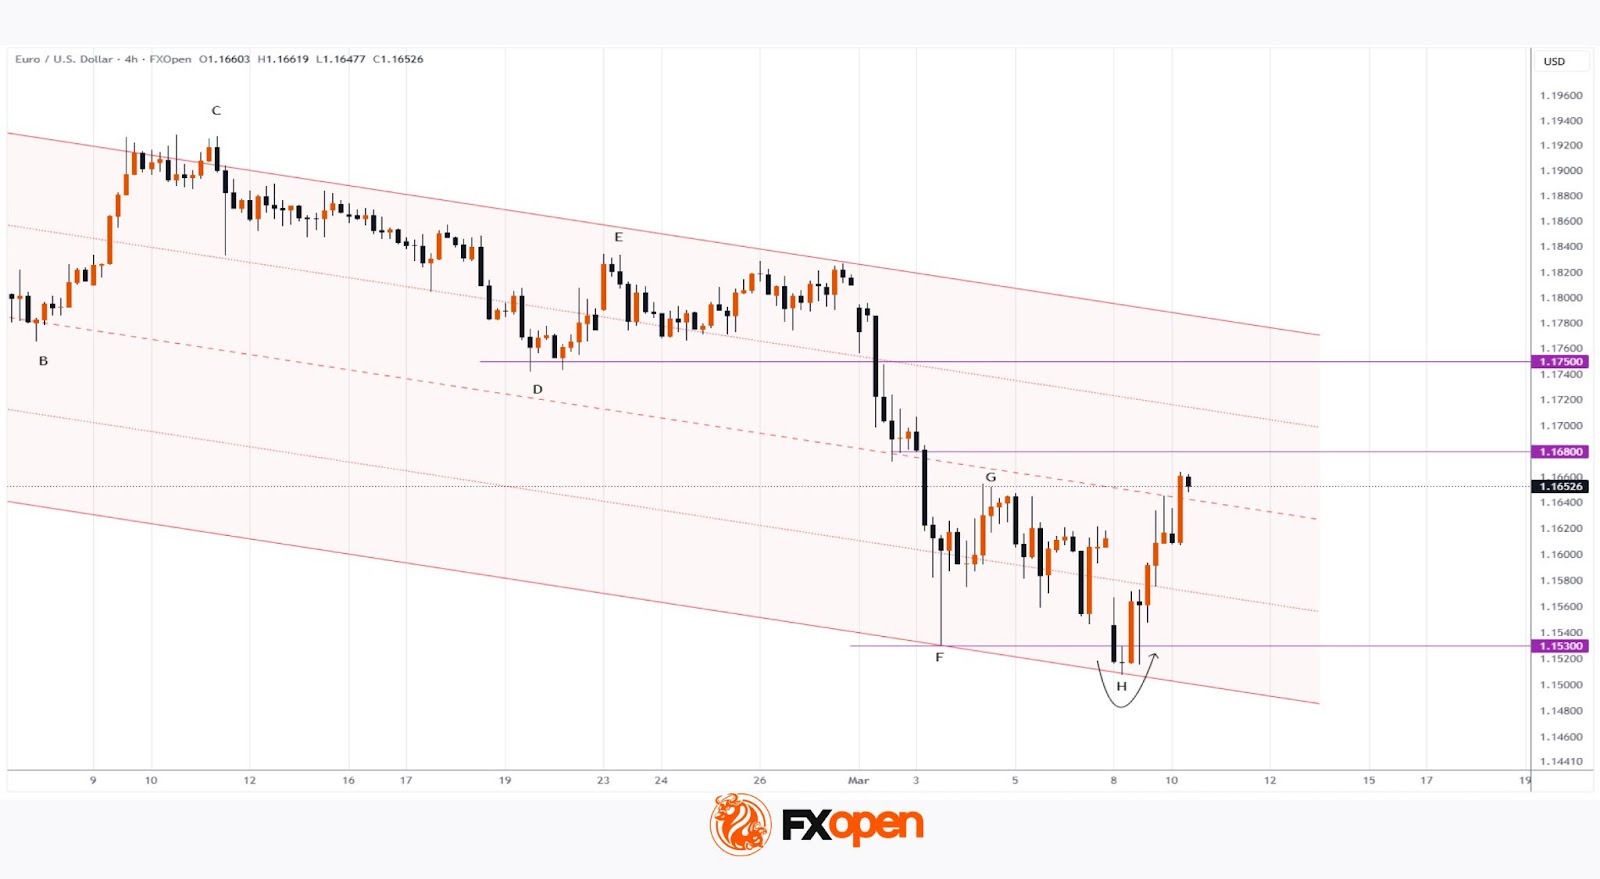
Analysing the EUR/USD chart five days ago, we:
→ constructed a downward channel, noting signs that the bears remained in control;
→ outlined a scenario in which the rate would decline to a new yearly low (and test the lower boundary of the channel).
Yesterday’s price action confirmed these assumptions – the low at H is below the low of 3 February (F), refining the lower boundary of the channel. At the same time, the sharp upward reversal (shown by the arrow) indicates increasing demand, driven by a shift in sentiment due to several factors, including:
→ Trump’s speech, in which the president stated that the war in Iran is progressing successfully and that he has contingency plans for any scenario. This cooled demand for the USD as a safe-haven asset.
→ Expectations of US inflation data scheduled for release tomorrow.

Technical Analysis of the EUR/USD Chart
Recent developments mean that the previously formed sequence of lower extremes A–B–C–D–E–F has been extended with new turning points G and H. However, the EUR/USD chart suggests that this sequence has already been disrupted.
Note that:
→ the price has confidently recovered after yesterday’s bearish gap at the market open;
→ the drop below the F low near the 1.1530 level was extremely brief (a sign of a bullish Liquidity Grab pattern);
→ the market may be sensing the proximity of the psychological 1.1500 level.
Moreover, demand-side forces are today attempting to push the price into the upper half of the channel. Therefore, forex traders should not rule out the possibility of a further recovery in EUR/USD from the fresh yearly low. In this case, former support levels at 1.1680 and 1.1750 may act as resistance to further gains.
Trade over 50 forex markets 24 hours a day with FXOpen. Take advantage of low commissions, deep liquidity, and spreads from 0.0 pips (additional fees may apply). Open your FXOpen account now or learn more about trading forex with FXOpen.
This article represents the opinion of the Companies operating under the FXOpen brand only. It is not to be construed as an offer, solicitation, or recommendation with respect to products and services provided by the Companies operating under the FXOpen brand, nor is it to be considered financial advice.

Crypto market strength extended into Tuesday, with bitcoin gaining by 3.9% since midnight UTC to trade at $71,000 while ether (ETH) is back above $2,000, a level it recently had problems surpassing.
Crypto was not alone in its ascent. U.S. equities and precious metals also after U.S. President Donald Trump said the war in Iran would come to an end “very soon.” The dollar and oil gave back much of their gains of the past week.
The Dollar Index (DXY) briefly traded as high as 99.7 on Monday, and is now at 98.5. The crypto market is inversely correlated to the dollar, so a bitcoin breakout could be on the cards if DXY continues to weaken through the rest of the week.
The war in Iran — which, it appears, may now be shorter than many thought — has exposed a resilience in the crypto market that was previously absent. Bitcoin had beaten stocks and precious metals since the conflict began, potentially rebuilding the asset class’ reputation as a haven investment.
But it is not out of the woods yet. Bitcoin and the broader market remain in a clear downtrend since early October, characterized by a series of lower highs and lower lows. In order that break that trend, bitcoin needs to trade back up toward $98,000 having established levels of support along the way.
Derivatives positioning
- Open interest (OI) in futures tied to HYPE, the best-performing token of the past 24 hours, has grown 14% to $1.41 billion, according to Coinglass. OI topped 40 million HYPE, a level that remains close to recent lows.
- For both BTC and ETH, open interest has risen more than 5%, outpacing gains in spot prices. This shows fresh capital inflows as markets rally.
- In tether gold (XAUT), futures OI continue to decline and has dropped below 110K XAUT, a sign investors are rotating money out of recent outperformers like gold-linked assets.
- Annualized perpetual funding rates for most tokens remain slightly positive, suggesting a narrow dominance of bullish bets. Tokens such as ZEC and SUI stand out with negative rates.
- Most major cryptocurrencies, excluding BCH, XMR and XAUT, have seen aggressive bidding, as evident from their OI-adjusted cumulative volume deltas.
- BTC and ETH’s 30-day implied volatility indices, BVIV and EVIV, have dropped by over 4%, a sign traders are pricing out uncertainty in the wake of oil’s drop back below $100.
- Still, on Deribit, BTC and ETH protective puts remain pricier than bullish calls across all time frames. Positioning of market makers is such that volatility could pick up markedly on a potential BTC price move above $75,000.
- Block flows featured demand for BTC straddles, a volatility bet and call spreads, a bullish strategy. In ETH’s case, traders chased risk reversals.
Token talk
- The altcoin market was particularly buoyant on Tuesday, with Solana-based DEX token jupiter (JUP) posting a double-digit gain since midnight UTC.
- Restaking token ETHFI also gained, rising by 6.5% to reach its highest point since Jan. 29.
- HYPE, the native token of derivatives exchange HyperLiquid, was more restrained, rising by just 0.5% since midnight. That’s despite BitMEX founder Arthur Hayes calling for record highs of $150 in a blog post on Monday. HYPE now trades at $34.8 with much of its 24-hour gains occurring early on Monday before Trump’s comments on the war.
- The best performing CoinDesk benchmark over the past 24 hours was the bitcoin- and ether-heavy CoinDesk 5 (CD5) and CoinDesk 10 (CD10) indexes both up by 4.3% while the DeFi Select Index (DFX) was closely behind after rising by 4%.
- The same couldn’t be said for the memecoin index (CDMEME), which is at the bottom of the pack after rising by just 2.6%.
Crypto World
Bitcoin price holds above $70k as exchange outflows rise and Iran conflict impact eases


- Exchange outflows reduce available Bitcoin, tightening the market.
- Easing Iran tensions boosts investor confidence and trading activity.
- Traders and institutions step in, supporting the price during dips.
Bitcoin (BTC) has rebounded above $70,000 amid easing impact from the ongoing war between Iran, the United States and Israel.
At the start of the war, the cryptocurrency dipped below $66,000 within days, but it has now stabilised and started to rise, though sluggishly.
At press time, BTC was trading at $71,033, up 4.1% in 24 hours and 7% over the past week.
Exchange outflows tighten available supply
The decline in Bitcoin reserves on exchanges has become a notable trend in recent months.
Holdings on centralised platforms have dropped to levels not seen since 2019, with millions of coins being withdrawn into private wallets or institutional custody.

This trend reflects growing confidence among long-term investors, who are increasingly keeping their Bitcoin off-exchange to reduce exposure to sudden liquidations.
Spot Bitcoin ETFs have also contributed to this reduction in available supply.
Since their introduction, the Bitcoin ETFs have absorbed substantial amounts of BTC, storing them in secure cold storage.
This accumulation limits the coins available for active trading, creating a tighter market environment.
Corporate treasuries have further added to the trend, holding significant amounts of Bitcoin for strategic purposes.
Together, these movements mean that while overall demand remains, fewer coins are actively circulating, creating potential for price support.
Geopolitical tensions ease, risk appetite returns
Furthermore, Bitcoin’s price rebound coincides with a decline in market fears over the Iran conflict.
Earlier concerns about potential escalation had briefly pushed oil prices higher and fueled risk-off sentiment across global markets.
But as the situation shows signs of stabilisation, investor confidence is gradually returning, especially after United States President Donald Trump hinted that the war could end very soon.
The easing of these geopolitical risks has allowed traders to step back into Bitcoin positions that had been paused during periods of heightened uncertainty.
Futures markets and institutional desks have also seen renewed activity, helping to support the cryptocurrency even amid broader market volatility.
Oil price fluctuations, which previously pressured Bitcoin along with other risk assets, have also eased as markets adjusted to the changing risk landscape.
Bitcoin price outlook
Technical indicators suggest that Bitcoin is in a strong bullish rebound, although momentum has been uneven.

While short-term swings remain, the underlying supply-tightening trends and renewed institutional demand offer a structural basis for continued price resilience.
Investors appear cautious but committed, signalling that the market may continue to hold its gains as long as supply pressures remain and macro conditions stabilise.

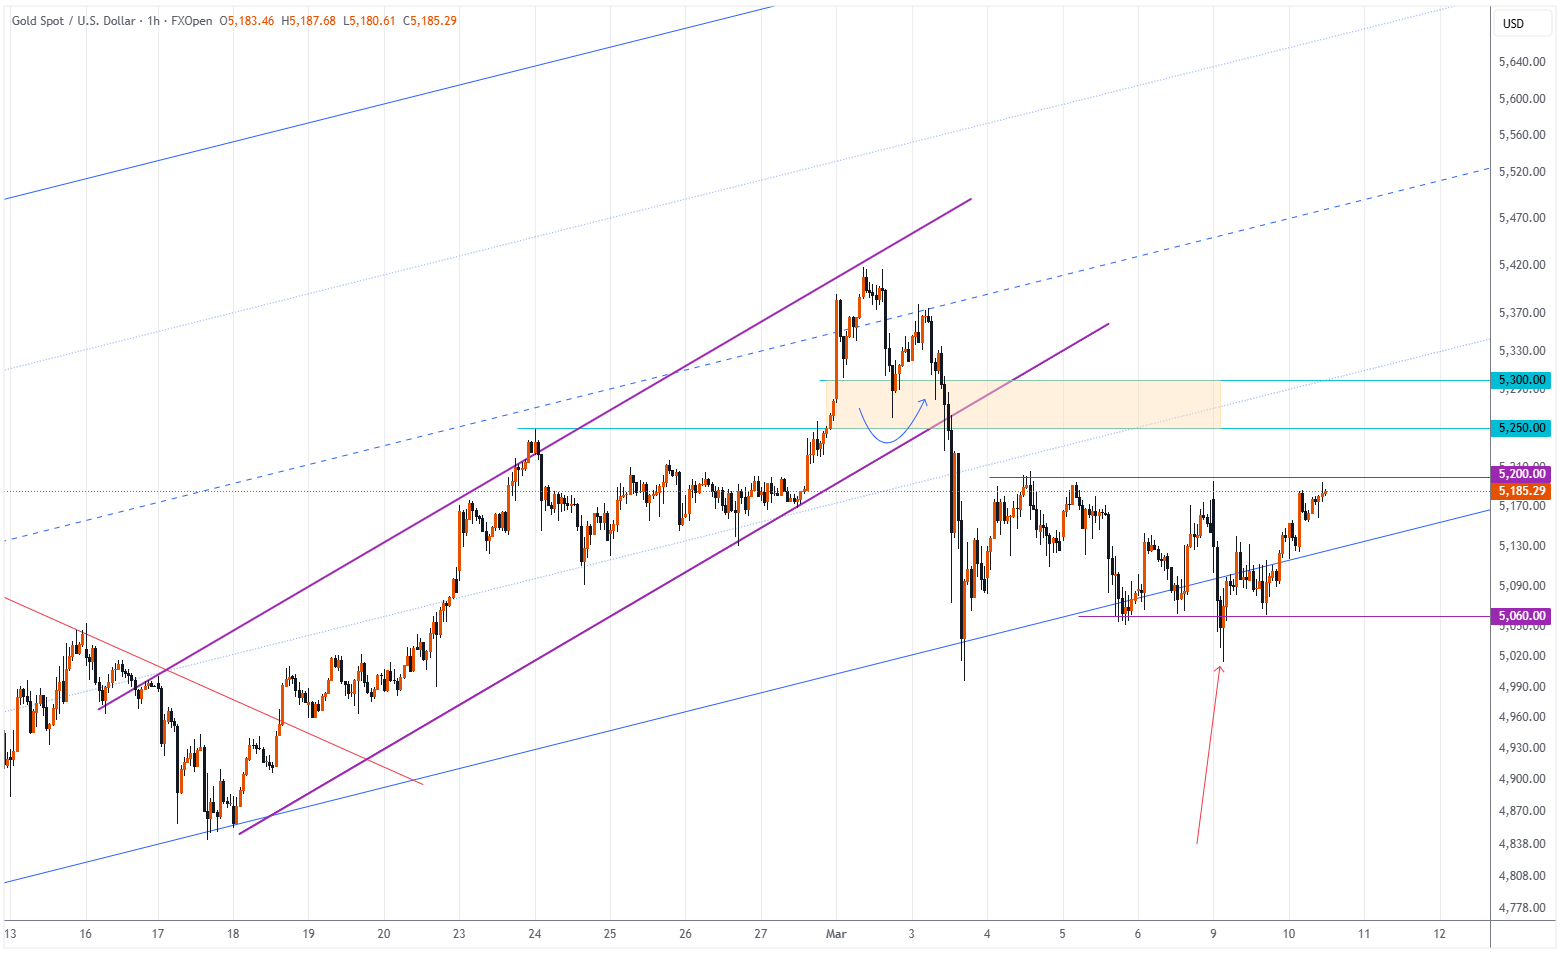
As the XAU/USD chart shows, the gold price has been holding within the $5,060–$5,200 range over the past several sessions.
Bullish view: the key support is the lower boundary of the long-term channel that has been in place since the beginning of 2026.
Bearish view: pressure on the price comes from statements by President Trump suggesting that the conflict in the Middle East could end soon. Yesterday, the US president described the operation in Iran as a “small incursion” and a “short-term” measure, which helped ease geopolitical risks and reduce demand for gold as a safe-haven asset.
Technical Analysis of the XAU/USD Chart
On the morning of 2 March, while analysing gold price movements following the attack on Iran, we confirmed the validity of the long-term ascending channel and also:
→ drew a local purple channel;
→ noted that the price was trading in close proximity to resistance lines;
→ suggested that emotions would settle and that the gold price might pull back, with support likely emerging in the $5,250–$5,300 area.
Indeed, later that evening the indicated zone acted as local support (shown by the blue arrow), but by 3 March the pullback had extended to the lower boundary of the blue channel.
It is worth noting that yesterday’s attempt by the bears (marked by the red arrow) failed to gain continuation — a sign that selling pressure may be weakening. Therefore, it would be reasonable to expect bulls to attempt to regain the initiative. A closer look at the XAU/USD chart also reveals that yesterday’s rising local lows form a cup-and-handle pattern.
At the same time, in the near term an important test of bullish intent may come at the breakout level of the purple channel around the $5,250 mark.
Start trading commodity CFDs with tight spreads (additional fees may apply). Open your trading account now or learn more about trading commodity CFDs with FXOpen.
This article represents the opinion of the Companies operating under the FXOpen brand only. It is not to be construed as an offer, solicitation, or recommendation with respect to products and services provided by the Companies operating under the FXOpen brand, nor is it to be considered financial advice.


Strategy (MSTR), the largest publicly traded holder of bitcoin , sold a record number of its perpetual preferred equity, Stretch (STRC), on Monday, using the proceeds to purchase about 1,420 bitcoin, according to data from STRC.live.
Proceeds from STRC, which debuted in July 2025, support the company’s bitcoin accumulation strategy. Monday’s session recorded nearly $300 million in total trading volume, compared with a 30-day average of $124 million, according to the company’s dashboard.
The estimates are based on a methodology that infers purchases from at-the-market (ATM) sales. The approach assumes 40% of trading volume above $100 represents ATM issuance, with a 2.5% broker commission deducted before calculating the implied bitcoin purchase.
Last week, Strategy bought roughly $1.3 billion worth of BTC, nearly 18,000 coins.
Strategy has described STRC as resembling a short-duration, high-yield savings instrument. The company recently raised the dividend rate on STRC to 11.5%. The stock pays monthly cash distributions. The dividend rate is adjusted each month to keep shares trading close to their $100 par value while limiting price volatility.
In an 8 K filing Monday, Strategy amended its Omnibus Sales Agreement to allow multiple agents to sell the same class of securities on a single trading day during pre-market or after-hours sessions. The change enables additional agents to handle early or late trades, while block sales after 4 p.m. ET remain permitted.
Strategy shares are up about 3% in pre-market trading to around $143 per share.

Key Highlights
- Palantir shares climbed approximately 9% throughout a five-day trading period amid escalating Middle Eastern geopolitical tensions.
- U.S. forces utilized Palantir’s platform to orchestrate strikes across 1,000 Iranian targets.
- The Department of Defense terminated Anthropic AI agreements citing national security risks, creating opportunities for Palantir.
- Fourth-quarter revenue jumped 70% year-over-year, reaching $1.41 billion; domestic commercial sales skyrocketed 137%.
- Analyst opinions remain polarized — projections span from $46 (Burry’s estimate) to $260 (Bank of America’s forecast).
Palantir Technologies (PLTR) delivered an impressive performance throughout the past week, climbing nearly 9% over five consecutive trading sessions. The upward trajectory coincided with geopolitical developments that placed the company’s defense capabilities under the spotlight.
Palantir Technologies Inc., PLTR
News surfaced indicating that American military strikes targeting approximately 1,000 locations across Iran relied on Palantir’s technology platform for coordination. This type of high-profile, mission-critical deployment typically generates significant investor interest and stock movement.
Palantir maintains a substantial $10 billion framework agreement with the U.S. Army alongside a $448 million Navy contract. The reports surrounding the Iran operations injected additional energy into an already robust government sector performance.
An unexpected catalyst emerged from within the Pentagon itself. Defense Department officials directed agencies to discontinue use of Anthropic’s artificial intelligence models following disagreements concerning national security protocols. A six-month transition timeline was established.
Rosenblatt analysts, who elevated their PLTR price target from $150 to $200 while maintaining a Buy recommendation on March 3, noted the transition period provides “ample time” to migrate toward LLMs supported by Palantir. The firm emphasized that Middle Eastern tensions underscore Palantir’s advantages over generic commercial AI solutions.
Piper Sandler maintained its Overweight stance with a $230 target price that same day, though analysts acknowledged potential short-term operational challenges stemming from the Anthropic disruption.
Financial Performance Shows Impressive Momentum
The underlying fundamentals have delivered remarkable results. During its latest quarterly filing, revenue surged 70% compared to the previous year, hitting $1.41 billion. U.S. commercial revenue — reflecting corporate adoption of Palantir’s artificial intelligence platforms — expanded by 137%.
Management projects revenue exceeding $7 billion for 2026, representing a 61% climb from the preceding year. This forecast significantly outpaces consensus estimates from most Wall Street research teams.
Palantir’s “Rule of 40” metric — combining revenue growth percentage with profit margin percentage — stands at 127%, which supporters cite as evidence the business can expand aggressively while maintaining profitability.
Valuation Concerns Persist Among Skeptics
Not all market participants share the optimistic view. Michael Burry, renowned for correctly predicting the housing market collapse, has proposed that Palantir’s intrinsic value might be closer to $46. With shares currently trading above 180 times earnings, he characterizes the valuation as bubble territory.
Goldman Sachs analyst Gabriela Borges maintains a reserved outlook, and institutional investors continue questioning whether Palantir can deliver its $7 billion revenue objective without experiencing a significant correction.
Conversely, Citi Research’s Tyler Radke alongside Bank of America’s Mariana Perez Mora have established price objectives of $255 and $260, respectively. Their thesis positions Palantir as the leading beneficiary of accelerating military and enterprise AI expenditures.
Aggregating 14 Buy recommendations, four Hold ratings, and two Sell opinions from the past three months, PLTR maintains a Moderate Buy consensus rating. The mean 12-month price objective stands at $191.76, suggesting approximately 22.6% appreciation potential from present levels.

DLCs, age restriction, and more

This Chinese Company Wants To Sell You A Yacht For The Price Of A Used Car
Livingston health club announces plans for new padel courts


![Why Markets Are Going RISK OFF Overnight! [Urgent Update]](https://wordupnews.com/wp-content/uploads/2026/03/1773141138_maxresdefault-80x80.jpg)


-
Business4 days ago
Form 8K Entergy Mississippi LLC For: 6 March
-

 Fashion4 days ago
Weekend Open Thread: Ann Taylor
-

 News Videos23 hours ago
10th Algebra | Financial Planning | Question Bank Solution | Board Exam 2026
-

 Crypto World20 hours ago
Paradigm, a16z, Winklevoss Capital, Balaji Srinivasan among investors in ZODL
-

 Tech5 days ago
Bitwarden adds support for passkey login on Windows 11
-
 Sports5 days ago
499 runs and 34 sixes later, India beat England to enter T20 World Cup final | Cricket News
-

 Sports3 days ago
Three share 2-shot lead entering final round in Hong Kong
-

 Sports2 days ago
Braveheart Lakshya downs Lai in epic battle to enter All England Open final | Other Sports News
-

 Business6 days ago
Guthrie Disappearance Enters Fifth Week as Family Visits Memorial
-

 Politics4 days ago
Top Mamdani aide takes progressive project to the UK
-

 NewsBeat5 days ago
Piccadilly Circus just unveiled ‘London’s newest tourist attraction’ and it only costs 80p to enter
-

 Entertainment3 days ago
Hailey Bieber Poses For Sexy Selfies In New Luscious Lip Thirst Traps
-

 Business2 days ago
Search for Nancy Guthrie Enters 37th Day as FBI Probes Wi-Fi Jammer Theory
-
 NewsBeat11 hours ago
Pagazzi Lighting enters administration as 70 jobs lost and 11 stores close across Scotland
-

 Tech21 hours ago
Despite challenges, Ireland sixth in EU for board gender diversity
-

 Crypto World6 days ago
New Crypto Mutuum Finance (MUTM) Reports V1 Protocol Progress as Roadmap Enters Phase 3
-

 Tech5 days ago
ACIP To Discuss COVID ‘Vaccine Injuries’ Next Month, Despite That Not Being In Its Purview
-
Entertainment5 days ago
Harry Styles Has ‘Struggled’ to Discuss Liam Payne’s Death
-

 Business15 hours ago
Search Enters 39th Day with FBI Tip Line Developments and No Major Breakthroughs
-
 NewsBeat5 days ago
Good Morning Britain fans delighted as Welsh presenter returns to host ITV show