

Crypto World
Wall Street Frontrunning Retail? Institutions Flooded Ethereum Before 15% Price Rally
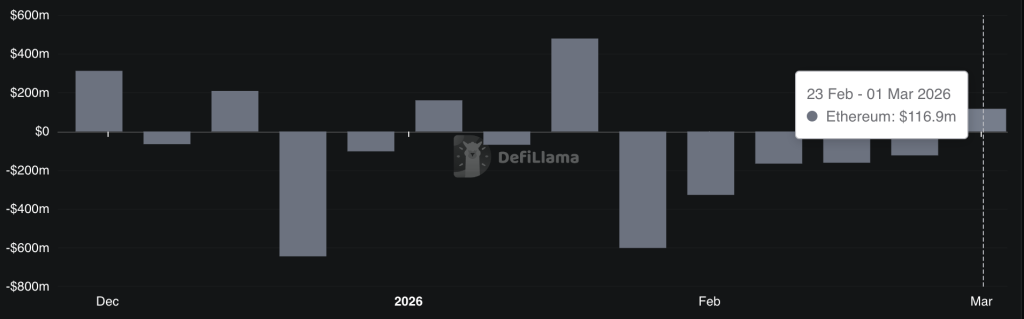
Wall Street moved toward Ethereum first then price followed. Institutions funneled $157M into Ethereum investment products on Wednesday, the largest daily inflow since mid January. Just hours later, ETH ripped 15% and reclaimed the $2,000 psychological level.
Now trading around $2,050, the move looks less like retail hype and more like deliberate positioning. While some large holders were selling into weakness, institutional desks were quietly absorbing supply.
That divergence stands out. It suggests this rally has a structural bid behind it, not just short term speculation.
Key Takeaways
- The Catalyst: Donald Trump’s State of the Union address reignited risk-on sentiment, directly preceding the $134 billion total crypto market inflow.
- The Flow: Institutional Inflows into ETH ETF products hit $157 million in a single session, marking a decisive reversal from previous outflow trends.
- The Signal: Treasury giant Bitmine added another $106 million in ETH, bringing total holdings to over $9 billion despite share price weakness.
Smart Money vs. Dumb Money: Analyzing the Flow Data
The timing fits a classic institutional play. While retail attention stayed on Bitcoin headlines, desks were building Ethereum exposure through spot ETFs. The $157M single day inflow signals rotation.

Bitcoin saw mixed flows around its $60K retest. Ethereum pulled in fresh capital instead. Recent filings show large asset managers have been increasing exposure to Ethereum linked vehicles over recent quarters.
The narrative behind it is shifting too. Tokenization and real world assets are increasingly tied to Ethereum’s ecosystem. And this right here could matter the most.
Ethereum Price Prediction: Is $2,400 Next?
The 15% jump to $2,050 has reshaped the chart. ETH has reclaimed the $2,000 level, flipping it back into support. That is the key shift. The next resistance sits near $2,150. Clear that cleanly and the path toward $2,400 opens up with less friction.
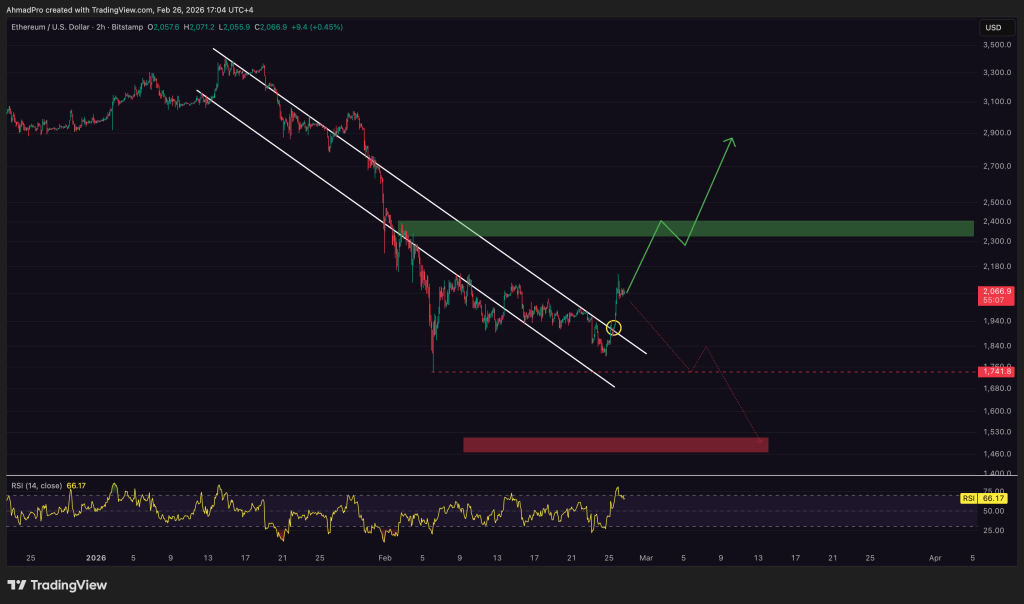
Momentum indicators are turning constructive. The 4 hour MACD has crossed bullish, and the Coinbase Premium flipping positive suggests U.S. buyers are stepping in.
Still, $2,080 is the short term level to watch. Lose it and a pullback toward $1,920 is possible to reset leverage. For now, the more likely scenario is consolidation above $2,000 before any attempt at the next expansion higher.
Discover: Here are the crypto likely to explode!
The post Wall Street Frontrunning Retail? Institutions Flooded Ethereum Before 15% Price Rally appeared first on Cryptonews.

Bitcoin (BTC) has rebounded 7.45% over the past two days after dropping to $62,400 on Tuesday, below a key onchain price support. Despite the bounce, holders who bought between six months and two years ago remain at an average cost of $74,500, a level that now stands as a potential inflection level.
As BTC moves higher, the concentration of supply around $74,500 stands as a key test for the current trend; a decisive reclaim of that level may signal demand and a shift in short-term market structure.
Why $74,500 matters to Bitcoin bulls
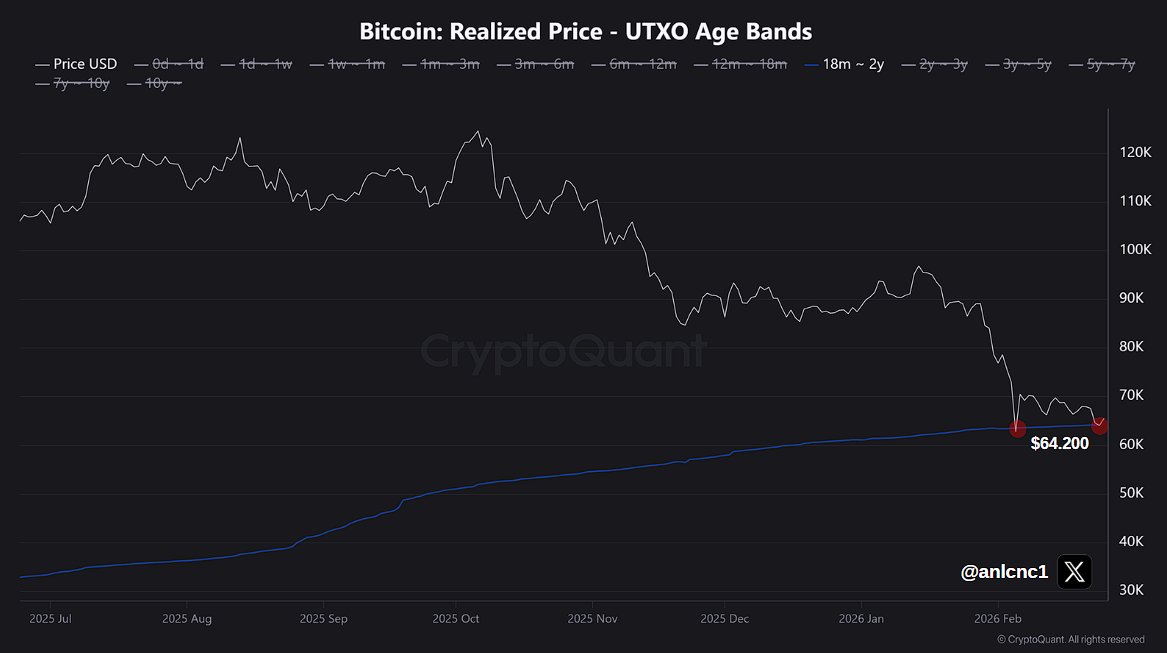
Bitcoin’s realized price tracks the average onchain acquisition cost for a given UTXO age band. For coins aged 18 to 24 months, that level stands near $64,200.
Crypto analyst Anıl noted that Bitcoin tested this threshold and reclaimed it by the daily close on Tuesday, keeping the zone intact for now.

Cost basis levels act as psychological pivots and when the price trades below them, investors face unrealized losses and the risk of distribution increases. A sustained position above the band tends to reduce investor stress and encourages BTC re-accumulation.
Expanding the lens to BTC UTXOs aged six months to two years captures investors from the prior cycle’s consolidation and breakout phases. The realized price for these cohorts is near $74,500, which is well above the current price.

The cohort’s MVRV ratio, which compares market value to realized value, now sits at 0.88. A reading below 1 signals that the group is, on average, holding at a loss.
As Bitcoin fell below $74,500, investors who bought between six months and two years ago moved into unrealized losses, turning that level into an important profitability threshold.
A sustained move back above $74,500 places much of this group back in aggregate profit, which may ease sell-side pressure from holders looking to exit near their breakeven price.
BTC long-term supply climbs to 3-month high
Onchain supply data from CryptoQuant shows that the long-term holder balance is back near 14 million BTC (13.96 million) after falling to a multi-year low on November 21, 2025. The recovery in the aged supply points to continued coin dormancy despite recent volatility.

If investors who bought between six months and 2 years ago choose to hold and absorb selling near their average entry price, the supply sitting between $74,500 and $100,000 may thin out more quickly.
A sustained rally above $74,500 may push a large portion of these coins back into profit, potentially shifting focus toward liquidity near $100,000.
Related: GD Culture Group board authorizes Bitcoin treasury sales
BTC realized cap and capital flows remain flat
An uptick in BTC’s realized cap, which measures the aggregate value of coins based on their last onchain movement price, may also signal a trend shift.
The metric is holding near cycle highs, though its rate of expansion has slowed. The realized cap net position change has compressed toward neutral or 0%, signaling that capital inflows are negligible.

While the realized cap remains near all-time highs, it is trending lower, indicating a slowing pace of new capital entering at the higher cost basis levels.
Historically, late bear market phases tend to show flat, or contracting realized cap, while early recoveries begin with stabilization before acceleration. A renewed expansion in the net position change back toward the 2–4% range may provide clearer confirmation that fresh capital is re-entering and that accumulation is on the rise.
Related: Bitcoin’s upcoming $10.5B options expiry may end bear market: Here’s how
This article does not contain investment advice or recommendations. Every investment and trading move involves risk, and readers should conduct their own research when making a decision. While we strive to provide accurate and timely information, Cointelegraph does not guarantee the accuracy, completeness, or reliability of any information in this article. This article may contain forward-looking statements that are subject to risks and uncertainties. Cointelegraph will not be liable for any loss or damage arising from your reliance on this information.

TLDR
- Telegram introduced in-app yield features for Bitcoin, Ether, and USDt through TON Wallet.
- Users can hold send, and earn crypto without leaving the Telegram chat interface.
- The vaults operate on DeFi infrastructure powered by Morpho TAC and Re7.
- Telegram allows users to keep full control of their funds through self-custody.
- USDt vaults offer dollar-denominated earning strategies with different risk levels.
Telegram has introduced yield features for major cryptocurrencies inside its messaging app. The update enables users to earn returns on Bitcoin, Ether, and USDt without leaving chats. The company integrated the tools into its self-custodial TON Wallet to simplify access to decentralized finance.
Telegram Integrates Bitcoin and Ether Vaults Inside TON Wallet
Telegram added vaults to TON Wallet, which operates within Wallet in Telegram. The vaults allow users to hold, send, and earn on Bitcoin and Ether directly in chats. The system processes transactions through a decentralized finance infrastructure while keeping a simple interface.
The platform relies on lending network Morpho, execution layer TAC, and strategy provider Re7. These tools run in the background, while users interact with a standard wallet layout. Wallet in Telegram plans to support direct deposits of native Bitcoin and Ether, which will appear in wrapped form inside the TON ecosystem.
The company said the vault strategies generate variable returns for Bitcoin and Ether holders. Users retain control of their assets through self-custody at all times.
A spokesperson stated, “We’re lowering the barrier to DeFi strategies by packaging advanced yield strategies in a product that is native to Telegram.”
USDt Vaults Expand Dollar-Denominated Earning Options on Telegram
Telegram also introduced USDt vaults that provide dollar-denominated earning strategies. The vaults offer different risk levels, and they operate within the same wallet interface. Users can access these features without using external wallets or network bridges.
Andrew Rogozov, CEO of The Open Platform and Wallet in Telegram, outlined the company’s objective. He said, “At Wallet in Telegram, our mission is to transform digital assets from complex concepts into practical tools for everyday life.”
He added that the platform aims to make onchain yield accessible inside a mainstream consumer app.
Wallet in Telegram stated that more than 150 million users have registered on the platform. The company said the goal is to simplify earning on crypto by removing technical steps. Earlier this month, the TON Foundation introduced TON Pay, which enables merchants and Mini App developers to accept cryptocurrency within Telegram.
Telegram reported $870 million in operating revenue for the first half of 2025. The company recorded a 65% increase from $525 million during the same period last year. It stated that about $300 million of that revenue came from exclusivity agreements tied to Toncoin.


On Thursday, Congress took a small but significant step toward ensuring America remains the best place in the world to build. Bipartisan legislation – the Promoting Innovation in Blockchain Development Act of 2026 – would protect software developers from being swept up under criminal code Section 1960, a statute designed for money laundering, not innovation. For builders working in good faith on open-source software, that legal gray zone has cast a chill on American competitiveness.
It is one bill. But the principle it embodies reaches further than any single piece of legislation – and it arrives at a pivotal moment.
As the United States approaches its 250th anniversary this July, it is tempting to look backward to commemorate milestones and celebrate triumphs. But America’s most consequential moments have rarely come from preservation alone. They have come from renewal: building new systems that allowed the country to adapt to a changing world.
Every American century has been defined not just by ideals, but by infrastructure. Canals and railroads powered industrial expansion. Telecommunications connected a continental economy. The internet reshaped commerce, culture and capital markets. Each era rewarded those willing to build.
Today, the next layer of infrastructure is taking shape in code.
Software developers are the architects of modern economic systems. They shape how money moves, how markets function and how people coordinate on a global scale. Unlike the builders of past eras, many are globally distributed and highly mobile – choosing where to work and innovate based on clarity, opportunity and regulatory environment. Open-source development allows anyone, anywhere, to contribute foundational code. That work has produced billions of lines of software that are collectively maintained and power modern commerce and coordination.
At the same time, the nature of financial infrastructure itself is evolving. Where previous generations built physical rails, today’s builders are creating digital rails – protocols that move value, establish trust and operate at internet speed. These layers increasingly underpin payments, financial services, identity and ownership.
One illustration of this transformation is the growth of the developer ecosystem building on Solana. According to the most recent Electric Capital Developer Report, Solana was the leading ecosystem for new developers in 2024, growing 84% year over year. The Solana ecosystem shows how fast, low-cost, open infrastructure attracts and retains talent willing to invest in solving real problems – from payments and decentralized finance to identity and decentralized applications at scale.
This is not about hype or token prices. It’s about where infrastructure gets deployed, and whether the builders of tomorrow, who write the code that defines digital markets, feel a country welcomes innovation or obstructs it.
Globally, governments are recognizing this reality. Several jurisdictions have moved forward with clear frameworks for digital assets and blockchain-based systems, providing developers and entrepreneurs with predictability. This sends a signal: building is welcome here.
In the United States, there are encouraging signs of progress beyond Thursday’s bill. Under the leadership of SEC Chairman Paul Atkins, the Commission is shifting from a posture defined primarily by enforcement toward one focused on engagement, clarity and constructive rulemaking.
Developers and market participants do not expect the absence of regulation – they expect rules that are understandable, durable and aligned with how modern technology actually functions. Recent efforts to engage industry, solicit public input and distinguish bad actors from good-faith builders are an important step toward restoring confidence that the United States intends to lead, not lag, in the development of digital financial infrastructure.
We have seen this dynamic before. The early days of railroads, aviation and the internet were marked by experimentation and ambiguity. Regulation followed innovation, not the other way around. That sequence was not a flaw; it was a feature of leadership. It allowed the United States to set global standards rather than inherit them.
As we look toward America’s next 250 years, the same principle applies. Protecting the freedom to build – especially in open, general-purpose technologies – is a core American value. Writing code, absent intent to harm, is a form of expression and exploration. A nation founded on free speech and enterprise should be cautious about criminalizing innovation simply because it is new.
This moment is also an opportunity to renew American leadership in capital markets. Blockchain-based systems enable faster settlement, broader participation and more resilient market infrastructure – an evolution some have termed “internet capital markets.” These ideas are not about overnight disruption, but about upgrading the rails beneath existing institutions so they remain globally competitive.
The question before us is not whether these technologies will shape the global economy. They already are. The question is whether the United States will lead its development – or watch as talent, standards, and capital consolidate elsewhere.
America’s founders did not assume their experiment would succeed forever. They designed it so future generations could improve it. As we celebrate our nation’s 250th year, we face a similar responsibility: not to preserve the past unchanged, but to ensure that future builders still see America as the best place in the world to build.
The next American century will be written in code. The choice we make now determines where that code gets written.

XRP price outlook leans towards a market reset amid falling open interest and a spike in realized losses.
Summary
- XRP has seen a sharp decline in recent sessions, pulling back over 60% from its 2025 high.
- Open interest has dropped across Binance, Bybit and Kraken, reflecting broad leverage reduction.
- A major realized loss spike and tightening volatility place price near a key technical inflection zone.
XRP (XRP) was trading at $1.39 at press time, down 5.4% over the past 24 hours, as the broader crypto market extended its February pullback.
The token has fallen 27% over the past week and is now down 38% year-over-year, marking a steep 62% retracement from its July 2025 all-time high of $3.65.
Price action throughout the month has been volatile. XRP saw brief upside bursts, including a roughly 6% rally tied to renewed institutional spot interest and ETF-related developments. Those gains were short-lived.
Selling pressure returned quickly, supporting the downtrend that has been in place since the $2.60–$2.80 region.
Lower highs and lower lows have defined the structure, and recent candles show the market attempting to stabilize after a sharp capitulation wick toward the $1.30 area.
Open interest drops as leverage unwinds
A Feb. 26 report from CryptoQuant contributor Arab Chain pointed to a steady contraction in XRP derivatives positioning. The 90-day open interest change metric shows that traders have reduced exposure across major venues.
Platforms such as Binance, Bybit, and Kraken have all recorded declines in open contracts over the past three months.
When open interest falls across several exchanges at once, it usually means leverage is being taken off the table. Positions are closed, risk is trimmed, and speculative liquidity leaves the market.
That type of contraction does not automatically point to another leg lower. In many cycles, the price first needs to flush excess leverage before it can form a more stable base.
On-chain data adds context. According to Santiment, XRP recently logged its largest realized loss spike since 2022. The last time weekly realized losses approached $1.93 billion, the asset rallied more than 100% in the months that followed.
Fear often drives investors to sell below their entry price, resulting in significant losses. Selling pressure may go down as fewer weak hands are left after a lot of holders leave.
There is no guarantee that the market will bounce back right away, but historically, these points happen close to major market turns.
XRP price technical analysis
On the daily chart, XRP remains in a downtrend, with lower highs forming consistently since late 2025. Recently, however, price behavior has changed. Instead of sharp red candles, the market is now consolidating within a tight range.
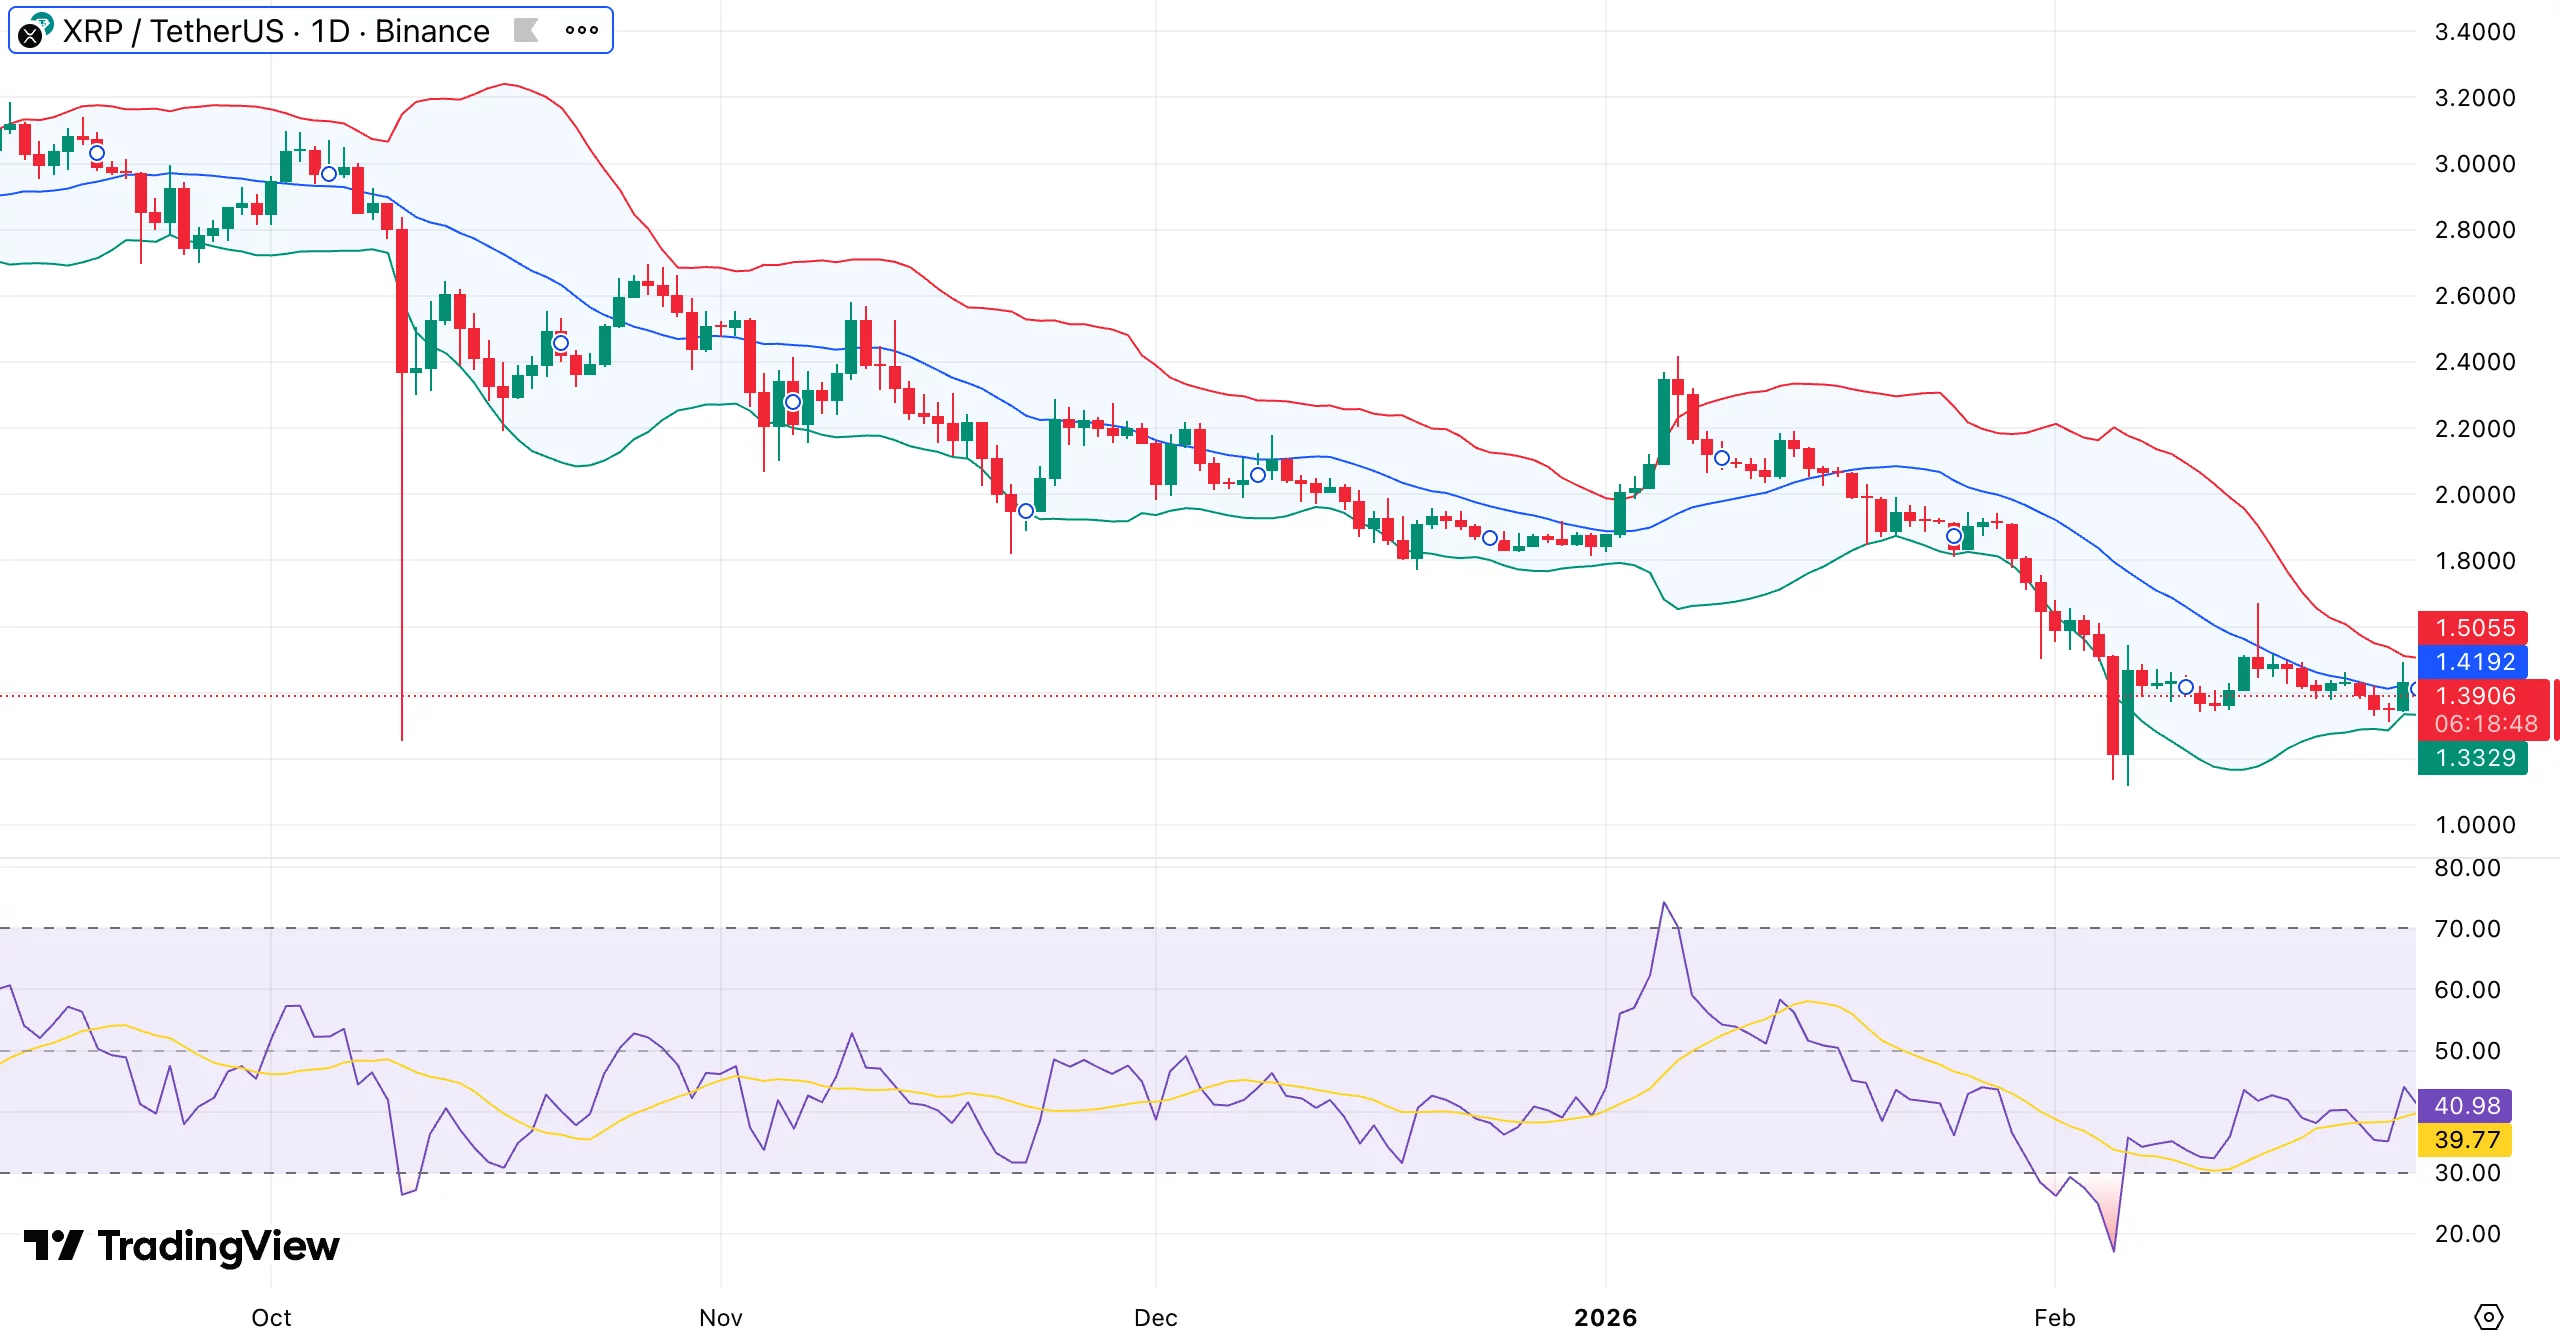
Bollinger Bands, which expanded during the selloff, have begun to contract. The price hovers near the 20-day moving average at $1.41, indicating a balance between buyers and sellers.
Momentum is starting to show signs of strain. The relative strength index has bounced back from oversold, but it is still below 50, which means that bulls haven’t fully taken over. A push above 50 would change the momentum in favor of buyers.
A volatility squeeze appears to be developing, and expansion is likely to follow. The $1.50–$1.55 area stands as the key resistance zone. A clean break and daily close above it would invalidate the most recent lower high and open room toward $1.65 and potentially $1.80.
On the downside, $1.33 remains immediate support, with $1.28–$1.30 acting as the structural floor from the recent liquidity sweep.

U.S. lawmakers and regulators are sharpening their focus on prediction markets as a high-profile insider-trading narrative unfolds around Polymarket and Axiom. At the center is a claim by on-chain investigator ZachXBT that an Axiom employee—Broox Bauer—and others allegedly used internal tools to access sensitive user data and execute profitable insider trades, a practice the researcher says may have persisted since early 2025. The timing is notable: Polymarket traders had placed large bets on the outcome of ZachXBT’s disclosures, with activity approaching tens of millions of dollars. In response, Axiom said it has removed access to the implicated tools and pledged to investigate and hold responsible parties to account, framing the episode as a test of governance and user protection within the evolving prediction-market ecosystem.
Key takeaways
- On-chain sleuth ZachXBT alleged that an Axiom employee, Broox Bauer, and others conducted insider trading by leveraging internal tools to access private user data, with the investigation dating back to early 2025.
- Axiom stated it has cut off access to the questioned tools and committed to an internal probe, stressing that the incident does not reflect the broader team or its user-first ethos.
- Polymarket bettors wagered nearly $40 million on the investigation’s outcome, with at least one user profiting about $400,000 and others winning more than $9.7 million on the contract asking which crypto company ZachXBT would expose.
- The episode arrives as U.S. regulators debate the proper reach of federal oversight over prediction markets, with CFTC Chair Michael Selig asserting exclusive jurisdiction and signaling potential clashes with state authorities.
- The case adds to a broader tightening of governance norms and data-access controls across crypto prediction platforms, underscoring regulatory risk and the need for transparent, auditable processes.
Market context: The unfolding events occur against a backdrop of ongoing regulatory scrutiny of prediction markets, where federal and state authorities have historically juggled distinct jurisdictions. The CFTC has stressed federal authority, while some states have pursued their own enforcement actions, creating a patchwork that operators must navigate as markets rely on on-chain data and user-submitted contracts.
Why it matters
The allegations touch on core governance questions for crypto-enabled prediction platforms. If internal tools can be leveraged to access user data for trading advantage, it raises serious concerns about user privacy, algorithmic transparency, and the integrity of market signals. Platforms that rely on public-facing interfaces for forecasting outcomes must demonstrate robust controls, independent audits, and clear incident-response playbooks to preserve trust among participants who treat these markets as both entertainment and hedged exposure to real-world events.
From a market-structure perspective, the episode illustrates how prediction markets intersect with fast-moving on-chain analytics. The ZachXBT disclosures, if verified, would imply a potential mismatch between platform-level governance and user expectations, potentially inviting regulatory actions if risk controls are perceived as lax or opaque. For investors and builders, the case underscores the importance of transparent data-access policies, strict separation between product tooling and private data, and incident disclosures that are timely and verifiable.
On the regulatory front, the scenario underscores the tension between federal authority and state initiatives in enforcement. The CFTC chair’s comments about exclusive jurisdiction suggest a preference for centralized oversight, which could influence how prediction-market platforms structure offerings, disclosures, and compliance programs going forward. Traders and operators should monitor not only the outcomes of internal investigations but also any subsequent regulatory guidance that clarifies permissible use of internal tools, data access, and administrative controls within prediction markets.
Ultimately, the incident matters because it tests the resilience of prediction markets as legitimate, auditable venues for price discovery on real-world events. If platforms fail to demonstrate robust safeguards, participants may migrate to environments with stronger governance or shifted risk profiles. Conversely, transparent corrective steps that restore trust—such as rapid suspension of the implicated tools, independent audits, and clear accountability measures—could reinforce the long-term appeal of crypto-enabled prediction markets as competitive and innovative financial infrastructure.
What to watch next
- Updates from Axiom’s internal investigation, including findings and any leadership actions taken against implicated personnel.
- Any formal statements or enforcement actions from U.S. regulators, particularly the CFTC, regarding prediction-market governance and data-access policies.
- Responses from Polymarket and other platforms about governance changes, risk controls, and disclosures in light of these revelations.
- Further disclosures from ZachXBT or other researchers that could corroborate or challenge the claims of insider trading and tool misuse.
- New disclosures or developments around the contract categories that speculated on the case, including volumes and settlement outcomes.
Sources & verification
- ZachXBT’s X post alleging insider trading by an Axiom employee and others (link: https://x.com/zachxbt/status/2027016064534757659).
- Axiom’s X post acknowledging the incident, stating access to tools has been removed and that the team will investigate (link: https://x.com/AxiomExchange/status/2027018976929423583).
- Polymarket bettors’ activity surrounding the ZachXBT insider-trading exposure, including bets near $40 million (link: https://cointelegraph.com/news/polymarket-bets-zachxbt-insider-trading).
- CFTC Chair Michael Selig’s remarks on exclusive jurisdiction over prediction markets (link: https://cointelegraph.com/news/cftc-michael-selig-defending-prediction-markets).
- Related coverage on Kalshi’s governance and insider-trading-related actions (link: https://cointelegraph.com/news/kalshi-booted-politician-youtuber-insider-trading).
Market reaction and key details
The contemporary disclosure cycle around insider-trading claims in crypto prediction markets marks a pivotal moment for the sector. As the industry grapples with how to regulate and supervise on-chain prediction activities, observers are watching closely how platforms respond to allegations of improper data access and trading influence. The rapid public responses from Axiom reflect a recognition that reputational risk in this space can translate into regulatory risk quickly, especially when user trust is at stake and the outcomes of investigations are uncertain.
Why it matters for users, builders, and the market
For users, the episode reinforces the importance of data governance, transparent tool access, and clear incident reporting. Any perception that insiders could exploit tools to gain an edge undermines confidence in the integrity of the market and may deter participation, especially from risk-averse traders who rely on credible price signals. For builders and operators, the episode highlights the value—and the cost—of implementing verifiable controls, independent audits, and robust user-privacy protections as a competitive differentiator in a crowded field of prediction platforms.
From a market-wide lens, the incident sits at the intersection of regulatory clarity and technological experimentation. The CFTC’s insistence on federal jurisdiction signals that there could be a stricter, more standardized framework for how prediction markets operate in the United States, potentially influencing product design, KYC/AML considerations, and inter-exchange cooperation. Participants should expect a period of heightened scrutiny across platforms as governance models evolve and as regulators balance innovation with the protection of market integrity and consumer data.
What to watch next
- Formal disclosures from Axiom detailing the investigation’s scope and any disciplinary actions.
- Regulatory updates or new guidance from the CFTC and state authorities on prediction-market governance and data access.
- Material changes to Polymarket’s or other platforms’ risk controls and user-privacy policies.
- Additional research or forensic findings from ZachXBT or other researchers that corroborate or challenge the claims.
Sources & verification
- ZachXBT’s X post alleging insider trading by a named Axiom employee and others (link: https://x.com/zachxbt/status/2027016064534757659).
- Axiom Exchange’s official comment and tool-access suspension (link: https://x.com/AxiomExchange/status/2027018976929423583).
- Polymarket bet coverage on ZachXBT insider-trading exposure (link: https://cointelegraph.com/news/polymarket-bets-zachxbt-insider-trading).
- CFTC leadership remarks on exclusive jurisdiction over prediction markets (link: https://cointelegraph.com/news/cftc-michael-selig-defending-prediction-markets).
- Related coverage on Kalshi’s enforcement actions and governance (link: https://cointelegraph.com/news/kalshi-booted-politician-youtuber-insider-trading).
What the investigation changes for the landscape of prediction markets
The case underscores the delicate balance prediction-market platforms must strike between enabling rapid, data-driven bets and enforcing robust controls that prevent misuse of internal tools. It also highlights the evolving role of on-chain researchers in surfacing governance and ethics concerns, and the extent to which platforms must respond quickly and transparently to preserve market integrity and participant confidence. As regulators intensify their focus, the sector will likely see accelerated moves toward standardized governance practices, clearer lines of responsibility, and more explicit privacy safeguards—elements that could determine whether prediction markets remain a vibrant, trust-worthy corner of the crypto ecosystem.
TLDR
- Morph will support native USDC issued directly by Circle’s regulated entities on its network.
- Morph will integrate Circle’s Cross-Chain Transfer Protocol to enable burn-and-mint USDC transfers.
- The integration removes reliance on wrapped USDC versions created by third-party bridges.
- Circle’s CCTP V2 will serve as the standard for cross-chain USDC movement on Morph.
- Morph launched a $150 million Payment Accelerator to support on-chain payment companies.
Morph has moved to support USDC and Circle’s Cross-Chain Transfer Protocol on its network. The integration centers on standardized dollar settlement for on-chain payment systems. The network confirmed it will issue native USDC through Circle’s regulated entities.
Morph Advances Stablecoin Settlement With USDC and CCTP
Morph confirmed that it will support USDC issued directly by Circle affiliates. The network stated that developers will access the official version rather than the bridged copies. This structure keeps redemption aligned with Circle’s regulated reserve framework.
USDC remains a digital dollar backed by cash and cash-equivalent assets. Circle redeems USDC one-to-one for U.S. dollars under its reserve model. Morph said this approach removes uncertainty tied to wrapped stablecoin versions.
Circle’s Cross-Chain Transfer Protocol enables USDC transfers through a burn-and-mint process. The protocol burns tokens on the source chain and mints them on the destination chain. Circle said this model avoids liquidity pools and wrapped bridges.
Morph plans to integrate CCTP V2 as the standard cross-chain framework. Circle has aligned its ecosystem around this version. The companies stated that the integration keeps supply integrity consistent across supported networks.
Morph said the system allows teams to separate funding sources from settlement chains. Developers can move USDC to Morph without converting it into synthetic assets. The network confirmed that balances will remain native after transfer.
Payment Infrastructure Focus Expands Across Ecosystem
Morph launched a $150 million Payment Accelerator to support on-chain payment companies. The program offers funding, technical support, and distribution resources. The network said it targets high-volume settlement platforms.
The accelerator focuses on gateways, remittance providers, and card-linked services. Morph stated that payment firms require predictable settlement assets. The network positioned USDC as the default settlement token within this initiative.
Card and neobank-style platforms often manage assets across several chains. However, settlement layers require stable balances on a single network. Morph said CCTP allows direct USDC movement without wrapped conversions.
Remittance and payout providers have increased stablecoin usage for cross-border transfers. Circle has expanded partnerships across the financial ecosystem for this purpose. Morph stated that native issuance improves reconciliation and tracking.
Payment gateways require consistent asset behavior across chains. Wrapped tokens can introduce variations in redemption paths. Morph said the official USDC reduces discrepancies during settlement cycles.
DeFi applications within the ecosystem also rely on predictable collateral assets. USDC supports lending, routing, and liquidity operations across networks. Morph confirmed that CCTP maintains uniform supply accounting.


Crypto influencers are taking a preprint, non-peer-reviewed research paper as a terrifying warning about a new unlock for AI agents that allegedly grants them power to deanonymize crypto wallets.
Almost all blockchains like Bitcoin and Ethereum employ pseudonymity in wallet addresses, which are usually presented as a string of characters.
Although wallet addresses are just a string of characters, AIs and easy-to-use agentic tools like Claude Cowork and Perplexity Computer are advancing the capabilities of casual users to deanonymize them.
According to their research, new versions of AI are gaining the power to conduct large-scale deanonymization by taking in posts by billions of humans and linking distinct usernames using highly-processed probability scores.
This is akin to making educated inferences that the person behind one username is likely the same person behind another username.
Researchers used Claude tools by the AI giant Anthropic. The paper is a preprint and as such hasn’t been accepted for publication in a peer-reviewed academic journal. However, its conclusions are potentially disturbing and reinforce concerns about crypto privacy.
Exploiting a common opsec error
Unfortunately, many people re-use the same crypto wallet addresses. Although this is bad practice from an operational security (OpSec) and privacy perspective, the commonplace occurrence allows researchers to glean and infer a tremendous amount of information.
Tracing and deanonymizing crypto has been popular for years at Chainalysis, Elliptic, TRM, Crystal, Coinglass, and Arkham.
However, the use of AI agents to easily link wallets to social and internet platforms is the breakthrough.
Users of Claude Cowork or Perplexity Computer are already asking AI to connect crypto wallets to activity elsewhere.
Read more: AI Agent BadCoin fumbles BSC launch, anti-sniping software flags traders
Four stages of AI deanonymization
Researchers automated hours of manual research by building a pipeline with four stages:
- In the “extract” step, AI agents searched for identity-relevant data from social posts that indicated interests and writing style. Importantly, the researchers used raw, unstructured text directly from social networks.
- The “search” step encoded the extracted data to perform “nearest neighbor” queries across tens of thousands of candidate profiles.
- Next, the “reason” phase applied multi-stage, LLM logic using ChatGPT to select the most likely match.
- Finally, the “calibrate” stage asked other AI models to double-check, error-correct, and assign confidence scores. This allowed the researchers to present their inferences as to which usernames across social networks were likely the same person.
Although researchers didn’t focus on crypto wallets specifically — they focused on linking Reddit, Hacker News, and LinkedIn profiles — the implications for crypto are obvious.
Most concerningly, their financial cost per deanonymization attempt was, in many cases, less than $4, putting the capability of deanonymization well within reach of even conservatively funded adversaries.
Mert Mumtaz, CEO of Helius Labs, amplified the research within the crypto community.
Blockchain transactions are visible to anyone. Although crypto is already accustomed to the use of machine learning, heuristics, and clustering algorithms to link wallet addresses to real-world identities by correlating on-chain behavior with off-chain data, this new research demonstrates how off-blockchain data sets like forum posts and social media activity are now exponentially larger in size and trivially automatable.
Got a tip? Send us an email securely via Protos Leaks. For more informed news, follow us on X, Bluesky, and Google News, or subscribe to our YouTube channel.


- The World Liberty Financial governance overhaul proposal proposes 180-day staking for voting rights.
- The WLFI price closely mirrors Bitcoin’s price and overall crypto market sentiment.
- The key WLFI price levels to watch are the support at $0.115 and the resistances at $0.120 and $0.1428.
World Liberty Financial (WLFI) is making headlines with a major governance overhaul proposal that could reshape how its token holders participate in the protocol.
The proposal requires all holders with unlocked WLFI tokens to stake them for at least 180 days to qualify for governance voting.
This is designed to encourage long-term commitment and reduce short-term speculation.
If the proposal passes, voting power will now take into account both the number of tokens staked and the remaining lock-up time.
Larger holders who commit for longer periods will have a stronger influence on protocol decisions.
In addition to staking requirements, the overhaul introduces a tiered reward system.
Token holders who stake and participate in at least two governance votes during the lock-up period can earn a roughly 2% annual yield.
These incentives aim to reward active governance engagement rather than just holding tokens passively.
WLFI is also integrating USD1 stablecoin usage into its reward framework. Stakers may receive additional benefits for depositing USD1 on the WLFI trading and lending platform.
Large stakers, designated as nodes or supernodes, will gain further privileges such as access to USD1 conversion services and priority partnership opportunities.
World Liberty Financial (WLFI) token price reaction
These reforms come as WLFI’s market performance reflects broader crypto trends.
The token currently trades at $0.1155, down about 2.9% over 24 hours, with a market cap of roughly $3.2 billion.
Notably, WLFI’s price action has closely mirrored Bitcoin’s recent 2.55% decline, as well as a 2.48% drop in total cryptocurrency market capitalisation.
This high correlation indicates that WLFI is behaving as a high-beta asset, amplifying broader market movements.
Market sentiment is notably negative, with the Fear & Greed Index indicating “Extreme Fear.”
Traders are watching Bitcoin’s price closely, as any significant move below $66,734 could drag WLFI lower.
Conversely, Bitcoin’s stabilisation above $66,000 may allow WLFI to consolidate near its current range between $0.115 and $0.12.
Technically, WLFI has found short-term support around $0.0994. Resistance levels have been observed at $0.1200, $0.1428, and $0.1632.
A sustained move above $0.1200 could pave the way for higher ranges, while failure to hold above support could trigger testing of lower levels near $0.11.
The token’s historical price volatility highlights both opportunities and risks.
It recently reached an all-time high of $0.3313 but has since declined more than 65%.
Its all-time low in recent weeks was $0.09831, showing that buyers have stepped in at sub-$0.10 levels.
WLFI price forecast
The governance overhaul adds a long-term bullish element, as staking reduces circulating supply and encourages sustained engagement.
However, WLFI’s price remains tethered to broader market trends, making Bitcoin and general crypto sentiment key determinants for its short-term trajectory.
The immediate support lies at $0.115, and a breakdown below this level may see WLFI test $0.11, especially if Bitcoin weakens further.
On the upside, breaking through $0.1200 could open the door to $0.1428, followed by $0.1632 if bullish momentum persists.
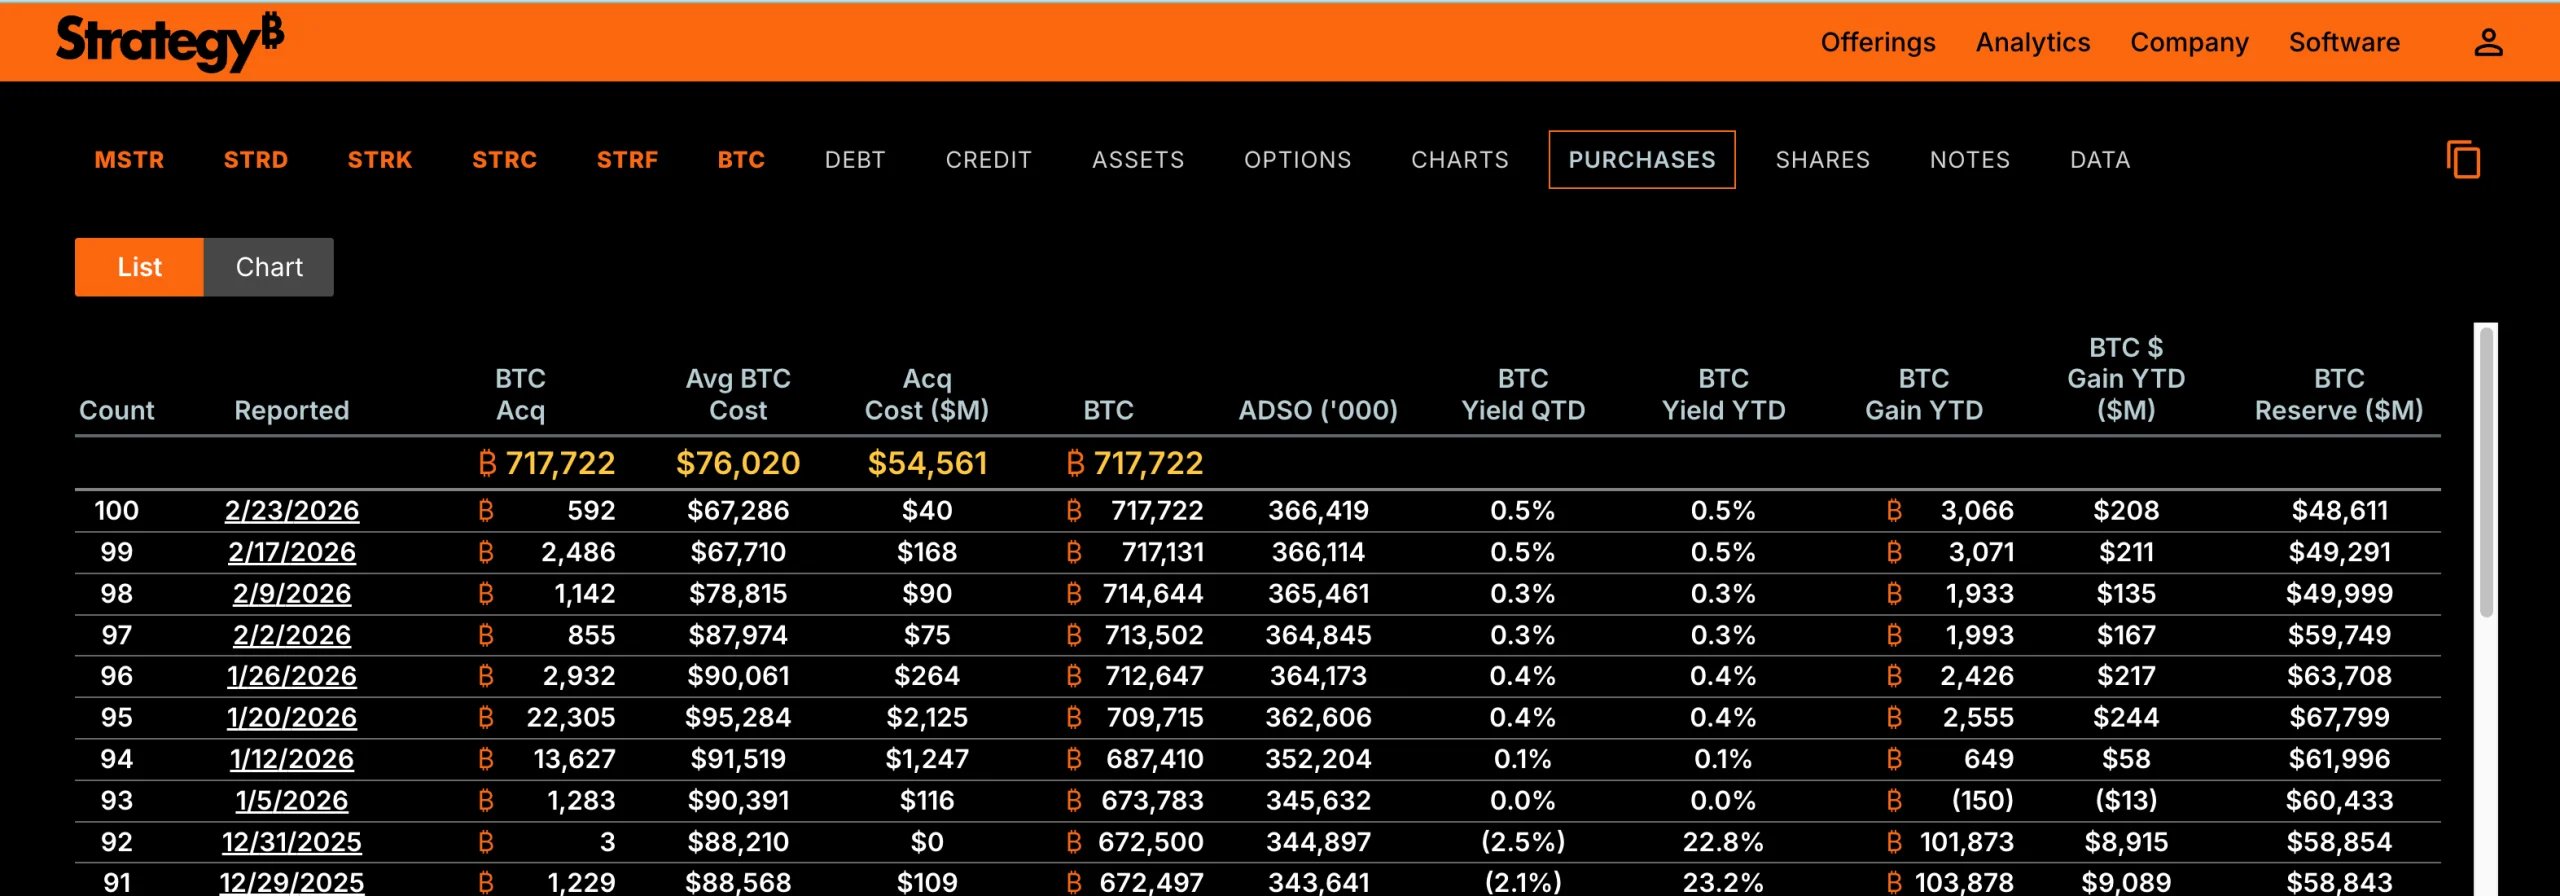
The MicroStrategy stock price couldn’t continue its upswing despite the company continuing to buy more Bitcoin. Its latest $40 million purchase, on February 23, came just as the stock began sliding again. But that wasn’t the entire story.
While MSTR stock dipped by over 9% on February 24, a 16% bounce followed on February 25, showing excitement. At press time, it’s down over 3% since yesterday’s close. The stock is now down about 4% from last Friday’s high and almost 63% over six months, raising fresh concerns about a deeper breakdown, all while the BTC stash was loaded again.
Latest $40 Million Bitcoin Buy Fails to Stop MSTR’s Slide
MicroStrategy added 592 Bitcoin on February 23, spending about $40 million at an average price near $67,286. This pushed its total holdings to 717,722 Bitcoin, with an overall average cost basis of $76,020.
Normally, such aggressive buying supports investor confidence because it signals long-term conviction in Bitcoin’s future.

Want more token insights like this? Sign up for Editor Harsh Notariya’s Daily Crypto Newsletter here.
But at this time, the MicroStrategy stock price continued to fall rather than stabilize, moving steadily on its bear-flag breakdown path that started on February 19, despite a few rebounds. This weakness closely reflects Bitcoin’s own behavior.
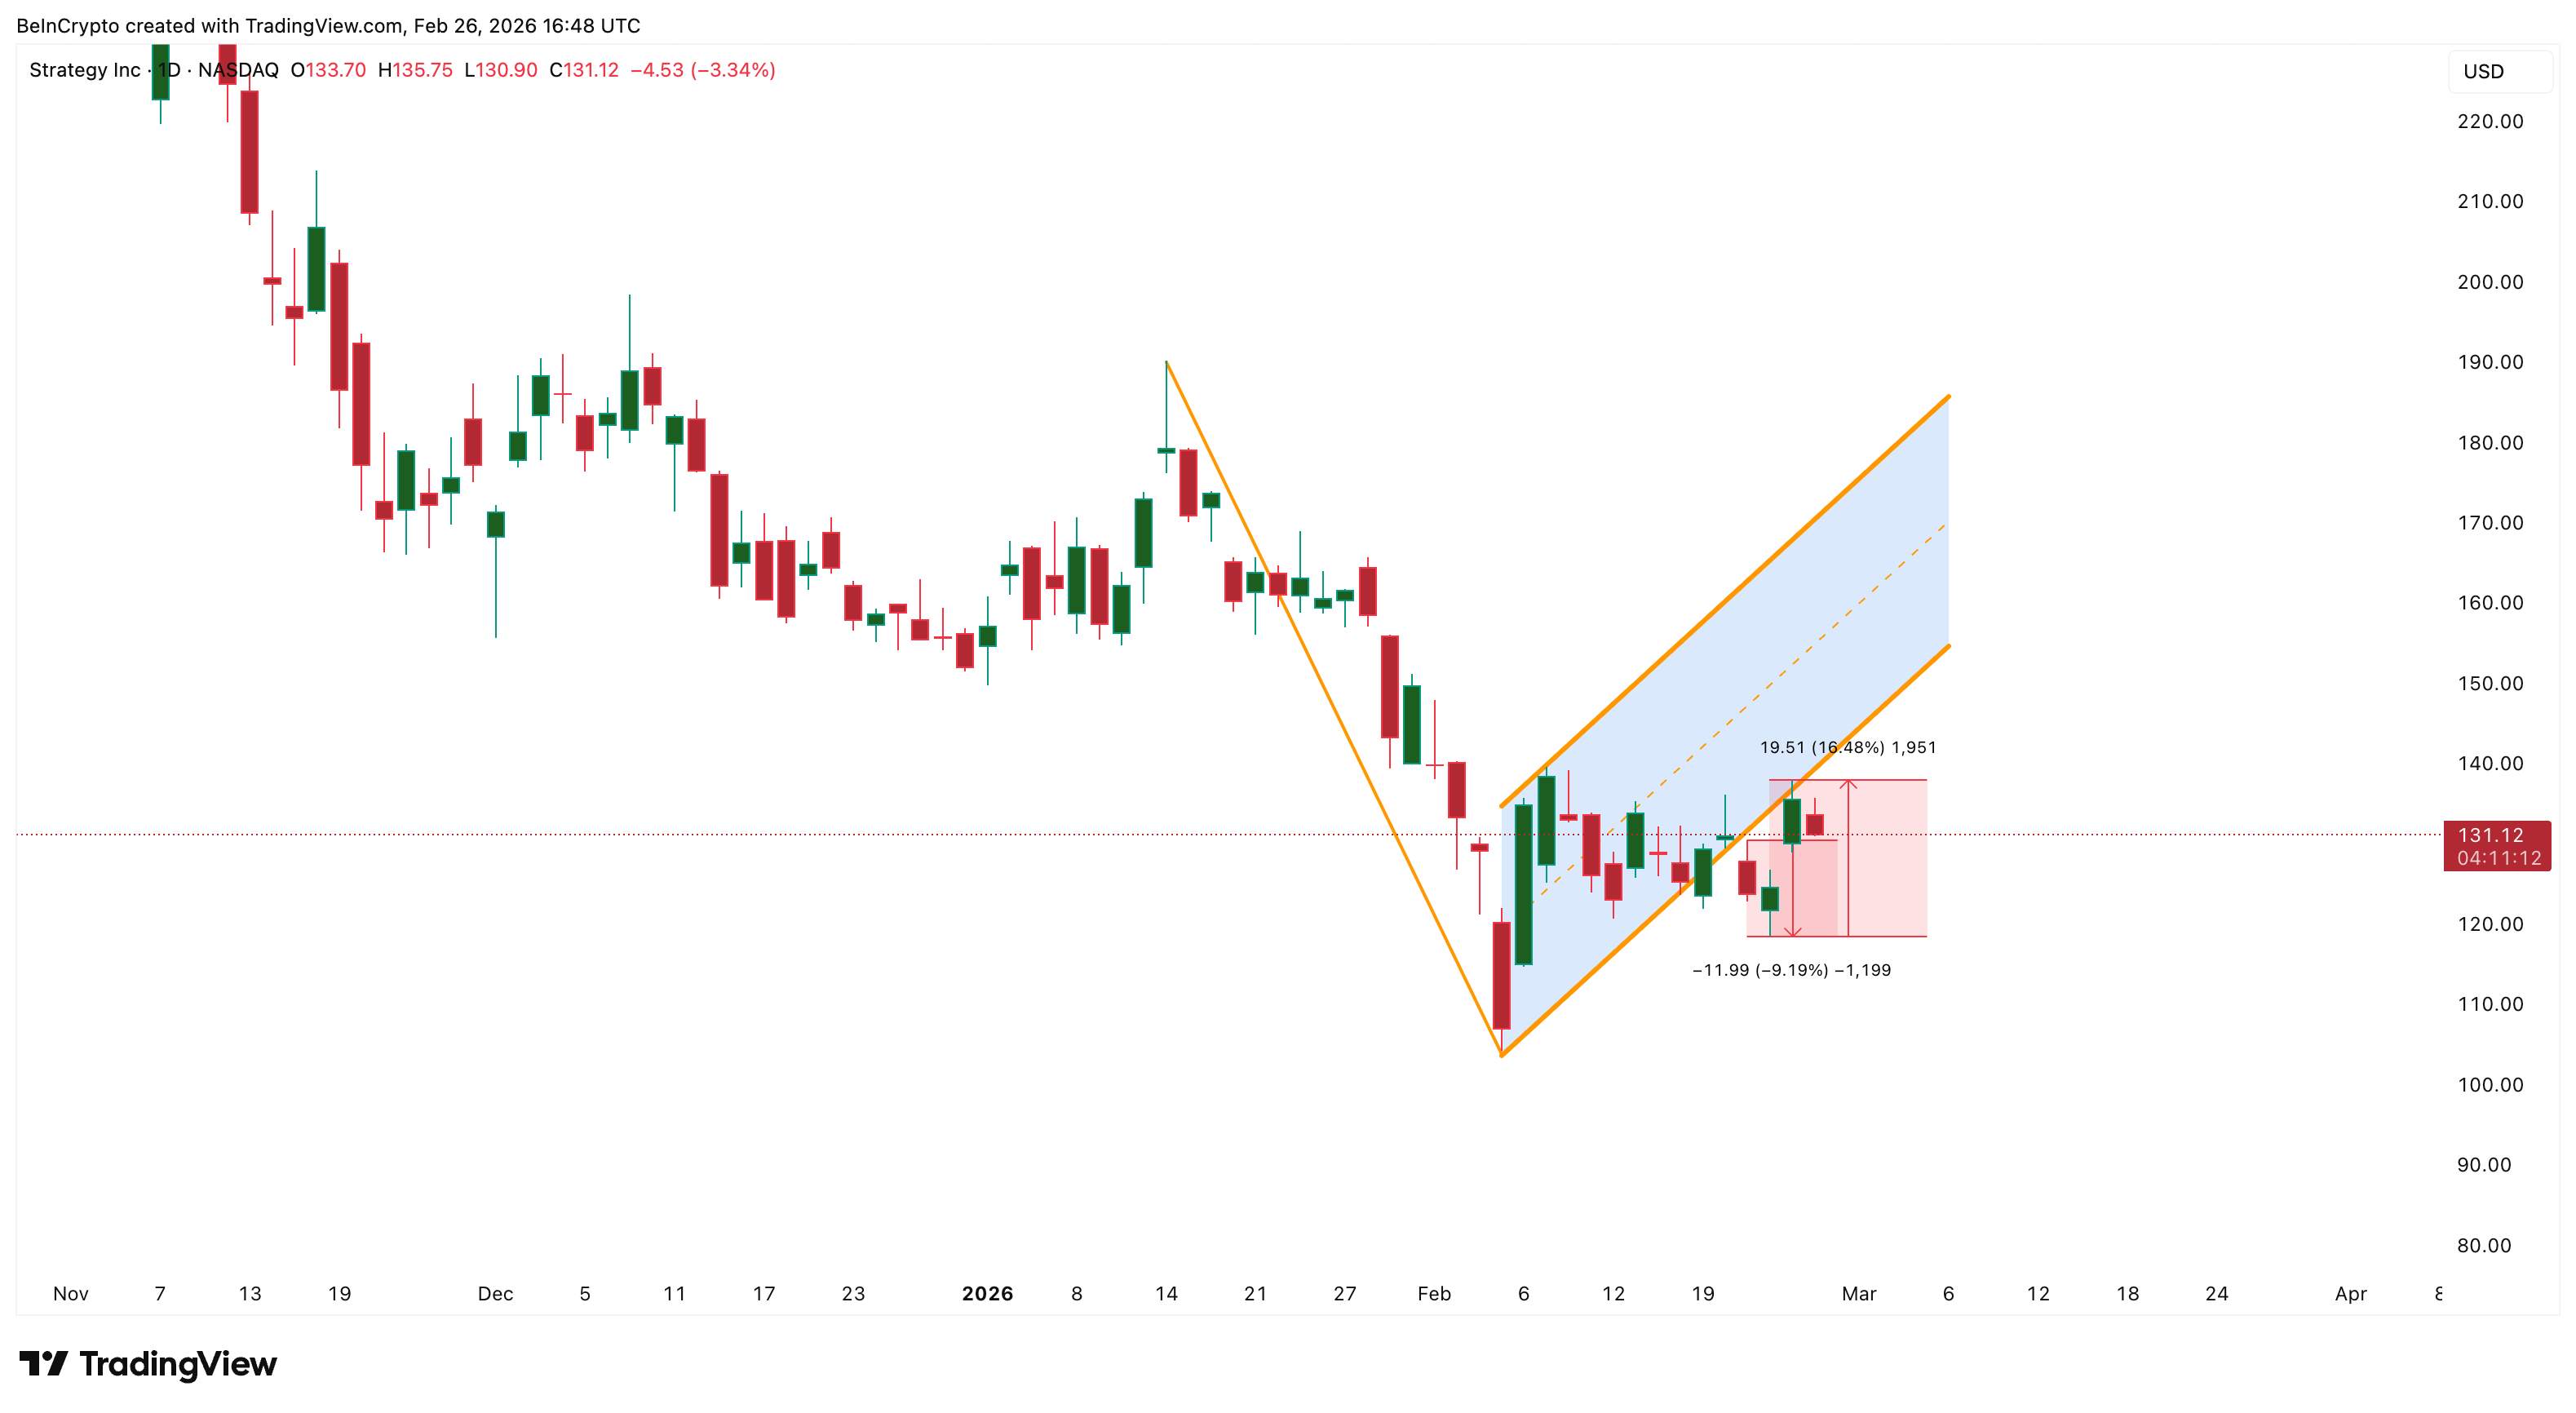
The stock had briefly rallied to $137 on February 25, riding Bitcoin’s rebound from $64,500 to $69,400, a 2.5% move. However, as Bitcoin cooled again, MicroStrategy immediately reversed lower, showing how tightly its performance remains tied to Bitcoin’s direction.
This shows MicroStrategy is still trading like a leveraged Bitcoin proxy. When Bitcoin pauses or weakens, MicroStrategy often falls faster because its valuation already assumes strong upside from its Bitcoin holdings.
The latest Bitcoin purchase did not change that dynamic, raising a more important question: whether institutional investors still support the stock.
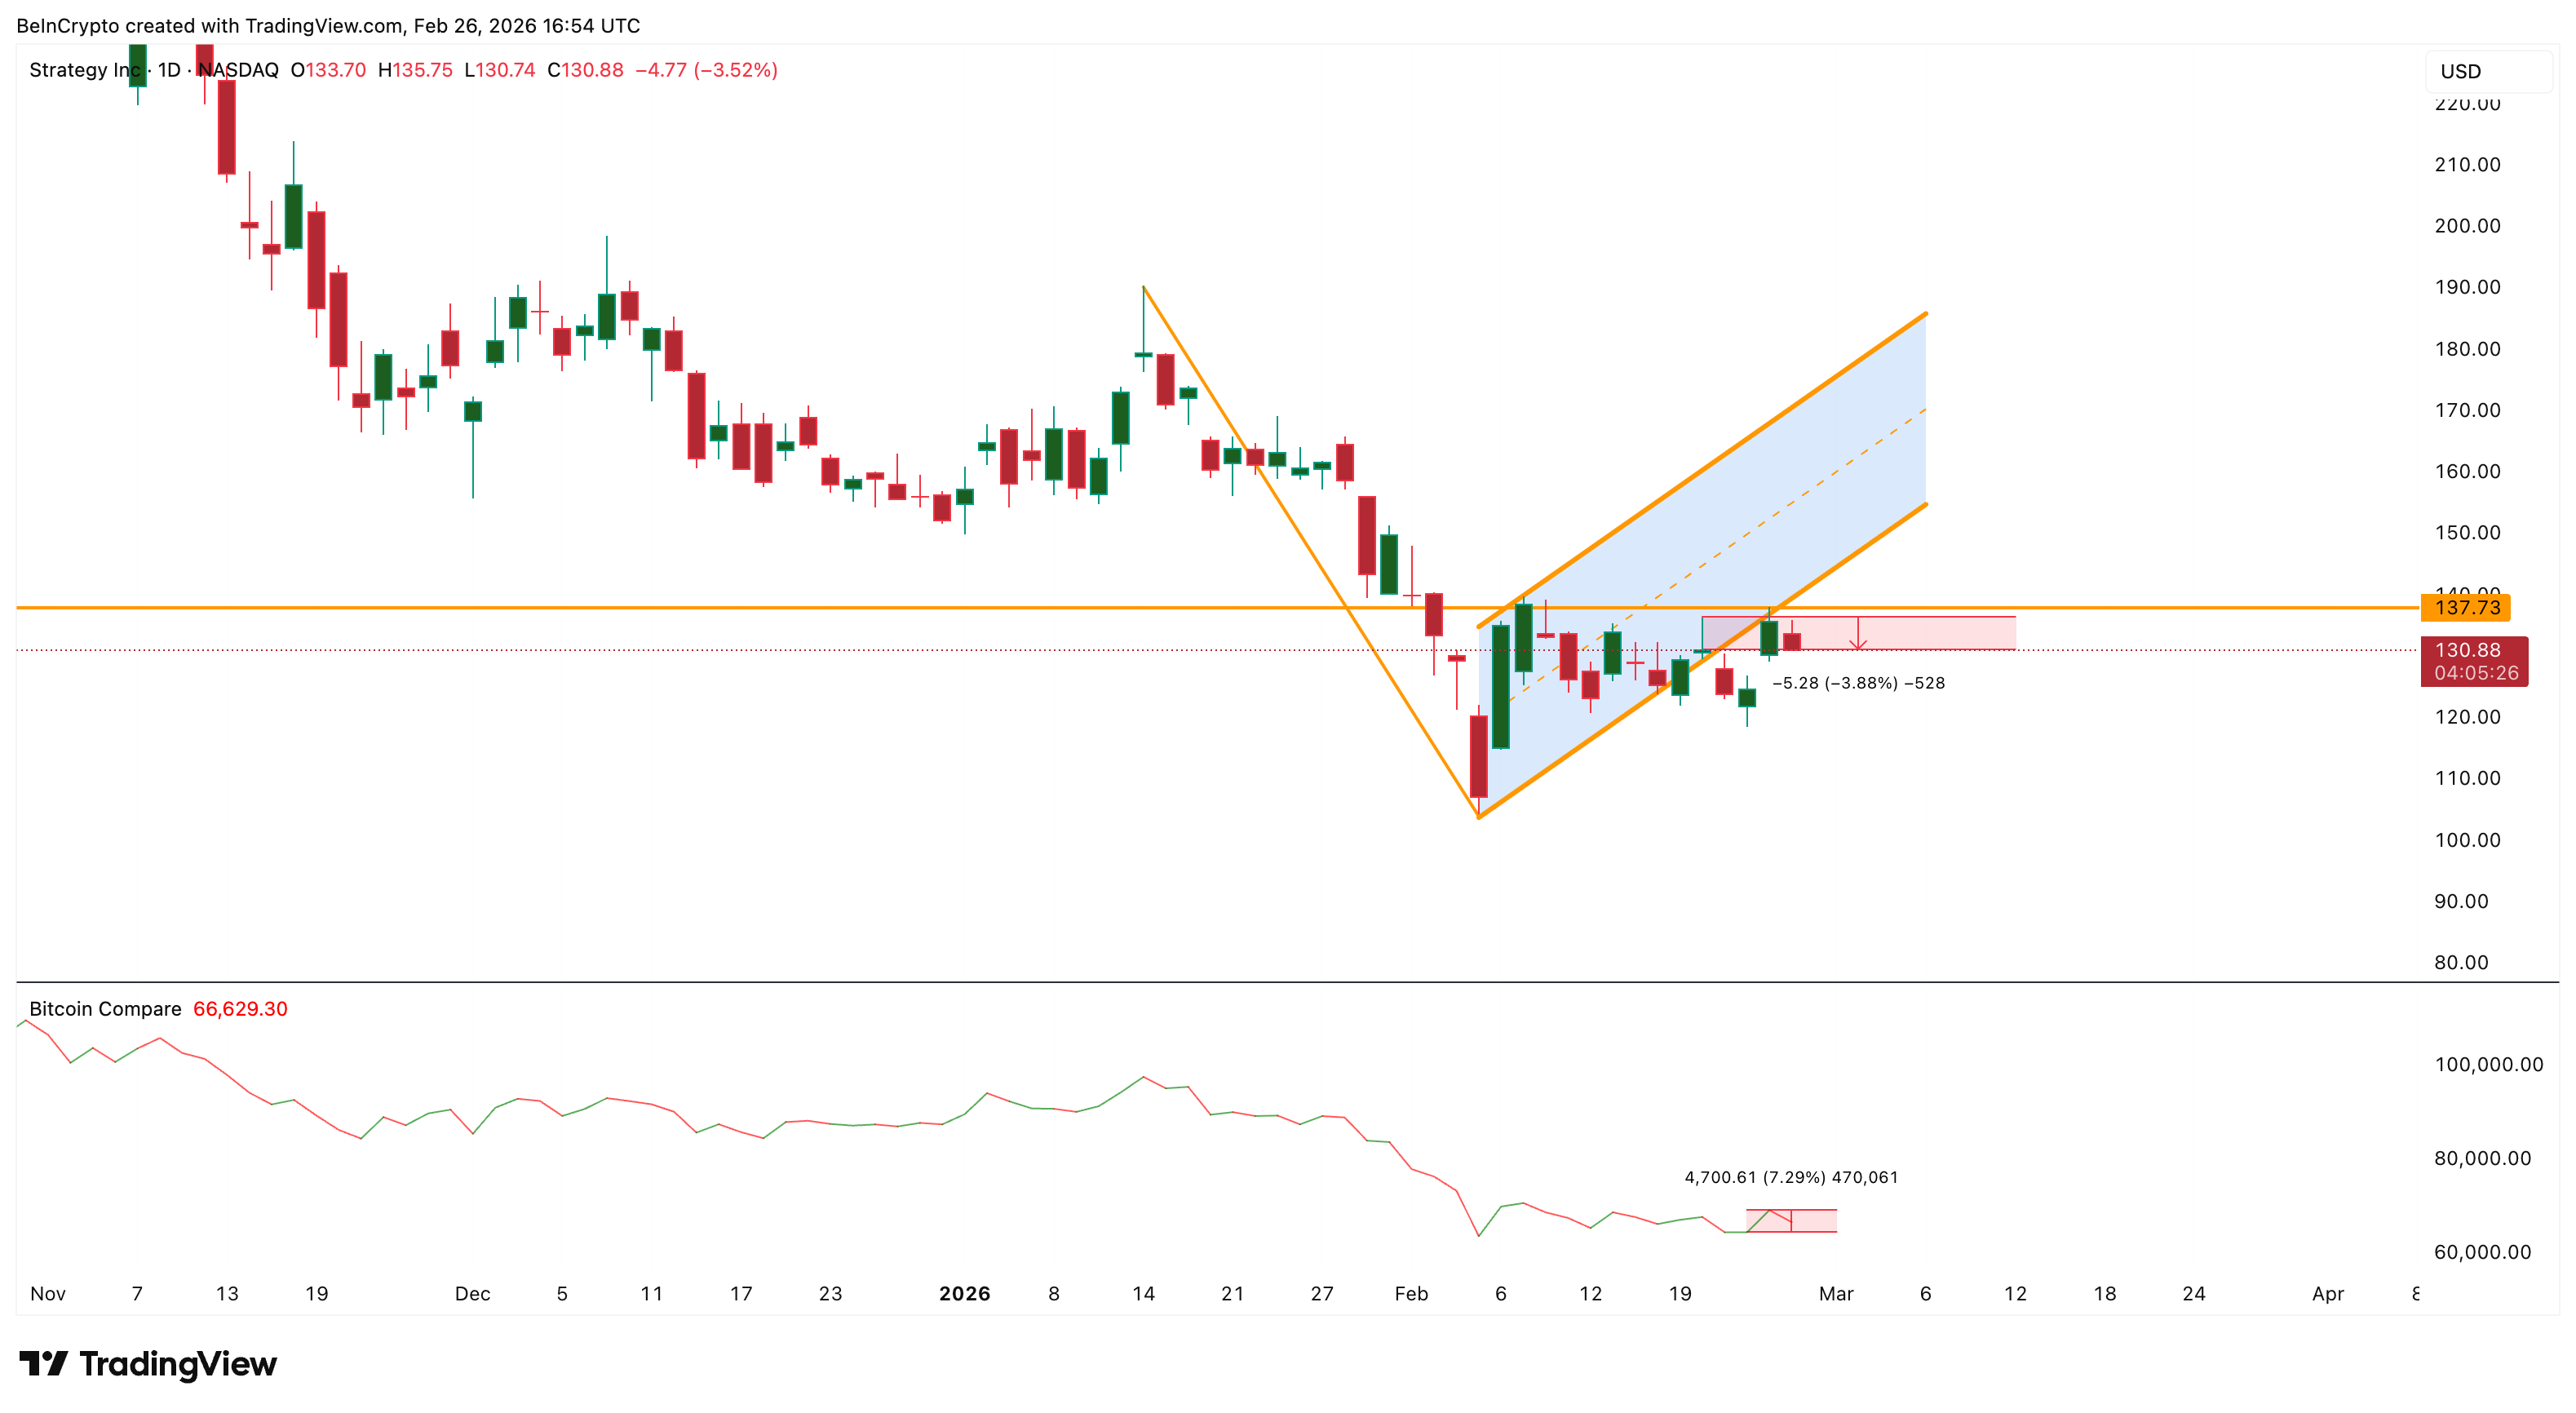
Institutional Money Flow Signals Growing Exit Risk
The Chaikin Money Flow (CMF) indicator is now flashing a warning sign. CMF measures whether large investors are buying or selling by combining price and volume.
When CMF rises above zero, it signals accumulation, meaning institutional investors are buying. When it drops below zero, it signals distribution, meaning capital is leaving the asset.
Earlier, between January 12 and February 23, CMF rose while MicroStrategy’s stock price fell, with a few bounces above the zero line. This bullish divergence showed that institutional investors were quietly accumulating shares during weakness. That accumulation even translated into net positive flows at times, leading to sizeable rebounds.
It even helped fuel a 33% rebound between February 5 and February 25. However, the situation is different now. The CMF has flatlined, hugging the zero line. This shows institutional money is undecided at the moment.
What’s troubling is that the shift happened immediately after MicroStrategy announced its latest Bitcoin purchase on February 23. CMF suggests institutional investors may not be accumulating MicroStrategy stock despite its Bitcoin buying.
This disconnect weakens the bullish case and suggests confidence in the stock itself may be fading. The next direction the CMF line takes might decide the fate of the MSTR stock price.
At the same time, momentum indicators show that the recent drop (between February 25 and February 26) was not unexpected, as underlying strength had already been weakening.
Bearish Divergence Warned of MSTR Stock Price Drop
The Relative Strength Index (RSI), which measures momentum strength on a scale from 0 to 100, showed a bearish divergence before the recent drop.
Between December 9 and February 25, the MicroStrategy stock price formed a lower high, while RSI formed a higher high. This pattern signals weakening momentum because the price is rising without strong buying support.
This type of divergence often appears before major pullbacks. Similar divergences have appeared multiple times in recent months, and each one led to sharp corrections.
For example, a previous divergence completed in mid-Jan triggered a 45% crash, forming the major downtrend that still defines the stock’s broader structure.
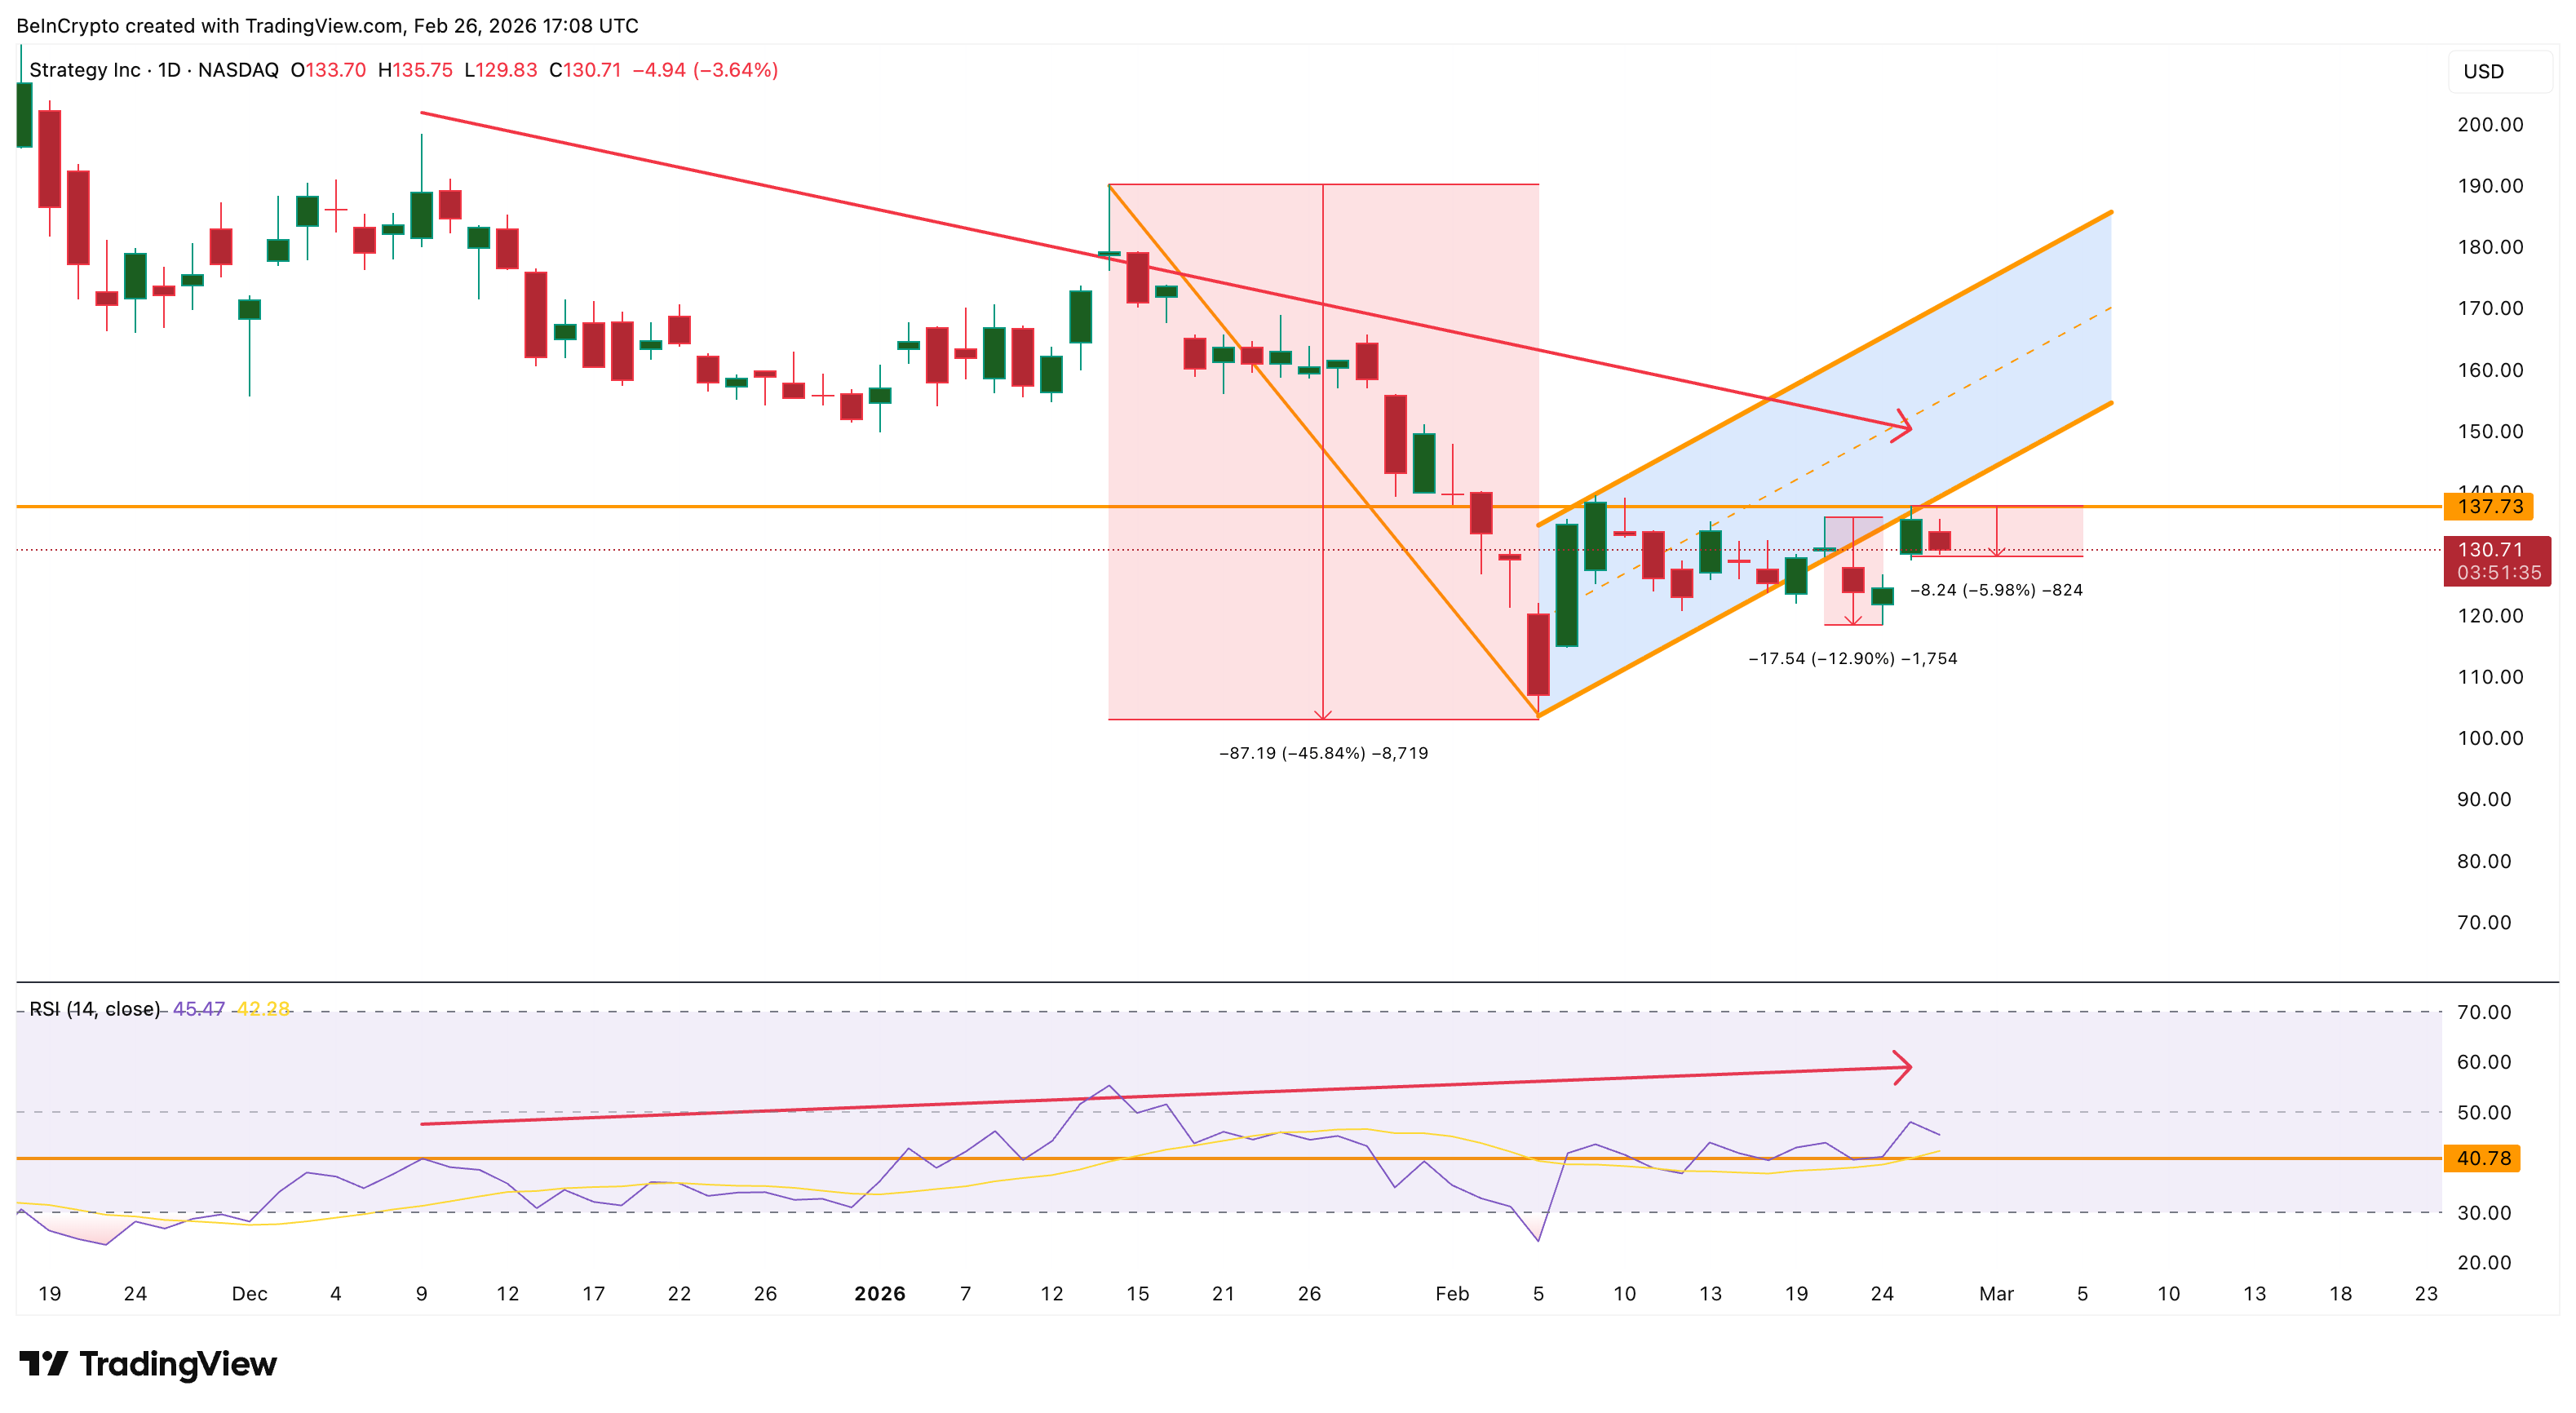
A recent one, concluding on February 20, led to a near 13% dip. The current one has already eaten into 6% of the gains, but because the broader bearish pattern remains active, this decline may be only the early stage of a larger move lower. That wouldn’t be great news for the MicroStrategy shareholders.
MicroStrategy Stock Price Breakdown Structure Points Toward $70
The MicroStrategy stock price has already broken below a bear flag pattern, which is a continuation pattern that forms during temporary rebounds inside larger downtrends. When this pattern breaks down, it usually leads to another strong leg lower.
Right now, the most important support level sits near $119. If this level fails, the next support appears near $106, followed by a stronger technical level near $85.
However, the full breakdown projection based on Fibonacci retracement levels points toward the $71 (the $70 zone) region, which aligns with the 0.786 Fibonacci level and pole’s projected 45%+ dip.
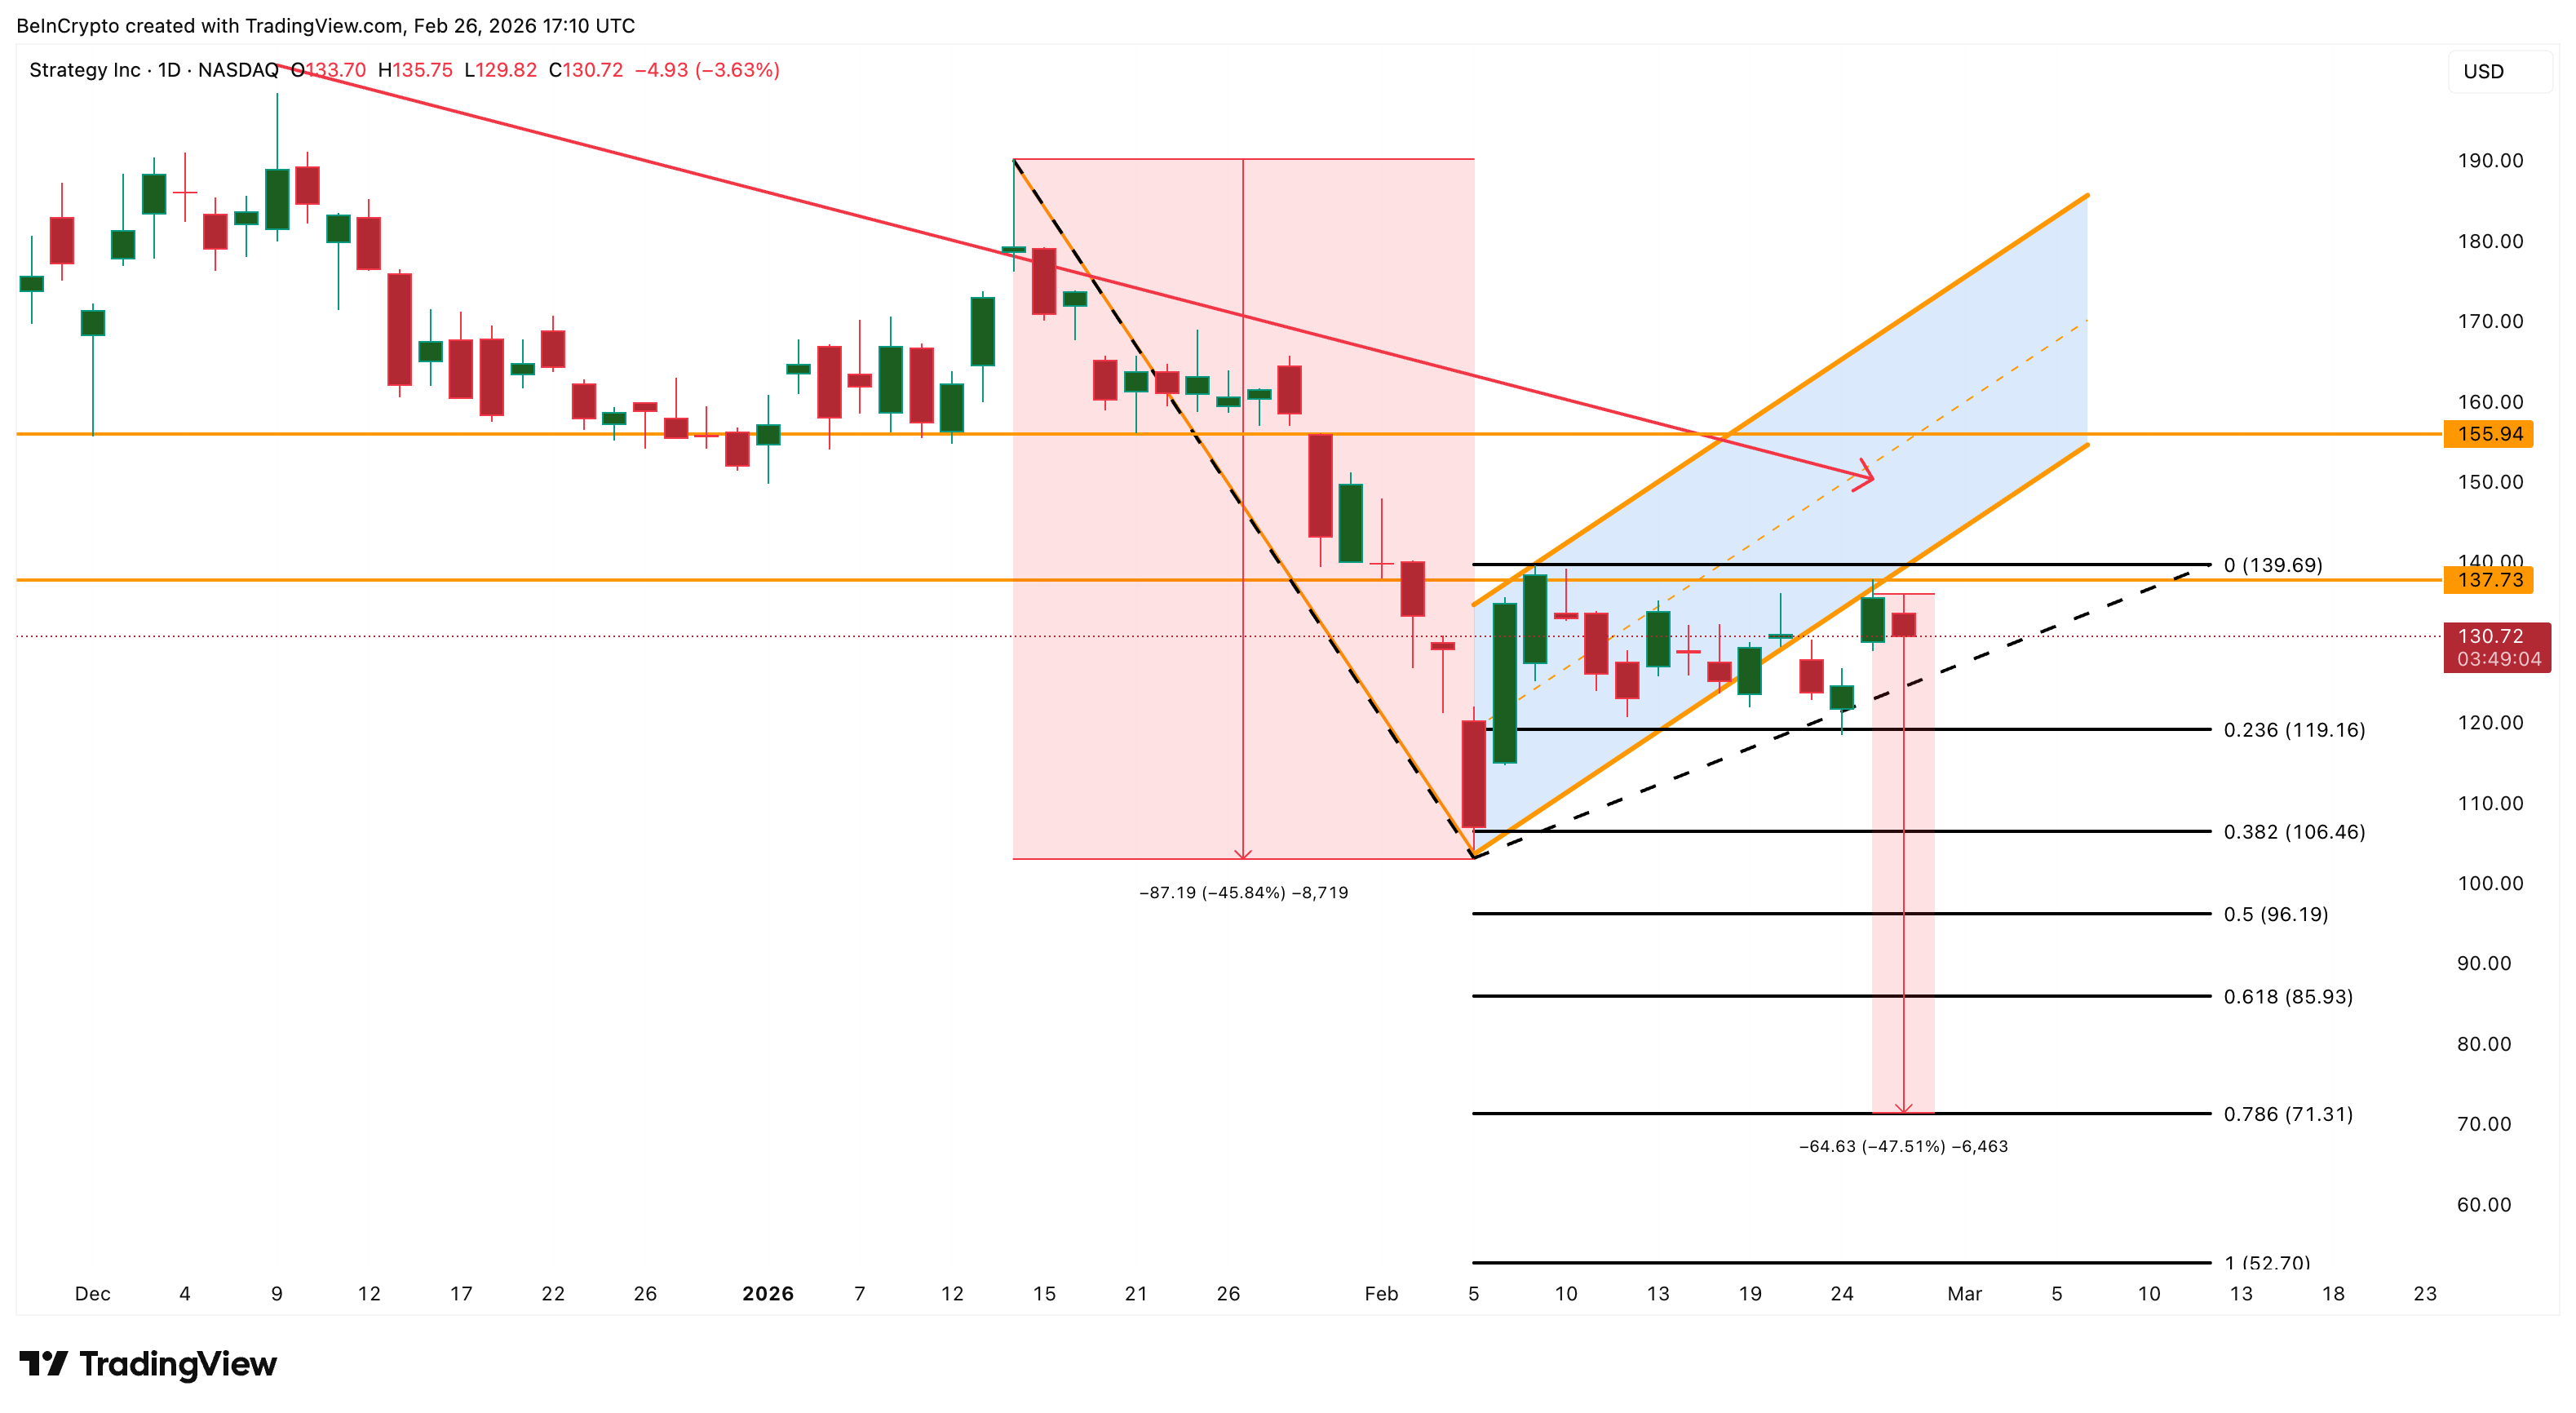
On the upside, the first sign of strength would only appear if MicroStrategy reclaims $139. However, the broader bearish structure would remain intact unless the stock breaks above $155, which would invalidate the breakdown pattern and signal a potential trend reversal.
Until those resistance levels are reclaimed, the current structure suggests MicroStrategy remains vulnerable to further downside, with the $70 zone now emerging as a realistic technical target if $85 gives way, given Bitcoin’s continued weakness.
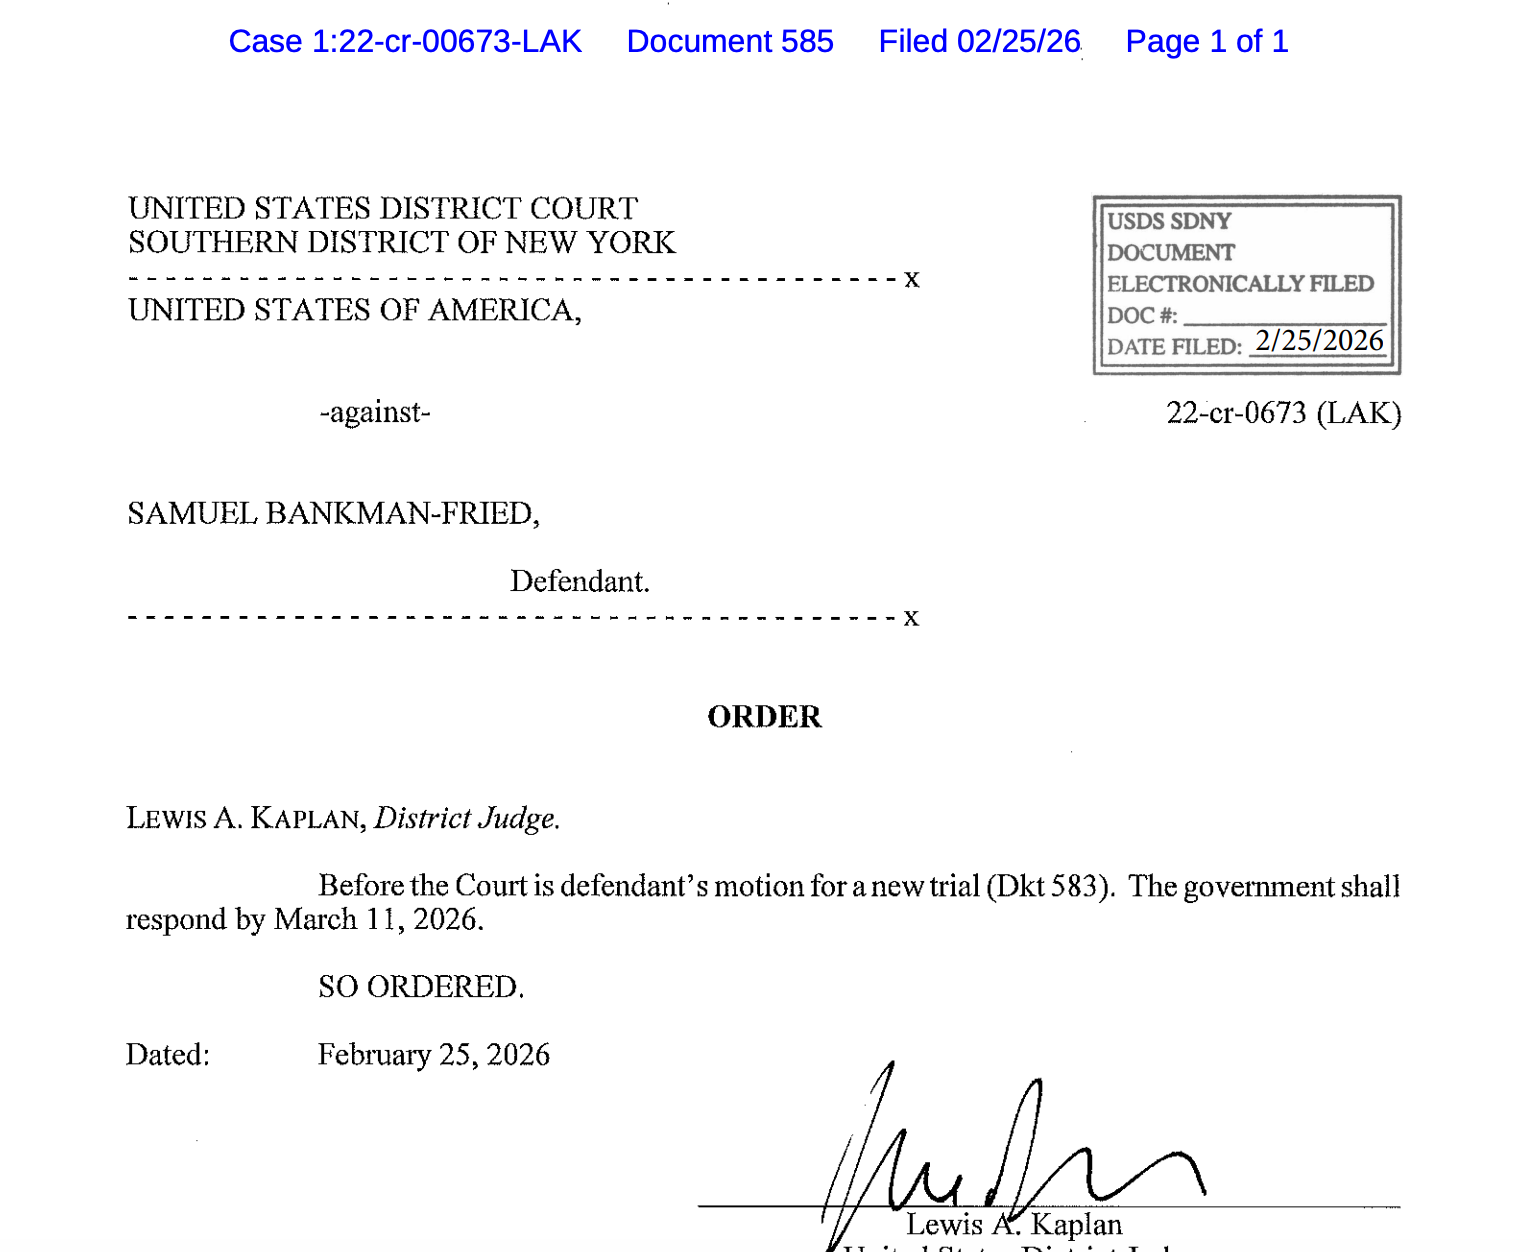
Lawyers representing the US government in the case against Sam “SBF” Bankman-Fried have two weeks to respond to the former FTX CEO’s motion for a new criminal trial.
In a Wednesday filing in the US District Court for the Southern District of New York, Judge Lewis Kaplan said that the US government shall respond by March 11 to SBF’s motion for a new trial. The former FTX CEO, who was convicted of seven felony counts in 2023 and later sentenced to 25 years in prison, requested a new trial earlier this month, claiming that new witness testimony could help bolster his case.

Bankman-Fried, once revered by many as one of the most prominent faces representing the crypto and blockchain industry, was at the center of the controversy around the collapse of FTX. He stepped down as CEO in November 2022, later facing criminal charges in the US for the misuse of user funds.
After Kaplan ordered the former CEO to serve 25 years in prison in March 2024, SBF’s lawyers filed to appeal the conviction and sentence. As of Thursday, the US Court of Appeals for the Second Circuit had not reached a ruling on the filing.
Related: Kalshi bans US politician over alleged insider trading violation
Former Alameda Research CEO Caroline Ellison, who testified against SBF at trial as part of a plea deal with US authorities, was released in January, having spent 440 days in US custody. Ryan Salame, the former co-CEO of FTX Digital Markets, was sentenced to more than seven years and remains incarcerated at the time of publication.
Is Bankman-Fried angling for a presidential pardon?
Although the former CEO was largely silent on social media for his first year in prison, Bankman-Fried later began posting messages supporting US President Donald Trump and challenging information about the collapse of FTX.
In March 2025, SBF gave an interview to political commentator Tucker Carlson — a move that reportedly led to his transfer to a federal correctional institution — claiming that he had better relationships with Republicans than Democrats.
This year, he has posted several times to X, claiming that there had been “political bias” in his case. Bankman-Fried praised Trump’s actions in “standing up” to such bias, while also criticizing Kaplan for overseeing the civil defamation case brought against the then-presidential candidate in 2023.

However, despite Bankman-Fried’s efforts and speculation by many in the crypto industry, the White House has repeatedly said that Trump is not considering a pardon for the former CEO, both in a January New York Times interview and according to a Tuesday report by Fortune. Trump has pardoned several figures in the crypto and blockchain industry since taking office, including former Binance CEO Changpeng Zhao and Silk Road founder Ross Ulbricht.
Magazine: Big questions: Should you sell your Bitcoin for nickels for a 43% profit?

Benfica deny reports Gianluca Prestianni admitted racially abusing Vinicius Jr

ITT Inc. (ITT) Presents at 36th Annual Pump, Valve, and Water Systems Symposium – Slideshow

Bitcoin Bull Market May Restart If $74.5K Is Broken


-

 Video7 days ago
XRP News: XRP Just Entered a New Phase (Almost Nobody Noticed)
-

 Politics5 days ago
Baftas 2026: Awards Nominations, Presenters And Performers
-

 Fashion6 days ago
Weekend Open Thread: Boden – Corporette.com
-

 Sports3 days ago
Women’s college basketball rankings: Iowa reenters top 10, Auriemma makes history
-

 Politics3 days ago
Nick Reiner Enters Plea In Deaths Of Parents Rob And Michele
-

 Business2 days ago
True Citrus debuts functional drink mix collection
-

 Crypto World3 days ago
XRP price enters “dead zone” as Binance leverage hits lows
-

 Business4 days ago
Mattel’s American Girl brand turns 40, dolls enter a new era
-

 Business4 days ago
Law enforcement kills armed man seeking to enter Trump’s Mar-a-Lago resort, officials say
-

 Tech2 days ago
Unsurprisingly, Apple's board gets what it wants in 2026 shareholder meeting
-

 NewsBeat20 hours ago
Cuba says its forces have killed four on US-registered speedboat | World News
-
 NewsBeat22 hours ago
Manchester Central Mosque issues statement as it imposes new measures ‘with immediate effect’ after armed men enter
-
 NewsBeat3 days ago
‘Hourly’ method from gastroenterologist ‘helps reduce air travel bloating’
-

 Tech4 days ago
Anthropic-Backed Group Enters NY-12 AI PAC Fight
-

 NewsBeat4 days ago
Armed man killed after entering secure perimeter of Mar-a-Lago, Secret Service says
-

 Politics4 days ago
Maine has a long track record of electing moderates. Enter Graham Platner.
-
 NewsBeat2 days ago
Police latest as search for missing woman enters day nine
-

 Business16 hours ago
Discord Pushes Implementation of Global Age Checks to Second Half of 2026
-

 Crypto World2 days ago
Entering new markets without increasing payment costs
-
 Sports3 days ago
2026 NFL mock draft: WRs fly off the board in first round entering combine week