
Crypto World
Web3 firm Boyaa targets $70M crypto expansion amid dip


Boyaa Interactive International, a Hong Kong-listed Web3 gaming firm, plans to expand its crypto treasury with up to $70 million in new purchases. The company will seek shareholder approval for the move, which comes as firms reassess crypto treasury strategies during a market downturn.
Summary
- Boyaa plans $70M crypto purchases, focusing on Bitcoin and Ether during market weakness periods.
- Firm holds $285M in crypto, ranking among top corporate Bitcoin treasury holders globally today.
- Strategy contrasts market trend as firms reduce exposure while Boyaa expands during crypto downturn.
Boyaa stated that it intends to deploy up to $70 million over the next year to grow its crypto holdings. The company said it aims to use “idle cash reserves during periods of weakness in the cryptocurrency market” to increase exposure. This approach focuses on buying during market dips rather than chasing rising prices.
The firm added that it will target assets with “good market liquidity, large market value, wide recognition on the market and relatively long-term holding value.” This suggests a preference for established cryptocurrencies such as Bitcoin and Ether rather than smaller tokens.
Boyaa already holds a large crypto treasury valued at nearly $285 million. This includes 4,091 Bitcoin worth around $280 million and 302 Ether valued at over $600,000. These holdings place the company among the top corporate Bitcoin holders globally.
The company began building its crypto position in 2024 as part of its transition into Web3 gaming. It invested $80.5 million in Bitcoin between August and November, showing a steady accumulation strategy tied to its long-term business plans.
In addition, Boyaa currently ranks as the 23rd-largest corporate Bitcoin treasury holder. It is also the third-largest in the Asia-Pacific region, behind Japan’s Metaplanet and China’s Next Technology Holding. This position reflects its growing role in the region’s digital asset space.
The expansion plan comes at a time when fewer companies are actively increasing crypto reserves. Some Bitcoin miners and firms have reduced holdings in recent months, reflecting caution across the market.
Market conditions and Web3 focus
The broader crypto market has declined by about 45% since October, creating a more cautious environment for treasury strategies. Boyaa’s plan to buy during weaker market conditions reflects a different approach compared to companies reducing exposure.
The firm continues to build its Web3 gaming ecosystem alongside its crypto investments. It has developed blockchain-based gaming products, including a Web3 version of its earlier Texas Hold’em platform that offers crypto rewards.


Key Highlights
- Bipartisan Senate legislation seeks to prohibit CFTC-overseen platforms such as Kalshi and Polymarket from facilitating sports wagering contracts
- Shares of DraftKings (DKNG) and Flutter Entertainment (FLUT) each climbed approximately 8% during premarket hours Monday
- The proposed legislation would additionally prohibit casino-style gaming products including slots, video poker, and blackjack on prediction platforms
- Senators Adam Schiff and John Curtis are jointly backing the measure — representing the first cross-party Senate initiative to regulate prediction markets
- Multiple states such as Nevada, Arizona, Massachusetts, and Michigan have already pursued independent legal challenges against Kalshi
Shares of DraftKings (DKNG) surged approximately 8% during premarket hours Monday following a Wall Street Journal report revealing that a bipartisan coalition of U.S. senators plans to unveil legislation banning prediction market platforms from facilitating sports betting contracts.
The development represented positive momentum for conventional sports betting companies, which have faced ongoing competition from platforms like Kalshi and Polymarket vying for the same sports gambling audience.
The draft legislation would prohibit entities under Commodity Futures Trading Commission (CFTC) oversight from listing contracts connected to athletic competitions. This would have a direct effect on Kalshi and Polymarket’s domestic operations — two prominent players in the prediction market space.
The proposal would further prohibit casino-style entertainment offerings on these platforms, encompassing slot machines, video poker, blackjack, and bingo games.
Sen. Adam Schiff (D., Calif.) stated that the CFTC is “greenlighting these markets and even promoting their growth,” further noting that “it’s time for Congress to step in and eliminate this backdoor which violates state consumer protections, intrudes upon tribal sovereignty and offers no public revenue.”
Joint sponsor Sen. John Curtis (R., Utah) described the matter as particularly relevant to his constituency. “Too many young people in Utah are getting exposed to addictive sports betting and casino-style gaming contracts that belong under state control, not under federal regulators,” he stated.
This represents the inaugural bipartisan Senate measure focused on prediction market oversight — a significant development in the escalating conflict between state authorities, federal agencies, and the platforms in question.
Flutter Entertainment (FLUT), parent company of FanDuel, similarly experienced an approximate 8% premarket increase following the announcement, as the legislation would eliminate a significant competitive challenge to its primary operations.
Ongoing Legal Confrontations
The congressional initiative arrives amid existing state-level actions against Kalshi. Nevada obtained a temporary restraining order preventing Kalshi from providing contracts related to sports, elections, and entertainment events.
Arizona escalated matters by filing criminal charges against Kalshi’s parent entities for purportedly conducting an unlicensed illegal gambling operation — though Kalshi has contested these allegations and called on the state to dismiss the charges.
Massachusetts and Michigan have both initiated lawsuits against Kalshi, contending that its prediction markets constitute unauthorized sports gambling activities. Polymarket has similarly filed suit against Michigan seeking to block enforcement of state gambling regulations against its platform.
On the federal front, the CFTC has asserted it possesses exclusive authority over commodities derivatives, including event-based contracts. In February, the agency submitted a brief to the Ninth Circuit defending this jurisdictional position.
Sports League Perspectives
Most prominent U.S. sports organizations have generally favored legalized sports wagering. However, their stance on prediction markets has been more nuanced — reflecting apprehensions about competition integrity and potential misuse of inside information.
Nevertheless, Major League Baseball recently entered into a licensing agreement with Polymarket, providing the platform access to league information while establishing collaborative monitoring of baseball-related wagers on the service.
DraftKings had not issued any official response regarding the proposed legislation as of Monday morning.


Key Highlights
- Share-based acquisition structure maintains proportional bitcoin exposure for all stakeholders.
- H100’s bitcoin treasury will grow to approximately 3,501 BTC upon deal closure.
- No shareholder dilution as transaction preserves bitcoin-for-bitcoin value.
- Acquisition adds systematic trading and hedge fund management expertise.
- Deal strengthens H100’s competitive position in European capital markets.
H100 has entered into a letter of intent for the acquisition of two Norwegian entities: Moonshot AS and Never Say Die AS. Under the terms of the agreement, H100 will issue new shares in exchange for the bitcoin assets held by both target firms. Once finalized, the transaction will bring H100’s total bitcoin holdings to roughly 3,501 BTC, reinforcing its status among Europe’s prominent publicly listed bitcoin treasury enterprises.
The agreement employs a bitcoin-for-bitcoin exchange mechanism, ensuring that existing shareholders maintain their proportional cryptocurrency exposure. This acquisition will provide H100 with an enhanced balance sheet and greater market significance. The strategic move is designed to advance H100’s presence in capital markets while safeguarding the fundamental bitcoin exposure across the shareholder base.
This deal introduces a seasoned team of technology and investment professionals to H100. Their specialized knowledge will integrate seamlessly with H100’s current treasury management and capital markets functions. The expanded network incorporates notable bitcoin industry veterans, strengthening H100’s strategic footprint within the cryptocurrency sector.
Deal Framework and Business Logic
The acquisition agreement between H100 and the Norwegian companies will be executed entirely through share issuance. Post-transaction ownership stakes in H100 will be determined solely by the amount of bitcoin each participating entity contributes. The structure ensures zero dilution of bitcoin exposure while simultaneously expanding the company’s financial scale.
Moonshot AS and Never Say Die AS collectively control approximately 2,450 bitcoin, whereas H100’s present holdings stand at roughly 1,051 BTC. The merged entity will command a bitcoin treasury exceeding 3,500 BTC, substantially enhancing H100’s asset base. This consolidation also positions H100 to access improved liquidity conditions and attract institutional investor interest.
H100 seeks to strengthen its operational capabilities in bitcoin acquisition and treasury oversight. With the addition of the target companies’ teams, the firm will advance its capital markets initiatives with enhanced resources. This acquisition strategy aligns directly with H100’s ambition to establish itself as the preeminent European publicly traded bitcoin treasury corporation.
Acquired Entities and Management Structure
Both Moonshot AS and Never Say Die AS specialize in bitcoin acquisition methodologies and investment portfolio management. These Norwegian firms are helmed by seasoned professionals who bring extensive experience in systematic trading operations and hedge fund administration. Their capabilities directly support H100’s extended-term bitcoin treasury objectives.
The target companies are owned by Geir Harald Hansen, who established the Bitminter mining pool. Throughout its operational history, Bitminter successfully mined more than 208,000 BTC, accounting for roughly 1% of bitcoin’s total circulating supply. This acquisition therefore imports substantial bitcoin market intelligence into H100’s organizational framework.
H100 will maintain its current management structure, with Johannes Wiik continuing as CEO and Sander Andersen remaining as Chairman. Key personnel from Moonshot AS and Never Say Die AS will join H100’s board of directors and management team. This organizational approach ensures business continuity while capitalizing on synergistic expertise to enhance the company’s competitive standing in the market.

Key Takeaways
- VST shares began trading 12.6% lower at $146.23 following weaker-than-expected quarterly results
- Quarterly earnings per share reached $2.18, missing the Street’s $2.45 estimate; sales totaled $4.58B against a $5.75B forecast
- Executive Vice President offloaded 10,000 shares on March 9th at a price of $160.31 per share
- Wall Street maintains a Buy consensus rating with a mean target of $236.87
- JPMorgan increased its target price to $240 from $239 while keeping an Overweight stance
Vistra Corp’s fourth-quarter financial results disappointed investors significantly. The energy company failed to meet both earnings and sales projections by considerable margins, triggering a sharp decline in share price at Monday’s market open.
Shares of VST commenced trading at $146.23, representing a 12.6% decline for the session. This marked a substantial retreat from the stock’s 50-day moving average of $163.60 and an even more pronounced distance from its 200-day moving average of $177.24.
The financial results painted a clear picture. The company reported fourth-quarter earnings per share of $2.18, undershooting analyst projections of $2.45. Quarterly revenue registered at $4.58 billion, substantially below the anticipated $5.75 billion. The company’s net profit margin came in at 5.32%.
Considering the stock’s 12-month trading pattern provides perspective on the selloff. VST has fluctuated between $90.51 and $219.82 throughout the past year, indicating that despite the painful decline, shares remain considerably elevated from their 52-week floor.
Wall Street’s Perspective
Notwithstanding the earnings shortfall, financial analysts maintain their optimistic stance on the stock. The prevailing consensus rating stands at Buy, with analysts projecting an average price target of $236.87 — representing significant upside from current trading levels.
JPMorgan revised its financial model following the earnings release and slightly raised its price target to $240 from $239, maintaining an Overweight designation. Goldman Sachs elevated VST to Buy status in February, establishing a $205 price objective. Jefferies similarly upgraded the stock to Buy during the same period, setting a $203 target.
Bank of America reduced its target from $231 to $218 while preserving its Buy recommendation. Scotiabank maintains a $293 target accompanied by an Outperform rating. Among the firms providing coverage, three assign a Strong Buy rating, twelve recommend Buy, and one maintains a Hold position.
Analysts project Vistra will generate $7 in earnings per share for the complete fiscal year.
Share Transactions and Shareholder Returns
Significant insider trading activity occurred prior to the earnings announcement. EVP Stephanie Zapata Moore disposed of 10,000 VST shares on March 9th at an average transaction price of $160.31, generating proceeds of approximately $1.6 million. Following the transaction, she maintains ownership of 114,409 shares.
Vistra announced a quarterly dividend distribution of $0.228, scheduled for payment on March 31st to shareholders registered as of March 20th. This represents a marginal increase from the previous quarterly payment of $0.23. On an annualized basis, this equals $0.91 per share, translating to approximately 0.6% yield. The company’s dividend payout ratio stands at 41.94%.
Regarding institutional ownership, multiple investment firms expanded their positions during the fourth quarter. Teamwork Financial Advisors boosted its stake by 39.9%, acquiring an additional 22,492 shares for a total holding of 78,855 shares, valued at $12.72 million at quarter’s conclusion. Procyon Advisors expanded its position by 395.2%. Harbor Investment Advisory surged 495.7% in its ownership, albeit from a modest starting point. Institutional investors collectively control 90.88% of outstanding shares.
The company’s financial structure carries considerable leverage. Vistra operates with a debt-to-equity ratio of 6.01, maintains a current ratio of 0.78, and trades at a price-to-earnings ratio of 67.39. The company’s market capitalization totals $49.51 billion.

Key Highlights
- Elon Musk revealed “Terafab,” an ambitious semiconductor manufacturing venture in Austin, Texas, uniting Tesla, SpaceX, and xAI
- Two distinct chips will be manufactured — one for Tesla’s cars and Optimus robots, another for space-based AI satellites
- According to Musk, current worldwide chip production satisfies merely 3% of his companies’ projected requirements
- First chips expected in late 2027, with full-scale manufacturing planned for 2028
- Tesla shares declined approximately 2–3% during premarket hours following the revelation
Elon Musk revealed ambitious plans for a substantial semiconductor manufacturing operation dubbed “Terafab” over the weekend, confirming it as a collaborative effort among Tesla, SpaceX, and xAI. The disclosure triggered a decline in Tesla’s stock price during Monday’s premarket session.
The announcement took place at a decommissioned power facility in Austin, Texas. Musk characterized Terafab as comprising two distinct manufacturing plants, each dedicated to producing a unique chip architecture.
The first chip will serve Tesla’s automotive fleet and the Optimus humanoid robot platform. The second will support AI processing in orbital environments, engineered to withstand extreme conditions and elevated operating temperatures.
According to Musk, current worldwide semiconductor manufacturing capacity would fulfill just 3% of what his enterprises will ultimately require. While acknowledging Samsung, TSMC, and Micron as existing suppliers, he emphasized that future demand will surpass total global production capabilities.
The “Terafab” designation reflects Musk’s ambition to manufacture chips requiring one terawatt of power consumption — approximately equal to one billion Nvidia Blackwell processors annually.
SpaceX’s participation came as a surprise to many observers. The aerospace company, which recently consolidated with xAI, is gearing up for a public offering that analysts estimate could reach a $1.75 trillion valuation.
Financial Investment and Production Timeline
Early-stage development will demand tens of billions in capital expenditure. Tesla has already earmarked approximately $20 billion for new equipment purchases in 2026, a significant increase from the sub-$9 billion spent in 2025. Terafab investments are separate from these existing allocations.
Musk’s timeline calls for initial chip production in late 2027, ramping to maximum output throughout 2028. As reference, semiconductor fabrication plants generally require roughly three years from construction start to volume production.
Musk indicated Terafab will ultimately deliver one terawatt of computational power annually. To put this in perspective, the entire U.S. currently generates approximately half that capacity.
Space-Based Computing Takes Priority
One notable revelation: Musk projects that 80% of Terafab’s production will support space-based artificial intelligence computing. SpaceX intends to replicate in orbit what cloud computing giants currently perform in terrestrial data centers.
The facility will concentrate on two-nanometer process technology, representing the cutting edge of current semiconductor manufacturing.
Tesla’s stock price fell roughly 3.2% on Monday. The company entered the week with an 18% year-to-date decline, though maintaining a 48% gain over the trailing twelve months.
Shares currently trade at approximately 190 times projected 2026 earnings, with market valuations incorporating anticipated AI-driven revenue from autonomous taxi services and robotics divisions.
Tesla initiated its robo-taxi program in Austin during June but has yet to expand operations to additional markets. The company is simultaneously developing a third-generation Optimus robot.
Musk has not announced a specific construction start date for Terafab.
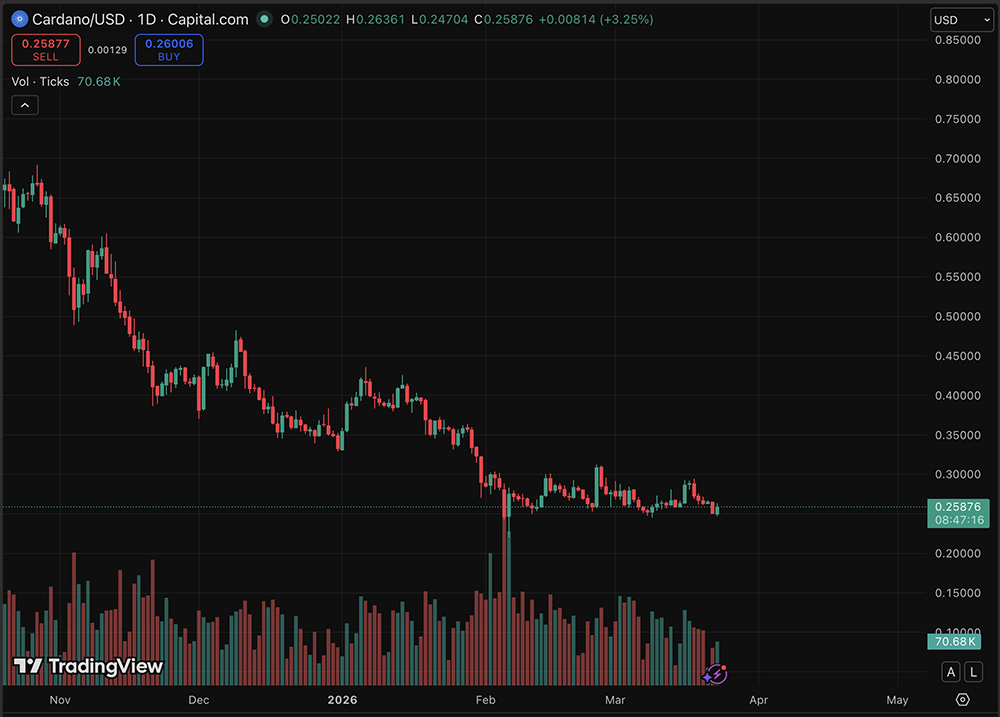
Cardano (ADA) is currently engaged in a high-stakes price standoff, trading tightly between $0.26 and $0.27 as we await a decisive breakout in a bullish prediction.
While Bitcoin has pushed past $70,000 just now, ADA has lagged significantly, posting a 24-hour change oscillating between -2% and +2%. The technical landscape suggests a “squeeze” on the 15-minute timeframe, forming a textbook symmetrical triangle that typically precedes a major volatility event.
Fundamentally, the network is gearing up for the Van Rossem hard fork to protocol v11 and the Node 10.7.0 update scheduled for late March 2026. This technical pivot coincides with legitimate regulatory relief; on March 17, joint SEC and CFTC guidance reportedly clarified ADA’s status as a digital commodity, potentially removing long-standing regulatory overhangs.
Despite these fundamental wins, the market reaction has been muted. Investors are now questioning whether the upcoming infrastructure upgrades can catalyze a reversal, or if the broader altcoin malaise will drag the token lower.
Discover: The Best New Crypto
Can Cardano Price Reclaim $0.32 Before April Fork?
The immediate technical picture for Cardano is defined by compression. Trading at $0.26 at press time, the asset remains pinned below its 50-day Simple Moving Average (SMA) of approximately $0.30, signaling sustained bearish pressure.
Volume indicators reveal a tightening of momentum, a classic precursor to a directional move. If bulls can leverage liquidity from the recent LayerZero integration (accessing over $1 billion in cross-chain capital), a breakout above the $0.27 ceiling could target the March high of $0.32.

However, the downside risks are palpable. Failure to hold the current symmetrical triangle pattern risks a retest of the recent support low at $0.2.
Long-term indicators remain heavy; the price sits well below the 200-day SMA of $0.50, suggesting that any rally remains a counter-trend move until proven otherwise. Analysts anticipate short-term targets near $0.25, a calm and steady Cardano price prediction.
Bitcoin Hyper Targets Early Mover Upside as Cardano Tests Key Levels
While legacy altcoins like Cardano struggle to reclaim yearly highs, capital is aggressively rotating into high-performance infrastructure layers.
The math is simple: a heavy-cap asset like ADA requires billions in new inflow to move 2x, whereas pre-market entrants offer significantly higher volatility and upside potential. This shift is evident in the surge of interest surrounding Bitcoin Hyper ($HYPER), as investors rotate toward infrastructure assets during market pullbacks.
Positioning itself as the first-ever Bitcoin Layer 2 with Solana Virtual Machine (SVM) integration, Bitcoin Hyper aims to solve Bitcoin’s core latency and cost issues. The project has already raised more than $32 million, signaling massive institutional appetite for Bitcoin-native smart contracts.
Currently priced at $0.0136, the token offers a high 66% APY staking incentives for early participants.
The post Cardano Price Prediction: Hard Fork and Expectations appeared first on Cryptonews.
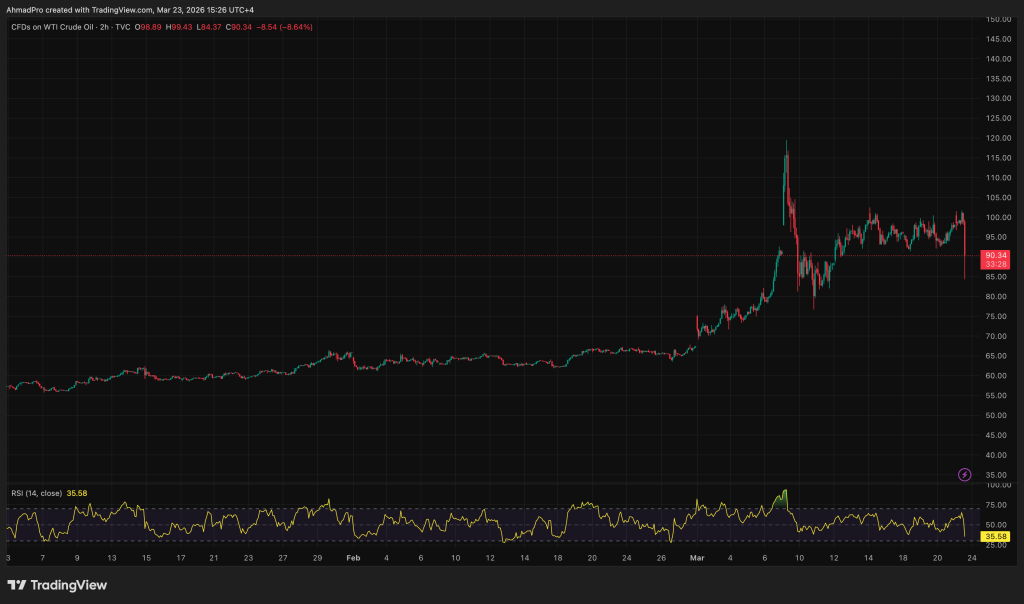
Bitcoin is failing its biggest safe-haven test of 2026 as the Strait of Hormuz crisis pushes oil toward $113. Instead of decoupling, BTC is showing a dangerous 0.68 positive correlation with crude prices, signaling that digital gold is currently trading like a risk asset.
- Correlation Spike: The Bitcoin-WTI correlation coefficient has hit 0.68, a dramatic shift from historical averages below 0.3.
- Oil Impact: Goldman Sachs projects Brent crude will average $110 through April if Hormuz flows remain at 5% capacity.
- BTC Level to Watch: Bulls must defend the $65,000 support zone to prevent a technical breakdown toward $58,000.
The Correlation Trap: Why $100 Oil Hurts Bitcoin This Time
The Strait of Hormuz is choking off 20% of global oil supply, and the crypto market is reacting with volatility rather than validation. Goldman Sachs analysts sharply raised forecasts on Monday, projecting Brent to average $110 in March and April. Futures have already reacted, with Brent hitting $113.32 and WTI climbing to $101.01 alongside President Trump’s ultimatum to Tehran.

Historically, this geopolitical chaos fuels the digital gold narrative. But the data shows a regime shift. The Bitcoin correlation with oil prices has climbed to 0.68. Why? Because the oil price crypto impact is now transmitted through inflation expectations. $110 oil ensures inflation stays sticky. Sticky inflation forces the Federal Reserve to keep rates high. High rates drain the global liquidity that Bitcoin feeds on.
Bitcoin trails money supply growth and struggles when energy costs spike. The mechanics are brutal: rising energy costs act as a tax on the consumer and the miner simultaneously. If Hormuz flows stay at 5% through April 10, Goldman’s base case, we are looking at a stagflationary environment that punishes all risk assets, crypto included.
The trade fingerprint tells you everything. Bitcoin is not bidding up on “war fear”; it is selling off on “liquidity fear.” Until the correlation breaks or oil stabilizes, the upside above $70,000 is capped by macro headwinds.
Can Whales Absorb the Macro Risk Shock?
While the paper market panics, on-chain flows suggest a divergence in conviction. Retail sentiment has fractured, but whale wallets holding 1,000 to 10,000 BTC continue to accumulate in the $65,000 to $70,000 range.
This implies smart money views the macro risk as temporary or expects a policy response, like a massive liquidity injection, to counter the oil shock.

Morgan Stanley’s recent ETF filing reinforces this institutional floor. The infrastructure is being built regardless of where crude trades next week. However, price respects levels, not narratives. The 0.68 correlation means Bitcoin is vulnerable to any further escalation in the Middle East.
The invalidation level for the bear case is clear. If Bitcoin can reclaim $72,000 while oil remains above $100, the decoupling thesis is back in play. Until then, you are trading a risk asset tethered to energy markets.
The post Bitcoin ‘Digital Gold’ vs. Hormuz Crisis: Is BTC Decoupling? appeared first on Cryptonews.
Key Takeaways
- Stock futures plummeted Monday as Iran launched retaliatory attacks after Trump threatened to target Iranian energy sites
- President Trump subsequently announced a postponement of planned military action following diplomatic discussions with Iranian officials
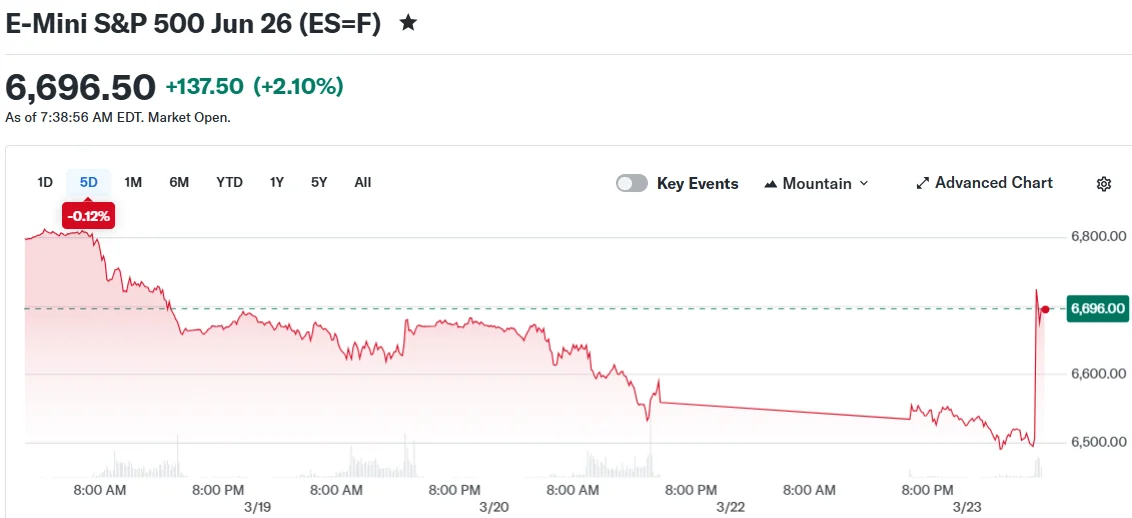
- Major index futures surged more than 2%, with Dow, S&P 500, and Nasdaq all reversing earlier losses
- Crude oil briefly exceeded $100 per barrel before retreating following Trump’s postponement announcement
- The Russell 2000 index had officially entered correction, trading over 10% beneath its January peak
Wall Street experienced dramatic volatility Monday as equities initially tumbled before mounting an impressive comeback following President Trump’s decision to delay planned military operations against Iran after engaging in what he described as “productive conversations” with Iranian leadership.
During early trading, Dow Jones Industrial Average futures declined approximately 0.8%. The S&P 500 futures dropped 0.7%, while Nasdaq 100 futures experienced the steepest declines, sliding nearly 1%.

Iran had executed new offensive operations early Monday. These strikes occurred following Trump’s weekend ultimatum, in which he warned of imminent attacks on Iranian energy infrastructure should the Strait of Hormuz remain blocked beyond a 48-hour window.
Iran’s Revolutionary Guards had issued counter-threats, promising to strike Israeli power installations and facilities servicing American military bases throughout the Gulf region if Trump proceeded with his pledge to dismantle Iran’s electrical grid.
Investors were already anxious following four consecutive weeks of declining markets. The technology-heavy Nasdaq registered its largest weekly percentage drop since early February during the previous trading week.
Crude Prices Breach $100 Before Reversing
Oil prices skyrocketed as Middle East tensions intensified. West Texas Intermediate crude contracts spiked to touch the $100 per barrel threshold. Brent crude, serving as the international pricing benchmark, surged beyond $113 per barrel.
Elevated crude prices heighten inflation anxieties and complicate the Federal Reserve’s interest rate policy outlook. Gold contracts, which had maintained positive year-to-date performance, wiped out all 2026 gains amid speculation that the Fed might maintain elevated rates for an extended period.
Markets pivoted dramatically when Trump reversed direction. He declared the US military would delay planned strikes following successful diplomatic engagement with Iran. Trading sentiment shifted immediately.
Equities Mount Dramatic Turnaround
By late morning hours, Dow futures had rocketed upward more than 1,100 points, representing approximately a 2.5% gain. S&P 500 futures advanced beyond 2.3%, while Nasdaq 100 futures climbed 2.4%.
Europe’s STOXX 600 benchmark index reversed into positive territory. Precious metal commodities also registered gains. Crude oil prices tumbled sharply following the strike postponement news.
The CBOE Volatility Index, widely regarded as the market’s fear indicator, retreated after reaching two-week highs. The index last traded down roughly 4 points at 22.79.
Russell 2000 futures, representing small-capitalization equities, soared 4.7% after trading down more than 1% during the opening session. The small-cap benchmark had concluded Friday’s trading session more than 10% below its January 22 all-time closing high, officially confirming correction status.
Chris Beauchamp, chief market analyst at IG Markets, commented: “This is obviously a postponement, not a complete ceasefire, and we will see what happens from here. What’s done is still not undone, so the impact has yet to be seen, but obviously, markets are breathing a sigh of relief.”
The Russell 2000’s correction confirmation and the Nasdaq’s month-long losing streak represented the most significant concerns for traders entering Monday’s session.


Brazil’s new finance minister, Dario Durigan, is expected to delay a public consultation on applying a tax on financial operations, locally known as Imposto sobre Operações Financeiras (IOF) to some cryptocurrency transactions, Reuters reported, citing sources familiar with the matter.
Durigan took office on March 20 after Fernando Haddad stepped down to run for governor of São Paulo. Reuters said the new minister wants to focus on microeconomic measures and avoid proposals that could trigger conflict with Congress during an election year.
The postponed consultation centered on a draft decree that could classify some crypto transactions as foreign exchange operations.
That matters because foreign exchange deals in Brazil can face IOF rates ranging from 0.38% on some inbound flows to as much as 3.5% on overseas purchases, remittances and card spending abroad. Transfers for overseas investment can face a 1.1% rate.
The proposal has already drawn pushback from major industry groups. In a joint statement ABcripto, ABFintechs, Abracam, ABToken and Zetta, which together represent more than 850 companies, said applying IOF to stablecoin transactions would be illegal under Brazil’s constitution and the country’s 2022 Virtual Assets Law.
They argued that stablecoins are not fiat currency and cannot be treated as foreign exchange instruments by decree or administrative rule.
The proposal drew attention in February after the central bank classified part of the crypto market, especially some stablecoin activity, within the scope of foreign exchange rules. That gave the Finance Ministry and tax authorities a base to study whether those transactions should fall under IOF.
The ministry may also shelve a separate proposal to end tax breaks on some investment securities.

- SIREN surges as momentum and strong trading activity increase.
- Profit-taking is, however, emerging after the recent sharp price rally.
- Key levels to watch are the support at $2.50 and the resistance at $3.20.
SIREN has surged sharply, drawing attention across the crypto market.
The token has recorded a 89% increase within a single day, which is an unusually large move even by memecoin standards.

This kind of rapid price action is rarely random, and it usually reflects a mix of strong momentum, speculation, and short-term market dynamics.
Here’s why the price of SIREN jumped that high
One of the main drivers behind this move is simple market momentum.
When a token begins to rise quickly, it tends to attract more buyers who fear missing out.
This creates a feedback loop in which rising prices lead to higher demand, which in turn pushes prices even higher.
SIREN appears to have benefited from exactly this kind of reaction.
At the same time, trading activity has increased significantly.
High volume during a price surge often signals strong participation from both retail traders and larger market participants.
However, heavy volume alone does not guarantee continued upside.
It often appears during both breakouts and tops, which makes it important to interpret carefully.
Profit-taking could halt the rally
Despite the strong rally, there are early signs that some participants are locking in profits.
After a near 100% surge, it is common for early buyers to start selling into strength.
This behaviour creates selling pressure that can slow down or reverse upward momentum.
The meme coin is already down 16% from its recently hit all-time high
When prices fail to hold near their peak, it can indicate that sellers are beginning to take control.
There are also concerns among some traders about the structure of the market behind SIREN.
Speculative assets with rapid growth can sometimes be influenced by concentrated holders.
This raises the possibility of larger players influencing price direction through coordinated buying and selling.
SIREN price forecast
Overall, SIREN remains in a strong but fragile position. Looking ahead, the key level to watch is around $2.50.
This level is acting as immediate support in the short term.
If SIREN manages to hold above this zone, the market may enter a consolidation phase.
In that case, the price could move between $2.50 and $3.20 while the market stabilises after the recent surge.
A stronger bullish continuation would require a clean break above $3.20.
If buyers can push the price back toward the recent all-time high and beyond, it would signal renewed strength.
However, this would also require sustained buying volume and strong market sentiment.
On the downside, a break below $2.50 would be a key warning sign.
If that level is lost with significant volume, it could indicate that profit-taking is accelerating.
In that scenario, the next area to watch would be around $2.00.
A move toward this level would represent a deeper correction after the recent rally.

Bitcoin began the week facing renewed macro headwinds as risk sentiment wavered and traders weighed the possibility of further downside in a pattern that resembles January’s bear flag. BTC traded around the mid-$60,000s after a weekend of outsized liquidations and a weekly close that fell short of reclaiming a crucial trend line, with the price hovering near $67,400 into the close and slipping below the 200-week exponential moving average (EMA) around $68,300. The setup comes as gold slips into bear-market territory and oil maintains a firm footing above $100 per barrel, underscoring a macro environment that remains conducive to volatility in risk assets.
Markets are integrating a mix of geopolitical risks, shifting Fed expectations, and on-chain signals. Several traders and analysts highlighted that Bitcoin’s current action echoes a bear-flag scenario seen earlier this year, with potential consequences if selling pressure resumes. In practical terms, a breakdown from the flag could open the door to new multiyear lows, while a short-lived upside would need to clear a sequence of resistance levels to change the narrative. Estimated targets remain contentious, but some observers point to a test of sub-$50,000 if the pattern plays out in earnest, while participants will look for a sustained push above the high-$70,000s to reframe the setup.
Key takeaways
- Bitcoin closed the week below the 200-week EMA (about $68,300), with price near $67,400, renewing bear-market risks for bulls.
- The current price action resembles January’s bear-flag breakdown, suggesting the next move could push BTC toward sub-$50k if momentum accelerates on a breakdown.
- Market dynamics were amplified by elevated liquidations—over $400 million in the last 24 hours—indicating persistent selling pressure and liquidity-linked risk appetite.
- Gold dropped into bear-market territory, trading around $4,100 per ounce, while oil sustained gains above $100, underscoring inflation and energy-security concerns in the macro backdrop.
- On-chain data show long-term holders capitulating, with the Bitcoin Long-Term Holder SOPR dipping to 0.64 in early March, suggesting widespread losses among patient investors even as some supply moved off exchanges.
Bitcoin’s technical crossroads: bear flags, ranges, and a potential squeeze
Trading activity over the weekend underscored a fragile setup as traders awaited fresh cues from traditional markets. Data from TradingView show BTC’s price dipping to near $67,400 into the weekly close, failing to sustain a move back above the 200-week EMA, which currently sits around $68,300. Previously, a weekly close above that line had been viewed as a bulls’ lifeline; the latest close shifts the balance toward the bears’ camp for now.
Analysts have repeatedly warned that the market could circle within a defined range for a period as macro tensions persist. In particular, a number of voices on social media pointed to the January bear-flag precedent, where a breakdown from a consolidation pattern led to a renewed downtrend. The prevailing read is that a break below the lower boundary of the range could accelerate declines, while a lackluster upside would keep the door open to further weakness until macro catalysts shift decisively.
Strategists highlighted a nuanced near-term path. One analyst noted the potential rotation to around $65,000 should the week begin with renewed selling pressure, but a brief push toward $70,000 could lure bulls if price action gains a foothold. A breakthrough above $71,000 would likely require a clean close into the $73,000–$74,000 zone to reassert a bullish tilt; otherwise, risk-reward remains skewed to the downside in the near term.
Liquidity dynamics also shaped expectations. As weekend liquidity thinned, traders observed that small orders could have outsized price effects in the thin books, amplifying moves and triggering stop-loss clusters or liquidations. A few market voices warned against interpreting weekend volatility as a trend signal, reminding participants that thinner markets tend to exaggerate short-term moves.
Across the community, a mix of sentiment and risk due to macro headlines kept traders vigilant. Some suggested the risk of a short-term squeeze exists if liquidity-driven pressure eases and offers a window for longs to step in, but a sustained shift above key levels would be necessary to flip the narrative.
Macro backdrop tightens: gold, oil, and the Iran risk premium
The broader macro environment added a heavyweight note to the Bitcoin picture. Gold, which had been trading at elevated levels, slid into bear-market territory, with XAU/USD dipping more than 20% from its all-time high and testing around $4,100 per ounce. The slide fed into the broader risk-off impulse in early sessions as market participants weighed the implications of higher real yields and inflation dynamics. In commentary cited by traders, some observers argued that a significant liquidity event among large participants could be at play, as price action in the gold market suggested stress beyond routine fluctuations.
The energy complex also played a central role. Oil prices remained resilient above the $100 barrier, reflecting ongoing concerns about supply security, particularly in light of tensions in the Middle East. European and Asian energy markets showed heightened sensitivity to headlines about flows through strategic corridors, with observers noting that energy-inflation linkages tend to feed into broader macro expectations. A veteran market briefing noted that even moderate changes in oil prices can meaningfully influence headline inflation readings, potentially affecting the tempo of monetary policy decisions in the quarters ahead.
Against this backdrop, market research outfits highlighted potential inflationary implications. The Market Mosaic, a regular briefing from Mosaic Asset Company, stressed that oil price moves can directly affect inflation metrics, with a $10 per barrel swing historically contributing meaningfully to shifts in inflation readings. While the notes did not predict a specific outcome, they underscored the sensitivity of risk assets to energy-price shocks amid a policy backdrop that remains cautious about rate-cut horizons.
Fed stance, volatility, and the options backdrop
On the policy front, the commitment to inflation progress remained central. In the aftermath of the most recent Federal Reserve gathering, Wall Street’s takeaway was that any policy loosening would hinge on demonstrable progress toward inflation targets. The accompanying narrative from market observers suggested that rate-cut expectations were being pushed further out, with some analysts pointing to the potential for rate hikes to reemerge in 2026 should inflation prove stickier than anticipated. The evolving odds were being tracked by the CME FedWatch tool, which reflected shifting probability curves as new data filtered in.
Beyond the Fed, traders also eyed the options market in a bid to gauge near-term liquidity flows. The Kobeissi Letter noted that last week’s expiration event—described as a substantial triple-witching session for U.S. stocks and ETFs—unleashed a significant amount of capital as large options positions expired. The implication, as described by The Kobeissi Letter, is that this could unleash fresh volatility into equities and by extension into correlated risk assets, including bitcoin, in the days that followed.
In this environment, the weekend volatility gave on-chain observers a useful reminder of how market structure interacts with price moves. CryptoQuant contributors observed that weekend sessions tend to see diminished institutional participation and ETF-driven demand, elevating the role of derivatives positioning and short-term liquidity. The takeaway from CryptoQuant’s QuickTake was clear: thinner order books amplify price sensitivity, and weekend action should not be misconstrued as a trend signal.
On-chain signals: capitulation among long-term holders
On-chain analytics painted a nuanced portrait of investor behavior. CryptoQuant’s analysis focused on the SOPR metric, which compares the price at which coins are moved on-chain to their previous cost basis. Investigators highlighted that Long-Term Holder (LTH) SOPR dropped to 0.64 in early March, a read indicating that LTHs were selling at a substantial loss relative to their cost basis. As one contributor described it, readings this far below 1.0 signal meaningful capitulation among patient holders, underscoring a period of fear in the market.
Despite the near-term pain for many LTHs, the broader signal remains ambiguous. The 30-day moving average of LTH-SOPR remained below 1, suggesting that while a portion of supply was exiting exchanges, other cohorts could be quietly absorbing supply and moving coins off-chain. Analysts characterized this as a possible distribution-accumulation dynamic at play, a classic hallmark of a market transitioning through a phase of capitulation while still containing pockets of absorption that could set the stage for a future regime shift.
Closing perspective: what to watch next
As Bitcoin navigates a week shadowed by macro risks, traders will be watching the confluence of technical levels, liquidity conditions, and on-chain signals. The immediate focal point remains a sustained move beyond the 200-week EMA and a clear exit from the prevailing range, which could determine whether the path of least resistance remains lower or if a credible bounce materializes. In parallel, the trajectories of gold and oil, influenced by geopolitical developments and inflation dynamics, will help frame risk sentiment across crypto markets. Finally, the evolving policy stance from the Federal Reserve and the behavior of large derivatives positions—along with on-chain capitulation versus accumulation signals—could shape volatility in the days ahead as markets price a longer horizon for rate moves and macro resilience.

Berkshire Hathaway Resumes Buybacks, Partners with Tokio Marine, and Sits on Record $373B Cash
DraftKings (DKNG) Stock Surges 8% as Senate Targets Prediction Market Competitors

The Comeback Season 3 Features Very Cool Friends Throwback


-

 Fashion3 days ago
Weekend Open Thread: Adidas – Corporette.com
-
 Crypto World3 days ago
NIO (NIO) Stock Plunges 6.5% as Shelf Registration Sparks Dilution Worries
-

 Politics3 days ago
Jenni Murray, Long-Serving Woman’s Hour Presenter, Dies Aged 75
-
 Tech6 days ago
Are Split Spacebars the Next Big Gaming Keyboard Trend?
-

 Crypto World2 days ago
Best Crypto to Buy Now: Strategy Just Spent $1.57 Billion on Bitcoin During Fear While Early Investors Quietly Enter Pepeto for 150x Potential
-

 News Videos5 days ago
RBA board divided on rate cut, unusually buoyant share market | Finance Report | ABC NEWS
-

 Crypto World2 days ago
Bitcoin Price News: Bhutan Sells $72 Million in BTC Under Fiscal Pressure, but the Smart Money Entering Pepeto Sees What the Market Does Not
-

 Business7 days ago
How the UK and China Trade Agreement Could Shape UK Businesses in 2026
-

 Politics5 days ago
The House | The new register to protect children from their abusers shows Parliament at its best
-

 Tech3 days ago
inKONBINI Lets You Spend Summer Days Behind the Register
-
 Politics6 days ago
Real-time pollution monitoring calls after boy nearly dies
-

 Crypto World5 days ago
Canada’s FINTRAC revokes registrations of 23 crypto MSBs in AML crackdown
-
 NewsBeat5 days ago
Residents in North Lanarkshire reminded to register to vote in Scottish Parliament Election
-

 Business7 days ago
Meta planning major layoffs as AI spending and automation reshape workforce
-

 News Videos5 days ago
PARLIAMENT OF MALAWI – PAC MEETING WITH REGISTRAR OF FINANCIAL ON AMARYLLIS HOTEL – INQUIRY LIVE
-

 Business21 hours ago
No Winner in March 21 Drawing as Prize Rolls to $133 Million for Next
-

 Sports53 minutes ago
Remo Stars and Kano Pillars Strengthen Survival Hopes in NPFL
-

 Politics4 days ago
Gender equality discussions at UN face pushbacks and US resistance
-

 Business5 days ago
Who Was Alex Pretti? 5 Key Facts About the ICU Nurse Killed by Federal Agents in Minneapolis
-

 Tech16 hours ago
Give Your Phone a Huge (and Free) Upgrade by Switching to Another Keyboard
You must be logged in to post a comment Login