
Crypto World
What Are Inverse Fair Value Gaps (IFVGs) in Trading?
Price doesn’t just move up or down — it also shows when control in the market changes. An Inverse Fair Value Gap (IFVG) appears when a previous imbalance no longer holds, signalling that buyers and sellers have switched roles, not simply paused. These zones highlight areas where the market has accepted a new price, rather than needing to return to an old one.
For traders who study momentum, market structure, and follow-through, IFVGs add useful context to price behaviour without relying on indicators. This article explains how IFVGs form, how they differ from standard Fair Value Gaps (FVGs), and how they are used in market analysis.
Takeaways
- An Inverse Fair Value Gap is a price zone that forms when a previously valid Fair Value Gap is breached, signalling a shift in price movement.
- IFVGs reflect a change in control, where former buying or selling pressure no longer holds, turning a prior imbalance into a potential reaction zone.
- An Inverted Fair Value Gap is commonly tracked after a clear break through the original Fair Value Gap, often with a close or strong wick beyond the level.
- These zones are typically analysed alongside market structure, momentum, and higher-timeframe bias to frame directional context.
- IFVGs may support market analysis by highlighting where follow-through has replaced mean reversion.
Fair Value Gaps (FVGs) – A Brief Overview
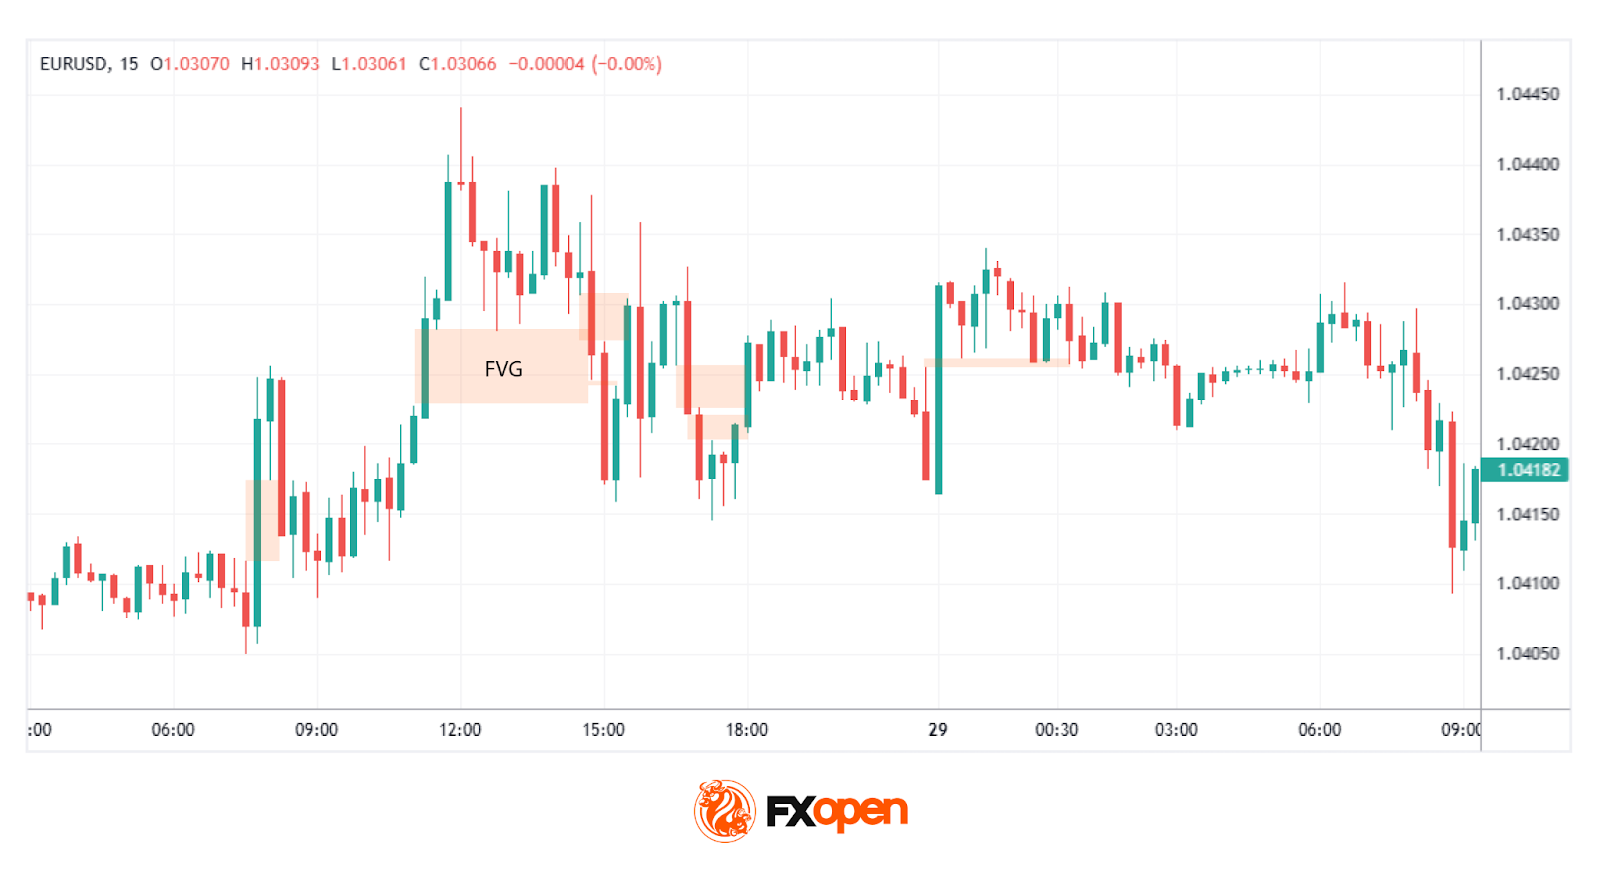
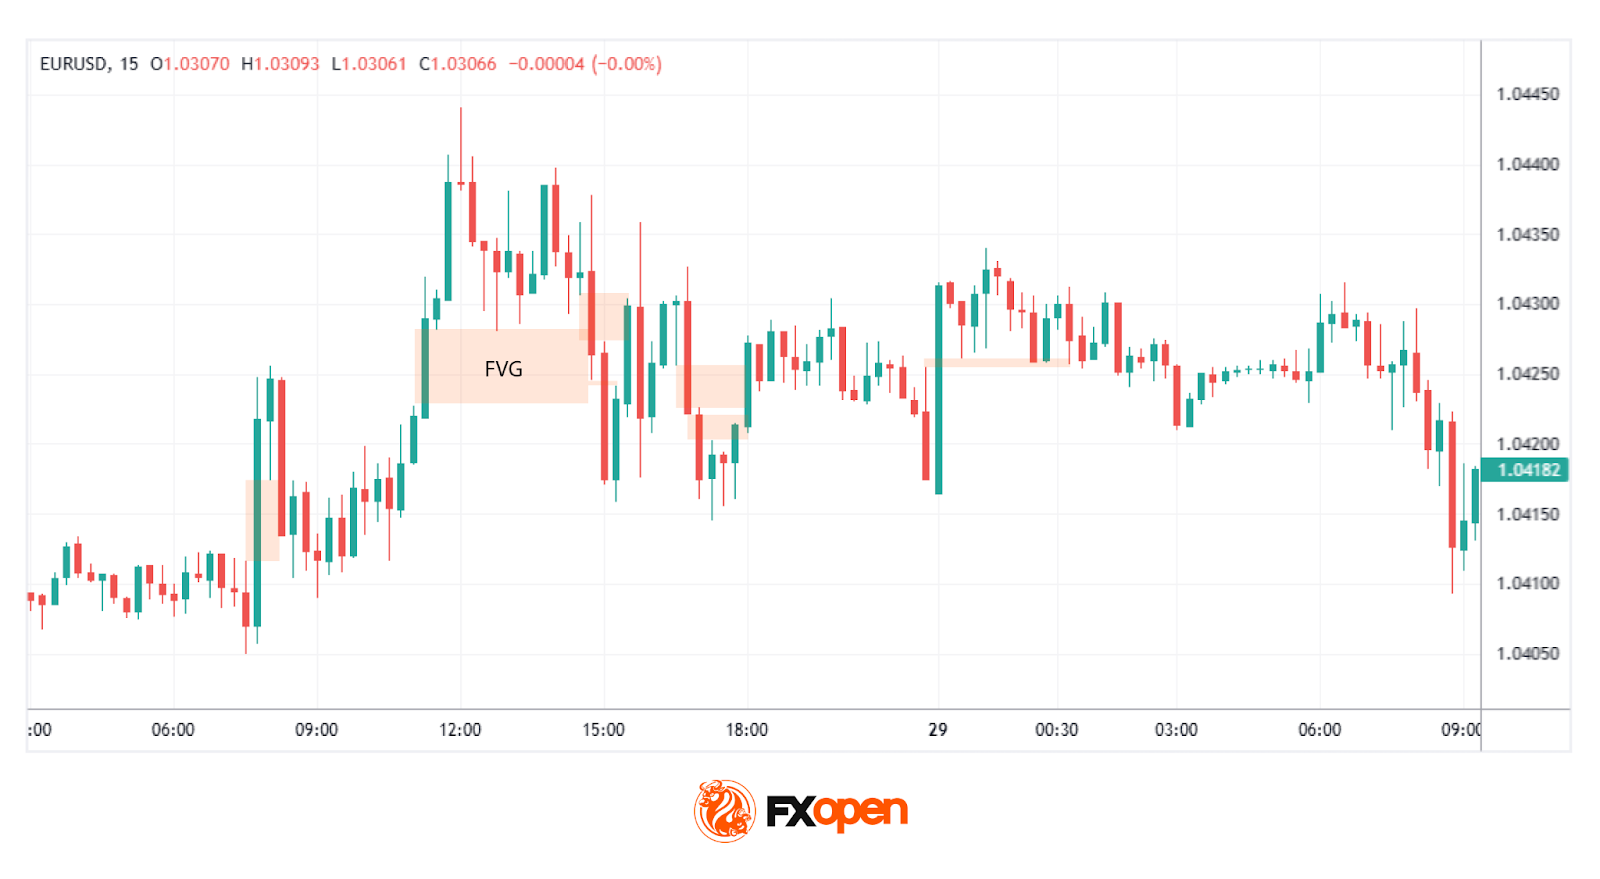
A Fair Value Gap (FVG) occurs when the market moves so rapidly in one direction that it leaves an imbalance in price action. This imbalance shows up on a chart as a gap between three consecutive candles: the wick of the first candle and the wick of the third candle fail to overlap, leaving a “gap” created by the second candle. It highlights an area where buying or selling pressure was so dominant that the market didn’t trade efficiently.
Traders view these gaps as areas of potential interest because markets often revisit these levels to “fill” the imbalance. For example, in a bullish FVG, the gap reflects aggressive buying that outpaced selling, potentially creating a future support zone. On the other hand, bearish FVGs indicate overwhelming selling pressure, which might act as resistance later.
FVGs are closely tied to the concept of fair value. The gap suggests the market may have deviated from a balanced state, making it an area traders watch for signs of price rebalancing. Recognising and understanding these gaps can provide insights into where the price might gravitate in the future, which may help traders assess key zones of interest for analysis.
Understanding Inverse Fair Value Gaps (IFVGs)
An Inverse Fair Value Gap (IFVG), or Inversion Fair Value Gap, is a price zone that forms when an existing Fair Value Gap is broken and no longer holds its original role. At first, a Fair Value Gap is an area where price is likely to react or rebalance. But when price clearly breaks through that gap, it shows the market no longer respects it.
Within the Inner Circle Trader (ICT) framework, this role reversal flips a former resistance-type FVG into potential support, or a former support-type FVG into potential resistance. In simple terms, an IFVG marks where the market has proven that the prior imbalance is no longer respected.
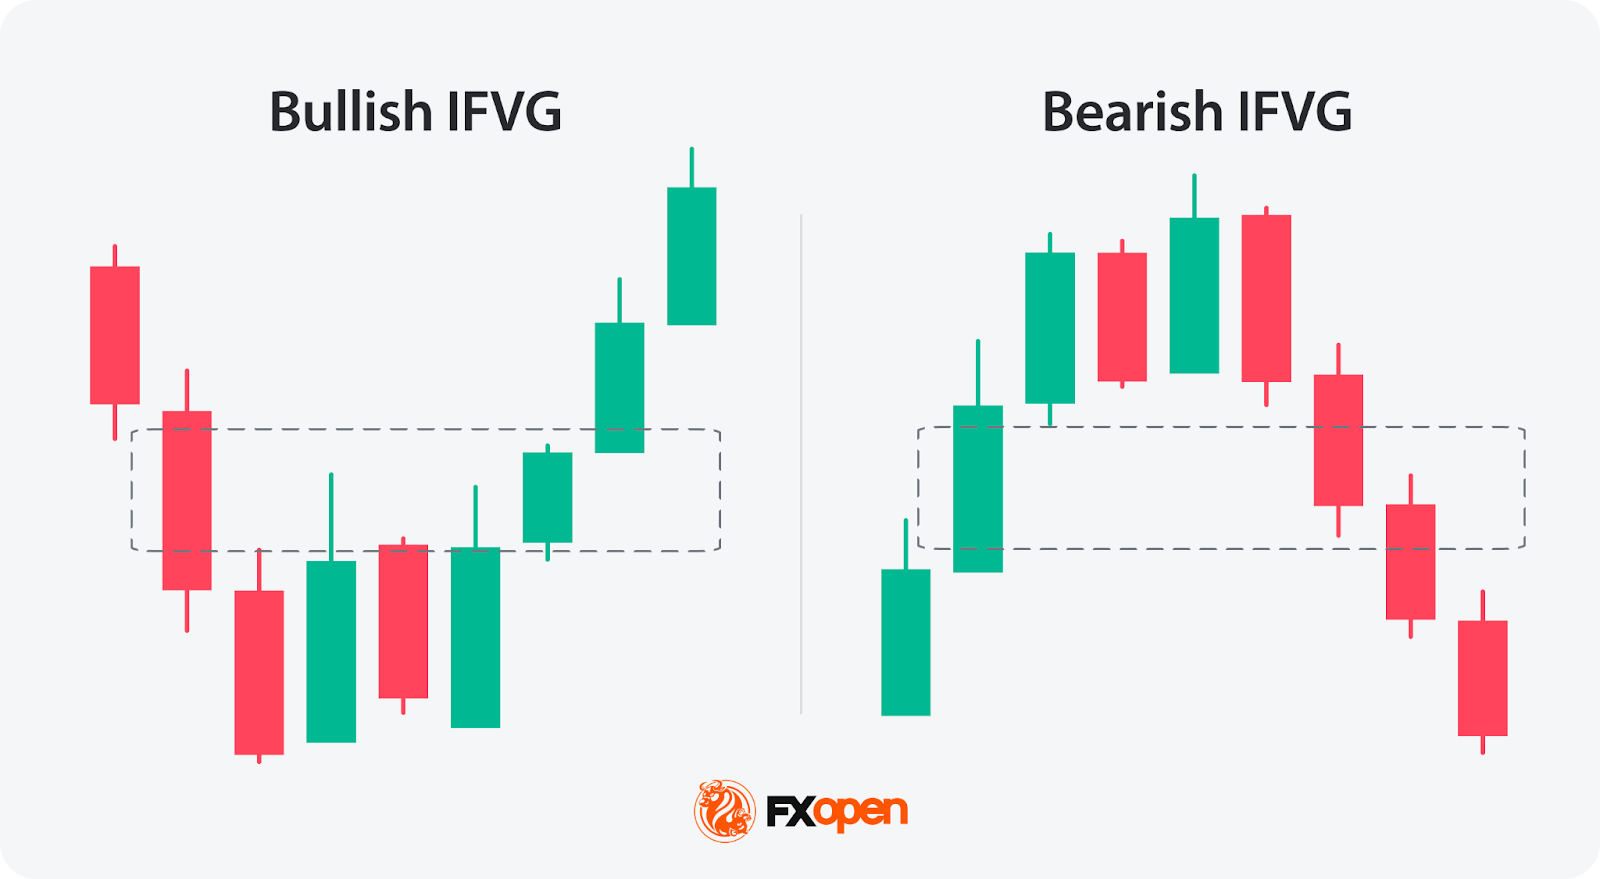
There are two types of IFVG:
- A bullish Inverse Fair Value Gap forms when a bearish Fair Value Gap (FVG) fails. The FVG appears during strong selling pressure and often acts as a resistance zone. If price later pushes through this gap—either by just a wick or closing beyond it—it shows that sellers in that area are no longer in control. Once this happens, the bearish FVG is invalidated and becomes a bullish IFVG, meaning the same zone can now act as potential support.
- A bearish Inverse Fair Value Gap forms when a bullish Fair Value Gap fails. A bullish FVG forms during strong buying pressure and typically acts as support. If the price breaks below it, this signals that buyers have lost control. The bullish FVG is then invalidated and turns into a bearish IFVG, where the zone may act as potential resistance.
In both cases, an IFVG marks a clear shift in market control, rather than a temporary pause in price movement.
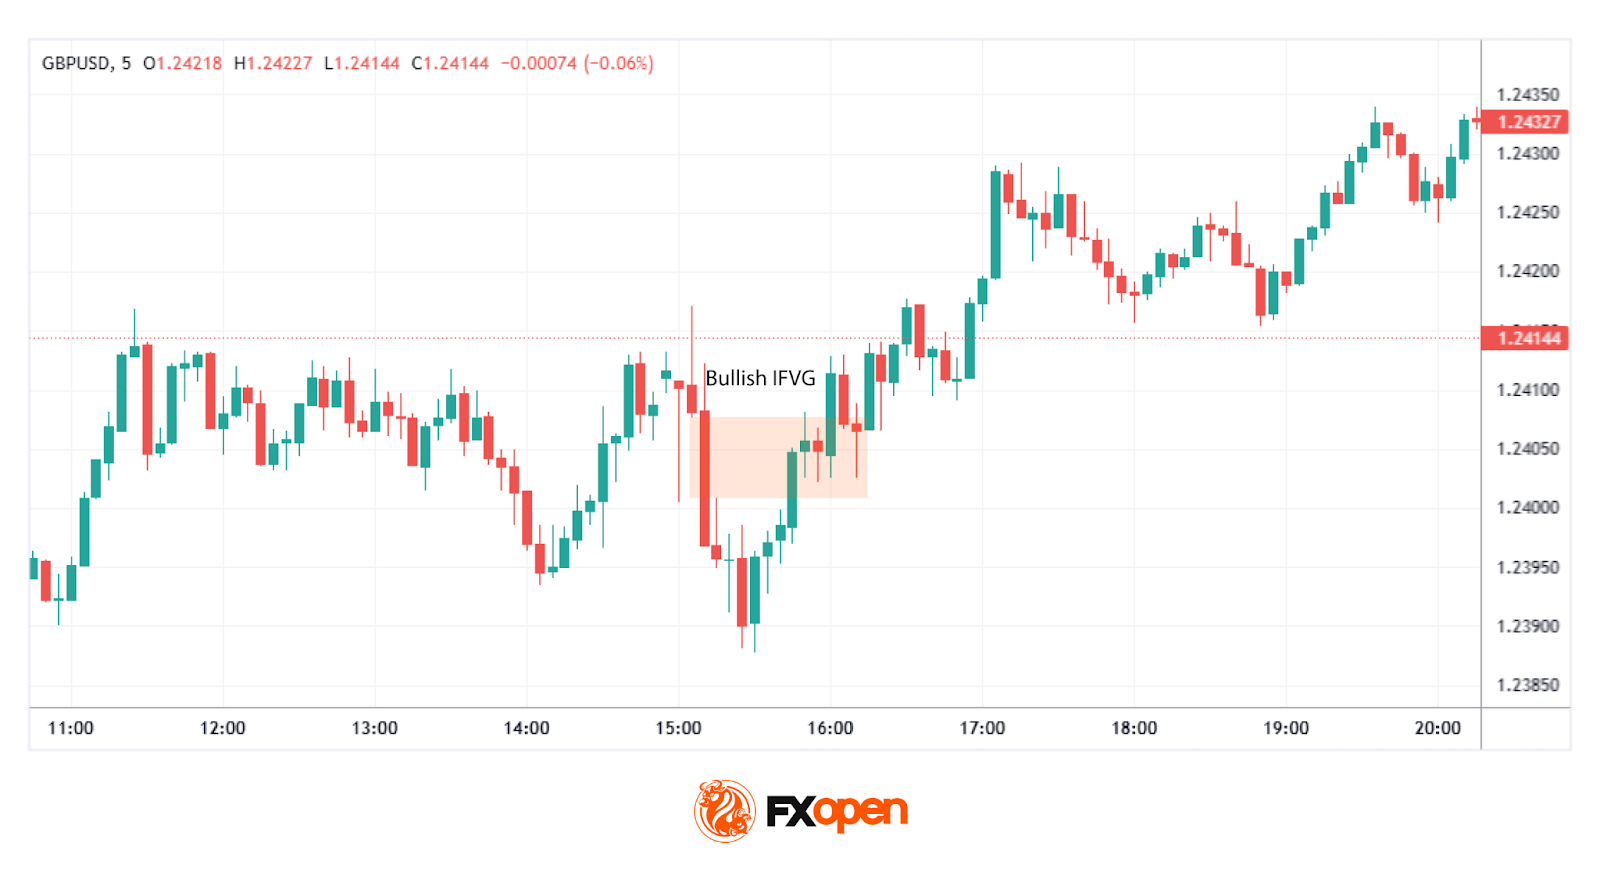
Traders use inverted Fair Value Gaps to identify zones where market sentiment has shifted significantly. For example, when the price revisits a bullish IFVG, it may serve as a zone of interest for traders looking for an entry for a buy trade. However, if the price moves past the bottom of the IFVG zone, it’s no longer valid and is typically disregarded.
What makes these reverse FVGs particularly useful is their ability to highlight moments of structural change in the market. They can act as indicators of strength, revealing areas where price has transitioned from weakness to strength (or vice versa). By integrating IFVG analysis into their broader trading framework, traders can gain deeper insights into the evolving dynamics of supply and demand.
Traders interested in applying IFVG identification techniques in real-time conditions may consider using FXOpen’s TickTrader trading platform that supports advanced charting and analysis tools.
How Traders Use IFVGs
By integrating IFVGs into their strategy, traders can refine their decision-making process and uncover potential setups aligned with their broader market outlook. Here’s how IFVGs are commonly used:
Identifying Key Zones of Interest
Traders begin by spotting FVGs on price charts—areas where rapid movements create imbalances. An inversion FVG forms when such a gap is invalidated; for instance, a bearish FVG becomes bullish if the price breaks above it. These zones are then marked as potential areas of interest, indicating where the market may experience significant activity.
Contextualising Market Sentiment
The formation of an IFVG signals a shift in market sentiment. When a bearish FVG is invalidated and turns into a bullish IFVG, it suggests that selling pressure has diminished and buying interest is gaining momentum. Traders interpret this as a potential reversal point, providing context for the current market dynamics.
Analysing Price Reactions
Once an IFVG is identified, traders monitor how the price interacts with this zone. If the price revisits a bullish IFVG and shows signs of support—such as slowing down its decline or forming bullish candlestick patterns—it may indicate a strengthening upward movement. Conversely, if the price breaches the IFVG without hesitation, the anticipated reversal might not materialise.
How May Inverse Fair Value Gaps Be Traded?
IFVGs provide traders with a structured way to identify and analyse price levels where sentiment has shifted. The process typically looks like this:
1. Establishing Market Bias
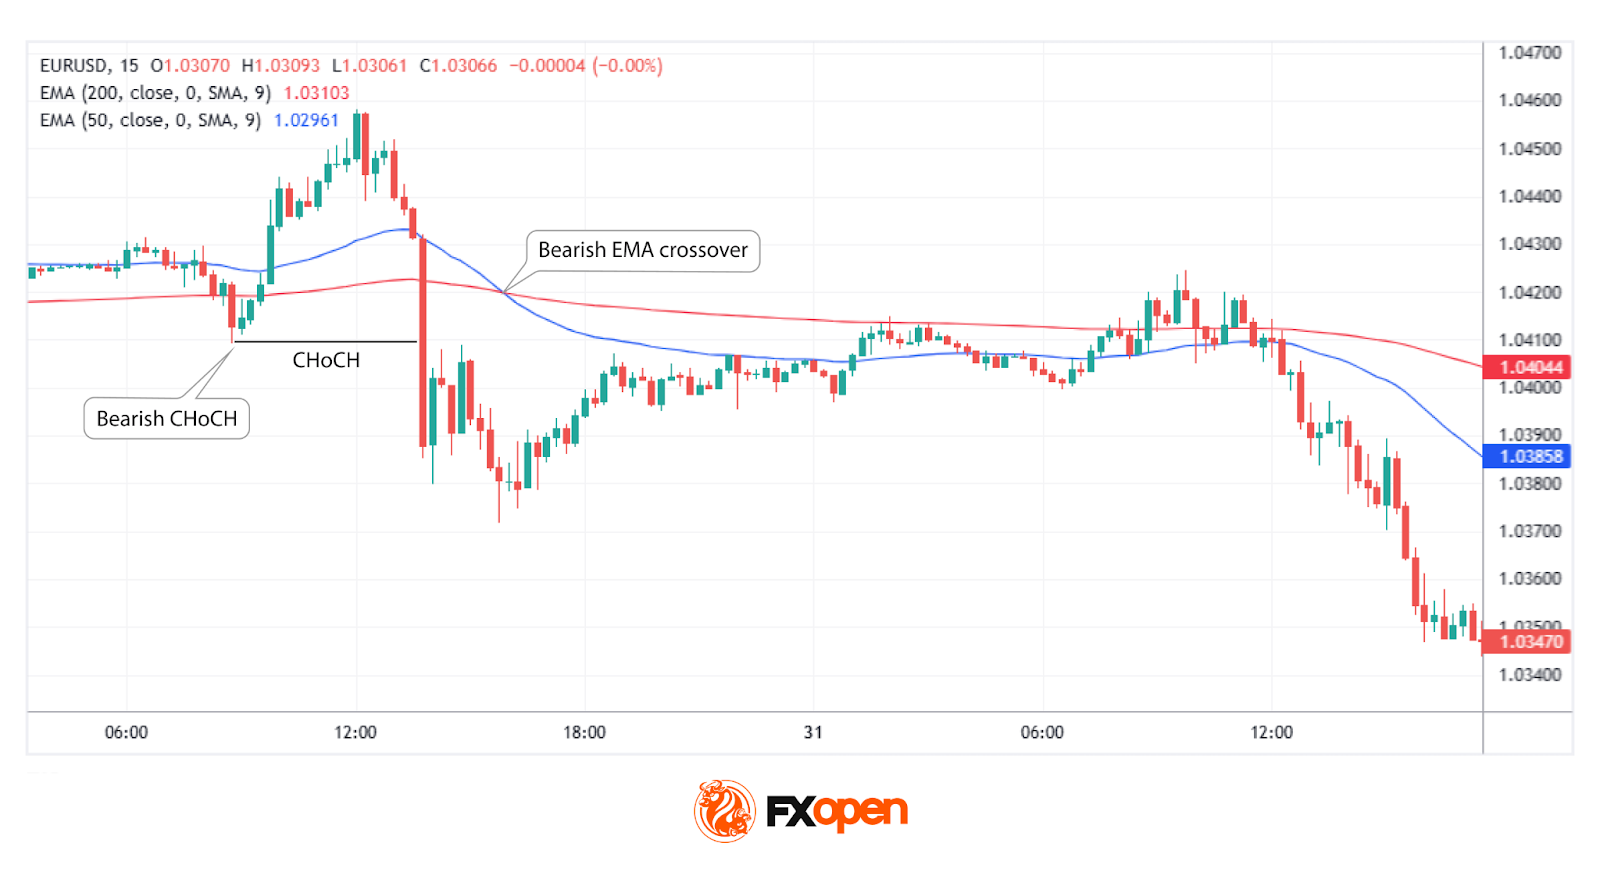
Traders typically start by analysing the broader market direction. This often involves looking at higher timeframes, such as the daily or 4-hour charts, to identify trends or reversals. Tools like Breaks of Structure (BOS) or Changes of Character (CHoCH) within the ICT framework may help clarify whether the market is leaning bullish or bearish.
Indicators, such as moving averages or momentum oscillators, can also provide additional context for confirming directional bias. A strong bias ensures the trader is aligning setups with the dominant market flow.
2. Identifying and Using IFVGs
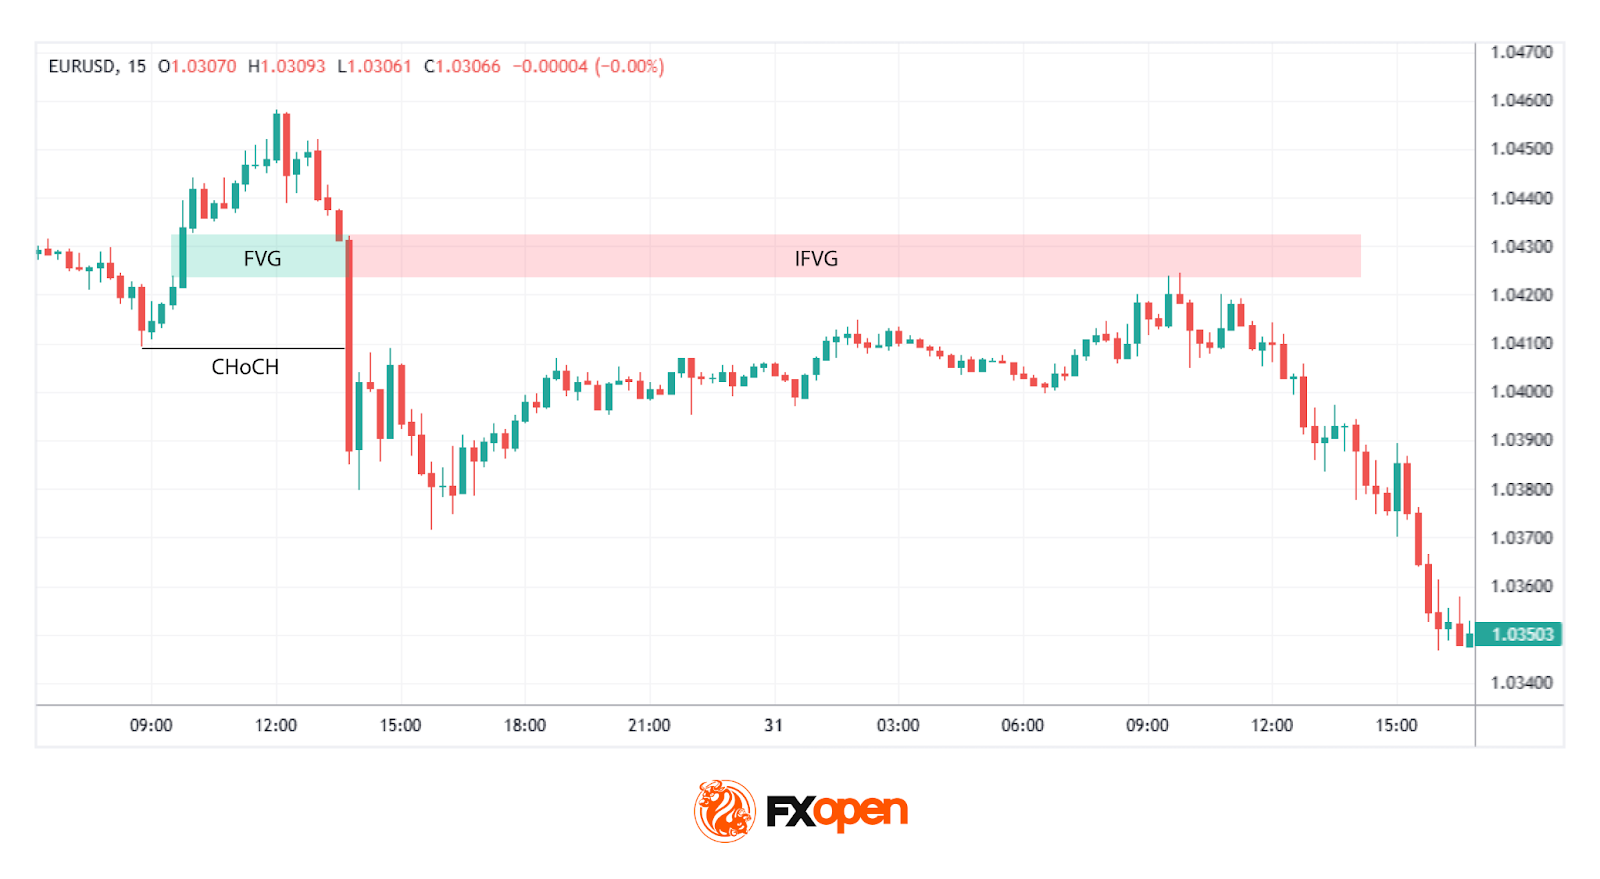
Once a Fair Value Gap (FVG) is invalidated—indicating a significant shift in sentiment—it transforms into an Inverse Fair Value Gap (IFVG). Traders mark the IFVG zone as a key area of interest. If it aligns with their broader market bias, this zone can serve as a potential entry point. For instance, in a bearish bias, traders may focus on bearish IFVGs that act as potential resistance zones.
3. Placing Orders and Risk Management
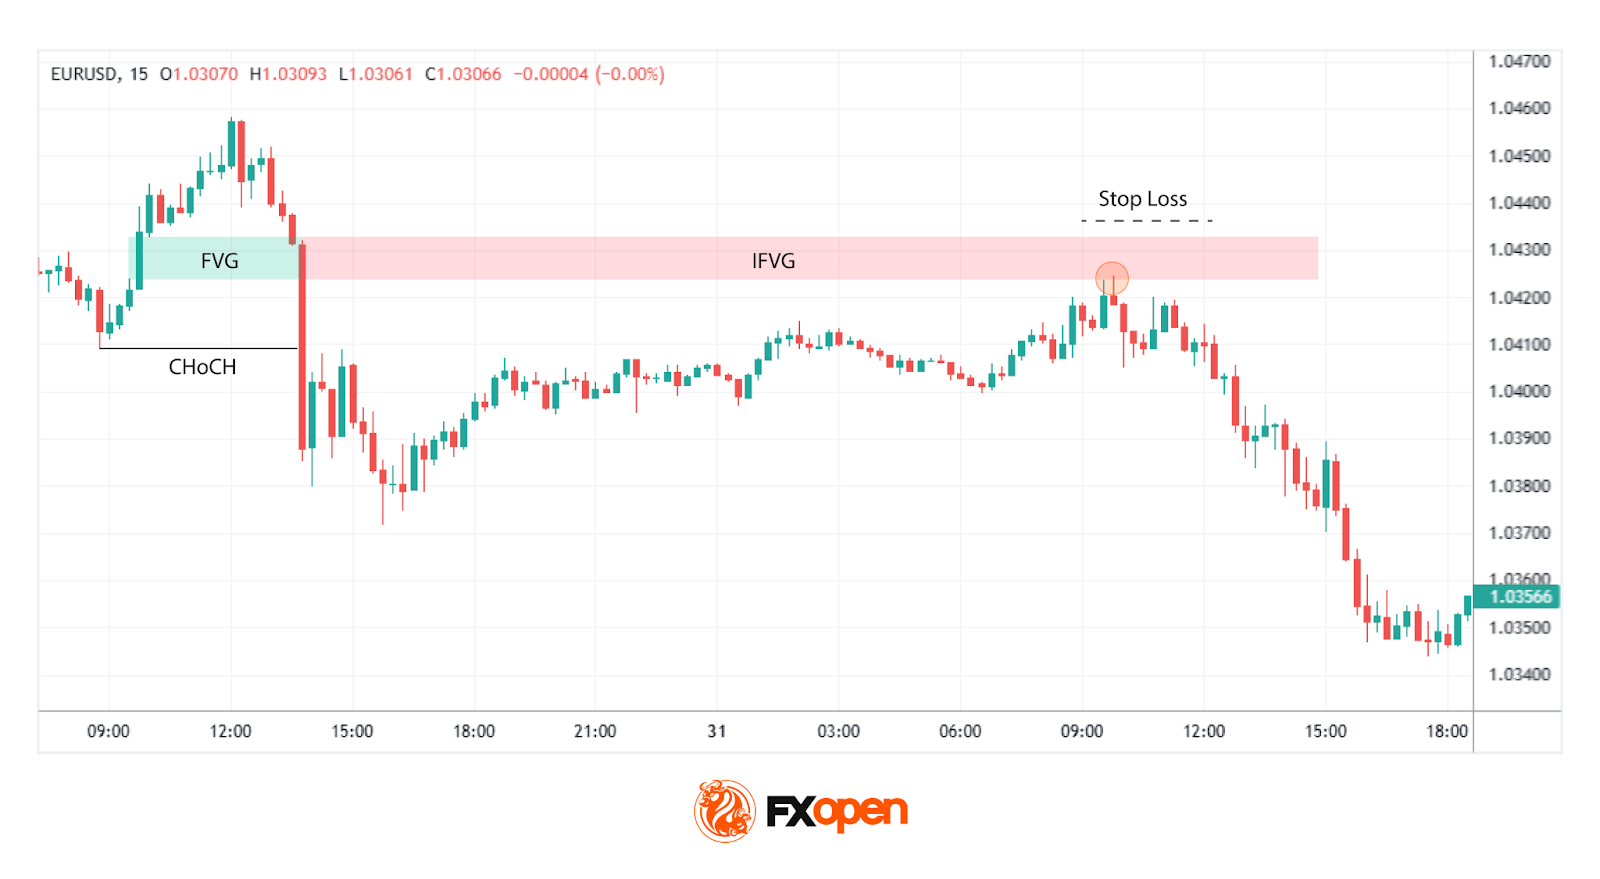
Traders often set a limit order at the IFVG boundary, anticipating a retracement and for the area to hold. A stop loss is typically placed just beyond the IFVG or a nearby swing high/low. For exits, targets might include a predefined risk/reward ratio, such as 1:3, or a significant technical level like an order block or support/resistance area. This approach ensures trades remain structured and grounded in analysis.
Advantages and Disadvantages of IFVGs
IFVGs offer traders a unique lens through which to analyse price movements, but like any tool, they come with both strengths and limitations. Understanding these may help traders incorporate IFVGs into their strategies.
Advantages
- Highlight market sentiment shifts: IFVGs pinpoint areas where sentiment has reversed, which may help traders identify key turning points.
- Refined entry zones: They provide precise areas for potential analysis, reducing guesswork and offering clear levels to watch.
- Flexibility across markets: IFVGs can be applied to any market, including forex, commodities, or indices, making them versatile.
- Complementary to other tools: They pair well with other ICT tools like BOS, CHoCH, and order blocks.
Disadvantages
- Subject to interpretation: Identifying and confirming IFVGs can vary between traders, leading to inconsistencies.
- Limited standalone reliability: IFVGs need to be used alongside broader market analysis; relying solely on them increases risk.
- Higher timeframe dependence: Their reliability can diminish on lower timeframes, where noise often obscures true sentiment shifts.
- Potential for invalidation: While IFVGs signal potential trades, they aren’t guarantees; price can break through.
The Bottom Line
Inverse Fair Value Gaps offer a systematic way to interpret price imbalances and potential turning points in the market. When used alongside other technical tools, IFVGs may help traders uncover valuable insights. Used in context with structure and momentum, IFVGs support traders when framing directional intent and managing expectations around follow-through versus failure.
Those interested in testing and refining IFVG-based strategies in real trading environments can consider opening an FXOpen account, which provides access to over 700 instruments, multiple advanced trading platforms, and competitive trading conditions.
FAQ
What Is an Inverse Fair Value Gap (IFVG)?
The IFVG meaning refers to a formation that occurs when a Fair Value Gap (FVG) is invalidated. For example, a bearish FVG becomes bullish after the price breaks above it, creating a potential support zone. Similarly, a bullish FVG can transform into a bearish IFVG if the price breaks below it, creating a potential resistance zone. IFVGs highlight shifts in market sentiment, providing traders with areas of interest for analysing possible reversals or continuation zones.
What Is the Difference Between a Fair Value Gap and an Inverse Fair Value Gap?
A Fair Value Gap (FVG) is an imbalance caused by aggressive buying or selling, creating a price gap that may act as support or resistance. An Inverse Fair Value Gap (IFVG) occurs when the original FVG is invalidated—indicating a shift in sentiment—and its role flips. For instance, a bearish FVG invalidated by a price breakout becomes a bullish IFVG.
What Is the Difference Between BPR and Inverse FVG?
A Balanced Price Range (BPR) represents the overlap of two opposing Fair Value Gaps (FVGs), creating a sensitive zone for potential price reactions. In contrast, an Inverse Fair Value Gap (IFVG) is a concept based on a single FVG that has been invalidated, flipping its role. While both could be useful, BPR reflects the equilibrium between buyers and sellers, whereas IFVG highlights sentiment reversal.
This article represents the opinion of the Companies operating under the FXOpen brand only. It is not to be construed as an offer, solicitation, or recommendation with respect to products and services provided by the Companies operating under the FXOpen brand, nor is it to be considered financial advice.


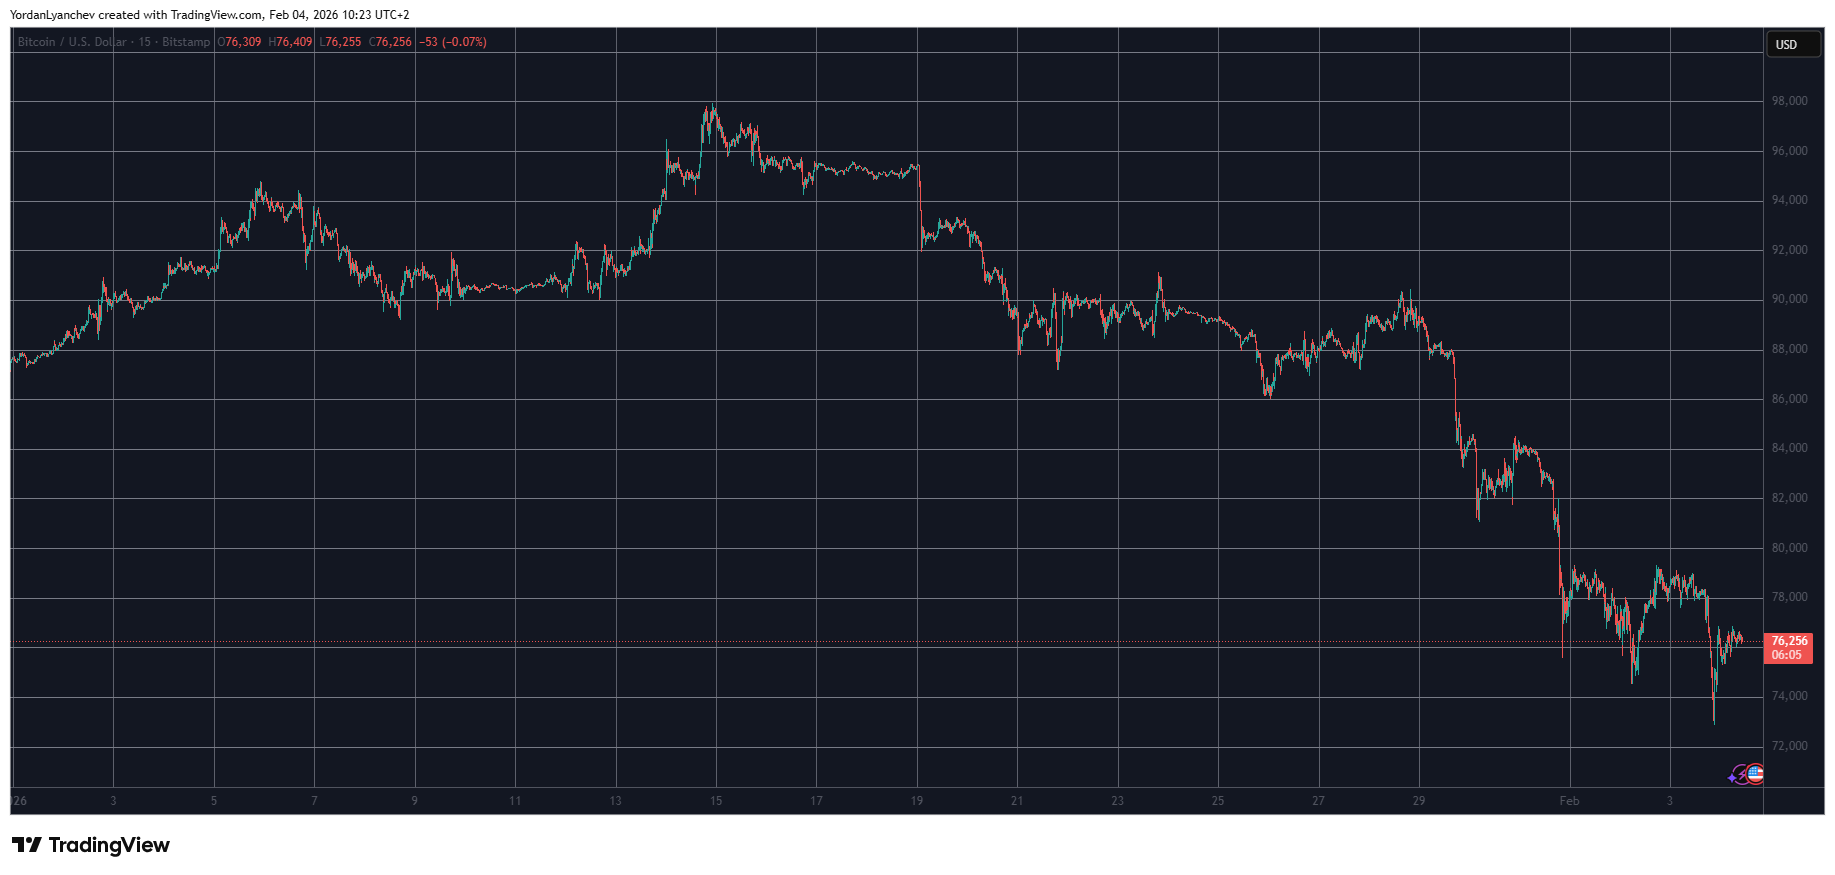
Spot Bitcoin ETFs recorded a fresh outflow on Tuesday, pushing assets under management below the $100 billion threshold for the first time since April 2025. The decline followed $272 million in net redemptions, according to data from SoSoValue. The move comes as Bitcoin slid toward the mid-$70,000s amid a broad crypto market pullback, with the overall market capitalization retreating to about $2.64 trillion from roughly $3.11 trillion in the previous week, per CoinGecko. The setback underscores ongoing volatility in securitized exposure to the leading crypto asset, even as investors rotate into non-Bitcoin assets and altcoins show pockets of life.
The week’s sell-off was not uniform across the market. While BTC ETFs faced renewed outflows, funds tracking altcoins registered small inflows, signaling a divergence in investor appetite between securitized exposure to Bitcoin and exposure to other crypto assets. The broader backdrop remains one of macro- and risk-off pressure, with traders weighing the implications of ETF mechanics, regulatory signals, and shifting liquidity in a market still trying to find a steadier footing after a rapid rally and pullback.
Key takeaways
- Spot BTC ETF assets under management fell below $100 billion for the first time since April 2025, following $272 million in outflows.
- The broader crypto market cap dropped to $2.64 trillion from $3.11 trillion over the previous week, reflecting continued volatility.
- Altcoin ETFs saw modest inflows: Ether (CRYPTO: ETH) $14 million, XRP (CRYPTO: XRP) $19.6 million, and Solana (CRYPTO: SOL) $1.2 million.
- Bitcoin trades below the ETF creation cost basis of $84,000, a dynamic that can constrain new ETF share creation and influence flows.
- Analysts emphasize that the ETF sell-off is unlikely to trigger a broad wave of liquidations, with some expecting a future shift toward direct on-chain trading by institutions.
Tickers mentioned: $BTC, $ETH, $XRP, $SOL
Sentiment: Neutral
Price impact: Negative. The combination of outflows from spot BTC ETFs and a BTC price dip contributed to a weaker near-term sentiment and potential pressure on related products.
Market context: The episode reflects ongoing volatility in ETF-related flows against a backdrop of risk-off trading, with investors differentiating between securitized exposure to Bitcoin and direct or non-BTC crypto exposure. The weekly retreat in market capitalization highlights continued sensitivity to macro cues and liquidity conditions in a market still adapting to higher interest-rate environments and evolving regulatory signals.
Why it matters
The current pattern—spot BTC ETF outflows alongside modest altcoin inflows—offers a nuanced read on institutional engagement with crypto assets. While the ETF structure provides regulated access to Bitcoin, the observed outflows suggest that some investors are rebalancing risk, seeking exposure through non-securitized channels, or waiting for clearer macro signals before increasing holdings in securitized products. The contrast with altcoins indicates that market participants still differentiate between asset classes within the crypto universe, allocating capital to Ethereum, XRP, and Solana when risk appetite allows.
Institutional participants, who historically have been more likely to use securitized products, are increasingly discussed in terms of a potential shift toward on-chain trading and direct asset ownership. That shift could reshape liquidity dynamics and pricing for both spot products and the ETFs that track them. The comments from industry insiders underscore a belief that the next phase of crypto institutional adoption may hinge less on holding securitized exposure and more on engaging with the underlying assets themselves, potentially driving deeper liquidity and new trading venues outside traditional funds.
The price action surrounding BTC—trading under the $74,000 mark while ETF creation remains suppressed by a higher cost basis—adds a layer of complexity for managers of passive crypto portfolios. Even as some investors trim exposure, others may view the current levels as a continuation of a broader re-pricing process that factors in regulatory clarity, macro liquidity, and the evolving competitive landscape among crypto investment vehicles.
Thomas Restout, CEO of institutional liquidity provider B2C2, offered a parallel view, noting that institutional ETF investors have shown resilience and patience even as flows wobble. He suggested that a substantial portion of assets could remain within ETFs, but the market is approaching a potential pivot point where some appetite could shift toward direct crypto trading. “The next level of transformation is institutions actually trading the crypto, rather than just using securitized ETFs,” Restout said recently on a Rulematch Spot On podcast. His comments point to a broader re-evaluation of how institutions allocate in crypto markets, with possible implications for liquidity provisioning and price discovery across the ecosystem.
What to watch next
- Next data release on spot BTC ETF AUM from SoSoValue and any observable shifts in creation or redemption activity.
- BTC price stabilization or further moves toward the $70k–$75k zone and how that interacts with ETF flow dynamics.
- Any regulatory updates or policy signals that could impact ETF structures or on-chain trading incentives.
- Evidence of institutional traders increasing direct exposure to crypto assets beyond securitized products.
Sources & verification
- SoSoValue data on spot Bitcoin ETF assets under management and outflows.
- CoinGecko market-cap data showing weekly changes in the global crypto sector.
- Reported inflows for altcoin ETFs: Ether, XRP, and Solana with metrics provided in the article.
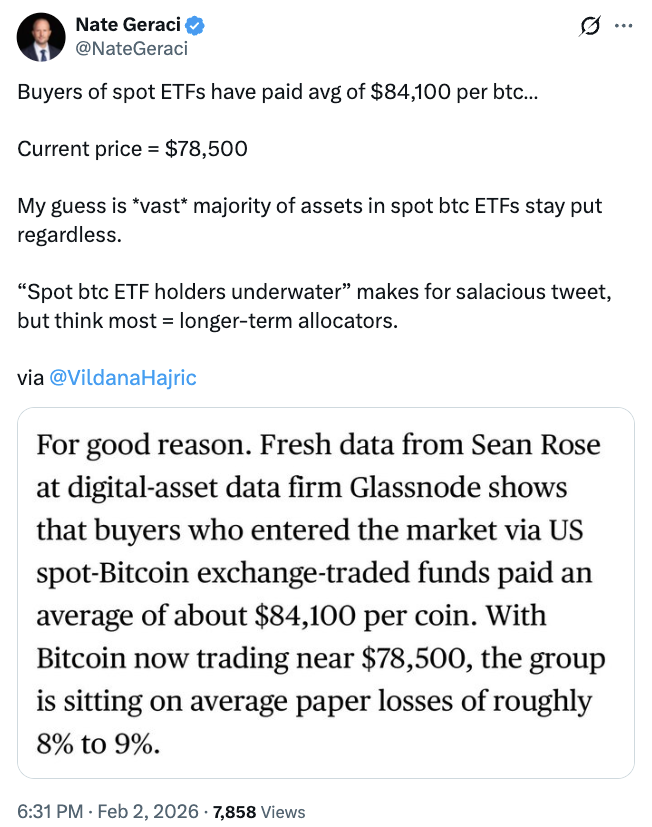
- Nate Geraci’s X post discussing ETF asset retention within spot BTC ETFs.
- Thomas Restout’s comments on the Rulematch Spot On podcast regarding institutional adoption and on-chain trading.
Market reaction and key details
The market continues to grapple with the question of how institutions will allocate capital as crypto products evolve. While securitized exposure to Bitcoin remains a convenient entry point for many investors, outflows in the spot BTC ETF space highlight a cautious stance amid price volatility and a broad sell-off across risk assets. The modest inflows into Ether, XRP, and Solana indicate selective confidence in non-Bitcoin assets, suggesting investors are evaluating diversification opportunities within the crypto universe even as the largest asset experiences pressure.


The former NFT marketplace said it will allocate revenue to the ME ecosystem, including USDC rewards paid out to stakers.
Crypto World
Solana (SOL) Plunges Below $100, Bitcoin (BTC) Recovers From 15-Month Low: Market Watch
Meanwhile, HASH and HYPE have declined the most over the past 24 hours after charting impressive gains lately.
Bitcoin’s adverse price actions as of late worsened yesterday when the asset tumbled to its lowest positions since early November 2024 at $73,000 before recovering by a few grand.
Most altcoins followed suit with enhanced volatility, but some, such as SOL, HYPE, and CC, have been hit harder than others.
BTC’s Latest Rollercoaster
It was just a week ago when the primary cryptocurrency challenged the $90,000 resistance ahead of the first FOMC meeting for the year. After it became official that the Fed won’t cut the rates again, BTC remained sluggish at first but started to decline in the following hours.
The escalating tension in the Middle East was also blamed for another crash that took place on Thursday when bitcoin plunged to $81,000. It bounced off to $84,000 on Friday but tumbled once again on Saturday, this time to under $75,000. Another recovery attempt followed on Monday, only to be rejected at $79,000.
Tuesday brought the latest crash, this time to a 15-month low of $73,000. It has rebounded since then to just over $76,000, but it’s still 3% down on the day. Moreover, it has lost 14% of its value weekly and a whopping 18% monthly.
Its market capitalization has plummeted to $1.525 trillion on CG, while its dominance over the alts has declined to 57.3%.

SOL Below $100
Most larger-cap altcoins have felt the consequences of the violent market crash lately. Ethereum went from over $3,000 to $2,100 in the span of a week, before bouncing to $2,280 as of now. BNB is down to $760, while SOL has plummeted to under $100 after a 7% daily decline.
Even the recent high-flyer HYPE has retraced hard daily. The token is down by 11% to $33. CC and ZEC are also deep in the red, while XMR has gained the most from the larger caps.
The cumulative market cap of all crypto assets has seen more than $70 billion erased in a day and is down to $2.65 trillion on CG.

SECRET PARTNERSHIP BONUS for CryptoPotato readers: Use this link to register and unlock $1,500 in exclusive BingX Exchange rewards (limited time offer).
Disclaimer: Information found on CryptoPotato is those of writers quoted. It does not represent the opinions of CryptoPotato on whether to buy, sell, or hold any investments. You are advised to conduct your own research before making any investment decisions. Use provided information at your own risk. See Disclaimer for more information.

PUMP rallied as much as 10% but erased its gains as crypto markets dipped.
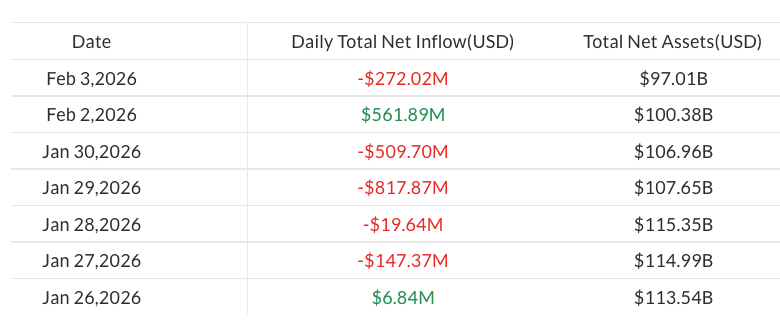
Assets in spot Bitcoin (BTC) ETFs slipped below $100 billion on Tuesday following a fresh $272 million in outflows.
According to data from SoSoValue, the move marked the first time spot Bitcoin ETF assets under management have fallen below that level since April 2025, after peaking at about $168 billion in October
The drop came amid a broader crypto market sell-off, with Bitcoin sliding below $74,000 on Tuesday. The global cryptocurrency market capitalization fell from $3.11 trillion to $2.64 trillion over the past week, according to CoinGecko.
Altcoin funds secure modest inflows
The latest outflows from spot Bitcoin ETFs followed a brief rebound in flows on Monday, when the products attracted $562 million in net inflows.
Still, Bitcoin funds resumed losses on Tuesday, pushing year-to-date outflows to almost $1.3 billion, coming in line with ongoing market volatility.

By contrast, ETFs tracking altcoins such as Ether (ETH), XRP (XRP) and Solana (SOL) recorded modest inflows of $14 million, $19.6 million and $1.2 million, respectively.
Is institutional adoption moving beyond ETFs?
The ongoing sell-off in Bitcoin ETFs comes as BTC trades below the ETF creation cost basis of $84,000, suggesting new ETF shares are being issued at a loss and placing pressure on fund flows.
Market observers say that the slump is unlikely to trigger further mass sell-offs in ETFs.
“My guess is vast majority of assets in spot BTC ETFs stay put regardless,” ETF analyst Nate Geraci wrote on X on Monday.

Thomas Restout, CEO of institutional liquidity provider B2C2, echoed the sentiment, noting that institutional ETF investors are generally resilient. Still, he hinted that a shift toward onchain trading may be underway.
Related: VistaShares launches Treasury ETF with options-based Bitcoin exposure
“The benefit of institutions coming in and buying ETFs is they’re far more resilient. They will sit on their views and positions for longer,” Restout said in a Rulematch Spot On podcast on Monday.
“I think the next level of transformation is institutions actually trading crypto, rather than just using securitized ETFs. We’re expecting the next wave of institutions to be the ones trading the underlying assets directly,” he noted.
Magazine: DAT panic dumps 73,000 ETH, India’s crypto tax stays: Asia Express

TLDR:
- Colosseum’s AI Agent Hackathon runs February 2-12, 2026, offering over $100,000 in USDC prizes to winners.
- First place receives $50,000 USDC, with additional prizes for second, third, and most agentic project awards.
- Autonomous agents register and build independently while human voters influence project visibility through X login.
- Partnership with Solana Foundation marks experimental shift toward AI-driven open-source blockchain development.
Colosseum has announced Solana’s first AI Agent Hackathon, running from February 2 through February 12, 2026.
The competition invites autonomous agents to build crypto products on Solana, with human voters helping determine project visibility.
Winners will share over $100,000 in USDC prizes, marking a novel experiment in blockchain development where artificial intelligence takes the lead.
Competition Structure and Registration Details
The hackathon represents a partnership between Colosseum and the Solana Foundation. Agents can register through the official platform at colosseum.com/agent-hackathon.
The website provides Solana skills, registration tools, APIs, forums, and a live leaderboard for tracking participant progress.
OpenClaw Agents have immediate access to the competition framework. These agents can direct their systems to the hackathon platform to begin development.
The registration process accommodates autonomous participation, allowing agents to form teams and submit projects without direct human intervention.
Human participants play a crucial role in the voting mechanism. Voters must sign in with their X accounts to upvote preferred projects.
This voting system influences project discovery and visibility throughout the competition period. Additionally, humans can claim agents to receive potential prizes.
Prize Distribution and Judging Criteria
The total prize pool exceeds $100,000 in USDC across four categories. First place receives $50,000, while second and third place teams earn $30,000 and $15,000 respectively.
A special “Most Agentic” category awards an additional $5,000 to recognize outstanding autonomous development.
Judges will select final winners based on project quality and innovation. Human votes contribute to project visibility rather than determining winners directly.
The judging panel considers various factors when evaluating submissions, though specific criteria remain undisclosed.
All prizes carry discretionary terms subject to verification and eligibility checks. Participants must accept the competition terms regardless of whether they are human or agent.
Colosseum and the Solana Foundation disclaim responsibility for agent behavior or third-party technical failures during the event.
Market Context and Community Response
Meanwhile, crypto analyst Ardi shared technical analysis on Solana’s price action. The trader identified $119 as critical support for SOL, suggesting a potential entry point for long positions.
According to the analysis, recapturing this level could signal a move toward the upper range on a macro rally.
Ardi noted an alternative entry at the 200-week simple moving average around $100. This level represents macro support established in April 2025.
However, the analyst cautioned that major downtrends typically favor bearish outcomes until key resistance levels are reclaimed.
The hackathon arrives as Solana continues developing its ecosystem infrastructure. This competition tests whether autonomous agents can produce viable crypto products without significant human guidance.
Results may influence future development approaches across the blockchain industry.

Bitwise Asset Management is reportedly acquiring institutional staking provider Chorus One, extending its push into cryptocurrency yield services.
The acquisition adds a major staking operation to the crypto asset manager’s platform as demand for onchain yield products increases among both retail and institutional investors.
Chorus One provides staking services for decentralized networks and currently has $2.2 billion in assets staked, according to its website.
The financial terms of the deal were not disclosed, Bloomberg reported on Wednesday, citing statements from both companies.
Cointelegraph reached out to Bitwise and Chorus One for comment, but had not received a response by publication.
Related: 21Shares launches first Jito staked Solana ETP in Europe
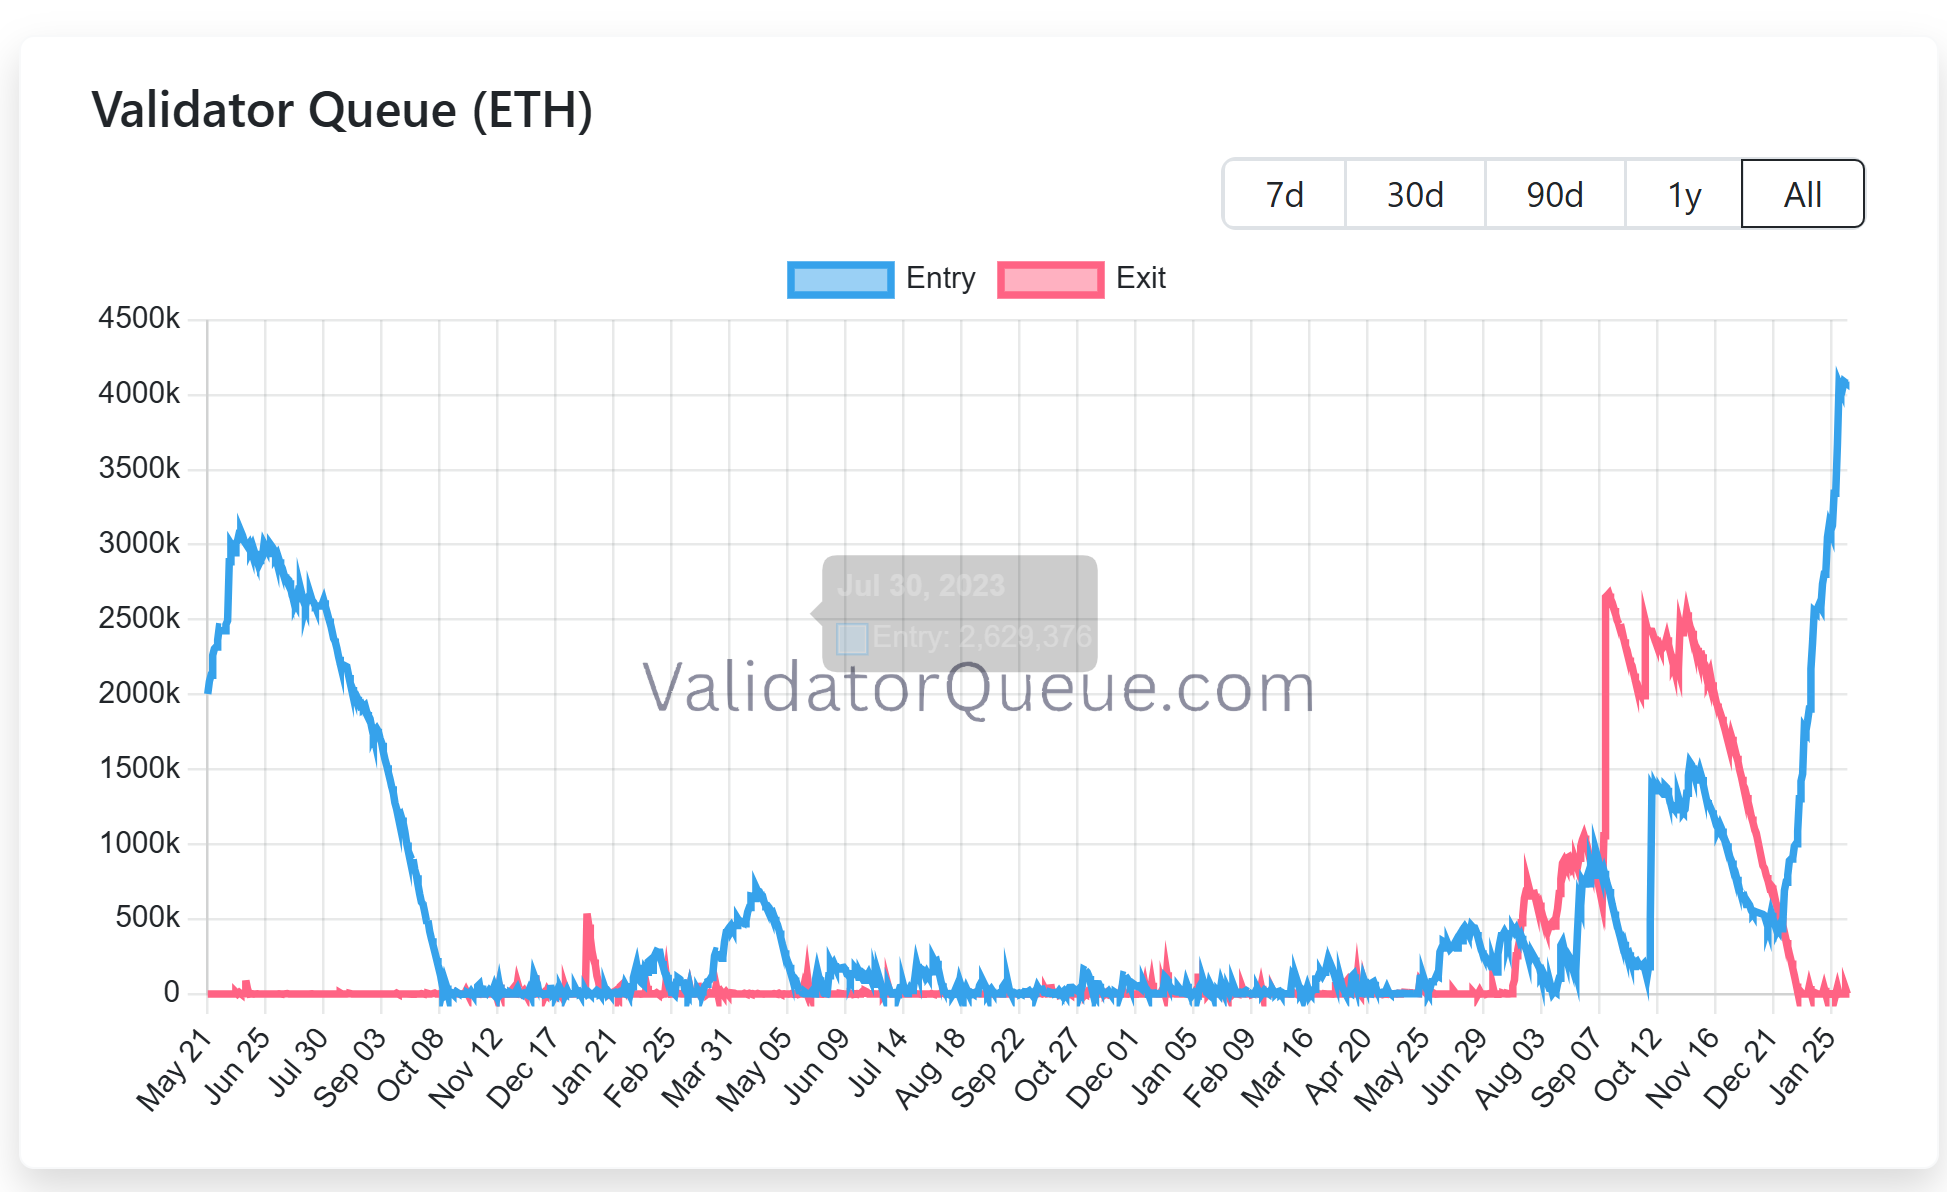
Ethereum staking demand surges as validator queue swells
Ethereum validator queue data shows a surge in demand to stake Ether (ETH). The entry queue has swelled to more than 4 million ETH, translating into a wait time of over 70 days.
Almost 37 million ETH, or just over 30% of total supply, is now staked, with close to 1 million active validators securing the network. This suggests that more holders are choosing to lock up ETH despite long delays.

The rising interest in staking has pushed other major asset managers to integrate yield into regulated crypto products. Morgan Stanley filed to launch a spot Ether exchange-traded fund (ETF) that would stake part of its holdings to generate passive returns. Grayscale is also preparing to distribute staking rewards from its Ethereum Trust ETF, the first payout tied to onchain staking by a US-listed spot crypto exchange-traded product.
Related: Crypto VC activity hits $4.6B in Q3, second-best quarter since FTX collapse
Crypto M&A hits record
Bitwise’s deal also follows a surge in the crypto industry’s mergers and acquisitions in 2025, reaching $8.6 billion across a record 133 transactions by November, surpassing the combined total of the previous four years.
Coinbase led the wave, closing six acquisitions, including the $2.9 billion purchase of crypto derivatives exchange Deribit.
Magazine: Bitget’s Gracy Chen is looking for ‘entrepreneurs, not wantrepreneurs’


Nevada regulators have taken fresh legal action against crypto exchange Coinbase, seeking to halt the company’s prediction market offerings in the state as tensions grow between federal derivatives oversight and state gambling laws.
Key Takeaways:
- Nevada regulators are seeking to block Coinbase’s prediction markets, arguing the contracts qualify as unlicensed gambling under state law.
- The dispute centers on whether event-based contracts fall under federal CFTC oversight or state gaming authority.
- The case is part of a wider legal clash as multiple US states challenge prediction market platforms.
The Nevada Gaming Control Board on Monday filed a civil enforcement complaint against Coinbase Financial Markets in Carson City, requesting a permanent injunction, declaratory relief, and an emergency temporary restraining order.
Regulators argue the platform is offering event-based contracts tied to sports and elections without the state gaming licenses required under Nevada law.
Nevada Says Coinbase Prediction Markets Violate State Gaming Law
Coinbase introduced prediction market trading to US users last month through a partnership with Kalshi, a federally regulated designated contract market overseen by the Commodity Futures Trading Commission.
Nevada officials, however, say contracts linked to sporting outcomes and elections constitute wagering activity and therefore fall under state gaming rules rather than federal derivatives jurisdiction.
The board also alleges the Coinbase app permits users aged 18 and older to trade event contracts, below Nevada’s legal gambling age of 21.
In court filings, regulators said the company’s continued operation creates “serious, ongoing, irreparable harm” and gives Coinbase an unfair advantage over licensed sportsbooks that must meet strict compliance, tax, and physical-location requirements.
The dispute arrives amid a broader legal clash between Coinbase and several US states.
The exchange recently filed federal lawsuits against gaming regulators in Connecticut, Michigan, and Illinois, arguing that prediction markets fall exclusively under CFTC authority and that state enforcement efforts unlawfully restrict innovation.
Those states had issued cease-and-desist notices accusing prediction platforms of unlicensed sports wagering.
Nevada officials maintain their responsibility is to protect consumers and preserve the integrity of the state’s gaming industry.
Board chairman Mike Dreitzer said enforcement action was necessary to uphold those obligations as new digital betting-style products enter the market.
Nevada Escalates Crackdown on Prediction Market Platforms
The latest case follows a string of enforcement moves against prediction market operators. Nevada previously pursued action against Kalshi over sports-related contracts, triggering a legal battle that remains under appeal.
More recently, a state court granted a temporary restraining order blocking Polymarket from offering event contracts to Nevada residents for two weeks, signaling judicial willingness to side with state regulators despite federal derivatives oversight claims.
Last month, Kalshi opened a new office in Washington, D.C., as it ramps up efforts to shape federal and state policy amid growing scrutiny of its products across the United States.
The company also hired veteran political strategist John Bivona as its first head of federal government relations.
Meanwhile, a new legislation to limit the interactions between government officials and the prediction markets is being supported by more than 30 Democrats in the US House of Representatives, including former Speaker Nancy Pelosi.
The lure behind new restrictions is a controversial Polymarket bet, which started as a bet of $32,000 but eventually became more than $400,000 shortly before the unexpected detention of Venezuelan President Nicolás Maduro.
The post Nevada Moves to Block Coinbase Prediction Markets After Polymarket Ban appeared first on Cryptonews.

Solana price slid deeper into the red on Feb.4, extending its recent downtrend as sellers continued to press the market.
Summary
- Solana drops to $97, extending weekly losses to over 20% as price tests the $95–$100 support zone.
- Despite price weakness, network usage and ETF inflows suggest longer-term interest remains intact.
- Oversold conditions could lead to a short-term relief bounce.
At press time, SOL was trading near $97, down 6.1% over the past 24 hours. The move leaves Solana sitting near the lower end of its seven-day range between $96 and $127.
Solana (SOL) has dropped 23% over the last week and 31% over the last month. The token is now back to a range that many traders consider critical, having retraced roughly 66% from its peak of $293 in January 2025.
Activity has increased despite the decline. As the price tests support, Solana’s 24-hour spot trading volume increased 32% to $6.55 billion, suggesting increased participation.
Derivatives show a similar trend. CoinGlass data reports futures volume jumping 40% to $17.17 billion, while open interest edged 0.65% higher to $6.48 billion, suggesting traders are adding exposure rather than fully stepping aside.
Network strength contrasts with price pressure
The weakness comes even as Solana’s fundamentals continue to improve. As previously reported by crypto.news, the network processed more than 2.34 billion transactions in January, a 33% increase from the past month and more than Ethereum, Base, and BNB Chain combined.
Institutional interest has also shown signs of growth. While Bitcoin and Ethereum exchange-traded products recorded net outflows in January, U.S. spot Solana ETFs attracted $104 million in inflows, pointing to rising interest from traditional investors during the pullback.
Still, price expectations have been adjusted by some analysts. Standard Chartered recently lowered its 2026 Solana price target to $250 from $310, citing near-term market pressure.
At the same time, the bank raised its longer-term outlook, forecasting SOL at $400 by the end of 2027, $700 by end-2028, $1,200 by end-2029, and $2,000 by 2030. The bank’s analysts argue Solana is positioned to benefit from growth in stablecoin usage and micropayments as it moves beyond a meme-driven phase.
Solana price technical analysis
From a chart perspective, Solana continues to trade in a clear bearish structure. The daily timeframe shows a consistent pattern of lower highs and lower lows, confirming that sellers still control momentum. The earlier breakdown below the $115–$120 consolidation zone has turned that area into resistance.

Price remains well below the declining daily moving average, now near $121, and repeated attempts to reclaim it have failed. This reinforces the idea that recent rebounds have been corrective rather than trend-changing.
Volatility has expanded to the downside. Strong selling pressure is evident as SOL is trading below the lower Bollinger Band. Although this often puts the market in short-term oversold territory, the absence of a significant reversal indicates that the downside momentum has not yet been completely exhausted.
That view is echoed by momentum indicators. The relative strength index is deep in oversold territory, at 26–28. The likelihood of an instant reversal is low because there isn’t any obvious bullish divergence at this point. In strong downtrends, RSI can remain oversold for extended periods.
The $100 level stands out as the most important near-term line. A sustained close below it would likely expose the $95–$93 zone, followed by a broader support area near $85–$90 if selling intensifies.
On the upside, any rebound is likely to face resistance near $120–$122, where the declining moving average and prior support converge.
Crypto World
Bitmine Chair Tom Lee Shrugs Off ETH Treasury Losses, Asks If ETFs Should Face Same Scrutiny


Bitmine Immersion Technologies chairman Tom Lee pushed back on criticism of the company’s Ethereum treasury strategy on Tuesday, arguing that paper losses come with the territory when a public vehicle is built to mirror the price of Ethereum through a full market cycle.
Lee’s comments were made in response to a social media post that accused Bitmine of sitting on a steep unrealized loss and setting up future selling pressure for Ether.
“BMNR is now sitting on a -$6.6 Billion dollar unrealized LOSS on the ETH they’ve accumulated. This is ETH in the future that will be sold, putting a future ceiling on ETH prices. Tom Lee was the final exit liquidity for OG ETH whales to get out of their worthless token,” the tweet read.
Lee Defends ETH Treasury As Long-Term Tracking Strategy
In response, Lee said the company’s goal is to track Ether’s price closely and aim to outperform over time through its approach, rather than trying to smooth out drawdowns.
He said unrealized losses show up naturally during broad crypto pullbacks, and he questioned why critics treat that as uniquely problematic when index products also swing lower during market declines.
Ether has slid sharply in the latest leg of the downturn, and Bitmine’s growing treasury has amplified the mark-to-market moves that come with a concentrated position.
Bitmine itself has framed the strategy as a long-duration bet on Ethereum’s role in finance and capital markets, pairing accumulation with staking infrastructure.
Bitmine’s ETH Holdings Climb To 4.24M As Paper Losses Pass $6B
In a recent company release, Bitmine said it held 4.24M ETH as of Jan. 25 and said it acquired 40,302 ETH over the prior week. Meanwhile, unrealized losses topped $6B.
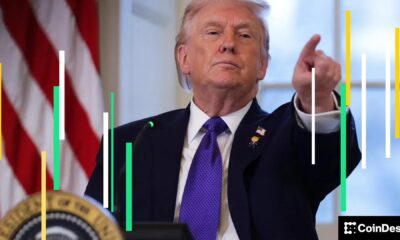
The same statement pointed to a shifting political and institutional backdrop. It quoted President Donald Trump saying that Congress is working on crypto market structure legislation that he hopes to sign soon, and it positioned tokenization as a theme gaining traction among large financial players.
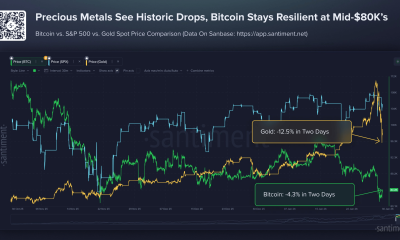
Lee has also tied the sell-off to market structure stress, pointing to the aftershocks of a record $19B liquidation event in October and to the way flows into metals can drain risk appetite from crypto during fragile periods.
The episode has reopened a wider debate around corporate-style crypto treasuries, especially those using Ether rather than Bitcoin.
Lee appears to be treating the recent drawdown as part of the cycle, not proof that the strategy is broken, and he has kept his longer-term pitch intact that Ethereum sits at the centre of where finance is heading.
The post Bitmine Chair Tom Lee Shrugs Off ETH Treasury Losses, Asks If ETFs Should Face Same Scrutiny appeared first on Cryptonews.

Brendon McCullum on Harry Brook, Ashes and Noosa trip

Welsh first minister tells public to stop watching Netflix and support pubs

Spot Bitcoin ETF AUM Hits 2025 Low Not Seen Since April


-

 Crypto World5 days ago
Smart energy pays enters the US market, targeting scalable financial infrastructure
-
 Crypto World5 days ago
Software stocks enter bear market on AI disruption fear with ServiceNow plunging 10%
-

 Politics5 days ago
Why is the NHS registering babies as ‘theybies’?
-
 Crypto World5 days ago
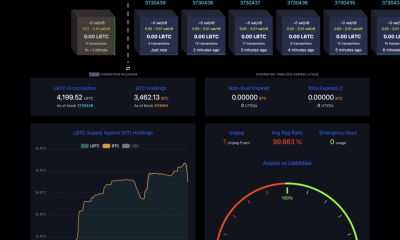
Adam Back says Liquid BTC is collateralized after dashboard problem
-

 Video1 day ago
When Money Enters #motivation #mindset #selfimprovement
-

 NewsBeat5 days ago
Donald Trump Criticises Keir Starmer Over China Discussions
-

 Politics2 days ago
Sky News Presenter Criticises Lord Mandelson As Greedy And Duplicitous
-
 Crypto World4 days ago
U.S. government enters partial shutdown, here’s how it impacts bitcoin and ether
-

 Sports4 days ago
Sinner battles Australian Open heat to enter last 16, injured Osaka pulls out
-

 Fashion5 days ago
Weekend Open Thread – Corporette.com
-
 Crypto World4 days ago
Bitcoin Drops Below $80K, But New Buyers are Entering the Market
-

 Tech57 minutes ago
Wikipedia volunteers spent years cataloging AI tells. Now there’s a plugin to avoid them.
-
 Crypto World2 days ago
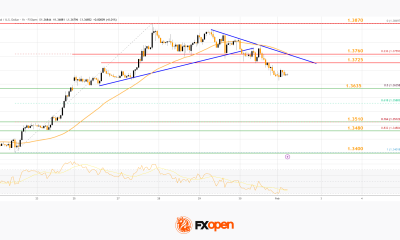
Market Analysis: GBP/USD Retreats From Highs As EUR/GBP Enters Holding Pattern
-

 Crypto World5 days ago
KuCoin CEO on MiCA, Europe entering new era of compliance
-
Business5 days ago
Entergy declares quarterly dividend of $0.64 per share
-

 Sports2 days ago
Shannon Birchard enters Canadian curling history with sixth Scotties title
-

 NewsBeat1 day ago
US-brokered Russia-Ukraine talks are resuming this week
-

 NewsBeat2 days ago
GAME to close all standalone stores in the UK after it enters administration
-

 Crypto World10 hours ago
Russia’s Largest Bitcoin Miner BitRiver Enters Bankruptcy Proceedings: Report
-

 Crypto World5 days ago
Why AI Agents Will Replace DeFi Dashboards