
Crypto World
What Is a Change of Character (CHoCH) in Trading? Definition, Signals, and Examples
In Smart Money Concept (SMC) trading, recognising when market momentum shifts can mean the difference between catching a trend reversal and holding a losing position. The Change of Character (CHoCH) is a price action pattern that can signal these pivotal moments when the balance between buyers and sellers tips. Unlike continuation patterns that confirm ongoing momentum, a CHoCH alerts traders to prepare for directional changes.
This article explores how to identify CHoCH patterns on a chart, explains how they differ from similar concepts like Break of Structure and Market Structure Shift, and demonstrates their practical application through real trading examples.
Takeaways
- CHoCH is a concept that signals potential trend reversals in Smart Money Concept trading. This pattern has two forms: bullish CHoCH and bearish CHoCH. A bullish CHoCH occurs when price breaks above a recent lower high in a downtrend, while a bearish CHoCH happens when price falls below a recent higher low in an uptrend, indicating possible momentum shifts.
- A CHoCH is usually compared to a Break of Structure (BOS). However, these concepts are opposite. BOS confirms trend continuation by breaking in the direction of the existing trend, whereas CHoCH signals a potential reversal by breaking against the prevailing trend.
- Another common pattern the CHoCH is compared to is a Market Structure Shift (MSS). However, MSS is a higher-confluence CHoCH that includes additional confirmation signals like a lower high (bearish) or higher low (bullish) before the break, plus strong displacement.
- Change of Character patterns can be found across all timeframes, from intraday to weekly charts, with higher-timeframe signals generally carrying more significance.
Understanding Breaks of Structure
Before delving into concepts like Change of Character (CHoCH) traders should understand the Breaks of Structure (BOS) pattern. A BOS in trading signifies a continuation within the current trend and is marked by a clear deviation from established swing points that indicate previous highs and lows.
In the context of an uptrend, a BOS is identified when the price exceeds a previous high without moving below the most recent higher low. This action confirms that the upward momentum is still strong and likely to continue as buyers push the market to new heights.
Similarly, in a downtrend, a BOS occurs when prices drop below a previous low without breaking the prior lower high, suggesting that sellers remain in control and the downward trend is set to persist.
By recognising these points where the market extends beyond its former bounds, traders can confirm that the current trend is robust and act accordingly. This foundational concept of BOS may not only help in assessing trend strength but also sets the stage for understanding more complex patterns like CHoCH, where the focus shifts from trend continuation to potential trend reversals.
CHoCH Trading Meaning

In trading, a Change of Character (CHoCH) is a concept that reflects a potential shift in market dynamics, often indicating a reversal from the prevailing trend. It may help traders discern when the momentum is shifting, offering a strategic point to consider adjusting their positions.
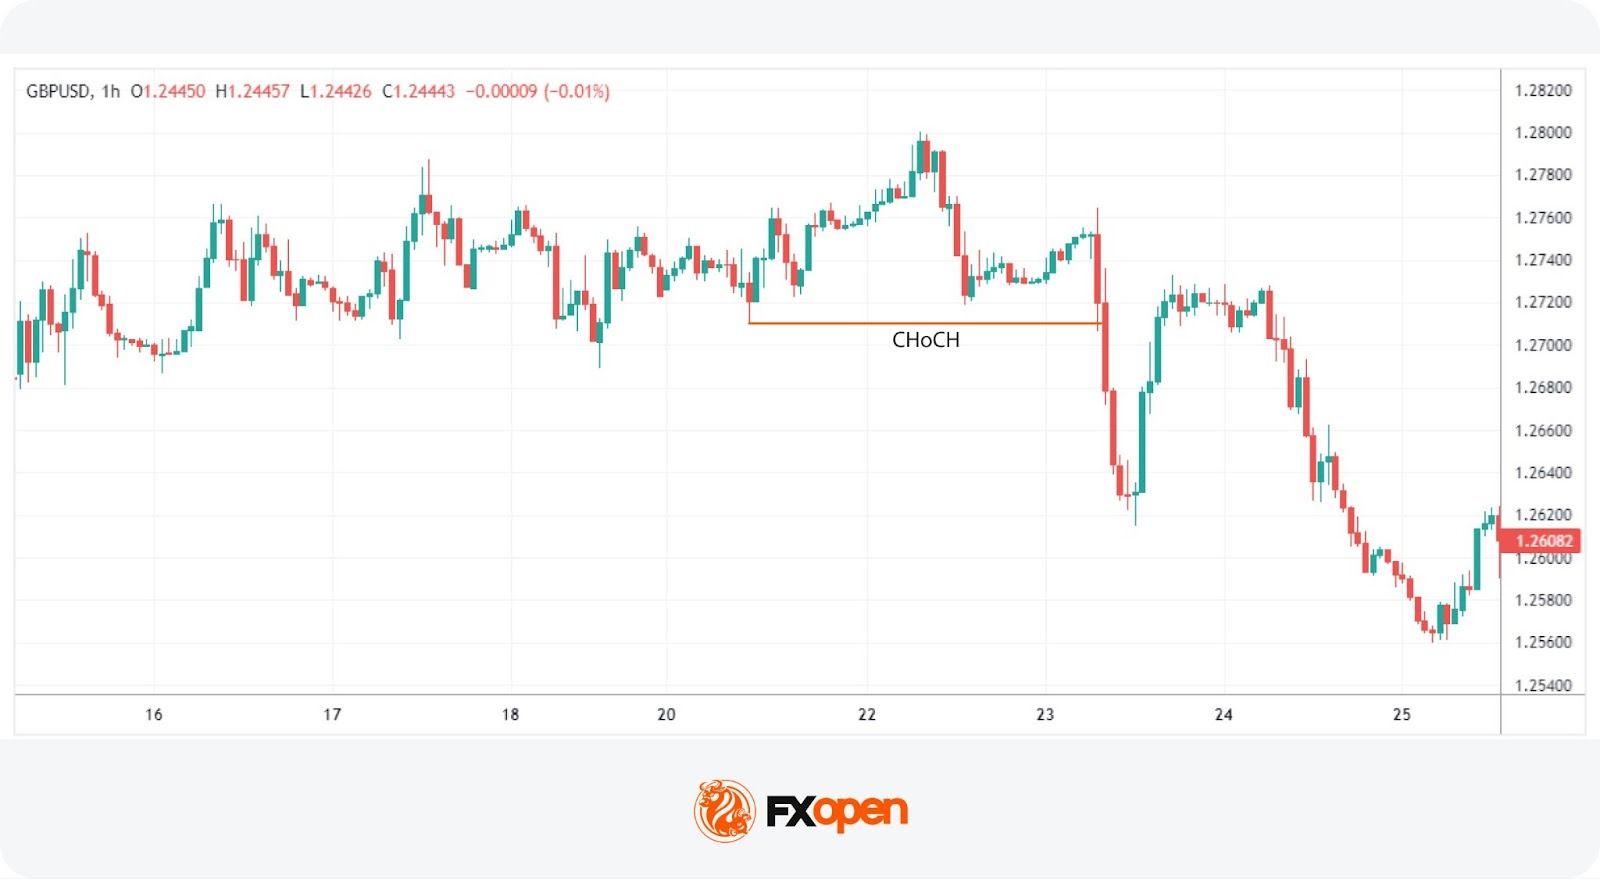
A CHoCH occurs when there’s a noticeable deviation in the market’s price trend. For example, in a bullish trend characterised by a series of higher highs and higher lows, a CHoCH is indicated by the price failing to set a new high and subsequently falling below a recent higher low. This suggests that buyers are losing control, and a bearish trend could be emerging.
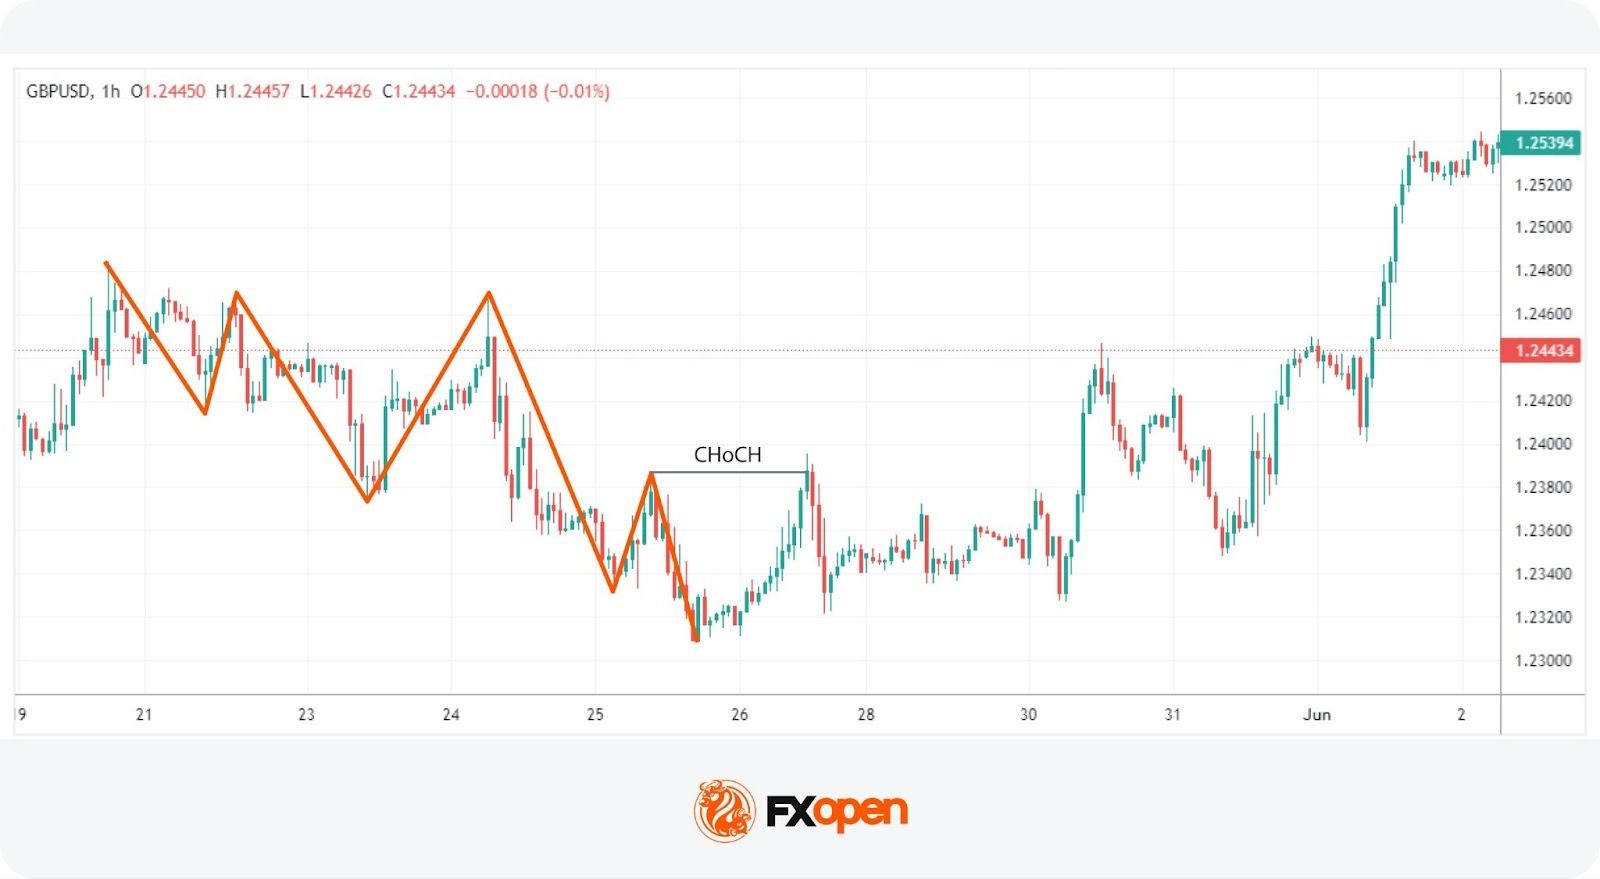
Similarly, during a bearish trend marked by lower highs and lower lows, a bullish CHoCH would occur if the price unexpectedly breaks above a recent lower high. This break indicates that sellers are losing their grip, and a bullish trend may be starting.
The Significance of CHoCHs Across Timeframes
The fractal nature of financial markets means that patterns and behaviours recur across various timeframes, each providing unique insights and implications for trading. Understanding CHoCHs in different timeframes may help traders align their strategies with both short- and long-term trend shifts. This is known as multi-timeframe analysis.
In intraday trading, where decisions are made on lower timeframes (like minutes or hours), a CHoCH can signal a possible short-term trend reversal. For example, if a currency pair in a downtrend on a 15-minute chart suddenly posts a higher high, this could indicate a weakening of the bearish momentum, suggesting a potential bullish reversal.
Traders might use this information to close short positions or to consider a long position, capitalising on the emerging upward trend. These short-term CHoCHs allow traders to respond quickly to market changes, potentially securing returns before larger market shifts occur.
Conversely, CHoCHs observed on higher timeframes, such as daily or weekly charts, are particularly significant because they can indicate a shift in the broader market trend that might last days, weeks, or even months. Such changes can then be used by both long and short-term traders to adjust their positioning and directional bias.
How Is Change of Character Identified?
The initial step to identify a CHoCH in trading involves clearly defining the existing trend on a specific timeframe. This is done by marking the significant swing highs and lows that delineate the trend’s progress. These points should represent somewhat meaningful retracements in the price, providing clear markers of trend continuity or potential reversal points.
According to the Smart Money Concept (SMC) theory, the integrity of an uptrend is maintained as long as the price does not trade through the most recent significant higher low. Conversely, a downtrend is considered intact if the price does not surpass the most recent significant lower high. Therefore, traders focus their attention on these critical points.
To identify a CHoCH, traders watch for a break in these crucial high or low points. For instance, in an uptrend, a bearish CHoCH is indicated when the price achieves a higher high but then reverses to descend below the previous significant higher low.
Similarly, in a downtrend, a bullish CHoCH occurs when the price drops to a lower low before reversing to break above the previous significant lower high, setting a new high. Both types of breaks signal a potential reversal in the trend direction.
To try and spot your own CHoCHs, you can head over to FXOpen’s TickTrader platform to access real-time charts and numerous market analysis tools.
Application of CHoCH
CHoCHs should be integrated with other aspects of the SMC framework. This includes the use of order blocks and imbalances, which are important components in identifying potential reversals.
Order Blocks and Imbalances
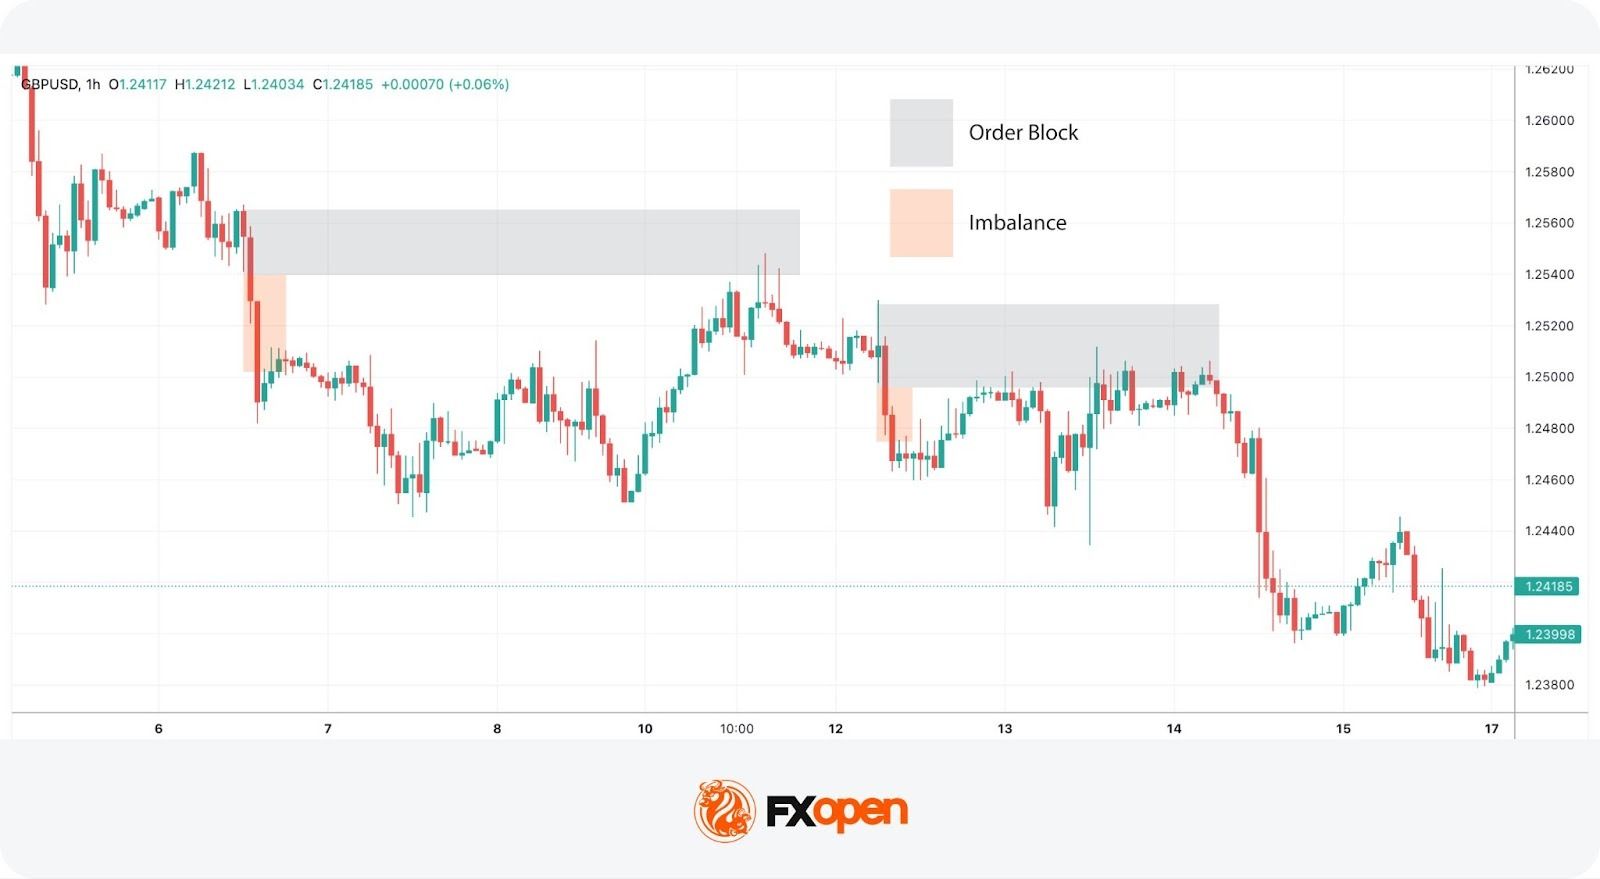
An order block is essentially a substantial consolidation area where significant buying or selling has occurred, and prices often revisit these zones before reversing. These blocks can be seen as levels where institutional orders were previously concentrated.
An imbalance, also known as a fair value gap, occurs when the price moves sharply up or down, leaving a zone that has not been traded extensively. Price often returns to these gaps to ‘fill’ them, establishing equilibrium before a potential reversal happens.
In practice, traders can look for a sequence where the price first approaches an order block and begins to fill any existing imbalances. This setup increases confidence in a potential reversal. As the price meets these criteria and a CHoCH occurs, this indicates that the influence of the order block is likely to initiate a price reversal.
Practical Example on GBP/USD
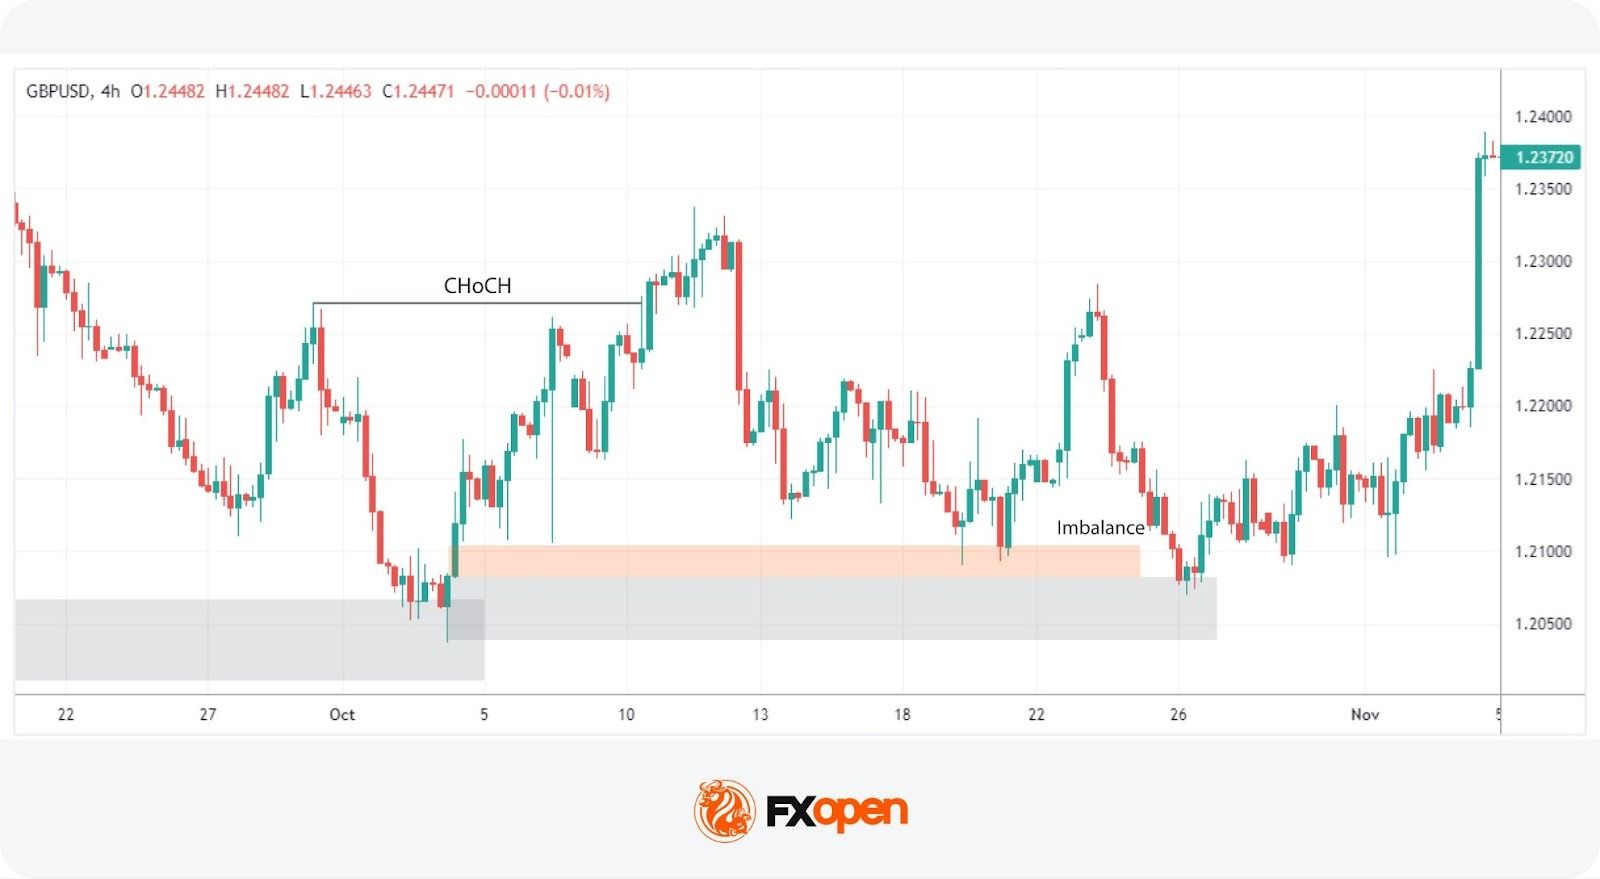
Consider the 4-hour chart of the GBP/USD pair above. We see the pair encounter an order block on the left, one that’s visible on the daily chart. As the price interacts with this block, it begins to retrace, attempting to fill the imbalance but moves away. Eventually, the price completes the fill of the imbalance and meets the previously established order block.
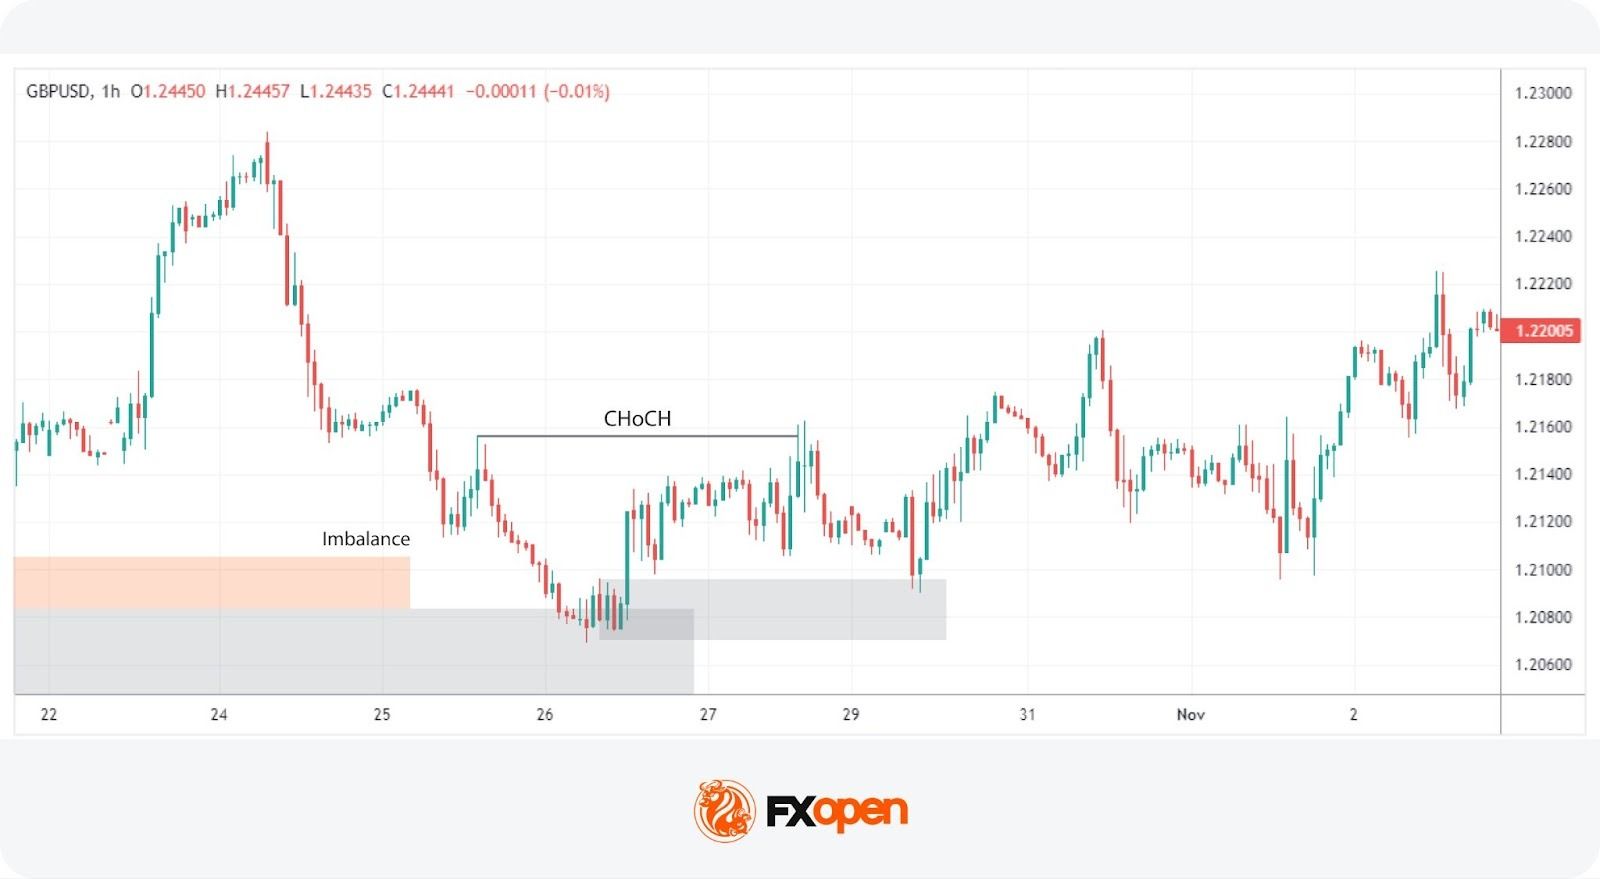
Switching to a 1-hour timeframe, this scenario unfolds similarly. After reaching the order block on the 4-hour chart, another CHoCH occurs, signalling the start of a new uptrend. This lower timeframe CHoCH, following the meeting of the order block, corroborates the potential for a reversal initiated by the higher timeframe dynamics.
This example illustrates how CHoCHs can be utilised across different timeframes, tying back to the fractal nature of markets discussed earlier. By recognising these patterns and understanding their interaction with order blocks and imbalances, traders can strategically position themselves to capitalise on potential market reversals, aligning their trades with deeper market forces at play.
Change of Character vs Market Structure Shift
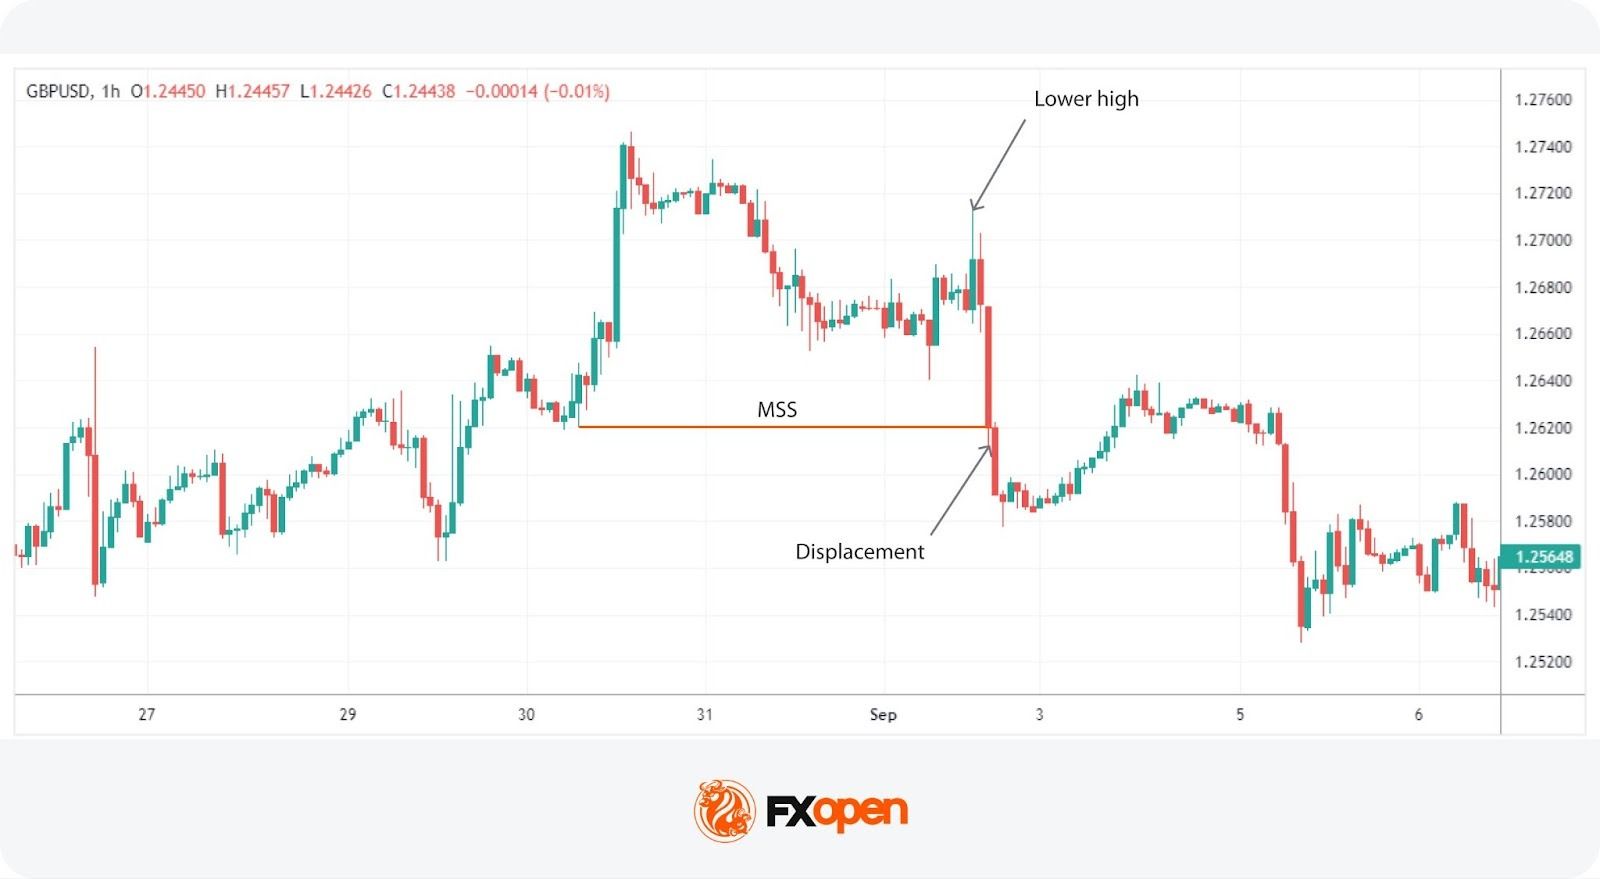
A Market Structure Shift (MSS) is a specific type of Change of Character that includes additional signals suggesting a potential trend reversal. Unlike a straightforward CHoCH that typically indicates a trend is shifting but may also be a false break, an MSS can be seen as a higher confluence CHoCH. An MSS occurs after the market first makes a key movement contrary to the established trend—forming a lower high in an uptrend or a higher low in a downtrend—without plotting a higher high or lower low.
Following these preliminary signals, an MSS is confirmed when there is a decisive break through a significant swing point accompanied by a strong displacement (i.e. impulse) move, creating a CHoCH in the process. This sequence not only reflects that the prevailing trend has paused but also that a new trend in the opposite direction is establishing itself.
Due to these additional confirmations, an MSS can offer added confirmation for traders, indicating a stronger likelihood that a new, sustainable trend has begun. This makes the MSS particularly valuable for traders looking for more substantiated signals in their trading strategy.
The Bottom Line
The Change of Character (CHoCH) is one of the popular Smart Money concepts, offering traders valuable insight into potential market reversals. By learning to identify CHoCH patterns, traders can align their strategies with institutional order flow. However, as with any trading tool, CHoCH isn’t used in isolation but combined with other market analysis techniques.
To test different trading approaches, you can consider opening an FXOpen account and access a wide range of financial assets, low commissions*, and tight spreads* (*additional fees may apply).
FAQ
What Is CHoCH in Trading?
In trading, CHoCH is a technical observation that signifies a change in the trend’s character, where the price movement breaks from its established pattern of highs and lows, suggesting a potential reversal or substantial shift in the market’s direction.
What Is CHoCH in SMC Trading?
In Smart Money Concept (SMC) trading, a Change of Character (CHoCH) refers to a clear shift in market behaviour that indicates a potential reversal of the prevailing trend. This concept is used by traders to detect early signs of a momentum shift that might lead to significant changes in price direction, enabling strategic adjustments to their trading positions.
What Is a CHoCH in the Market Structure?
A CHoCH in market structure is identified when there is an observable deviation from established price patterns — specifically when new highs or lows contradict the current trend. It signifies that the previous market sentiment is weakening, and a new opposite trend may be starting, prompting traders to reassess their strategies.
How Is CHoCH Identified on a Price Chart?
Identifying a CHoCH involves monitoring significant swing highs and lows for breaks that are contrary to the existing trend. For instance, in an uptrend, a CHoCH would be indicated by a failure to reach a new high followed by a drop below the recent higher low, suggesting a shift to a bearish outlook.
What Is ChoCH vs BOS in Trading?
While both CHoCH and Break of Structure (BOS) are critical in assessing market dynamics, they serve different purposes. CHoCH indicates a potential trend reversal by highlighting a significant change in the price pattern. In contrast, a BOS indicates a continuation of the current trend by showing the price surpassing previous significant highs or lows, reinforcing the ongoing direction.
This article represents the opinion of the Companies operating under the FXOpen brand only. It is not to be construed as an offer, solicitation, or recommendation with respect to products and services provided by the Companies operating under the FXOpen brand, nor is it to be considered financial advice.

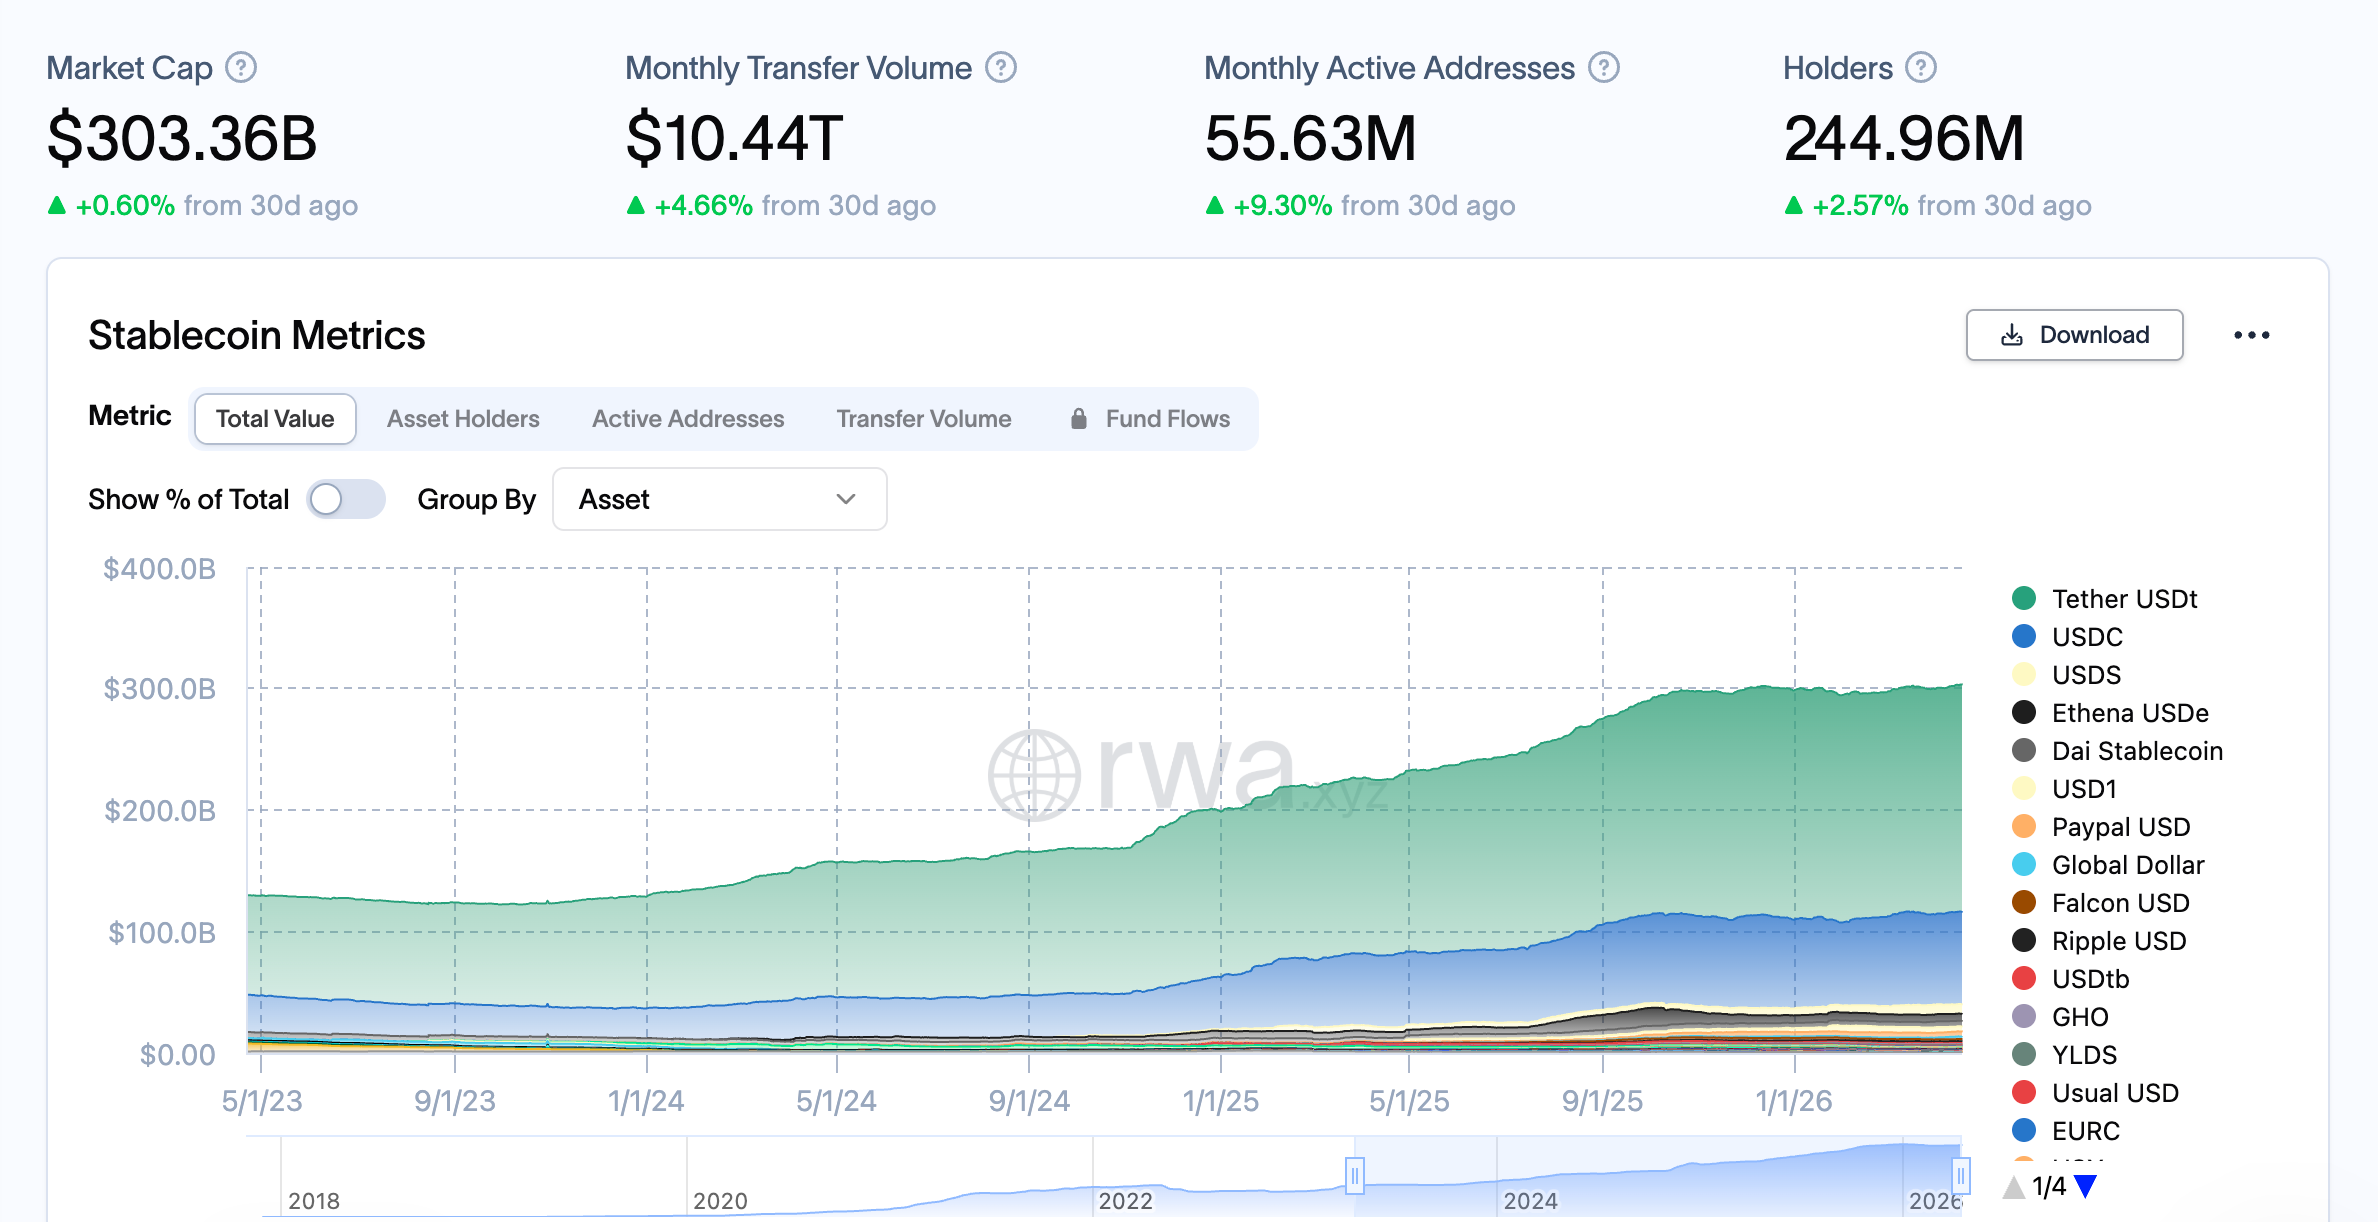
The impact of stablecoins on the banking sector appears “limited” at the current phase of the adoption cycle, but banks could face increasing competition and an erosion of market share as the stablecoin sector and tokenized real-world assets (RWAs) grow in market capitalization.
“So far, the use of stablecoins remains limited, but their market capitalization exceeded $300 billion at the end of last year,” Abhi Srivastava, associate vice president of Moody’s Investors Service Digital Economy Group, told Cointelegraph.

The role of stablecoins in payments, cross-border commerce and onchain finance is “expanding,” despite their currently limited role, Srivastava said, adding that existing payment systems in the US are already “fast, low-cost and trusted.” He said:
“For the banking sector, at this stage, disruption risk appears limited. In the near term, US rules that prohibit stablecoins from paying yield mean they are unlikely to replace traditional deposits at scale domestically.”
However, over time, growing adoption of stablecoins and tokenized RWAs, traditional or physical financial assets represented on a blockchain by a token, could place “pressure” on the banking sector, leading to deposit outflows and reduced lending capacity, he said.
Stablecoin regulatory policy has become a hot-button issue among crypto industry executives and those in the banking sector, with fears that yield-bearing stablecoins could erode banking market share proving to be a stumbling block for the CLARITY crypto market structure bill in Congress.
Related: Stablecoins behave like FX markets as liquidity splits: Eco CEO
CLARITY Act stalled, as banks fight yield-bearing stablecoins
The Digital Asset Market Clarity Act of 2025, also known as the CLARITY Act, is a comprehensive crypto market regulatory framework that establishes an asset taxonomy, regulatory jurisdiction and oversight over the crypto markets.

It is now stalled in Congress after a group of crypto industry companies, led by cryptocurrency exchange Coinbase, publicly stated opposition to earlier drafts of the bill.
A lack of legal protections for open-source software developers and a prohibition on yield-bearing stablecoins were among some of the most contentious issues cited by crypto industry opponents of the legislation.
Several attempts have been made by US lawmakers and the White House to negotiate a bill acceptable to both the crypto industry and the bank lobby.
Earlier this month, North Carolina Senator Thom Tillis said he plans to release an updated draft bill proposal that would be acceptable to both sides; however, the bill has reportedly received pushback, according to Politico, and has yet to be publicly released.
However, other crypto industry executives and market analysts have warned that if the CLARITY Act fails to pass, it could open the crypto industry up to future regulatory crackdowns by hostile lawmakers and officials.
Magazine: Stablecoins will see explosive growth in 2025 as world embraces asset class
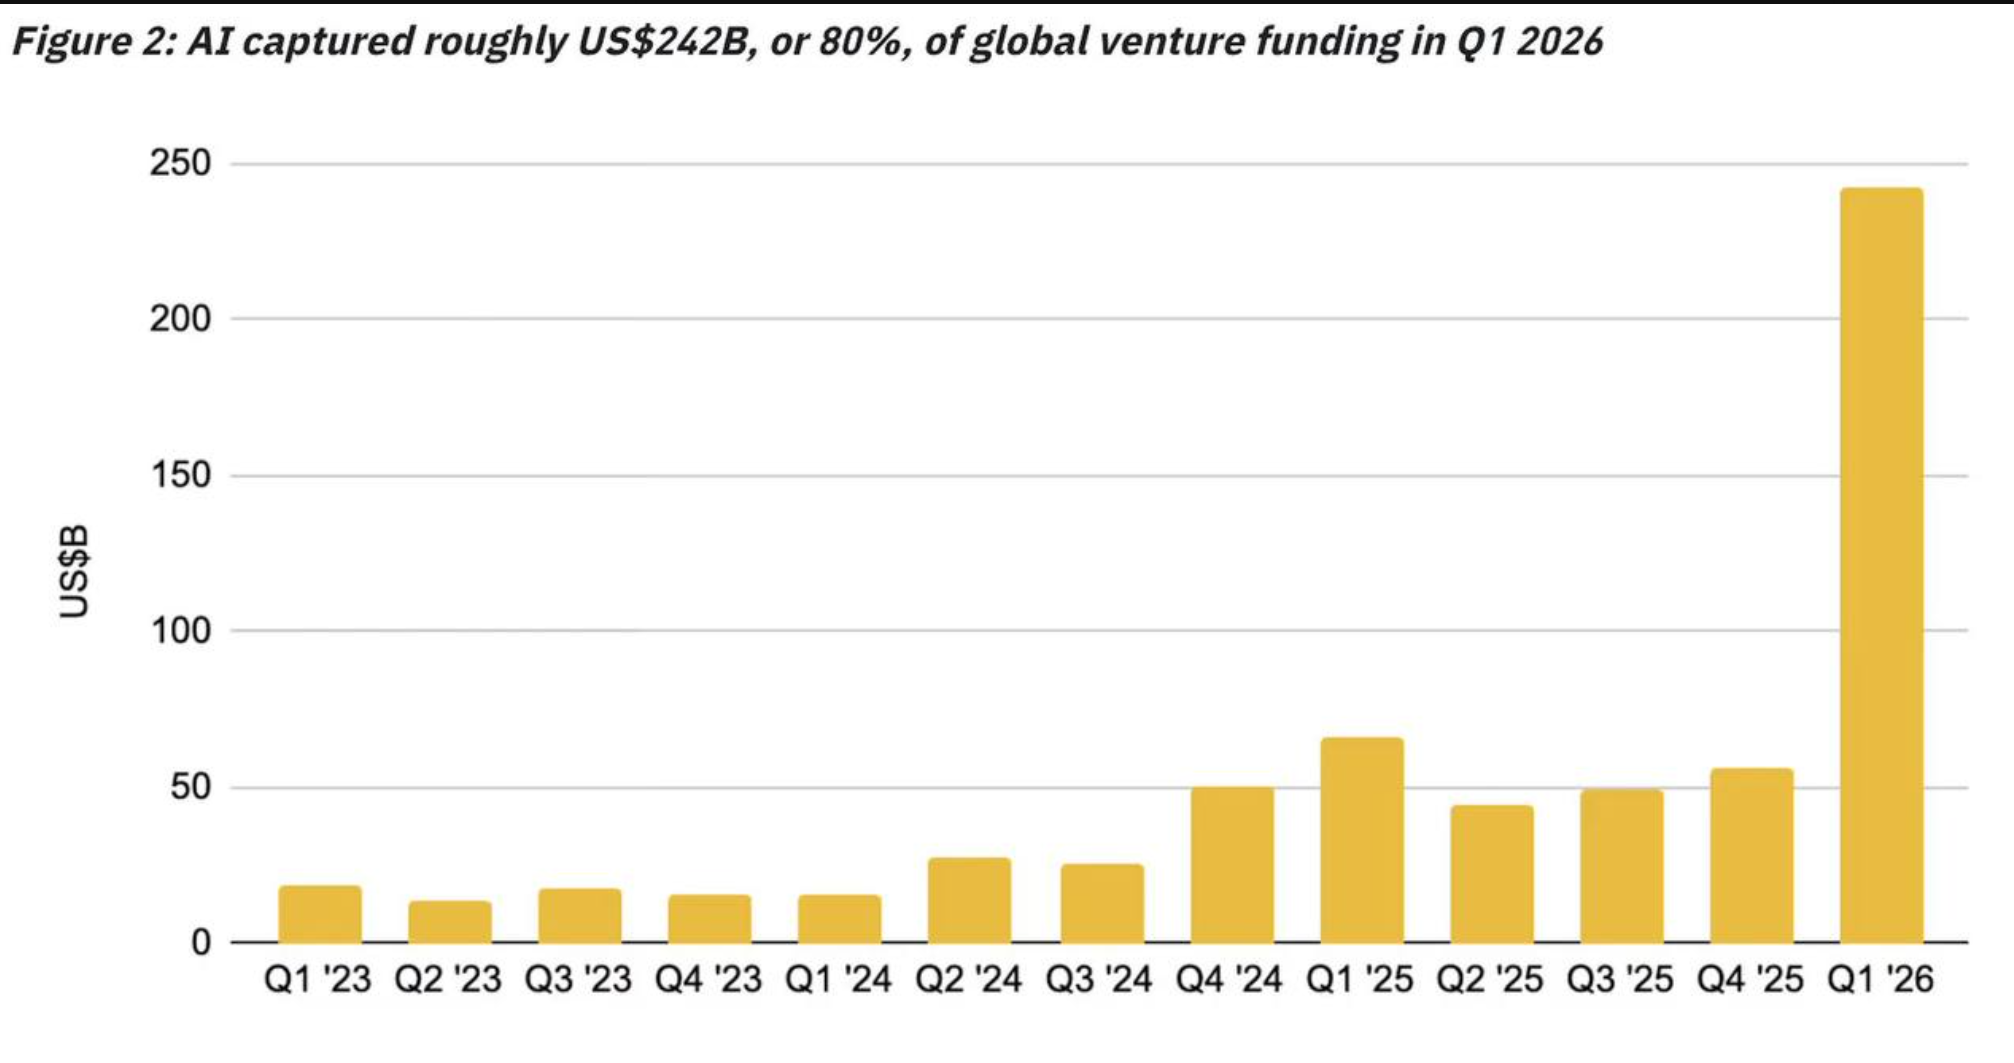
Artificial intelligence captured roughly $242 billion in venture capital funding during Q1 2026, accounting for 80% of all global startup investment in the quarter.
The figures mark a record quarter as total global venture investment reached approximately $300 billion across some 6,000 funded companies.
Mega-Rounds Drive AI Funding Surge
Four deals accounted for 65% of all global venture capital. OpenAI raised $122 billion, Anthropic secured $30 billion, xAI closed $20 billion, and Waymo brought in $16 billion. AI funding in Q1 alone exceeded all of 2025 combined.

However, the capital flood is hitting physical limits. A Bloomberg report found that roughly half of US AI data centers planned for 2026 have been delayed or cancelled.
Transformer shortages, grid strain, and supply chain bottlenecks are limiting the buildout. Only about one-third of the projected 12 GW of new capacity is under active construction.
AI Agents Enter the Workplace
Meanwhile, Coinbase CEO Brian Armstrong revealed the exchange is testing AI agents that operate alongside human employees in Slack and email.
Armstrong suggested Coinbase could eventually have more AI agents than human staff, reflecting a broader corporate shift toward autonomous systems.
The workplace transformation has also reignited political debate. Elon Musk proposed “universal HIGH INCOME” via federal government checks, arguing AI productivity would offset inflation. Andrew Yang echoed the call, urging faster action on AI-funded universal income.
Senator Bernie Sanders pushed back from a different angle, warning that AI firms plan to spend $300 million on 2026 midterm elections.
Sanders called on Democrats to resist industry pressure and confront what he called “the AI Oligarchs.”
The tension between record capital inflows and infrastructure bottlenecks suggests AI’s growth trajectory may face near-term friction even as its economic influence accelerates.
The post AI Absorbs $242 Billion in Q1 Venture Funding, Exceeding All of 2025 Combined appeared first on BeInCrypto.
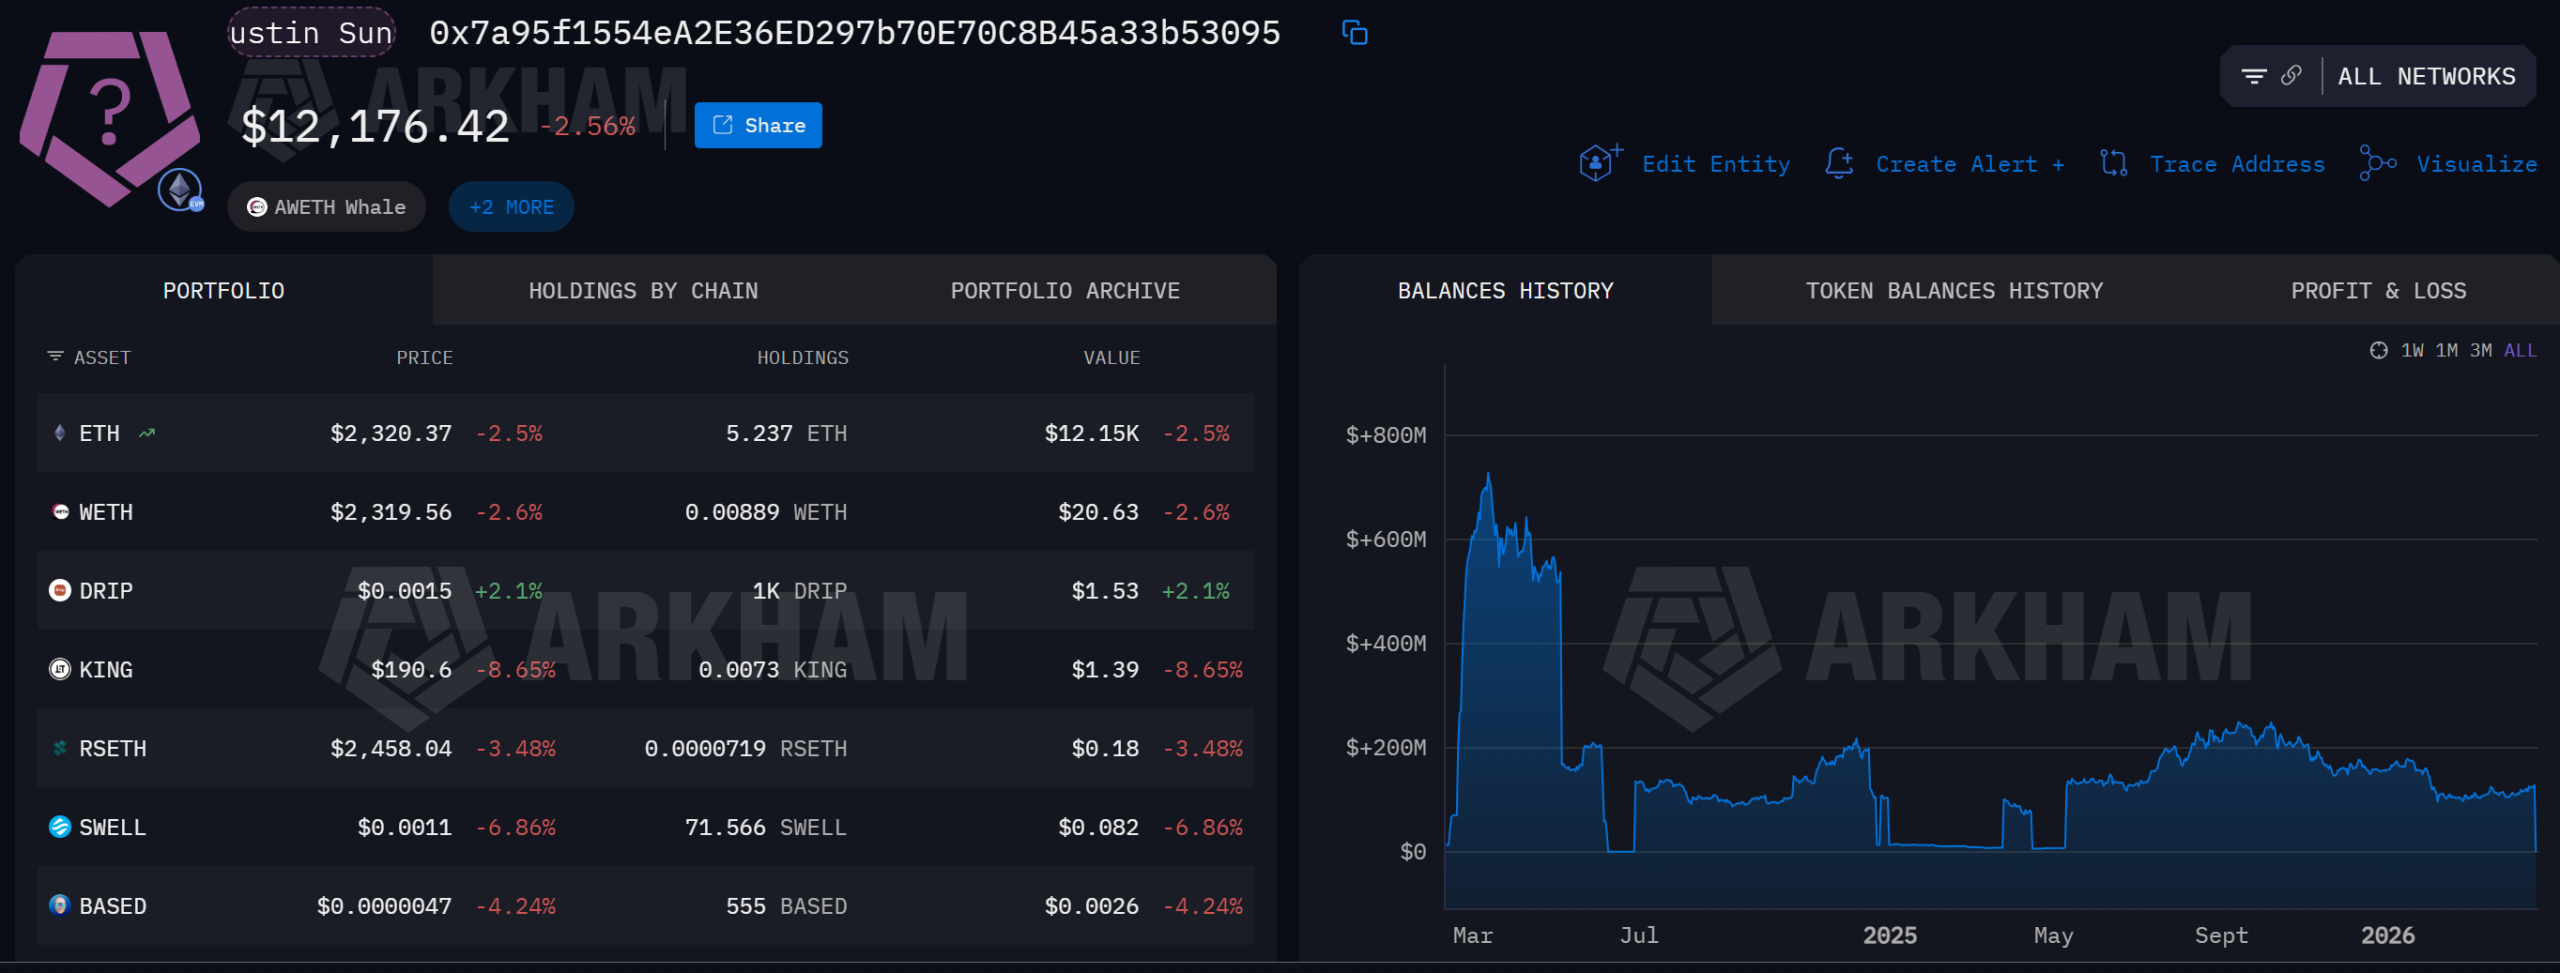
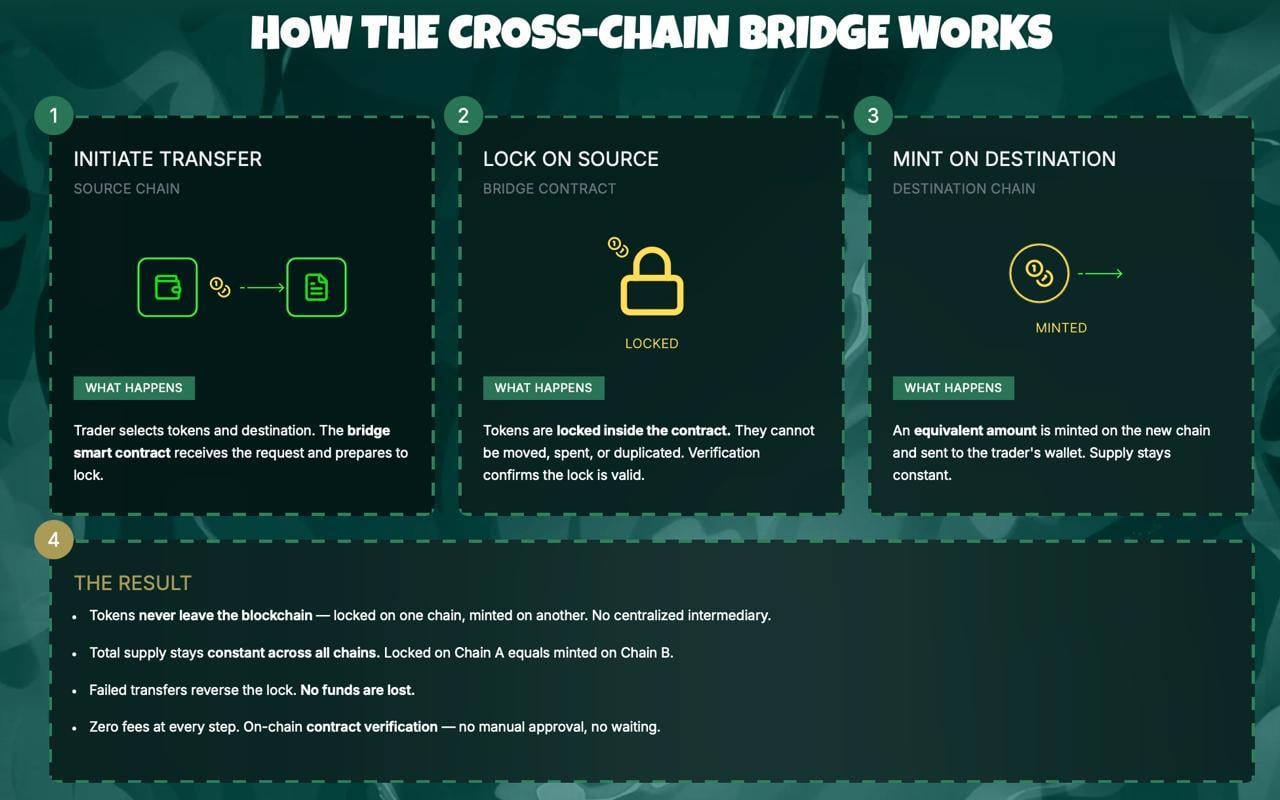
Tron founder Justin Sun publicly called on the KelpDAO bridge hacker to negotiate a return of the stolen funds, warning that a $292 million loss could bring down both Aave and KelpDAO.
Sun’s appeal followed the largest Decentralized Finance (DeFi) exploit of 2026, which drained 116,500 rsETH from KelpDAO’s cross-chain bridge on April 18.
Sun Moves Funds as Aave Takes the Hit
The attacker exploited a flaw in KelpDAO’s LayerZero-powered bridge, forging cross-chain messages to release rsETH without corresponding token burns.
The stolen tokens were then deposited as collateral on Aave V3, where the hacker borrowed large volumes of Wrapped Ether (WETH) against them.
Because the rsETH became unbacked, the positions are effectively unliquidatable, leaving Aave with over $236 million in bad debt.
Aave froze rsETH markets on both V3 and V4 within hours. Aave founder Stani Kulechov confirmed the exploit originated outside Aave’s contracts.
On-chain data shows Sun urgently withdrew 65,584 ETH, worth roughly $154 million, from Aave and deposited it into Spark shortly after.

His total Aave exposure has reportedly dropped to $380 million, while his Sky and Spark holdings have risen to $2.13 billion.
“OK — Kelpdao hacker, how much you want? Let’s just talk. With KelpDAO’s help, of course. It’s simply not worth it to sacrifice both Aave and KelpDAO and let them go down over this hack,” wrote Justin Sun in a post.
Interoperability protocol Axelar also responded, expressing solidarity with LayerZero and urging the industry to adopt stronger bridge security standards.
Axelar pointed to the importance of multi-validator configurations, noting that Kelp’s single-validator setup may have enabled the breach.
The exploit overtakes the $285 million Drift Protocol hack from April 1 as the largest DeFi loss this year.
The post Justin Sun Offers to Negotiate With KelpDAO Hacker After $292 Million Exploit appeared first on BeInCrypto.
Crypto World
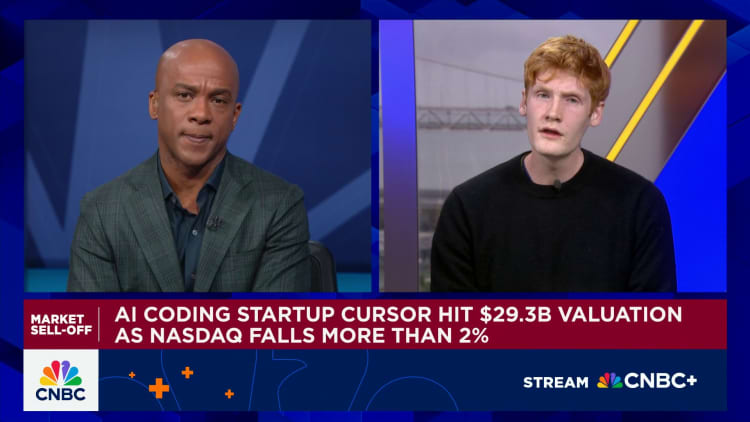
AI startup Cursor in talks to raise $2 billion funding round at valuation of over $50 billion
The Cursor logo arranged on a smartphone in New Hyde Park, New York, Nov. 20, 2025.
Gabby Jones | Bloomberg | Getty Images
Artificial intelligence startup Cursor is in talks to raise a $2 billion fundraising round at an over $50 billion valuation, which does not include the investment, a source familiar with the matter told CNBC.
Andreessen Horowitz is slated to co-lead the new investment round, in which Nvidia and Thrive Capital are also expected to participate, said the source, who was not authorized to publicly speak on the investment. Those three firms have all previously backed the AI coding startup.
Bloomberg News first reported that Cursor was raising capital.
The funding round underscores the venture capital industry’s enthusiasm for startups specializing in AI coding agents that can complete a range of software development tasks for users. Although Cursor was among the first major startups to focus on AI coding agents, other companies, such as Google, Anthropic and OpenAI, have since debuted similar tools.
Cursor announced in November that it closed a $2.3 billion funding round at a $29.3 billion post-money valuation. That financing came after a $900 million investment round in June.
Among Cursor’s current investors are Accel, DST Global, Coatue and Google, according to a corporate blog post.
The startup released in February various updates intended to help software developers, including giving AI agents the ability to test their coding changes and record their actions via videos, logs and screenshots.
Cursor did not immediately reply to a request for comment.
WATCH: Cursor CEO Michael Truell: We’re seeing success with our AI age, not just demand

Bitcoin’s current market cycle is broadly viewed as weaker than its three prior halving-driven runs, according to Galaxy’s head of firmwide research, Alex Thorn. By weighing price action since the April 2024 halving against the patterns seen in 2012, 2016 and 2020, Thorn argues that volatility has cooled and upside potential appears more constrained this time around. Notably, the all-time high above $125,000, reached on Oct. 5, 2025, was only about 97% above the 2024 halving price near $63,000, illustrating a markedly tamer peak for the cycle so far.
Thorn’s comparisons hinge on a stark difference in how cycles unfold. The 2012 halving cycle saw a roughly 9,294% price surge to around $1,163; 2016 delivered about a 2,950% surge to near $19,891; and the 2020 halving generated a roughly 761% gain. In Thorn’s view, “Cycle four is dramatically underperforming prior cycles,” a conclusion he shared in an X post that raises a bigger question: is this the new normal, or will the cycle evolve in unforeseen ways?
Beyond price trajectories, the market’s behavioral foundations may be shifting. Thorn notes that volatility has declined with each successive halving, suggesting that BTC’s price could become more influenced by factors outside of the four-year cycle theory traditionally cited by traders. The 30-day Bitcoin Volatility Index has not surpassed 3.11% in the current cycle, with the last reading above that level recorded on Aug. 24, 2024. The latest 30-day figure sits at about 1.75%, according to Bitbo data.
Key takeaways
- Galaxy’s Alex Thorn concludes the current BTC cycle is dramatically weaker than the 2012, 2016 and 2020 halving cycles when comparing price action since the April 2024 halving.
- The all-time high above $125,000 in October 2025 was roughly 97% above the 2024 halving price around $63,000, signaling a much milder top versus prior cycles.
- Volatility has systematically compressed across cycles, with the 30-day BTC volatility staying well below the peaks seen in earlier halvings (latest around 1.75%).
- Market critics point to an early all-time high before the 2024 halving as an anomaly, underscoring that one-off catalysts can distort cycle comparisons.
Market dynamics and the pre-halving anomaly
Another layer of complexity comes from an event-driven impulse that disrupted typical cycle timing. BTC briefly hit an all-time high above $70,000 in March 2024—one month before the April 2024 halving. Analysts have attributed part of the outsized early move to the subsequent approval of spot Bitcoin ETFs in the United States in January 2024, which acted as a catalyst for price acceleration ahead of the halving. This premature peak is frequently cited by critics as a meaningful deviation from the classic halving-driven narrative.
In parallel, Fidelity Digital Assets has observed that Bitcoin’s drawdowns in this cycle have been less severe than in past bear markets. While declines of 80%–90% are not unheard of in older cycles, the drop from the all-time high to later troughs has so far been more contained in this phase. Fidelity’s analysis notes that even a journey back from peak levels remains substantial—BTC pulled back from the late-2021 highs to the roughly $60,000 area, a move just over 50% in magnitude from the peak levels cited by Fidelity’s framework.
Near-term outlook and the long arc
March brought a contrarian take from Jan van Eck, CEO of VanEck, who said BTC is close to bottoming and that a gradual recovery could begin in 2026. While such forecasts hinge on a confluence of macro factors, liquidity conditions, and investor sentiment, they align with a broader sense that BTC may enter a more protracted phase of consolidation after 2025’s peak, rather than repeating the rapid, cycle-driven surges seen in earlier eras.
As of the latest readings, Bitcoin was trading near $74,703, with fresh momentum up modestly over the past week. The price backdrop underscores Thorn’s observation of a more muted cycle, even as headlines around regulatory clarity, ETF developments, and institutional participation continue to influence sentiment.
What to watch next
The immediate question for investors and builders alike is whether this cycle’s subdued volatility and mixed momentum represent a lasting regime shift or a temporary deviation sparked by unique catalysts. Key developments to monitor include how macro conditions interact with BTC’s supply-demand dynamics, any concrete shifts in ETF-related inflows, and whether the market can align around a clearer, more repeatable set of catalysts akin to past halving narratives. As the market evolves, readers should watch for signs that long-run adoption, liquidity depth, and regulatory clarity begin shaping BTC’s trajectory in a way that differentiates this cycle from its predecessors.

El Salvador President Nayib Bukele sits atop a global leader approval chart with a 94% rating, far outpacing every other head of state on the list.
The ranking measures approval for 26 world leaders. Bukele’s dominance highlights a striking detail for the crypto industry. The president who went furthest on sovereign Bitcoin (BTC) adoption is also the most popular leader on Earth right now.
The Bitcoin President Still Stacks Daily
El Salvador became the first country to make Bitcoin legal tender in 2021. The government continues purchasing roughly one BTC per day, pushing its national reserve past 7,600 BTC.
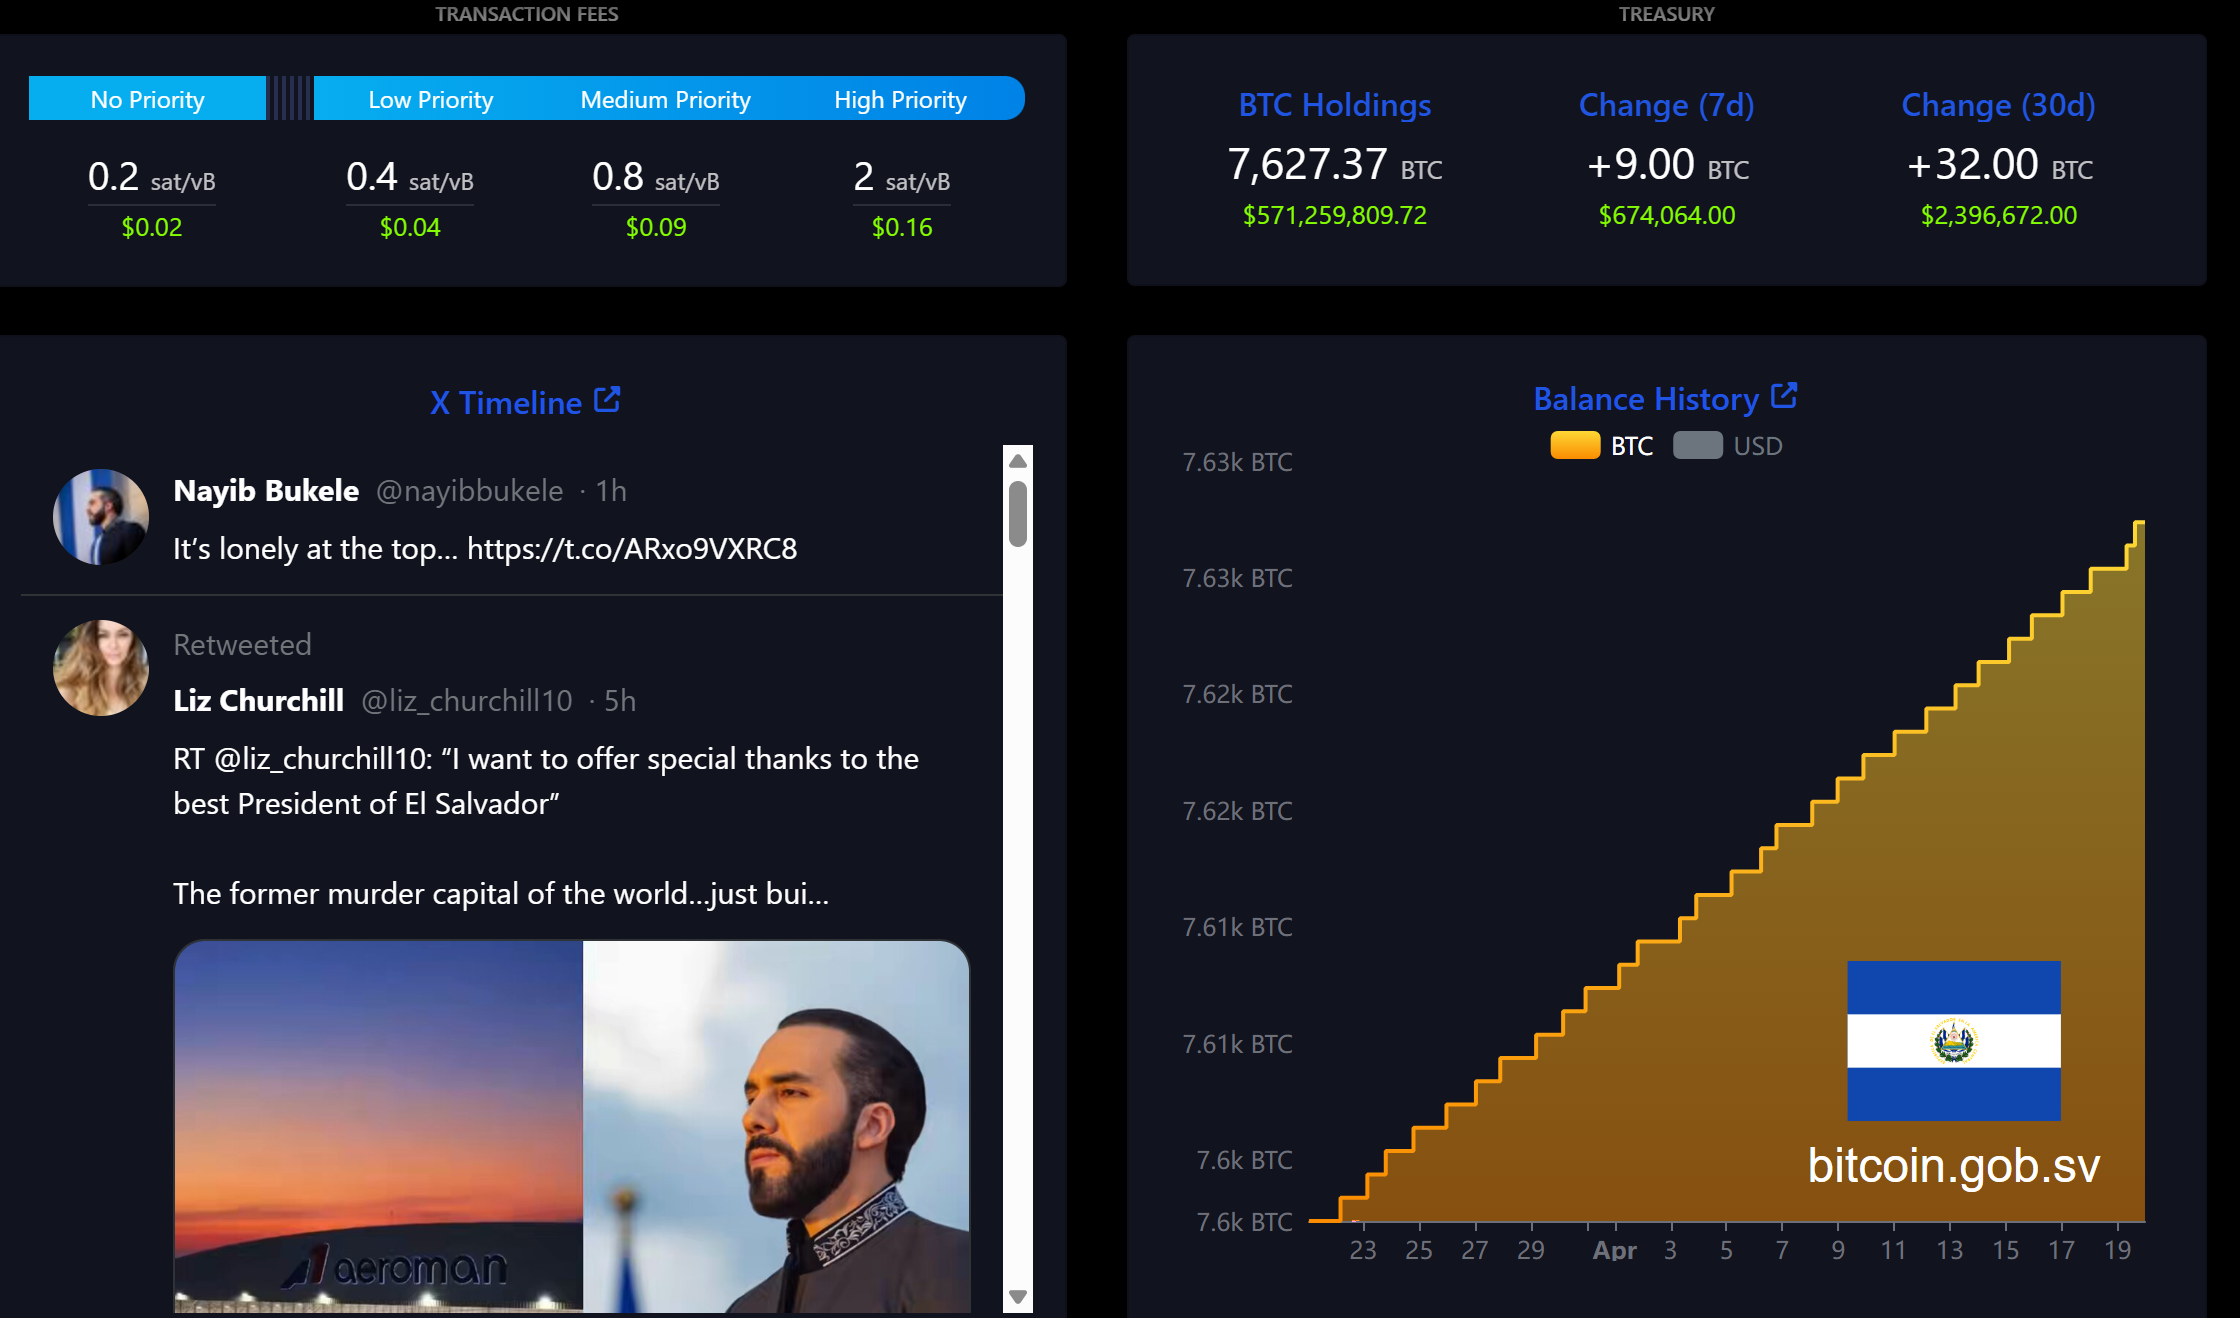
Polls show, however, that security gains from Bukele’s gang crackdown drive his approval far more than the Bitcoin experiment itself.
Only 2.2% of Salvadorans cited BTC as his biggest failure in a recent CID Gallup survey.
Where Other Leaders Stand on Crypto
South Korea’s Lee Jae-myung (63%) has declared crypto a national priority, pledging spot Bitcoin ETFs and a won-pegged stablecoin by 2026.
Javier Milei (48%) championed Bitcoin deregulation in Argentina but saw his credibility damaged after promoting the LIBRA meme coin, which collapsed and cost investors hundreds of millions.
Donald Trump (38%) signed an executive order establishing a US Strategic Bitcoin Reserve funded with seized coins, positioning the country as a future “Bitcoin superpower.”
Most remaining leaders on the list follow standard regulatory frameworks, with several EU heads of state backing stricter oversight through the MiCA regulation.
The chart suggests that bold pro-Bitcoin moves have not hurt leaders politically, even if domestic voters care more about security and the economy than digital assets.
The post The President Who Pushed Bitcoin the Hardest Is Now the Most Popular Leader on Earth appeared first on BeInCrypto.
Crypto World
Why Does the Next Fed Chair Own SOL Before His April 21 Hearing? Pepeto 300x Rotation Explained

The solana price prediction just picked up a talking point nobody saw coming. Kevin Warsh, Donald Trump’s nominee to chair the Federal Reserve, disclosed indirect Solana holdings across multiple venture fund vehicles in his April 14 ethics filing, per Decrypt, with the Senate confirmation hearing locked for April 21. SOL trades at $85.02 with Bitcoin pushing past $77,300 and the tape finally turning green across the majors.
The numbers look strong, but SOL at a $50 billion market cap is simply too large to print the multiples that reshape a portfolio from a single position. That is where Pepeto steps in, a fresh presale trending hard across crypto feeds this quarter, carrying the kind of traction every cycle signals ahead of returns no large cap can match.
Warsh’s 69 page filing with the Office of Government Ethics lists indirect SOL positions held through the AVGF I venture fund alongside stakes in Optimism, Compound, dYdX, Polymarket, Blast, and more than 30 other Web3 names, per Yahoo Finance. Combined assets top $192 million, making this the broadest Web3 portfolio ever disclosed by a senior US financial nominee.
The Senate Banking hearing lands April 21, the same window that holds the CLARITY Act committee markup and the Fed’s April 28-29 meeting. Spot SOL ETFs have crossed $892 million in net assets, with Bitwise’s BSOL alone pulling $808 million in cumulative inflows per Bitcoin.com. The timing puts SOL at the intersection of every major US monetary and regulatory decision this month.
Solana Price Prediction Compared: SOL Setup and the Presale Opportunity Pepeto
The solana price prediction section below breaks down how even the bullish $180 target spreads across months, and for traders who want more, the audited exchange pulling capital in this quarter is the play worth watching. Pepeto gives retail access to tools large holders previously kept private, wrapped in a single platform.
A contract scanner built into the exchange screens each token before any deposit opens, putting buyers ahead of the news cycle. Presale wallets earn 181% APY through daily compounding staking as the rounds fill, meaning the earliest buyers hold the heaviest positions the second demand peaks.
A risk scoring engine reads momentum across the chain and flags suspect contracts before a dollar moves. The presale has pulled in $9.21 million at $0.0000001865, backed by a SolidProof audit and driven by the founder who pushed Pepe to $7 billion on 420 trillion tokens, now leading this exchange alongside a former Binance executive.
The entry window narrows every hour as the Binance listing draws closer. Once public trading opens, millions of new buyers set the price and the presale floor vanishes on the spot. Every past crypto recovery paid the wallets that moved while the crowd was waking up, and once Pepeto’s Binance listing lands, the 300x runway from presale pricing closes the same day.
Solana (SOL) Price Prediction: Can SOL Reach $180?
Solana (SOL) trades at $85.02 per CoinMarketCap, bouncing with the broader market, still 70% below the $293 peak from November 2021. SOL holders sit at 167 million monthly unique wallets per Solana Foundation data, a record set in April.
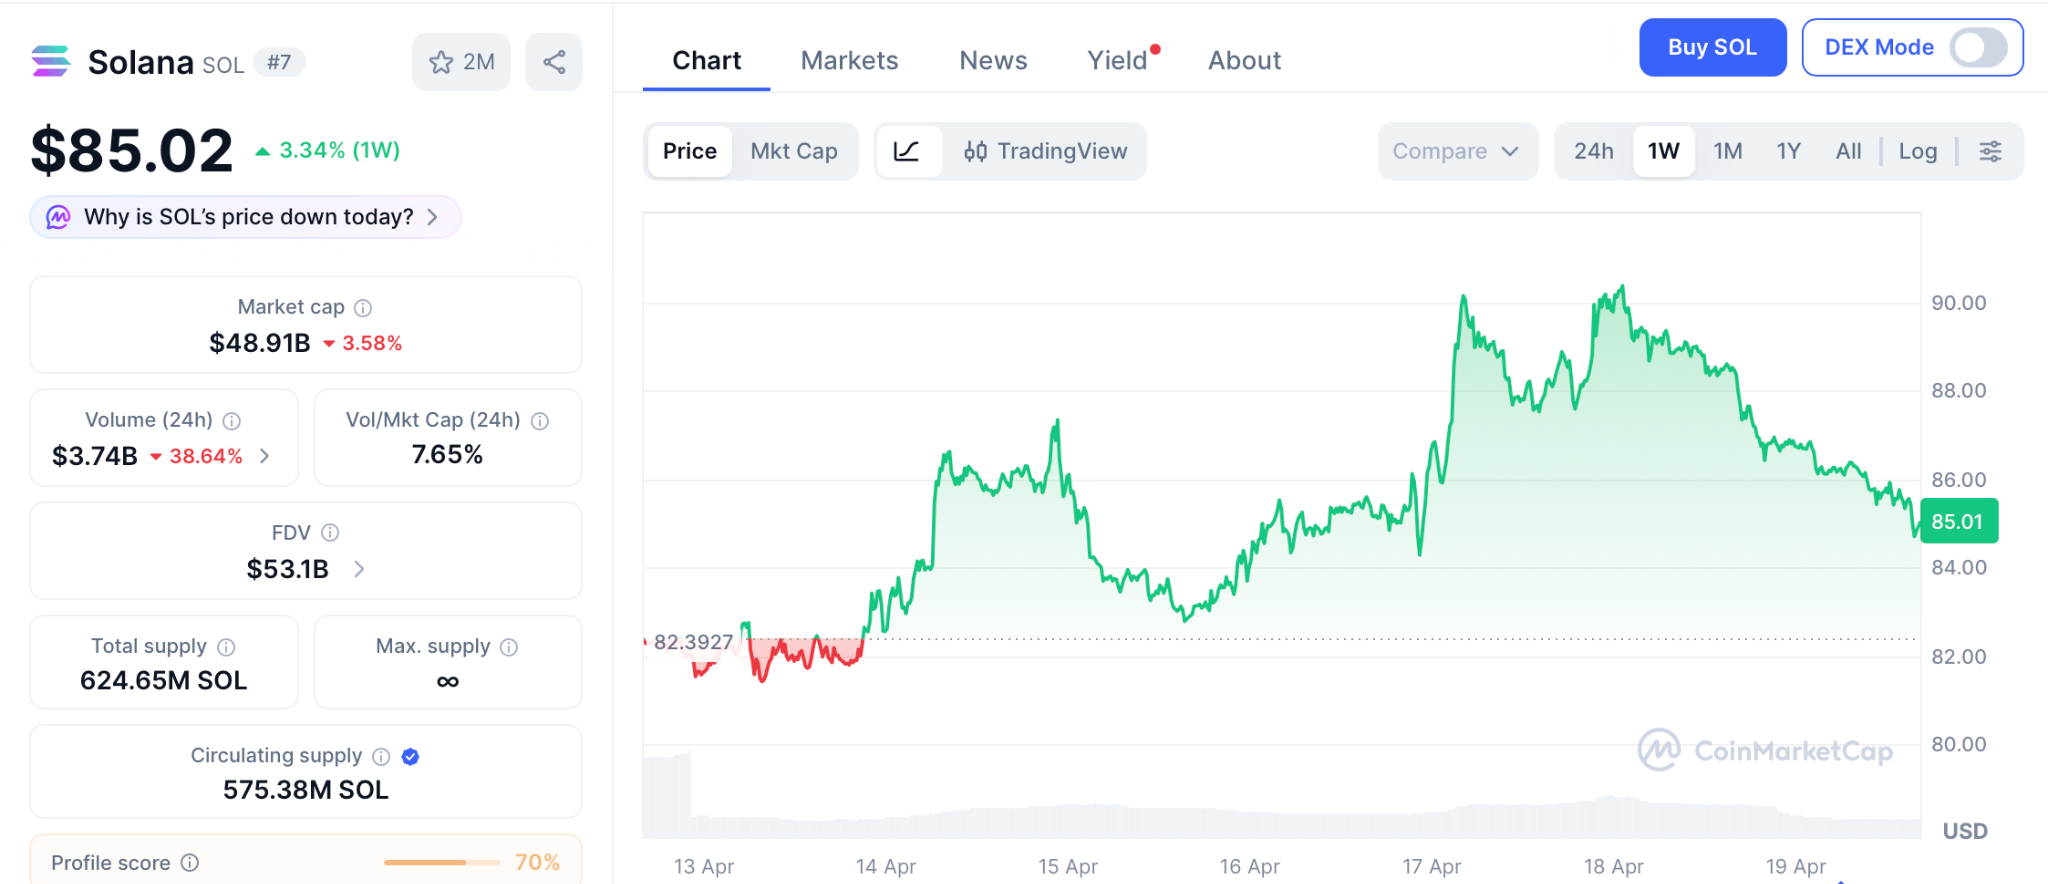
Standard Chartered’s $250 target rests on Alpenglow’s 150 millisecond finality upgrade and the spot ETF products giving institutions a regulated route in.
CoinCodex sketches a 2026 channel between $84 and $133.03 with the average near $119. Even the aggressive solana price prediction reaching $180 prints around 103% over several months. Strong for a large cap, but a presale at 300x math from one Binance listing event beats months of chart watching by a wide margin.
Conclusion:
The solana price prediction points at $180 to $250 on a long runway, and that kind of move sounds great until you stack it next to the 300x analysts are calling for on Pepeto presale pricing. Once the gap is visible, the SOL forecast starts looking modest, and the rotation into earlier entries starts to make sense.
The accounts that turned Pepe and DOGE into life changing positions were all built the same way. Capital went in before the coin hit every screen, the deposit held through the first exchange print, and compounding did the lifting from there.
Pepeto runs that exact playbook right now. The raise crossed $9.21 million, fresh capital keeps hitting the contract every day, and the Binance listing creeps closer hour by hour. The wallets depositing at $0.0000001865 today are the ones reading their own names in the millionaire headlines the next cycle writes.
Click To Visit Pepeto Website To Enter The Presale

FAQs
What does the solana price prediction target for 2026?
Standard Chartered places Solana (SOL) at $250 and CoinCodex models a $119 average for 2026, with $180 as a mid cycle target from the current $85.02 level. Fed Chair nominee Kevin Warsh disclosed SOL holdings in his April 14 filing ahead of an April 21 Senate hearing, while Pepeto at presale pricing targets 300x.
How does Solana (SOL) compare to Pepeto as an entry today?
Solana (SOL) at $85.02 projects toward $133 to $180 through 2026 per CoinCodex and Standard Chartered. Pepeto at $0.0000001865 with $9.21 million raised and a Binance listing days away offers a presale to listing return that beats even the strongest solana price prediction.
Disclaimer: This is a Press Release provided by a third party who is responsible for the content. Please conduct your own research before taking any action based on the content.

Crypto World
BitGo, Polygon Among Industry Giants Pushing Rate Limits After The Largest DeFi Exploit of 2026

A wave of protocol-level security responses followed the $292 million KelpDAO rsETH exploit on April 19, with BitGo, Polygon, and Katana moving swiftly to isolate potential contagion.
The attack drained 116,500 rsETH from Kelp DAO’s LayerZero-powered cross-chain bridge through a forged message that bypassed its Decentralized Verifier Network (DVN) configuration.
Protocols Move to Contain Fallout
BitGo, alongside BiT Global Trust, took down the LayerZero OFT DVNs for Wrapped Bitcoin (WBTC) as a precaution. The firm confirmed that user funds remain secure and pledged to share updates as more information becomes available.
Polygon stated that its chain, Agglayer, and broader ecosystem remain unaffected by the incident. The network noted it has safely processed over $2 trillion to date.
Katana paused the OFT path on Vaultbridge, which relied on a 2/3 DVN setup. Bridging through Agglayer, which verifies with zero-knowledge proofs rather than proof-of-authority multisigs, remained fully available.
Meanwhile, Cyvers CTO and co-founder Meir Dolev revealed that KelpDAO was just three minutes away from losing an additional $100 million. A rapid-response blacklist blocked the attacker before a second attempt could succeed.
Industry Leaders Call for Structural Rate Limits
The exploit has reignited calls for built-in rate limits across DeFi protocols. Ethena contributor Guy Young argued that asset issuers should implement throttled cross-chain transfers on top of standard LayerZero OFTs.
“We built a solution on top of the standard OFT to throttle cross chain transfers at $10m per hour for every DVN, in addition to the $10m per block rate limit on the mint contract. The former would have prevented Kelp, the latter Resolv,” he wrote.
Ethena’s configuration caps potential damage at $10 million per chain per hour even if a DVN is fully compromised. Young called the slight inconvenience for users a worthwhile tradeoff to avoid catastrophic losses.
Keone Hon, CEO and co-founder of Monad, proposed that pooled lending protocols adopt “smart caps” that limit how quickly collateral supply can grow.
He pointed to the Resolv hack in March, where the attacker minted infinite tokens but could only extract $24 million because exit pathways were small.
Hon argued that high supply caps should be seen as a liability, not a sign of stature. A supply limit slightly above current utilization, adjusting over hours to the true cap, would have saved rsETH depositors $200 million, he estimated.
The KelpDAO breach is now the largest DeFi exploit of 2026. Whether protocols adopt the rate-limiting measures these leaders are proposing may determine how large the next one gets.
The post BitGo, Polygon Among Industry Giants Pushing Rate Limits After The Largest DeFi Exploit of 2026 appeared first on BeInCrypto.

TLDR:
- An ECB director stated tokenization restructures entire financial systems, surpassing all previous waves of technological change.
- The UK reversed its stablecoin payments policy, bringing digital assets into its formal regulatory perimeter for the first time.
- HSBC completed a tokenized deposit pilot covering issuance, transfer, and atomic settlement on the Canton Network successfully.
- Clearstream will custody and settle Ondo’s tokenized stocks and ETFs, embedding digital assets into core European market infrastructure.
Tokenization is gaining serious traction across Europe as regulators, central banks, and financial institutions move toward digital asset integration.
A European Central Bank director recently stated that tokenization’s effect on finance surpasses earlier waves of technological change.
Major institutions across the continent are responding with concrete steps. From regulatory reversals to live pilots and cross-border partnerships, Europe is emerging as a key driver of the global tokenization push.
European Regulators Set the Tone for a New Financial Era
A European Central Bank director drew a sharp distinction between tokenization and previous technological shifts in finance.
According to Ledger Insights, the director noted that these technologies do not merely improve one part of a system.
Rather, they restructure the entire logic of how financial systems operate. That assessment positions tokenization as a foundational change, not an incremental upgrade.
The statement carried weight given the ECB’s central role in shaping European financial policy. When a director at that level speaks about systemic change, institutions across the continent take notice.
The framing moved the conversation beyond speculation and into strategic planning. European banks and depositories began responding almost immediately.
Across the Channel, the UK government reversed its earlier position on stablecoins within payments regulation. Authorities confirmed plans to bring stablecoins into the country’s formal payments regulatory perimeter.
That reversal closed a policy gap that had kept digital assets outside mainstream financial oversight. Britain’s shift aligned it more closely with the direction Europe’s financial regulators are heading.
Together, these regulatory signals are creating a more predictable environment for tokenized finance. Institutions require clear frameworks before committing to infrastructure investments at scale.
With central bank commentary and government policy now pointing in the same direction, that clarity is forming. Europe’s regulatory posture is becoming one of cautious but deliberate acceptance.
European Institutions Move From Pilots to Permanent Infrastructure
HSBC completed a tokenized deposit pilot on the Canton Network, marking a practical step forward for European banking. The exercise simulated the issuance, transfer, and atomic settlement of its Tokenised Deposit Service.
All three functions were tested in a controlled environment, confirming operational readiness. The pilot demonstrated that large European banks are past the conceptual stage.
ABN Amro extended crypto access to its investment clients through a carefully structured approach. The Dutch bank introduced indirect exposure via Exchange Traded Products and Capital Protected Notes.
Both instruments are available through ABN Amro’s existing investment platforms, keeping the process familiar for clients. That design reflects how European institutions are balancing innovation with risk management.
The most structurally significant development came through the Ondo Finance, Clearstream, and 360X partnership.
Clearstream, Europe’s leading securities depository, will provide custody, settlement, and collateralization for Ondo’s tokenized stocks and ETFs.
This integration places tokenized assets directly inside established institutional workflows. It removes a barrier that had long kept digital assets separate from mainstream settlement infrastructure.
That partnership matters because Clearstream operates at the core of European capital markets. Anchoring tokenized securities within its framework gives institutional participants a trusted, regulated entry point.
European financial infrastructure is no longer sitting adjacent to tokenization. It is becoming part of it.
TLDR:
- AVAX trades near $9 as price consolidates above key support within a multi-year descending triangle structure
- Strong buyer activity appears around $8–$10, with reduced volatility signaling a possible accumulation phase
- Resistance between $13 and $16 remains critical, with a breakout needed to shift short-term momentum
- A confirmed move above the descending trendline could open a path toward the $60–$80 price range
Avalanche (AVAX) is trading near a key support zone as its weekly chart shows a long-term descending triangle. Price action suggests buyers are stepping in, with consolidation forming near the lower boundary of the structure.
AVAX Holds Key Support as Buyers Step In
AVAX has remained within a broad downtrend since its 2021 peak above $130. The weekly chart shows a clear pattern of lower highs, guided by a descending resistance trendline. This structure has kept selling pressure active during each rally attempt.
According to analyst Butterfly on X, AVAX is bouncing from the lower edge of the triangle. The post added that buyers are showing interest near this support, with early signs of control shifting toward bulls.
Price is now hovering around $9.18, just above a strong support zone between $10.5 and $11. This area has been tested several times, making it a key level for market participants. Below this, the $8 to $9 range has acted as a short-term accumulation zone.
The chart also shows reduced volatility within this range. Price movement has tightened, forming a consolidation pattern. This behavior often appears when selling pressure slows and buyers begin absorbing available supply.
Volume data supports this view. Larger spikes appeared during earlier sell-offs and rebounds. More recently, volume has stabilized, with no sharp increase in selling activity. This trend suggests that the market may be entering a transition phase.
Resistance Levels Define Next Direction
While support has held, several resistance levels remain in focus. The first barrier sits between $13.5 and $16.5, where recent price rejection occurred. A move above this range could shift short-term momentum.
Beyond that, the $20.5 to $25.5 range represents a mid-level resistance zone. This area aligns with the previous price structure and could slow movement upward if reached. The descending trendline near $30 remains the most critical level.
A breakout above this trendline would change the long-term structure. It would end the pattern of lower highs and open the path for a broader recovery. Projections from the chart suggest that such a move could push the price toward the $60 to $80 range.
On the downside, a break below $8 would weaken the current setup. In that case, price could move toward the $6 to $7.5 region. This level has served as support in the past and may attract new buying interest.
For now, AVAX remains in a narrow range between $8 and $12. This zone has become a key area where both buyers and sellers are active. The longer the price stays within this band, the stronger the next move could be.
Market participants are watching closely as the structure approaches a decision point. The repeated defense of support suggests ongoing demand. At the same time, resistance levels continue to cap upward movement.
The weekly chart reflects a market in balance, with both sides waiting for confirmation. A move beyond these defined levels will likely set the next direction for AVAX.
10 Most Mind-Bending Movies Released Since ‘Memento’
BBC pulls all episodes of Top of the Pops featuring Scott Mills after star’s sacking

BOJ’s hawkish hints keep rate hike on the cards

Why Israel is blocking foreign journalists from entering

Bitcoin: We’re Entering The Most Dangerous Phase

Alan Cumming Brands Baftas Ceremony A ‘Triggering S**tshow’

Stocks Over Houses: The New Financial Success Strategy #shorts

Tangem’s NEW Multi-Account Feature Just Changed Everything: Ultimate Digital Asset Management System

Make Money With Claude As A Beginner In 2026 (Easy 16 Minute Guide)
-
 NewsBeat7 days ago
Pep Guardiola and Gary Neville agree over Arsenal title problem that benefits Man City
-

 Crypto World6 days ago
The SEC Conditionalises DeFi Platforms to Be Avoided for Broker Registration
-

 Fashion2 days ago
Weekend Open Thread: Theodora Dress
-

 Crypto World6 days ago
SEC Signals Exemption for Crypto Interfaces From Broker Registration
-

 News Videos5 days ago
Secure crypto trading starts with an FIU-registered
-

 Sports3 days ago
NWFL Suspends Two Players Over Post-Match Clash in Ado-Ekiti
-

 Crypto World6 days ago
SEC Proposes Certain Crypto Interfaces Don’t Need to Register as Brokers
-

 NewsBeat6 days ago
Trump and Pope Leo: Behind their disagreement over Iran war
-

 Business7 hours ago
Powerball Result April 18, 2026: No Jackpot Winner in Powerball Draw: $75 Million Rolls Over
-

 Politics2 days ago
Palestine barred from entering Canada for FIFA Congress
-

 Crypto World2 days ago
Russia Pushes Bill to Criminalize Unregistered Crypto Services
-

 Sports6 days ago
NWFL opens Pathway for new Clubs ahead of 2026 Season
-
 Business3 days ago
Creo Medical agree sale of its manufacturing operation
-

 Politics12 hours ago
Zack Polanski demands ‘council homes not luxury flats for foreign investors’
-
 Entertainment6 days ago
Brand New Day’ Footage Reveals the Devastating Impact of ‘Now Way Home’
-

 Crypto World7 days ago
Trump whales load up ahead of Mar-a-Lago luncheon.
-
Crypto World7 days ago
Sei Network Enters Quiet Reset Phase as On-Chain Metrics Signal a Slowdown in 2026
-
Business7 days ago
Kering slides after Morgan Stanley downgrade, Gucci woes loom
-

 Tech7 days ago
Google adds E2E encryption to Gmail for iOS and Android enterprise users
-

 Tech7 days ago
Apple glasses won’t go brand shopping like Meta did with Ray-Ban and Oakley
You must be logged in to post a comment Login