

Crypto World
What Is an Inverted Hammer Candlestick Pattern in Trading?
Candlestick patterns are widely used in technical analysis to identify potential shifts in market sentiment and price momentum. One formation that traders frequently monitor during market declines is the inverted hammer candlestick pattern.
An inverted hammer is a single-candle formation characterised by a small real body near the lower end of the price range and a long upper shadow, typically at least twice the length of the body, with little or no lower shadow. It usually appears after a downtrend and may indicate that buyers attempted to push prices higher during the session, suggesting that selling pressure could be weakening.
In this article, we explain the meaning of the inverted hammer candlestick, examine its key characteristics, outline how traders identify it on charts, and discuss common ways it may be incorporated into technical analysis and trading strategies.
What Is an Inverted Hammer?
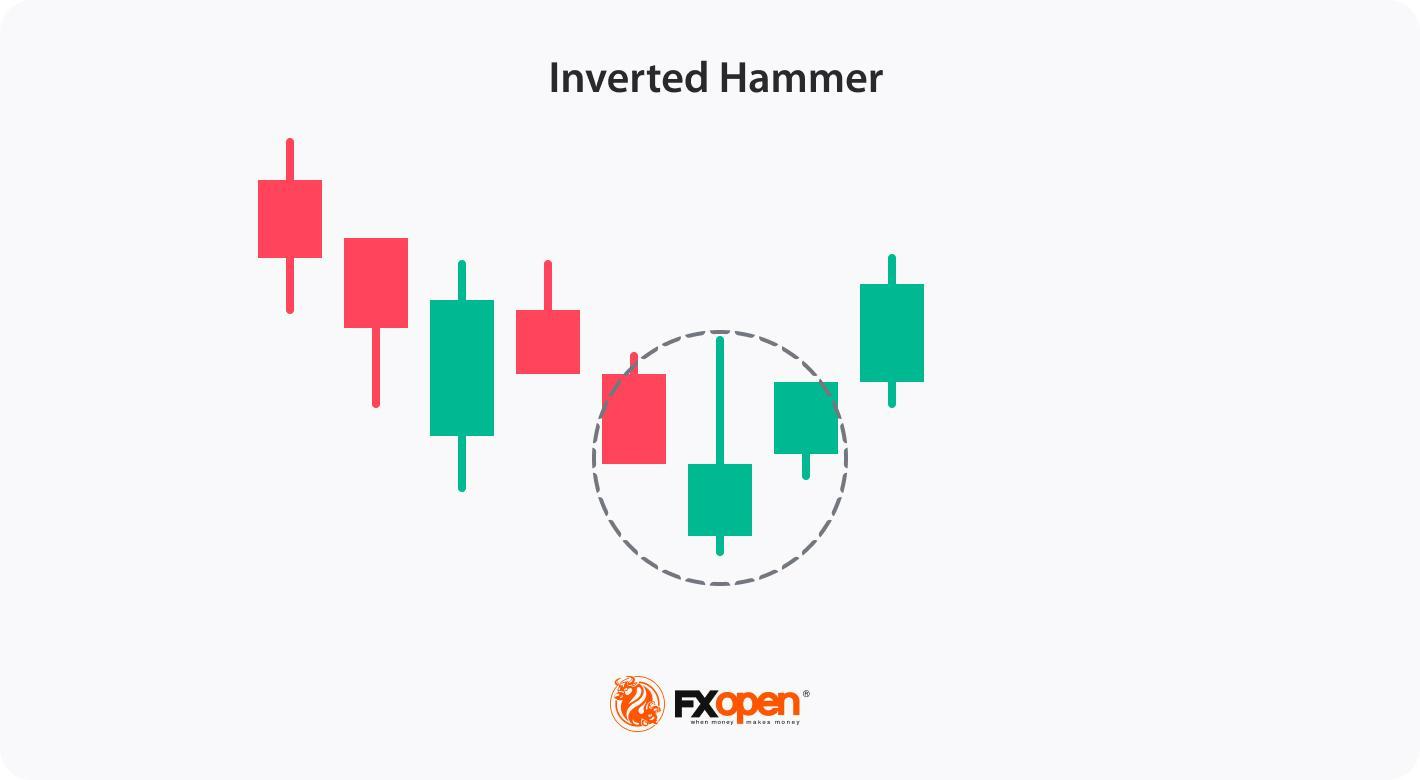
An inverted hammer is a candlestick pattern that appears at the end of a downtrend, typically signalling a potential bullish reversal. It has a distinct shape—a small body at the lower end of the candle and a long upper wick that is at least twice the size of the body. This structure suggests that although sellers initially dominated, buyers stepped in, pushing prices higher. While the inverted hammer alone does not confirm a reversal, it’s often considered a sign of a possible trend change when followed by a bullish move on subsequent candles.
The pattern can have any colour so that you can find a red inverted hammer candlestick or upside down green hammer. Although both will signal a bullish reversal, an inverted green hammer candle is believed to provide a stronger signal, reflecting the strength of bulls.

One of the unique features of this pattern is that traders may apply it to various financial instruments, such as stocks, cryptocurrencies*, ETFs, indices, and forex, across different timeframes. To test strategies with an inverted hammer formation, you may consider using FXOpen’s TickTrader trading platform, which provides access to over 700 markets.
Hammer Candlestick vs Inverted Hammer
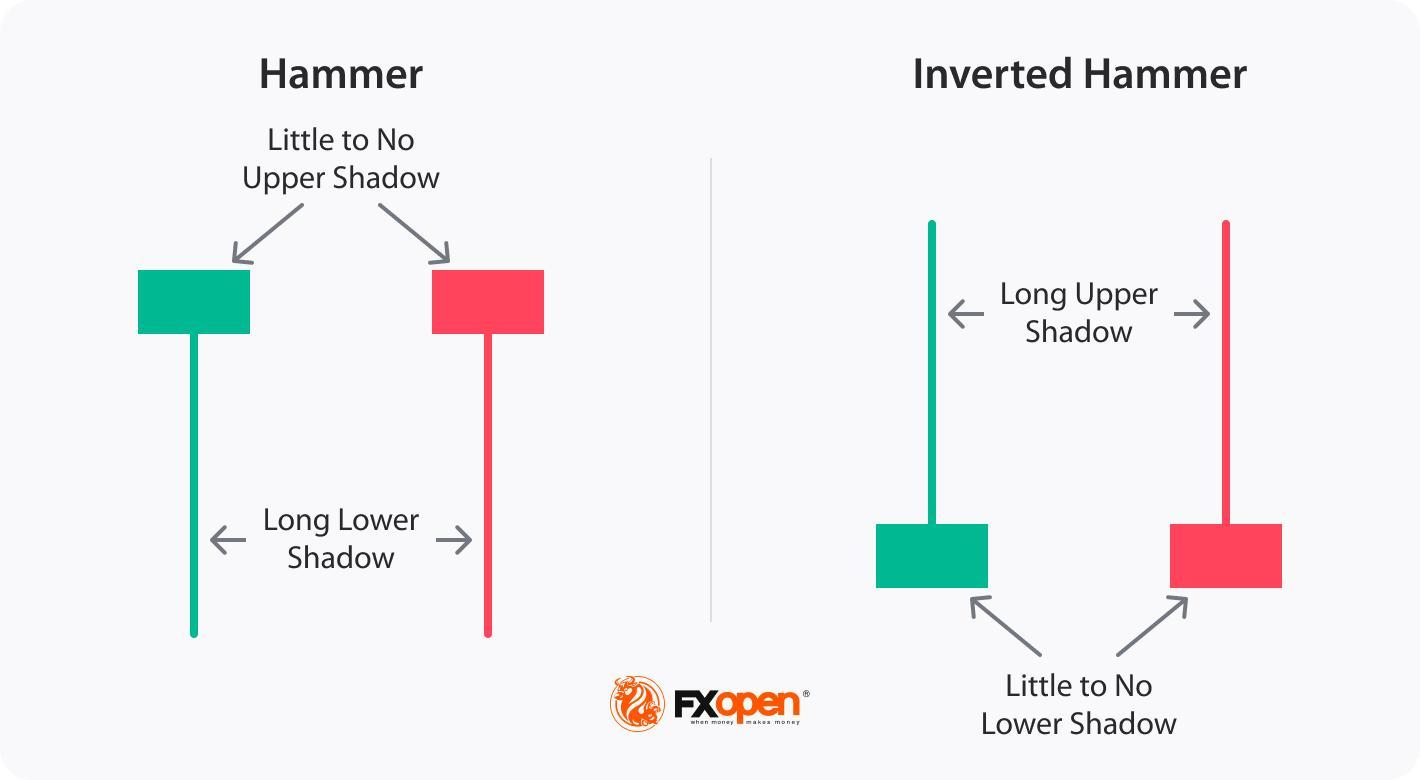
The hammer candlestick pattern and inverted hammer are both single-candle patterns that appear in downtrends and signal potential bullish reversals, but they have distinct formations and implications:
- Hammer: The reversal hammer candle has a small body at the top with a long lower wick, indicating that buyers pushed prices back up after a period of selling pressure. This bullish hammer pattern shows that sellers were initially strong, but buyers regained control, potentially signalling a reversal.
- Inverted Hammer: The inverted hammer, by contrast, has a small body at the bottom with a long upper wick. This structure indicates initial buying pressure, but sellers prevented a complete takeover. This pattern suggests that buyers may soon regain strength, hinting at a possible trend reversal.
Both patterns signal possible bullish sentiment, but while the green or red hammer candlestick focuses on buyer strength after selling, the inverted hammer suggests buyer interest in an overall bearish context, needing further confirmation for a trend shift.
How Traders Identify the Inverted Hammer Candlestick in Charts
Although the inverted hammer is a recognisable pattern, traders often apply additional rules to potentially strengthen the reversal signal it provides.
Step 1: Identify the Pattern in a Downtrend
- Traders ensure the market is in a downtrend, as the inverted hammer is only significant when it appears after a period of sustained selling pressure.
- Then, they look for a candlestick with a small body at the lower end and a long upper wick that’s at least twice the size of the body. This upper shadow shows initial buying pressure followed by selling, suggesting a potential reversal in sentiment.
Step 2: Choose Appropriate Timeframes
- The pattern can appear across various timeframes, but higher timeframe charts are more popular among traders, as shorter timeframes, like 5 or 15-minute charts, may provide false signals.
Step 3: Use Indicators to Strengthen Identification
- Volume: A rise in bullish trading volume after the inverted hammer can indicate stronger interest from buyers, increasing the likelihood of a trend reversal.
- Oscillators: Oscillators like Stochastic, Awesome Oscillator, or RSI showing an oversold reading alongside the candle can further suggest that the asset might be due for a reversal.
Step 4: Look for Confirmation Signals
- Gap-Up Opening: A gap-up opening in the next trading session indicates buyers stepping in, giving further weight to the bullish reversal.
- Bullish Candle: Following the inverted hammer with a strong bullish candle confirms that buying pressure has continued. This is a key signal that a trend reversal may be underway.
By following these steps and waiting for confirmation signals, traders might increase the reliability of the inverted hammer’s signals.
Trading the Inverted Hammer Candlestick Pattern: Real-Market Examples
Inverted hammer trading is based on a systematic approach to potential bullish reversals. Here are some steps traders may consider:
- Identify the Inverted Hammer: Spot the setup on a price chart by following the rules discussed earlier.
- Assess the Context: Analyse the broader market context and consider the pattern’s location within the prevailing trend. Look for support levels, trendlines, or other significant price areas that could strengthen the reversal signal.
- Set an Entry: Candlestick patterns don’t provide accurate entry and exit points as chart patterns or some indicators do. However, traders can consider some general rules. Usually, traders wait for at least several candles to be formed upwards after the pattern is formed.
- Set Stop Loss and Take Profit Levels: The theory states that traders use a stop-loss order to limit potential losses if the trade doesn’t go as anticipated. It may be placed below the low of the candlestick or based on a risk-reward ratio. The take-profit target might be placed at the next resistance level.
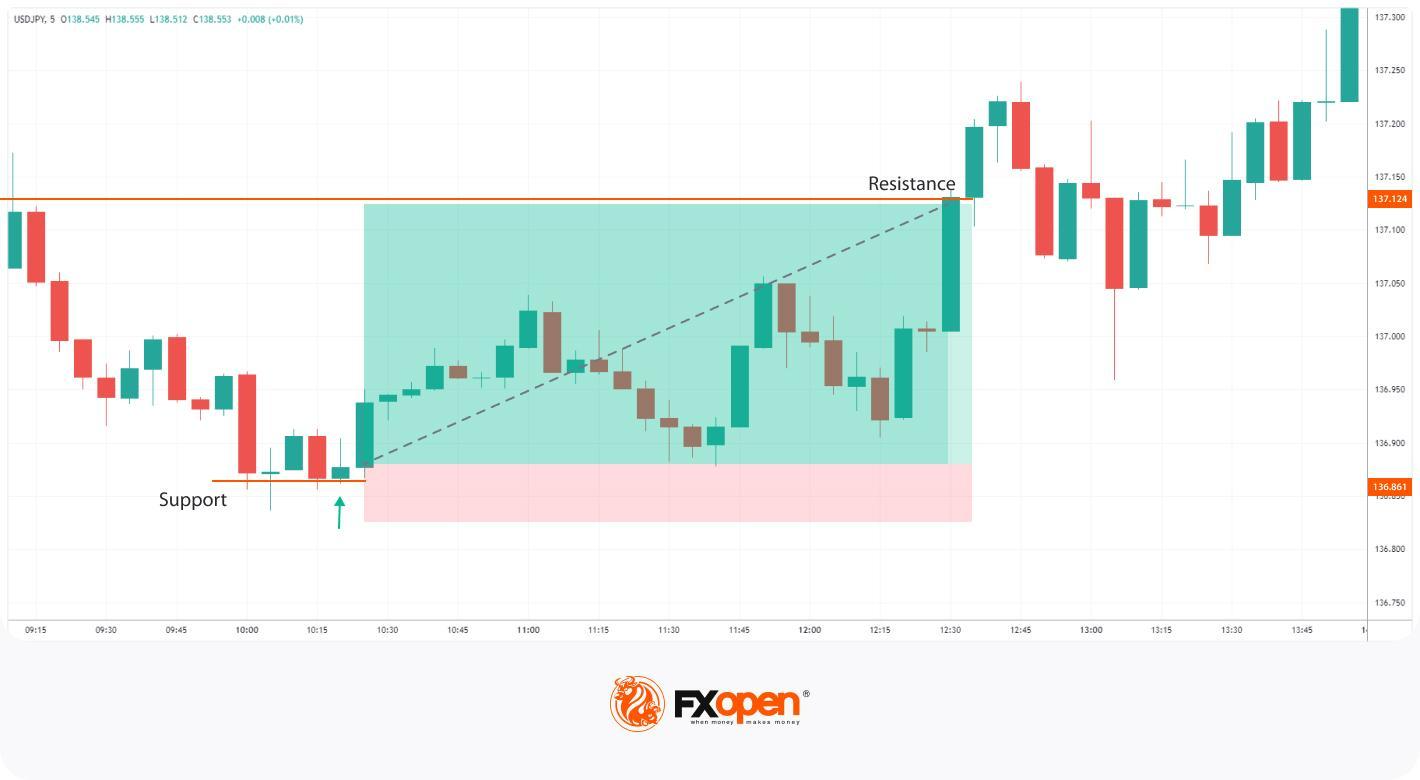
Inverted Hammer Candlestick: Live Market Example
The trader looks for a bullish inverted hammer on the USDJPY chart. After a subsequent downtrend, the inverted hammer appearing at a support level signals a potential trend reversal. They enter the market at the close of the inverted hammer candle and place a stop loss below the support level. Their take-profit target is at the next resistance level.
A trader could implement a more conservative approach and wait for at least a few candles to form in the uptrend direction. However, as the pattern was formed at the 5-minute chart, a trader could enter the market too late or with a poor risk-reward ratio.
Advantages and Limitations of the Inverted Hammer
The inverted hammer has its strengths and limitations. Here’s a closer look:
Advantages
- Recognisable: The pattern has a unique shape, making it accessible for traders at all experience levels.
- Can Be Spot in Different Markets: The candle can be found on charts of different assets across all timeframes.
- Clear Idea: When it appears on a chart, it reflects a trend reversal, allowing traders to incorporate it into broader trading strategies, especially when there are additional confirming signals.
Limitations
- Reliability Depends on Confirmation: The candle alone does not guarantee a market reversal; it requires confirmation from the next candlestick or other indicators. Without this, the reversal signal may be weak.
- Works Only in Strong Downtrends: The pattern might be more useful in strong downtrends; in ranging or weak trends, it generates less reliable signals.
- False Signals Can Occur: False signals are possible, especially in volatile markets. Over-reliance on this pattern without additional analysis may lead to poor trade outcomes.
Final Thoughts
While the inverted hammer can provide valuable insights into potential trend reversals, it should not be the sole basis for trading decisions. It is important to supplement analysis with other technical indicators and tools to strengthen the overall trading strategy. Also, risk management is crucial while trading this formation.
If you want to develop your own trading strategy, you may consider opening an FXOpen account and access over 700 markets with tight spreads from 0.0 pips and low commissions from $1.50.
FAQ
Is an Inverted Hammer Bullish?
Yes, it is considered a bullish reversal pattern. It indicates a potential shift from a downtrend to an uptrend in the market. While it may seem counterintuitive due to its name, the setup suggests that buying pressure has overcome selling pressure and that bulls are gaining strength.
How Can an Inverted Hammer Be Traded?
When using an inverted hammer, traders wait for confirmation in the next session, such as a gap-up or strong bullish candle. They usually open a buy position with a stop-loss below the low of the pattern to potentially manage risk and a take-profit level at the closest resistance level.
Is the Inverted Hammer a Trend Reversal Signal?
It is generally considered a potential trend reversal signal. An inverted hammer in a downtrend suggests a shift in market sentiment from bearish to bullish. An inverted hammer in an uptrend does not signify anything.
What Happens After a Reverse Hammer Candlestick?
After a reverse (or inverted) hammer candle, there may be a potential bullish reversal if confirmed by a strong bullish candle in the next session. However, without confirmation, the pattern alone does not guarantee a trend change.
Can an Inverted Hammer Candlestick Be Traded in an Uptrend?
In an uptrend, an inverted hammer isn’t generally considered significant because it’s primarily a reversal signal in a downtrend.
Are Inverted Hammer and Shooting Star the Same?
No, the inverted hammer and shooting star look similar but occur in opposite trends; the former appears in a downtrend as a bullish reversal signal, while the latter appears in an uptrend as a bearish reversal signal.
What Is the Difference Between a Hanging Man and an Inverted Hammer?
The hanging man and inverted hammer differ in both appearance and context. The former appears at the end of an uptrend as a bearish signal and has a small body and a long lower shadow, while the latter appears at the end of a downtrend as a bullish signal and has a small body and a long upper shadow.
What Is the Difference Between Red and Green Inverted Hammer Candlesticks?
A bullish (green) inverted hammer candlestick closes higher than its opening price, indicating a stronger bullish sentiment. A bearish (red) inverted hammer candlestick closes lower than its opening, which might indicate less buying strength, but both colours may signal a reversal if followed by confirmation.
*Important: At FXOpen UK, Cryptocurrency trading via CFDs is only available to our Professional clients. They are not available for trading by Retail clients. To find out more information about how this may affect you, please get in touch with our team.
This article represents the opinion of the Companies operating under the FXOpen brand only. It is not to be construed as an offer, solicitation, or recommendation with respect to products and services provided by the Companies operating under the FXOpen brand, nor is it to be considered financial advice.


Cryptocurrencies are extending their advances on Tuesday as easing concerns about a potential oil supply shock improved risk sentiment across global markets.
The sentiment shift came after the International Energy Agency (IEA) said it would convene an extraordinary meeting of its member countries to consider releasing emergency oil reserves.
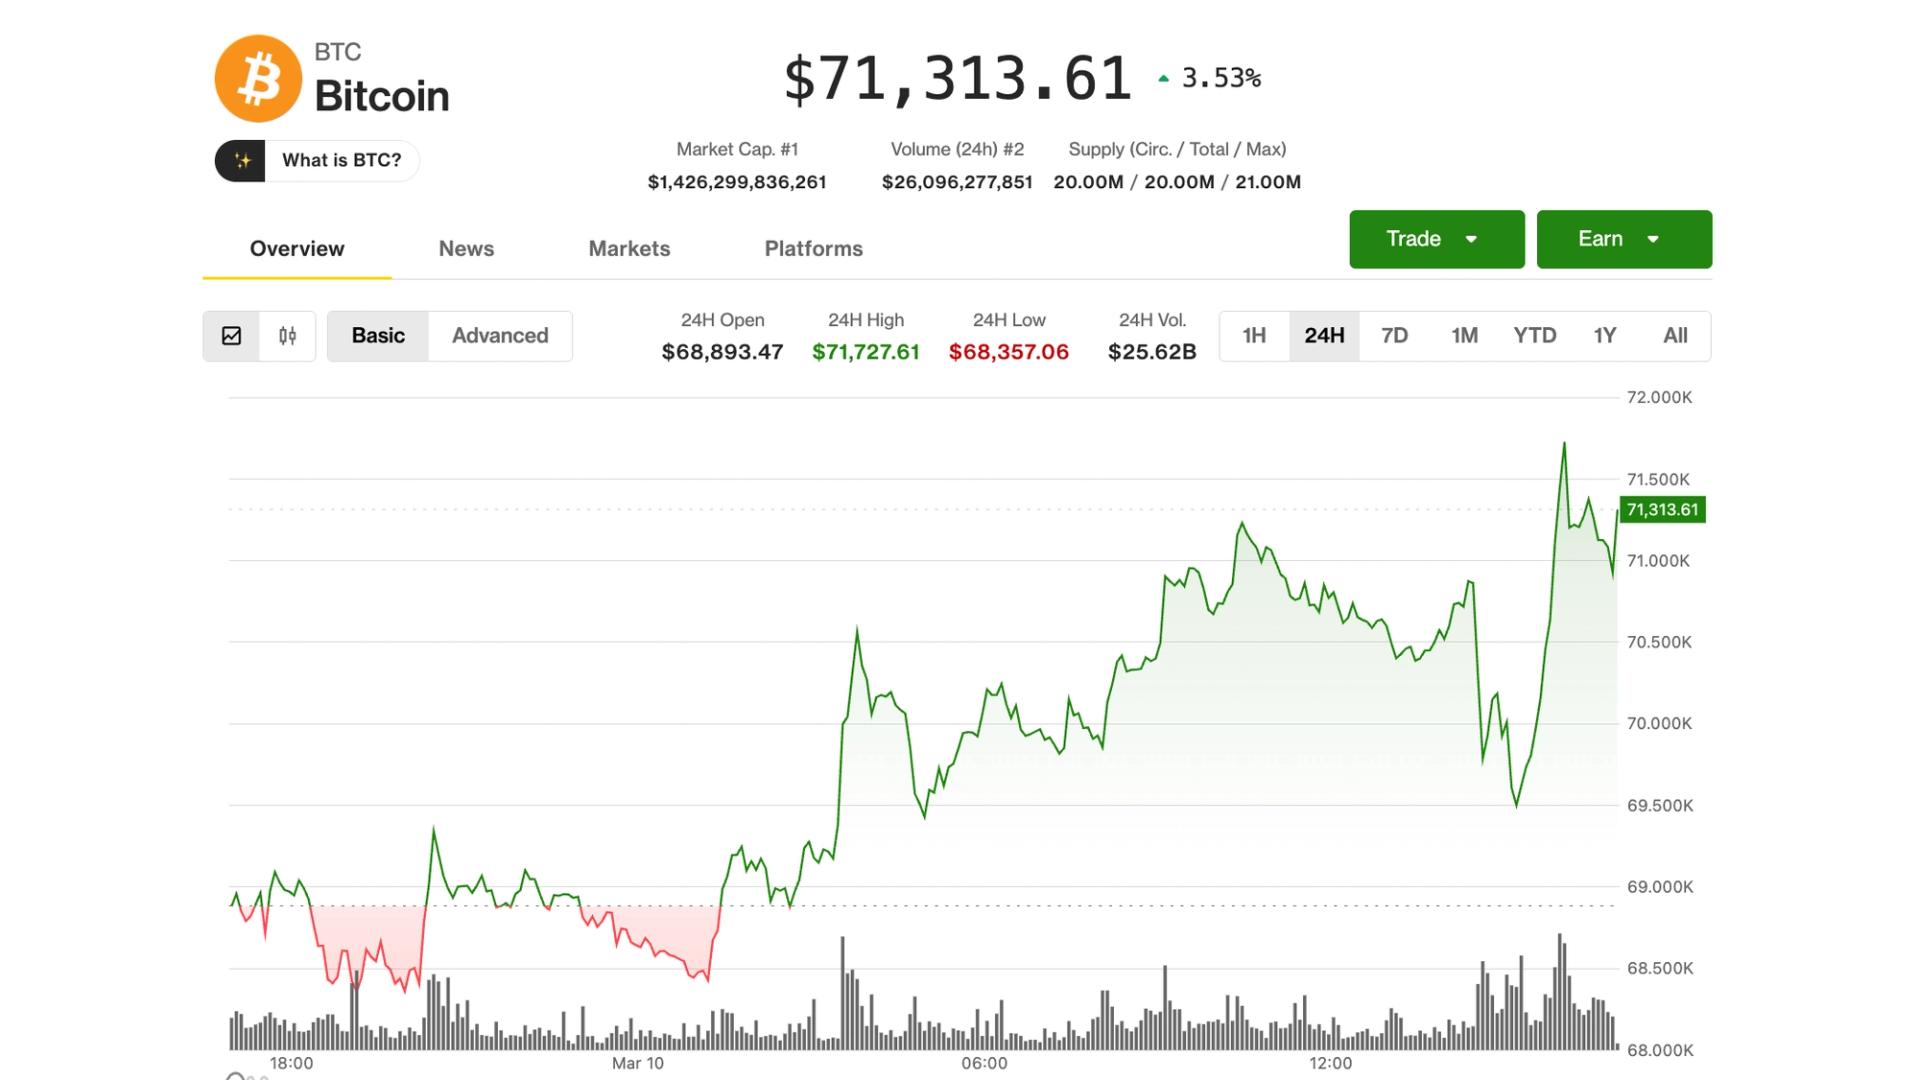
Bitcoin climbed above $71,500 for the first time since Thursday, before easing back to the current $71,300, up 3.2% over the past 24 hours. The broad market CoinDesk 20 Index was up by a similar amount, with XRP (XRP), , and Hyperliquid’s native token (HYPE) leading gains among major crypto assets.
WTI crude oil extended its decline on the news, dropping to $82 after spiking to near $120 over the weekend. Meanwhile, the S&P 500 and tech-heavy Nasdaq 100 were up roughly 0.5% at midday.
Most crypto-related stocks mirrored the advance. Stablecoin issuer Circle (CRCL) was up another 6%, now nearly 100% higher in two weeks, while digital asset infrastructure firm BitGo (BTGO) climbed more than 8% and blockchain firm Figure (FIGR) rallied 12%.
Since Nigel Farage was announced as joining U.K. bitcoin treasury firm Stack BTC (STAK) on Monday, that stock has surged more than 200%.
Bitcoin decoupling from software
Bitcoin appears to be losing its correlation with the software stock ETF (IGV), as BlackRock’s IBIT is up around 3% over the past 24 hours while IGV is down more than 2%.
However, over the past five days, IGV is up about 1.5% while IBIT is down roughly 2%, suggesting IBIT may still have some catching up to do if the correlation with software stocks is to re-establish itself.
A weakening correlation could also be notable, as it may signal bitcoin beginning to trade more independently from software and tech equities, potentially becoming a more uncorrelated asset during periods of macro uncertainty. While still outperforming gold and U.S. equities since the war began.
‘Cautiously optimistic’ for BTC
Zooming out, bitcoin’s recent price action has been relatively resilient despite the ongoing macro turbulence, said James Harris, CEO of crypto yield platform Tesseract Group.
After briefly testing the low-$60,000 area, BTC recovered even as broader risk markets struggled with geopolitical uncertainty, he said. Meanwhile, ETF inflows have remained broadly supportive, while a sharp deleveraging earlier in the month helped clean up excessive positioning in derivatives markets.
The mix of washed-out sentiment, flushed-out leverage and support around the $66,000 zone suggests bitcoin may be entering a bottoming process, Harris said. However, downside risk persists as the crypto market remains fragile.
“If support in the mid-$60k area fails, we could easily see another test lower, but for now we remain cautiously optimistic on BTC,” he said.


We all know the problem with a public ledger. Most of us living inside the crypto ecosystem can’t actually bring ourselves to say it.
But find a normie on the street, one with some knowledge of blockchain (good luck with that), and they’ll tell you straight. It’s public. A public ledger is public.
We’ve spent almost two decades trying to sell pork pies to vegans, trumpeting “public” as a virtue, when people actually crave privacy.
Out there in the real world, normies don’t see radical transparency. Many perceive insanity. They see data breaches. They are in no doubt that sharing a permanent and immutable record of every transaction they’ve ever made is utterly absurd.
You wouldn’t use a credit card if your neighbor could see every transaction you made. You wouldn’t run a business if your competitors could see exactly who your suppliers are and what you’re paying them.
To put it simply, on-chain is too public, off-chain is too private. There has to be a balance. Some information needs to be made public for audit and regulatory purposes. Some information needs to remain private to enable businesses to function effectively.
Businesses need to shield their proprietary moves from competitors while providing a “viewing key” to regulators or auditors. It’s a balance between complying with the law and functioning effectively in the market.
There are some good reasons why institutional finance hasn’t fully embraced blockchain–why the hedge funds, asset managers and corporate treasuries with billions to invest haven’t been red-pilled. One of those reasons is that they understandably don’t want to hand their proprietary strategy to the entire world, and simply cannot do so. It would be like broadcasting their alpha for free.
The corporate reality check
Stablecoins promise speed and efficiency for B2B transactions. The cost is low, but the price is high. Privacy. A transparent ledger means everyone–friend or foe, ally or rival–can see a company’s business. Which vendor they’re using, the volume of the orders and the price per unit. There are no secrets; everything’s on display, and they’re effectively leaking their entire supply chain. Businesses have to find ways around the problem by enhancing privacy while remaining compliant.
What we need is the blockchain equivalent of the internet’s SSL moment. We didn’t get a functional web until encryption became a standard layer, allowing us to send credit card info without the whole world watching.
From theory to practice
We are finally seeing this infrastructure move from whitepapers to the real world. For example, the Canton Network has had some success in bringing privacy to enterprise finance, albeit in a permissioned form. I’ve been involved in one of the latest privacy advances. It’s the newly announced plan to launch strkBTC on Starknet. We have spent years treating Bitcoin as digital gold—a great store of value, but one that is largely static and totally exposed if you try to use it in DeFi.
For the first time, you can have the security of Bitcoin with a “confidentiality layer” that protects your balances and counterparties from public view. It is the first proof that we can have an “active” Bitcoin that respects the commercial need for privacy, all with selective disclosure for reasonable risk management.
The path forward
One of the values of early crypto adopters was privacy, but that ambition will remain unfulfilled if we don’t build for the systemically important capital flows that move the world. Public blockchains will only scale if they can support private finance.
Through selective disclosure and protocol-level confidentiality, we aren’t just adding a feature. We are finally building a system that the world can actually use. The technology is here—the remaining question is which networks will set the standard for the next era of global finance.

Latest developments: Edelman told CoinDesk’s Jennifer Sanasie on Markets Outlook that the dispute over whether stablecoins can offer yield is threatening progress on market structure legislation.
- Banking groups argue allowing stablecoin issuers to offer yield would siphon deposits from traditional banks.
- Edelman said banks are opposing the provision largely because stablecoins pose a competitive threat to their business models.
- The issue has become a sticking point in negotiations around the Clarity Act, a proposed crypto market structure bill in Washington.
- Despite siding with crypto on the economics, Edelman said the banking lobby is politically strong and “likely to win the argument.”
Why it matters: Edelman argues the industry should compromise rather than risk losing regulatory clarity altogether.
- “I don’t think it’s the hill to die on,” Edelman said about the fight over stablecoin yield.
- He said the broader legislation would provide long-awaited regulatory certainty for crypto companies and investors.
- Prediction markets currently suggest the bill will pass, he said, though the timeline remains uncertain.
- Edelman warned the bill could stall if it doesn’t pass before midterm elections.
The market outlook: Edelman believes regulatory clarity could quickly revive crypto markets.
- If the bill fails, he expects a sharp but temporary drop in crypto prices as investors react.
- Over the long term, crypto would still grow but at a slower pace without supportive legislation.
- If clarity arrives, Edelman predicts crypto prices could surge and quickly reach new all-time highs.
- He reiterated his long-term forecast that bitcoin could reach $500,000 by the end of the decade.
Reading between the lines: Edelman also pushed back on fears that quantum computing threatens Bitcoin.
- Claims that quantum computers will break the Bitcoin blockchain are “one of the dumbest things I’ve ever heard anybody say,” Edelman said.
- He argued the industry would develop defensive cryptography alongside any advances in quantum computing.
- Even if such machines emerge, attackers would likely target larger financial systems or infrastructure before Bitcoin.
- Edelman continues to recommend investors allocate up to 40% of portfolios to crypto broadly, focusing mainly on major assets such as bitcoin, ether and solana.
Looking ahead: Edelman expects consolidation among cryptocurrencies as the market matures.
- He predicts roughly a dozen major cryptocurrencies will ultimately dominate the sector.
- At the same time, tokenization could create hundreds of thousands of blockchain-based tokens representing assets like real estate, commodities and collectibles.
- That shift could dramatically expand diversification opportunities for investors.
Crypto World
Alphabet (GOOG) Stock: Pentagon to Receive Gemini AI Agents for 3 Million Defense Personnel

Key Highlights
- Pentagon’s complete 3 million-person workforce will gain access to Google’s Gemini AI agents
- Initial rollout targets unclassified systems, while discussions progress for classified network integration
- Platform offers eight pre-configured agents designed for budget creation, meeting notes, and strategic planning
- Defense Department users have generated 40 million prompts through Google’s AI interface since its December debut
- Training completion remains limited to just 26,000 personnel despite significantly higher adoption rates
Google, owned by Alphabet, has initiated a comprehensive deployment of its Gemini AI agent technology throughout the United States Department of Defense, encompassing approximately three million personnel.
The initial phase focuses on unclassified network infrastructure, where the majority of Defense Department personnel operate daily. Emil Michael, serving as under secretary of defense for research and engineering, indicated this strategic starting point.
Michael revealed that negotiations with Google are currently active regarding expansion into classified and top-secret cloud computing environments.
Google Vice President Jim Kelly made the announcement public through a Tuesday blog entry. Defense personnel will have the capability to create customized AI agents through natural language commands, eliminating any programming requirements.
The platform launches with eight ready-to-deploy agents. These automated assistants handle functions including meeting documentation, financial planning, and verification of proposed initiatives against national defense objectives.
Certain agents are designed to provide operational value, assisting with logistical planning and resource forecasting for military operations — capabilities available even on unclassified infrastructure.
Google’s conversational AI interface on the GenAI.mil website has been operational since December. During this period, 1.2 million Defense Department personnel have engaged with the system, generating 40 million distinct queries and submitting over four million documents.
The usage volume demonstrates significant adoption. The Gemini agent platform becomes accessible through this identical portal starting Tuesday.
Personnel Education Falls Short of Adoption Rates
A significant challenge exists. Just 26,000 Pentagon employees have completed formal instruction on appropriate AI utilization. Upcoming educational programs have reached capacity, a Pentagon representative confirmed.
Michael emphasized the importance of proper training. “It saves you a lot of time in the middle, but you have to review at the end to make sure there’s no hallucinations,” he said.
Bridging the divide between actual usage and completed training represents a priority as the Defense Department expands agent availability.
Military Exercise Planning Sees Dramatic Efficiency Gains
The technology has already demonstrated measurable impact in operational settings. Kenneth Harvey, who directs the Mission Training Complex at Fort Bragg, explained that developing a military exercise scenario accommodating up to 50,000 simulated troops previously required his nine-member team six months.
Leveraging the AI platform, a comparable exercise for US Southern Command reached completion within six weeks.
Harvey emphasized that “human eyes vetted every word” throughout the process.
This latest initiative represents a significant expansion of collaboration between Google and the Pentagon, a relationship that has experienced turbulence. In 2018, thousands of Google staff members protested the corporation’s participation in Project Maven, an AI-powered drone surveillance initiative. Google declined to continue that contract.
The technology company subsequently revised its policies regarding military contracts. Michael characterized Google as a “trusted” and “supportive” partner.
The Pentagon has simultaneously broadened its artificial intelligence partnerships. Recent agreements with OpenAI and Elon Musk’s xAI enable operations on restricted networks — developments that coincided with deteriorating relations with Anthropic.
The Department of Defense designated Anthropic a supply-chain security concern last week following the company’s objections regarding potential AI applications. Anthropic has responded by filing legal action against the government challenging this classification.
Prior to this conflict, Anthropic maintained exclusive status as the sole AI vendor with access to the Pentagon’s classified cloud infrastructure.
GOOG was trading at $308.84, up 0.81% on the day at the time of writing.


Bitcoin mining company Canaan increased its digital asset holdings to record levels in February, signaling a long-term accumulation strategy despite challenging market conditions for miners.
In its February unaudited mining update issued Tuesday, Canaan said it produced 86 Bitcoin (BTC) during the month, bringing its total holdings to 1,793 BTC, a new record for the company.
Canaan’s Ether (ETH) holdings also reached a record high of 3,952 ETH, with the combined value of its digital asset treasury totaling roughly $128 million at current prices.
The company’s Nasdaq-traded shares (CAN) were up 1% in late Tuesday morning trading. Sector-tracking exchange-traded fund CoinShares Bitcoin Mining ETF (WMGI) was up 2.5%.
Chairman and CEO Nangeng Zhang said the company remains focused on a long-term strategy of building its digital asset reserves.
“We maintain a long-term perspective on building and managing our digital asset treasury,” Zhang said.

Canaan also expanded its mining operations, with its installed hashrate reaching 14.75 exahashes per second (EH/s).
The update follows Canaan’s recent expansion in the United States. In February, the company acquired a 49% stake in three Bitcoin mining projects in West Texas for $39.75 million, a move aimed at increasing its North American mining capacity.
The Texas facilities are expected to boost Canaan’s presence in one of the world’s largest Bitcoin mining regions.
Related: Bitcoin miner production data reveals scale of US winter storm disruption
Miners ramp up Bitcoin sales as margins tighten
Canaan’s update comes as Bitcoin miners increasingly sell portions of their reserves amid worsening market conditions.
The trend has accelerated since October, when the biggest crypto by market capitalization peaked around $126,000 before falling by more than half to the low-$60,000 range, squeezing mining profitability.
The downturn has compounded what some analysts describe as the harshest margin environment the sector has faced, with rising operational costs and lower BTC prices weighing on miners’ balance sheets.
Data from TheEnergyMag’s Miners Weekly shows that publicly traded mining companies have sold more than 15,000 BTC since October. The total includes several large transactions, such as Cango’s February sale of 4,451 BTC and Core Scientific’s plan to sell up to 2,500 BTC this quarter.

The shift marks a departure from the trend seen earlier in 2025, when many miners adopted a de facto treasury strategy, choosing to retain a larger share of the Bitcoin they mined rather than selling it immediately.
Related: Bitcoin mining’s 2026 reckoning: AI pivots, margin pressure and a fight to survive


Kraken is trying to turn tokenized equities from a side‑show into a parallel equity market running on crypto rails through its xStocks platform and a new Nasdaq partnership.
Summary
- xStocks offers 60+ tokenized U.S. stocks and ETFs, fully backed 1:1, with 24/5 trading and EU rollout aimed at investors shut out of Wall Street hours.
- Kraken is acquiring issuer Backed Finance and has logged over $25B in volume in under eight months across CEX, DEX, and mint/redemption flows.
- A Nasdaq partnership will use xStocks tech to move listed securities onto blockchain rails, while regulators warn that “mimic” products risk diluting shareholder rights.
Kraken is trying to turn tokenized equities from a side‑show into a parallel equity market that runs on crypto rails, 24/7. Its xStocks platform now offers more than 60 tokenized U.S. stocks and ETFs, has been rolled out to eligible clients across the European Union, and has processed over $25 billion in cumulative transaction volume in under eight months, according to company data and recent coverage.
How Kraken’s tokenized stock platform works
xStocks lets users buy, sell and transfer blockchain‑based tokens that mirror real U.S. equities like Tesla, Amazon, Nvidia and broad‑market ETFs, with each token fully backed 1:1 by the underlying security held by a licensed custodian in a bankruptcy‑remote structure. Cointelegraph and Finance Magnates report that the product gives investors 24/5 trading in digital certificates that track U.S. prices, extended hours beyond Wall Street’s 9‑to‑5, and the ability to move positions between compatible venues or self‑custody them on‑chain. Kraken’s European rollout, announced in September 2025, explicitly targets clients who “for too long” have found it “unnecessarily challenging to gain exposure to U.S. markets,” as global head of consumer Mark Greenberg put it.
Under the hood, Kraken is pulling tokenization closer to its core stack. The exchange has agreed to acquire Backed Finance – the issuer behind xStocks – integrating issuance and trading under one roof just as it prepares for a planned 2026 IPO. AInvest and other outlets note that xStocks has already surpassed $25 billion in total transaction volume, including centralized venue trading, DeFi liquidity, and mint/redemption flows, with partnerships in place to distribute the tokens via platforms like Bybit and Gate.io to users in more than 110 countries. In parallel, a separate initiative will see Nasdaq use Payward’s (Kraken’s parent) xStocks tokenization technology to move listed securities onto blockchain rails for global distribution – a sign that incumbents increasingly prefer to build on top of Kraken’s infrastructure rather than compete with it from scratch.
Market structure: equity rails on crypto infrastructure
The pitch is blunt: make stocks as composable as stablecoins. AInvest summarises Kraken’s goal as “making equities as composable as stablecoins in web3 ecosystems,” letting traders post tokenized stocks as collateral, wrap them into on‑chain strategies, or trade perpetual futures that reference xStocks rather than traditional listings. A recent Business Wire release notes that Kraken has already listed “the world’s first regulated tokenized equity perpetual futures,” using xStocks as the reference layer so traders can “respond to market events without waiting for traditional markets to open.” That reframes tokenized equities from a convenient wrapper into a potential new base layer: equity exposure that trades like crypto, clears across borders, and is governed by a mix of securities law and smart contracts rather than just a single national exchange rulebook.
Regulation remains the hard edge. The World Federation of Exchanges has warned that some tokenized stock products act as “mimics” that may not deliver full shareholder rights, and Nasdaq’s 2025 filing to list tokenized securities alongside conventional shares was a direct response to that risk. Kraken is betting that by keeping xStocks fully backed, integrating the issuer, and pushing for regulated derivatives on top, it can stay on the right side of that line – and, in the process, turn its tokenized equity platform into a meaningful revenue and strategic pillar ahead of its planned public listing.


- Jupiter (JUP) price hovered near $0.17 amid a 6% intraday gain.
- The bounce coincided with Bitcoin’s spike to above $70,000.
- The move was also supported by a key Chainlink integration.
JUP, the governance token of Jupiter, has bounced off recent lows as top cryptocurrencies record intraday gains.
The DEX protocol’s token traded around $0.17 on Tuesday, with 24-hour gains of nearly 6% pushing it above a key support level.
Jupiter Exchange taps Chainlink for prediction markets
JUP’s uptick coincided with the DEX platform’s strategic adoption of Chainlink technology to power its newly launched prediction markets.
JUST IN: The largest decentralized exchange on Solana has adopted Chainlink to power its newly launched prediction markets, @jup_predict.@JupiterExchange‘s ($2.8B TVL) 5-min & 15-min markets for BTC, ETH, SOL, & more are now secured by fast Chainlink Data Streams market data. pic.twitter.com/gT8pCYZDrw
— Chainlink (@chainlink) March 10, 2026
Jupiter Exchange, recognised as the largest DEX aggregator on the Solana blockchain, has integrated Chainlink’s advanced oracle solutions to underpin its innovative prediction markets.
These markets, now live with 5-minute and 15-minute settlement options, cover major assets including Bitcoin (BTC), Ethereum (ETH), and Solana (SOL).
By leveraging Chainlink Data Streams, Jupiter ensures sub-second price feeds directly from premium exchange sources.
It minimises latency and mitigates risks like front-running or oracle manipulation that plague traditional DeFi platforms.
Jupiter users can now speculate on short-term price movements with heightened accuracy.
Market participants view this integration as a catalyst for increased trading volume, with Chainlink’s secure, low-latency oracles enhancing user confidence.
The move could attract liquidity providers seeking reliable settlement mechanisms and help shine a spotlight on Jupiter’s potential and thus on JUP.
It’s only in many Jupiter milestones that have seen the exchange token become a top 100 cryptocurrency by market capitalisation.
Jupiter price analysis
The JUP token has navigated a downward channel since plummeting from above $0.70 in April 2025.
A broader weakness across crypto means that at the current price, the token’s value is down by more than 60% over the past year.
Despite this bearish outlook, the token has bounced decisively from the channel’s lower boundary.
Bulls are looking to stabilise above $0.17, and a flip in sentiment could catalyse further gains amid a breakout scenario.
Technical indicators on the daily chart highlight this picture.

As can be seen above, the Relative Strength Index (RSI) has recovered from oversold conditions and hovers above the neutral line.
The indicator boasts a bullish divergence and signals a potential strengthening of the upward momentum.
However, the MACD suggests a bearish reversal.
If buyers hold the sway, more gains could push prices towards the immediate overhead resistance zone around $0.20–$0.22.
A breakout could see bulls test the supply wall around $0.30.
However, a rejection at current levels risks a retest of $0.15.
The support level might act as a demand reload zone and result in fresh consolidation before another bullish move.
If not, the price could drop to $0.100.


US prosecutors want a retrial for Roman Storm after a jury deadlocked on money laundering and sanctions charges.
The U.S. Department of Justice (DOJ) has asked that Tornado Cash developer Roman Storm be put on trial anew on charges of money laundering and sanctions violations.
Last year, a jury was unable to reach a unanimous verdict on the two counts after a four-week hearing in the Southern District of New York (SDNY) presided over by U.S. District Judge Katherine Polk Failla.
Storm Faces Retrial in 2026
The same jury convicted Storm of conspiracy to operate an unlicensed money laundering operation, but hit a deadlock on the more serious charges. Now, as Storm revealed in an update on social media, prosecutors have asked Judge Failla to schedule a retrial in October 2026 to try to settle the unresolved points. He questioned the move, stating,
“The government’s response? Try again to make writing code a crime.”
The Tornado Cash case, along with that of Samourai Wallet co-founders Keonne Rodriguez and William Lonergan Hill, has long been a point of contention in the crypto community, with many viewing it as a direct attack on developers who build privacy-preserving technology.
According to supporters, open-source coders should not be held responsible for how others use their technology. But on the other hand, regulators claim that the mixing service knowingly took part in large-scale money laundering and sanctions evasion.
In his X post, Storm pointed to what he sees as contradictions in the government’s approach. He believes that the DOJ’s request was made despite there being a more favorable policy climate for the crypto industry in the U.S.
The developer specifically mentioned a statement by U.S. President Donald Trump declaring that the “war on crypto is over” and a memo from Deputy Attorney General Todd Blanche, in which he said that the DOJ is “not a digital assets regulator” and would not target crypto mixers for the actions of their end users.
You may also like:
Storm’s post also referenced the U.S. Treasury’s decision to lift sanctions on Tornado Cash, as well as a recent report to Congress under the GENIUS Act that acknowledged lawful crypto users can rely on mixers for financial privacy.
40-Year Prison Sentence
The 36-year-old now faces up to 40 years in prison if convicted on the two undecided conspiracy counts and a sentence of up to 5 years from his previous ruling.
“The 2 counts = up to 40 years in federal prison. For writing open-source code. For a protocol I don’t control. For transactions I never touched,” he wrote.
He also believes that the prosecutors are simply pushing for a different outcome in the case.
The post concluded with him appealing for financial support and a vow to keep fighting for freedom and the rights of other developers. Storm has called on anyone who values financial privacy or believes that writing code is a form of speech to contribute, emphasizing that “this is the moment.”
Binance Free $600 (CryptoPotato Exclusive): Use this link to register a new account and receive $600 exclusive welcome offer on Binance (full details).
LIMITED OFFER for CryptoPotato readers at Bybit: Use this link to register and open a $500 FREE position on any coin!

Modest increase, major bull run, or new pullback: what’s next for ETH?
Despite the turbulence over the past few weeks caused by geopolitical tension and other factors, Ethereum (ETH) managed to stabilize above $2,000.
Multiple industry participants expect the asset to post substantial gains in the near future, with some suggesting that the current levels provide a great buying opportunity.
New ATH in the Making?
The cryptocurrency market, which has been on a rollercoaster lately, experienced a significant revival today (March 10) after US President Donald Trump claimed the war with Iran “is very complete, pretty much.” ETH followed the green wave and is currently trading around $2,070, up 3% on a daily basis.
According to the popular market observer who goes by the moniker Merlijn The Trader on X, the second-largest cryptocurrency has returned to “the discount zone.” He believes the ongoing structure mirrors that of 2023, which was followed by a bull run.
In his view, holding the crucial $2,000 mark could lead to a major rally to almost $10,000, whereas losing it would mean that “the discount zone extends lower.”
For his part, X user James argued that ETH’s performance is similar to NVIDIA “before it melted faces.” That said, he expects the digital asset to follow the footsteps of the AI giant and explode to a new all-time high in the coming years.
Satoshi Flipper is also bullish, albeit making a more modest prediction. The trader thinks that a potential resolution to the military conflict between the USA (supported by Israel) and Iran could drive ETH to $2,500.
You may also like:
Certain on-chain indicators support the optimistic scenario. Some X users, for instance, revealed that whales continue to accumulate ETH: a development that reduces the number of tokens available on the open market and could trigger a rally (should demand remain constant or head north). The actions of large investors are also closely monitored by smaller players, who may follow suit and inject fresh capital into the ecosystem.
It is worth noting that Tom Lee’s BitMine is a notable whale that plays a main role in the buying spree. Most recently, the company purchased almost 61,000 ETH for approximately $123 million, thus increasing its total holdings to 4,535,563 coins.
Another Downtrend on the Horizon?
Contrary to the bullish predictions observed above, some analysts and traders expect ETH to head south soon. X user Crypto Tony said they await a potential rejection at around $2,060 “to short this down again.”
For his part, Ted predicted that ETH could soar to $2,400 if reclaiming the $2,150 level. After that, though, he sees “a decent chance” that the asset would dump toward new lows.
Binance Free $600 (CryptoPotato Exclusive): Use this link to register a new account and receive $600 exclusive welcome offer on Binance (full details).
LIMITED OFFER for CryptoPotato readers at Bybit: Use this link to register and open a $500 FREE position on any coin!

Ethereum price has gone nowhere since February 7 this year. While this could be a sign of bottoming, it has formed an alarming chart pattern, signaling a potential crash.
Summary
- Ethereum price has formed a bearish flag pattern on the daily chart.
- Spot ETH ETFs have shed millions of assets this month.
- The coin may have a strong bearish breakout in the near term.
Ethereum (ETH) price was trading at $2,065 today, March 10, as it rose for the second consecutive day. Despite this rise, it has remained inside the support and resistance levels at $1,843 and $2,143.
The ongoing consolidation has coincided with the waning demand for its exchange-traded funds. SoSoValue data shows that these funds have shed assets in the last three consecutive days. They shed $51 million in assets on Monday after losing $83 million and $90 million in the previous two trading days.
Ethereum ETFs have lost over $37 million in assets this month, and is in the fifth consecutive month in the red. As a result, the cumulative net inflow has dropped from nearly $15 billion to $11.58 billion.
Ethereum has diverged from Bitcoin, whose ETFs have added over $735 milion in inflows this month. Solana ETFs have added $21 million in assets, while Chainlink funds have gained $4.8 billion.
On the positive side, Ethereum’s fundamentals are still strong. For example, data shows that its stablecoin supply has jumped to over $166 billion, while its transaction volume in the last 30 days jumped to over $1.1 trillion. It is also the market leader in the real-world asset tokenization industry by far.
Ethereum price technical analysis
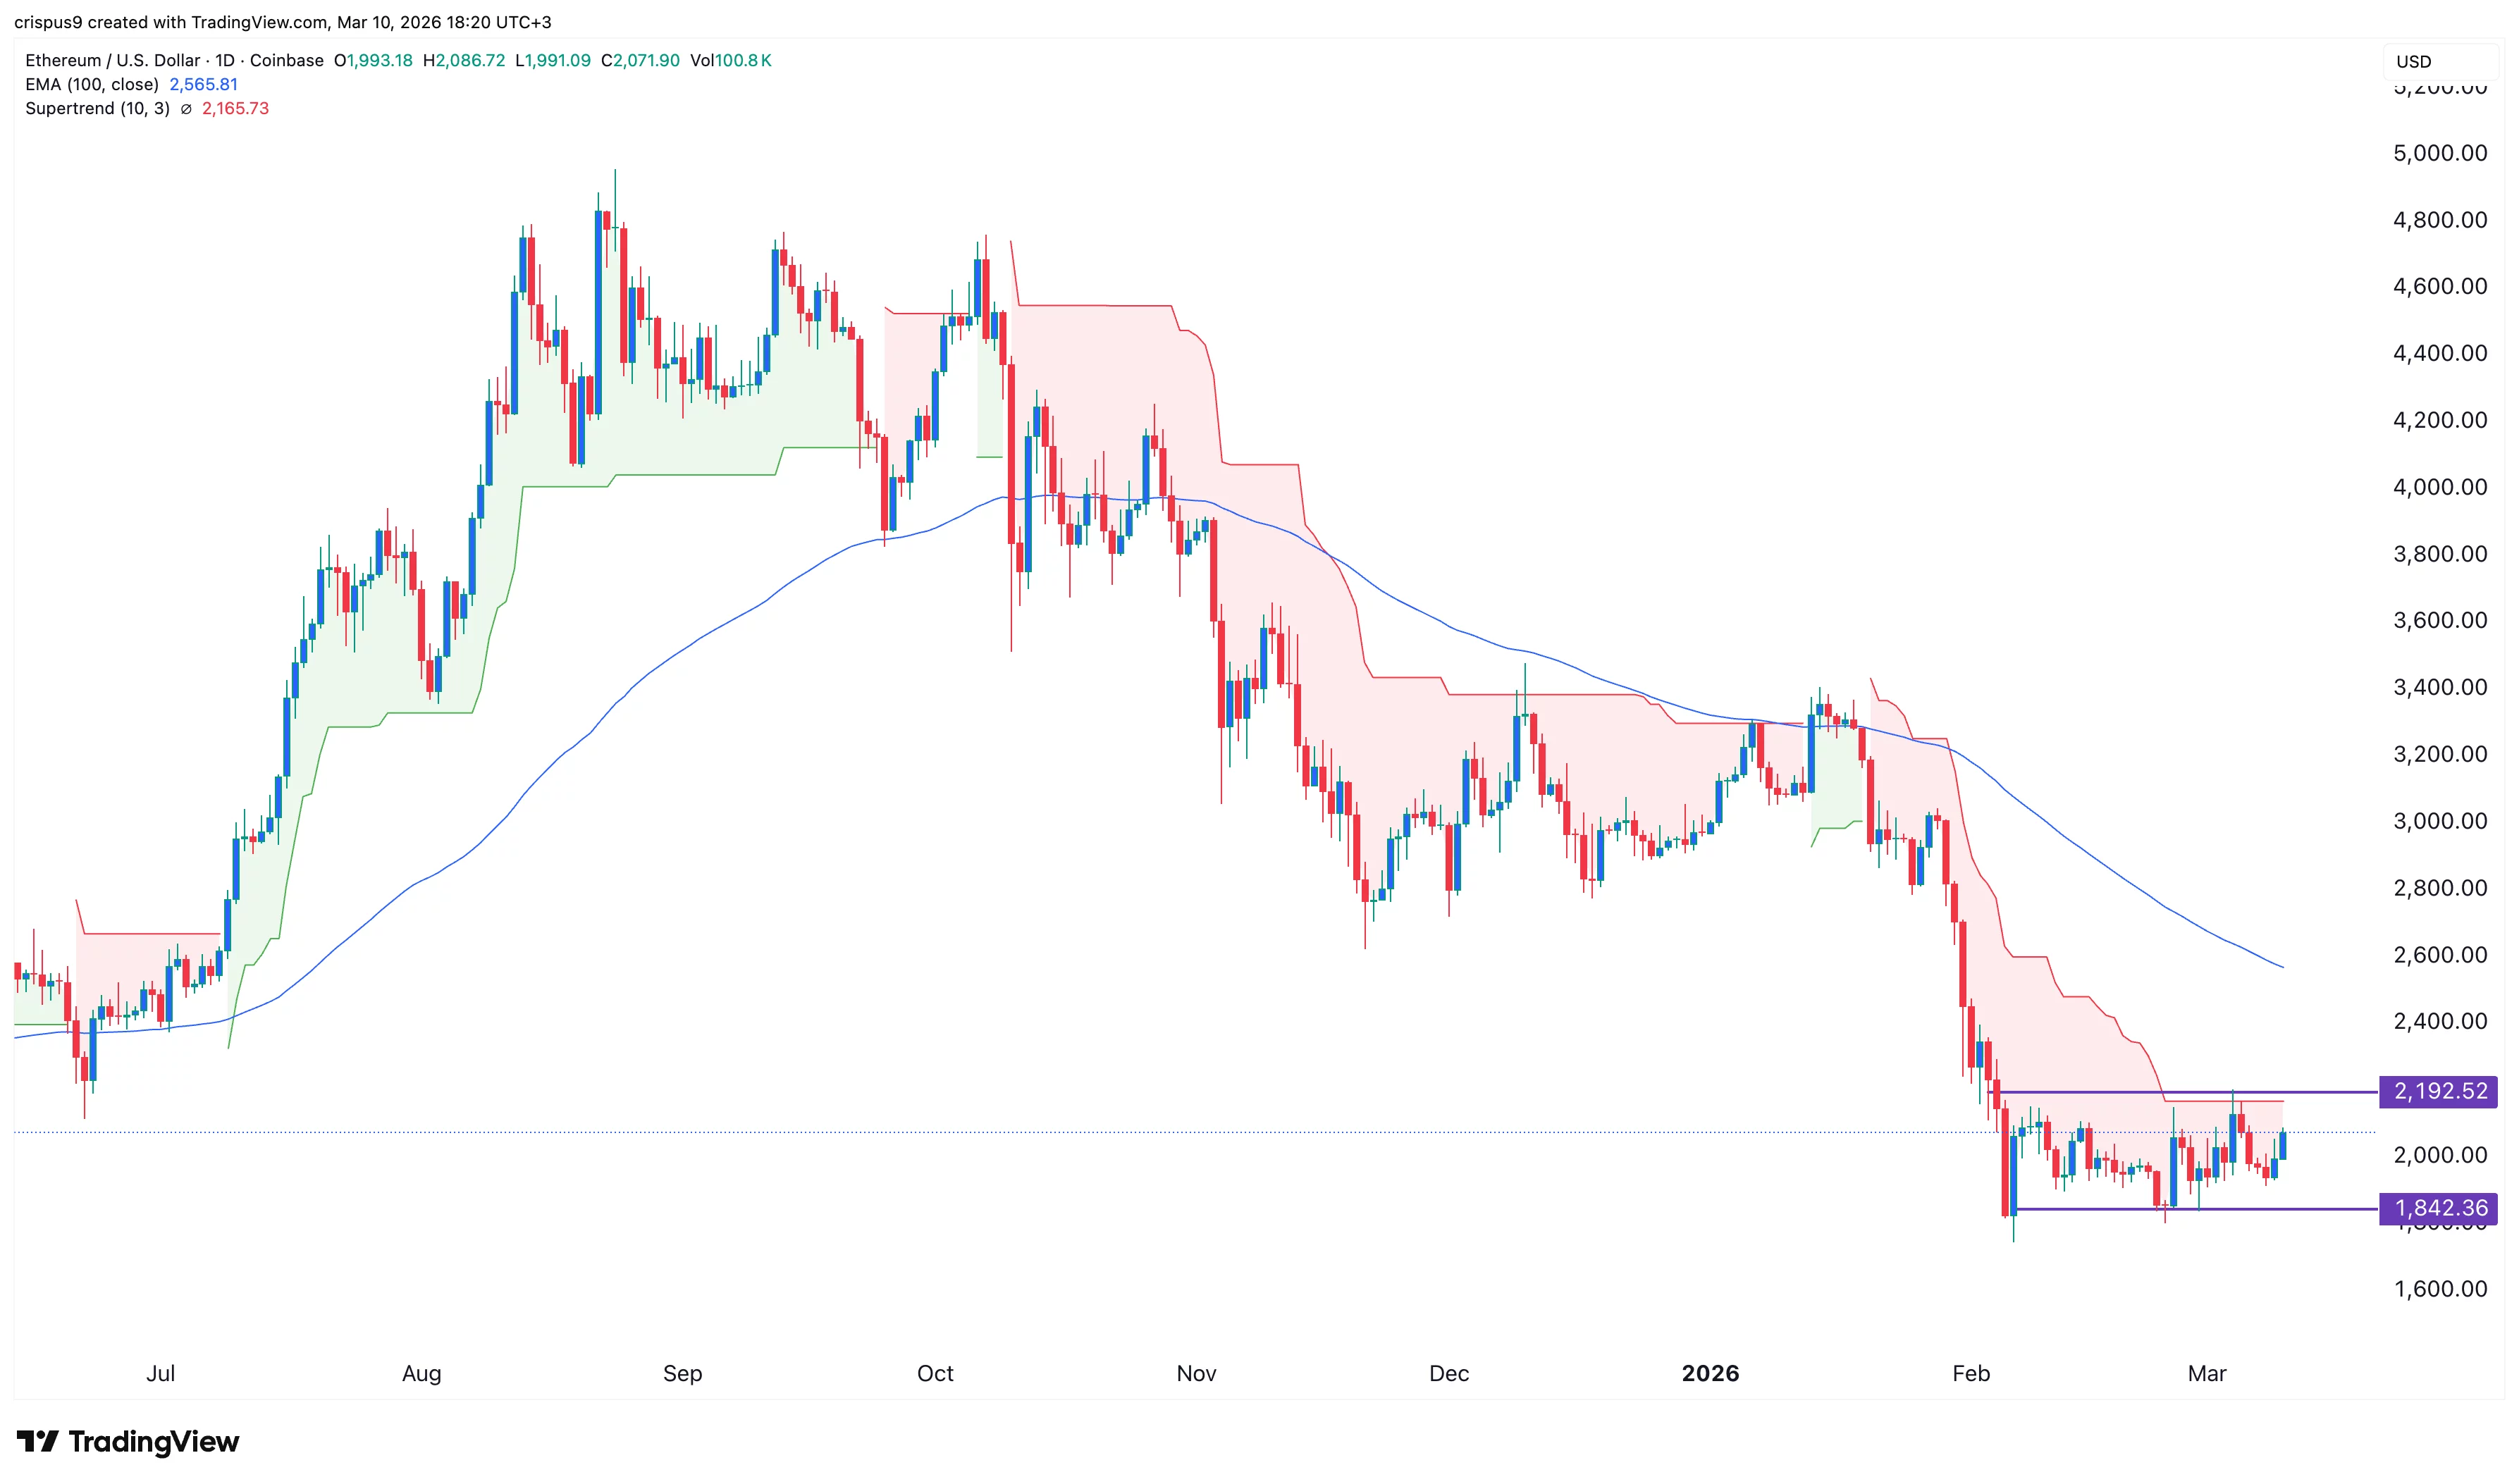
ETH price could be at risk of a big drop in the near term. The daily chart shows that it has formed a horizontal channel in the last 30 days. This channel formed after it dropped sharply. As a result, it has formed a bearish flag pattern, a popular continuation pattern.
The coin has remains below all moving averages and the Supertrend indicator. Therefore, the most likely outcome is where it resumes the downtrend, potentially to the lower side of the flag at $1,843. A drop below that level will point to more downside, potentially to the psychological level at $1,500.

NFL Players from Junipero Serra H.S. (Gardena, CA)

Warren Buffett: How To Restart Your Financial Life With $0.

Could Putin be the big winner of the Iran war? | World News

Smart energy pays enters the US market, targeting scalable financial infrastructure

Why Israel is blocking foreign journalists from entering

Bitcoin: We’re Entering The Most Dangerous Phase
Warren Buffett: How To Restart Your Financial Life With $0.

Pak Media Crying BCCI Announced 131 Crore Prize Money For Team India | ind vs NZ T20 WC | Pak Reacts

Morning Prayer For Financial Breakthrough: God Will Provide In Uncertain Times
-
Business4 days ago
Form 8K Entergy Mississippi LLC For: 6 March
-

 Fashion4 days ago
Weekend Open Thread: Ann Taylor
-

 News Videos1 day ago
10th Algebra | Financial Planning | Question Bank Solution | Board Exam 2026
-

 Crypto World1 day ago
Paradigm, a16z, Winklevoss Capital, Balaji Srinivasan among investors in ZODL
-

 Tech5 days ago
Bitwarden adds support for passkey login on Windows 11
-
 Sports5 days ago
499 runs and 34 sixes later, India beat England to enter T20 World Cup final | Cricket News
-

 Sports3 days ago
Three share 2-shot lead entering final round in Hong Kong
-

 Sports2 days ago
Braveheart Lakshya downs Lai in epic battle to enter All England Open final | Other Sports News
-

 Business7 days ago
Guthrie Disappearance Enters Fifth Week as Family Visits Memorial
-

 Politics4 days ago
Top Mamdani aide takes progressive project to the UK
-

 NewsBeat5 days ago
Piccadilly Circus just unveiled ‘London’s newest tourist attraction’ and it only costs 80p to enter
-

 Business2 days ago
Search for Nancy Guthrie Enters 37th Day as FBI Probes Wi-Fi Jammer Theory
-

 Entertainment4 days ago
Hailey Bieber Poses For Sexy Selfies In New Luscious Lip Thirst Traps
-
 NewsBeat16 hours ago
Pagazzi Lighting enters administration as 70 jobs lost and 11 stores close across Scotland
-

 Tech1 day ago
Despite challenges, Ireland sixth in EU for board gender diversity
-

 Crypto World6 days ago
New Crypto Mutuum Finance (MUTM) Reports V1 Protocol Progress as Roadmap Enters Phase 3
-

 Tech5 days ago
ACIP To Discuss COVID ‘Vaccine Injuries’ Next Month, Despite That Not Being In Its Purview
-
Entertainment6 days ago
Harry Styles Has ‘Struggled’ to Discuss Liam Payne’s Death
-

 Business21 hours ago
Search Enters 39th Day with FBI Tip Line Developments and No Major Breakthroughs
-
 NewsBeat5 days ago
Good Morning Britain fans delighted as Welsh presenter returns to host ITV show