

Crypto World
What’s Next for XRP After Monday’s Flash Crash?
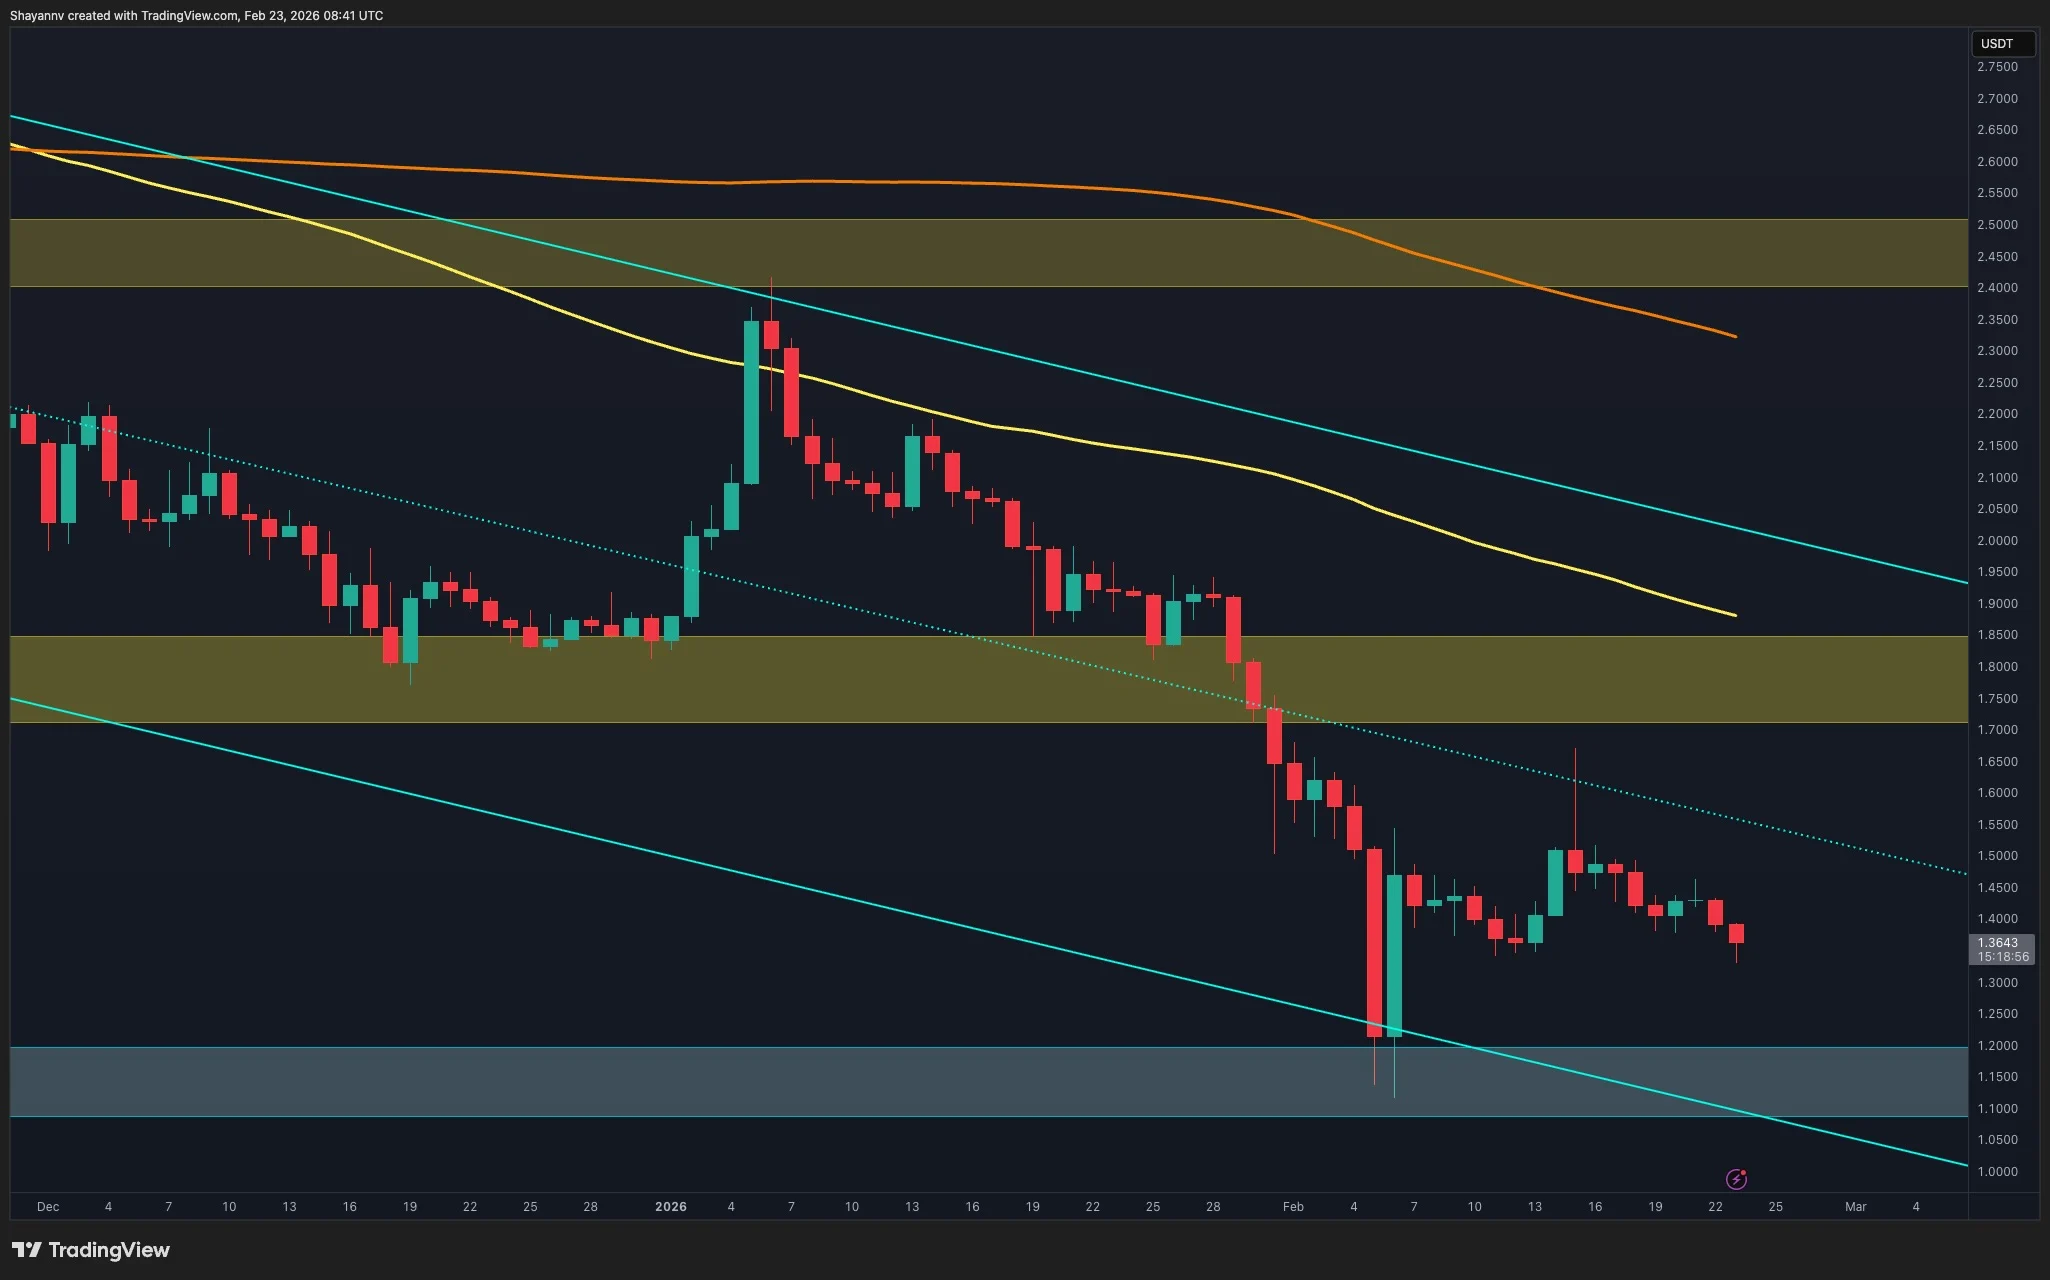
Ripple’s XRP joined the rest of the market in the past day, with another crash displaying continued weakness within a broader descending structure, as upside attempts repeatedly fail to generate sustained momentum. The price is now trading within a clearly defined range, awaiting a decisive breakout to determine the next directional move.
Ripple Price Analysis: The Daily Chart
On the daily timeframe, XRP attempted to break above the channel’s middle boundary of $1.60 but failed to sustain the move. The brief push beyond this midline resulted in a liquidity sweep, where buy-side liquidity was taken before sellers stepped back in and drove the asset lower. This false breakout highlights the presence of supply overhead and confirms that bullish momentum remains fragile.
Following the rejection, the price rotated back into the established range and continues to fluctuate between the upper supply zone and the lower demand base. The structure now suggests ongoing consolidation rather than immediate trend reversal. Unless XRP can decisively reclaim and hold above the channel’s middle boundary, the market is likely to remain range-bound, with liquidity hunts on both sides shaping short-term volatility.
XRP/USDT 4-Hour Chart
On the 4-hour timeframe, XRP remains structurally bearish, trading inside a well-defined descending structure. After the failed daily breakout and liquidity sweep, the price resumed its downward trajectory and continues to form lower highs and lower lows within the channel boundaries.
The recent bounce from the lower demand zone near the $1.10–$1.20 region was sharp but corrective in nature. The asset is now consolidating around the $1.35–$1.40 area, which previously acted as intraday support.
As long as XRP remains below the channel’s mid-structure and the $1.50 zone, upside attempts are likely to face selling pressure. A move toward the $1.50–$1.55 supply region would be considered a corrective retest unless accompanied by strong momentum and a structural break. On the downside, losing the current support cluster would expose the lower boundary of the channel and increase the probability of another liquidity sweep below recent lows.

Binance Free $600 (CryptoPotato Exclusive): Use this link to register a new account and receive $600 exclusive welcome offer on Binance (full details).
LIMITED OFFER for CryptoPotato readers at Bybit: Use this link to register and open a $500 FREE position on any coin!
Disclaimer: Information found on CryptoPotato is those of writers quoted. It does not represent the opinions of CryptoPotato on whether to buy, sell, or hold any investments. You are advised to conduct your own research before making any investment decisions. Use provided information at your own risk. See Disclaimer for more information.


- Ethereum traded around $1,921 as Bitcoin bounced from lows of $65,000.
- Analysts are bullish on ETH despite $36 million in weekly outflows from ETH investment products.
- ETH could revisit $1,500 or bounce as macro pressures ease to target $3,000.
Ethereum price is struggling to break above $2,000 as losses seen over the weekend extend into early US trading hours on Monday.
Bitcoin fell to below $65,000, ETH dropped to $1,848, and Solana pared gains to under $80.
The sell-off across crypto has accelerated in recent weeks amid negative sentiment, resulting in huge capital outflows from crypto-related investment products.
Ethereum sees further capital outflows
Downside pressure for BTC has cascaded into top altcoins, and the latest down move for ETH coincides with losses for US equity futures ahead of opening on Monday, February 23, 2026.
Risk-off sentiment has flared after an initial risk-on outlook hit markets amid the US Supreme Court’s decision on President Donald Trump’s tariffs.
The dump for top coins alludes to overall weakness, and one indicator of this trajectory is the fifth consecutive week of net outflows from digital asset investment products.
Ethereum hit over $36 million in weekly outflows last week, bringing month-to-date flows to -$117 million and year-to-date flows to over $494 million.
That marked a fifth consecutive week of outflows and coincides with ETH struggling to decisively breach the $2k level.
Analysts on ETH price outlook
ETH’s slump below $2k aligns with institutional selling and macro and geopolitical risks.
According to analysts at QCP, investors have priced in new tariff risks as well as geopolitical tensions, and ETH has shown weakness similar to BTC.
ETH has witnessed nearly $500 million in ETF outflows year-to-date, but rather than being bearish about it, analysts say outflows mirror trade unwinds and are not a “structural exit”.
“Options still show a downside bias in both $BTC and $ETH, but skew is less extreme, suggesting positioning is cleaner and panic hedging has eased. ETF outflows also appear more consistent with trade unwinds than a structural exit,” QCP posted on X.
Short-term price movement for ETH may also align with whale selling, with Ethereum co-founder Vitalik Buterin among those who have recently sold ETH.
Crypto Rover says “large ETH whales are underwater,” and previous instances have historically highlighted bottoms.
Large $ETH whales are underwater. 🐋
Last 3 times this happened it marked bottoms. pic.twitter.com/FfNZv7QuPK
— Crypto Rover (@cryptorover) February 23, 2026
Despite this, some crypto treasury companies, led by Bitmine, have doubled down on the altcoin as they weigh the “buy-the-dip” opportunity.
Whales who sold earlier, like ShapeShift founder Erik Voorhees, are also buying ETH again.
As such, there’s a possibility the coin may fail to reclaim and hold above the psychological level, risking further declines to the $1,500 level.
However, recovery for Bitcoin to above $74,000 could signal a shift in broader market sentiment. Ethereum will target $2,300-$3,000 as initial supply wall risk areas.


Several Russian-linked crypto exchanges continue to allow transactions linked to sanctioned entities, according to a report published Friday by blockchain analytics firm Elliptic.
The report outlines how certain platforms enable users to convert rubles into cryptocurrencies, transfer funds across borders outside traditional banking channels, and cash out through overseas brokers or exchanges. Elliptic said these transaction pathways can reduce reliance on the conventional financial system and complicate sanctions enforcement.
Last month, a separate Elliptic report revealed that while Tether’s USDT has become a key asset for Russia to evade Western sanctions imposed after the Ukraine invasion in 2022, transactions with the ruble-pegged stablecoin A7A5 surpassed $100 billion. Since Russia’s full-scale Ukraine invasion, Western governments imposed sanctions targeting energy, finance and strategic goods. The EU froze roughly $250 billion of Russian assets and the U.K., nearly $35 billion.
Elliptic’s report follows another one by TRM Labs last week that showed illicit entities received $141 billion in stablecoins in 2025, the highest in five years, and more than half of which was linked to the ruble-pegged A7A5 token, whose Russian executives dispute claims that their operations are illegal. Sanctions-related activity accounted for 86% of illicit crypto flows, TRM’s report said, with bad actors mostly relying on stablecoin platforms.
Among the exchanges highlighted in Elliptic’s report is Bitpapa, a UAE-registered peer-to-peer platform primarily serving Russian users. The U.S. Treasury’s Office of Foreign Assets Control (OFAC) sanctioned Bitpapa in March 2024.
Elliptic estimated that roughly 9.7% of the exchange’s outgoing crypto flows were sent to sanctioned entities, including about 5% to the Russia-linked exchange Garantex. The firm also alleges that Bitpapa rotates wallet addresses in a manner designed to hinder transaction tracing.
The report also named ABCeX, which operates from Moscow’s Federation Tower, and said it has processed at least $11 billion in crypto transactions, including flows to sanctioned exchanges such as Garantex and Aifory Pro.
Other exchanges cited include Rapira, which Elliptic says processed more than $72 million in transactions with sanctioned exchange Grinex, and Aifory Pro, a service offering cash-to-crypto transactions in Moscow, Dubai and Türkiye.
The findings highlight the ongoing role of crypto infrastructure in cross-border financial activity linked to sanctioned actors, even as regulators increase scrutiny of the sector.

BitMine stock price remains in a tight range this week, even as Ethereum dropped to a multi-week low of $1,880.
Summary
- BitMine stock has formed a large falling wedge pattern on the three-day chart.
- It continued to accumulate ETH as it moved towards owning 5%.
- Data shows that the short interest has jumped to 6%.
The BMNR stock was trading at the key support level at $20, down by almost 90% from its highest level in July last year.
BitMine stock has wavered as the company has continued accumulating Ethereum (ETH). Data shows that the company has bought over 168,000 Ethereum tokens in the last 30 days, bringing the cumulative total to 4.7 million, which are currently worth over $8.3 billion.
The company’s goal is to ultimately own 5% of ETH coins and generate a monthly return through staking. Data compiled by StakingRewards shows that the average staking return on Ethereum is about 2.9%, meaning that the company will be generating over $350 million in annual staking revenue.
BitMine also holds over $600 million in cash, which it has invested in short-term government bonds, which earn over 4%.
At the same time, Tom Lee has invested in other companies, including Beast Industries, the company owned by Mr. Beast. It offers numerous products, including chocolate bars and financial services. It recently acquired Step, a company that provides financial literacy solutions to young people.
BitMine has access to more money to make investments as its shareholders recently increased its authorized shares to 50 billion. This means that it may issue additional shares to make these investments.
This performance, together with Ethereum’s track record of bouncing back, explains why top institutional investors have continued buying the stock. Some of the top holders of the BMNR stock are companies like Morgan Stanley, ARK Investment, BlackRock, Citadel, and Goldman Sachs.
The main risk facing the BMNR stock price is the ongoing Ethereum price crash and the rising short interest. Short interest jumped to 6%, meaning that many investors anticipate it to keep falling.
BitMine stock price technical analysis
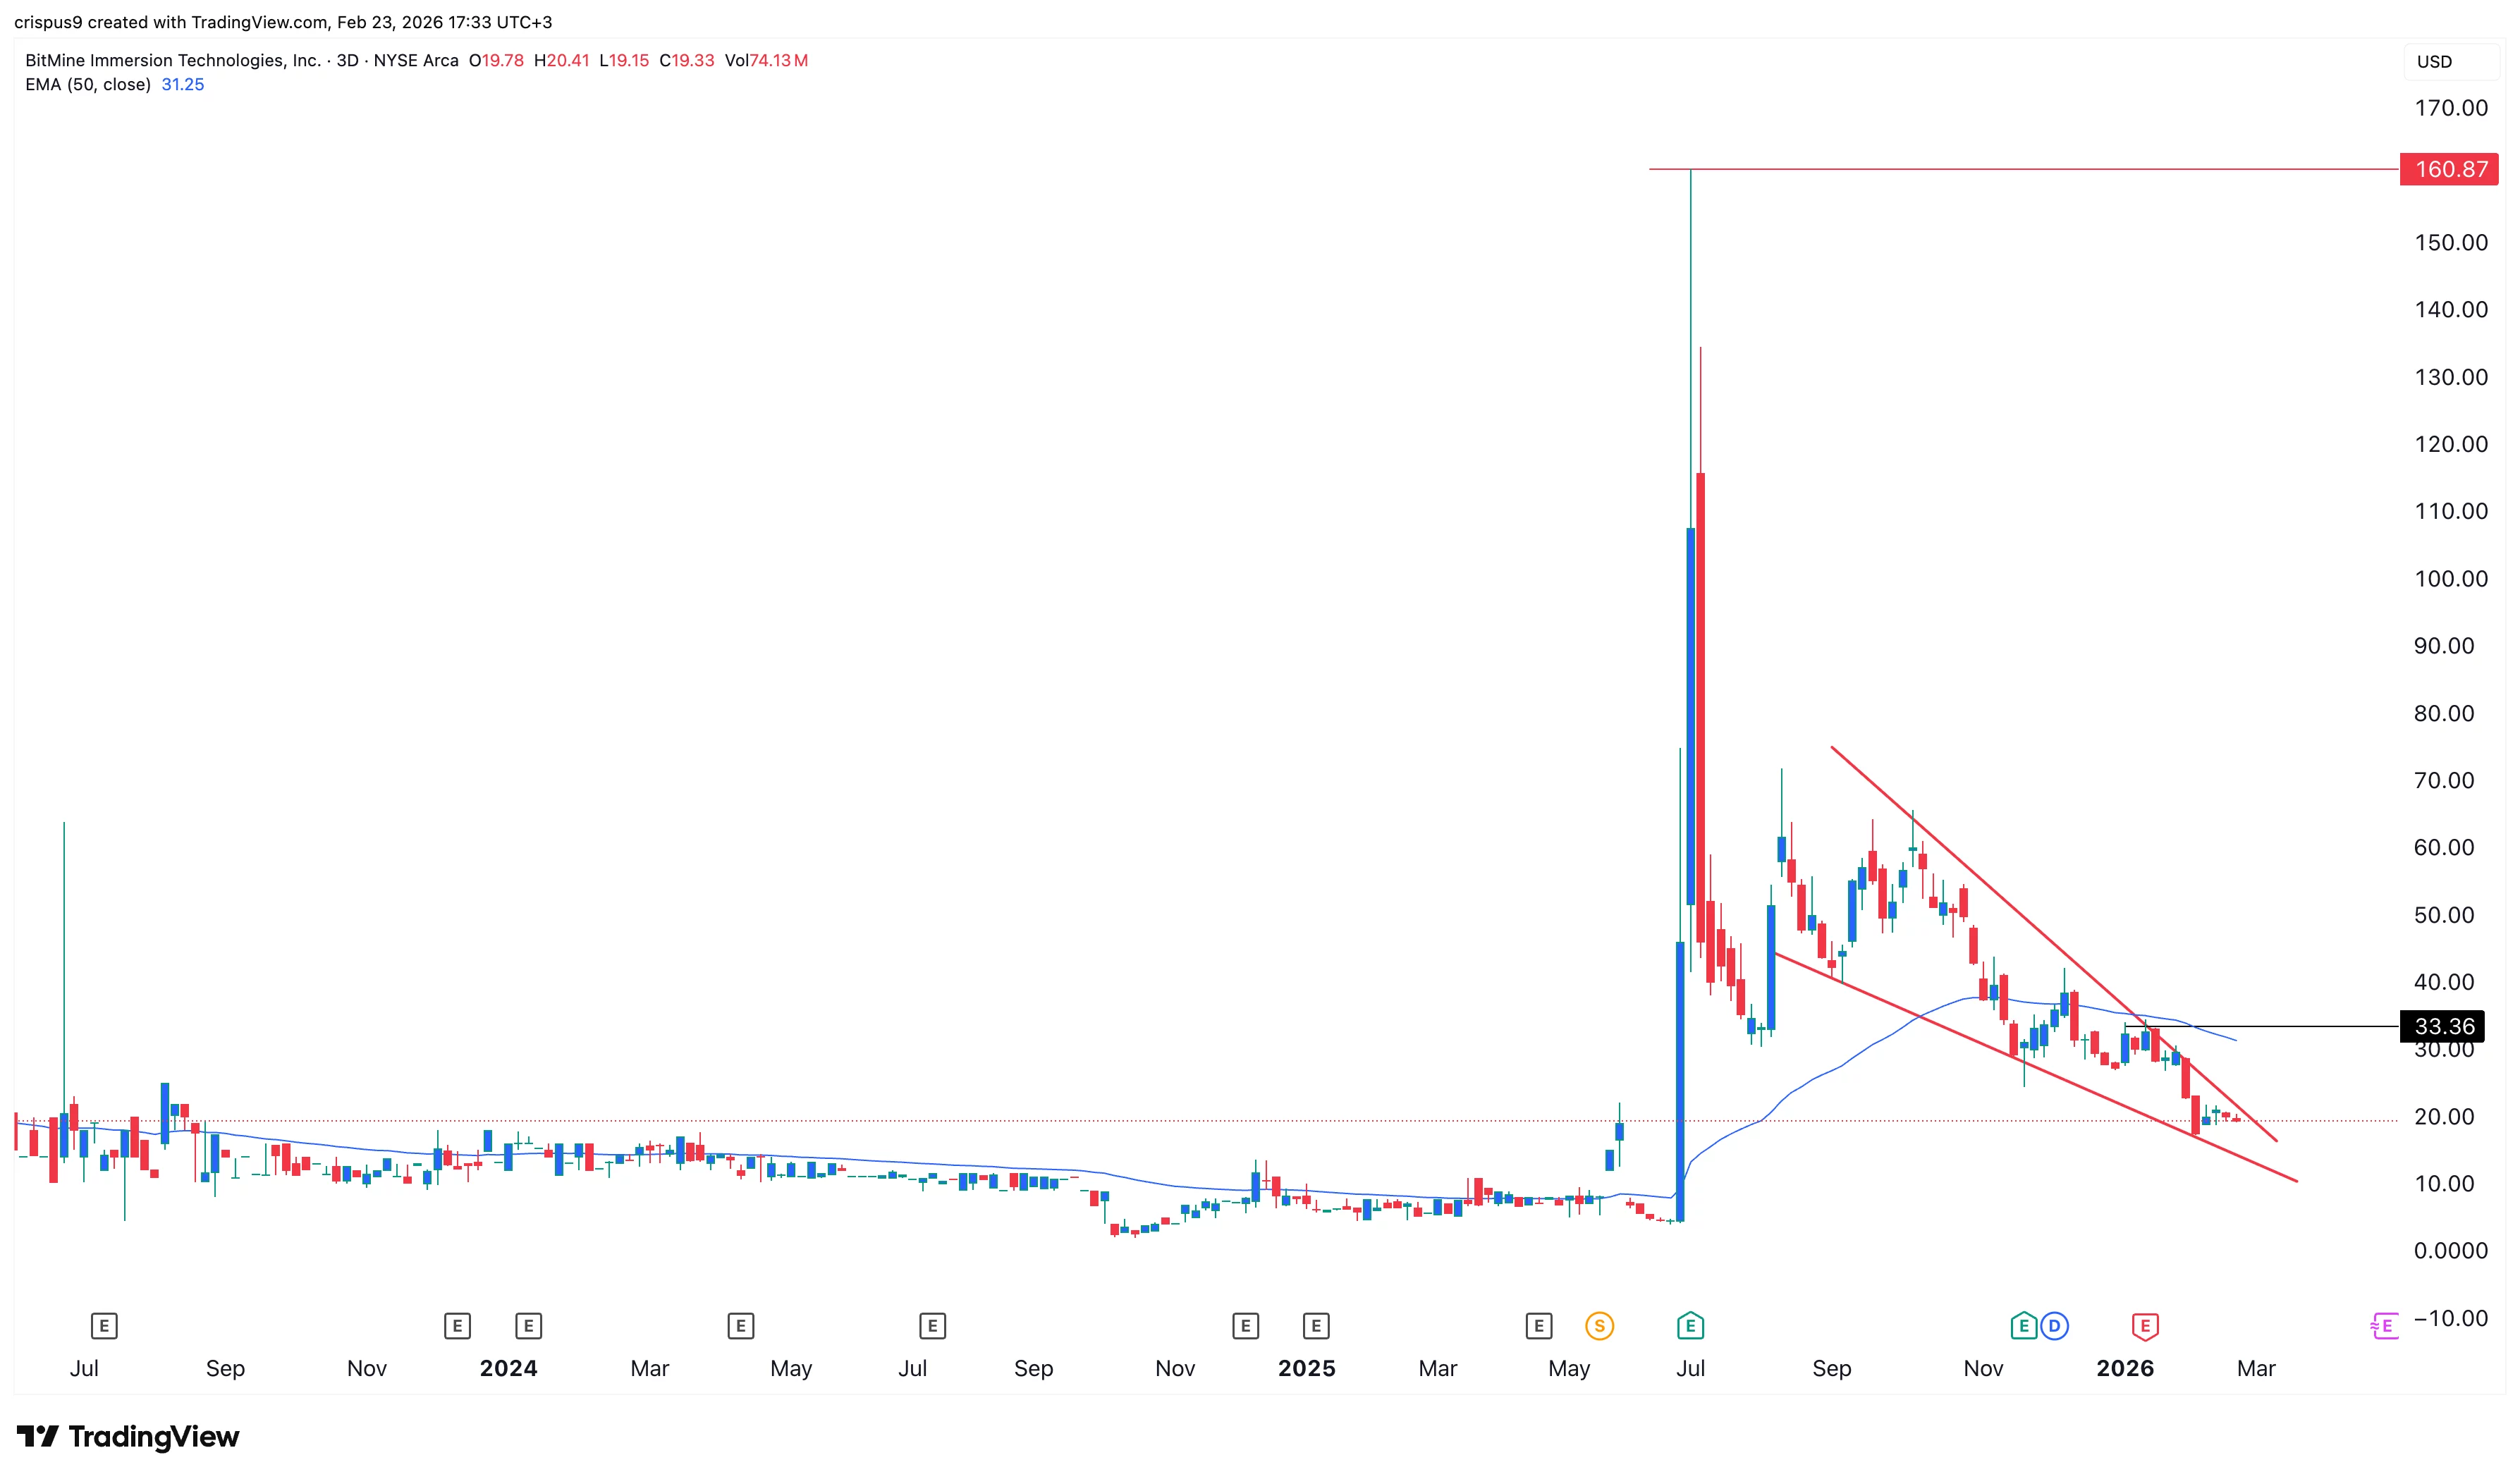
The daily chart shows that the BMNR stock price has slumped in the past few months. This retreat has pushed it to move below all moving averages, a sign that bears have prevailed.
A closer look shows that the stock has formed a giant falling wedge pattern. This pattern is made up of two descending and converging trendlines. A bullish breakout normally happens when the two lines are about to converge.
Therefore, the most likely BitMine stock price forecast is bullish, with the initial target being at $35, its highest level in January this year.

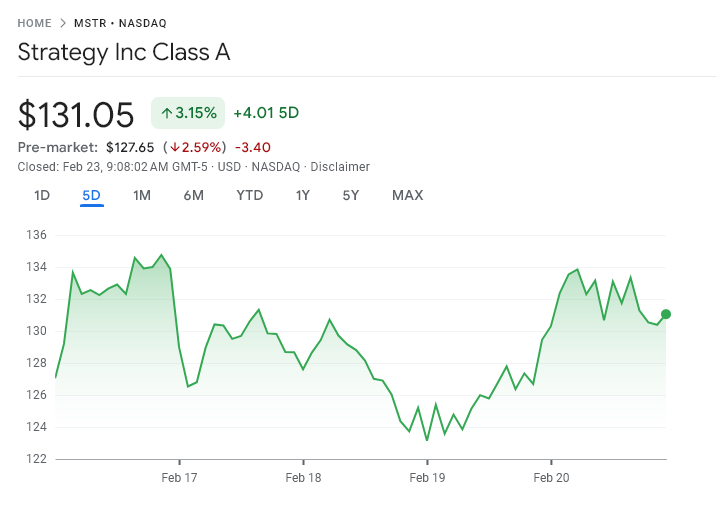
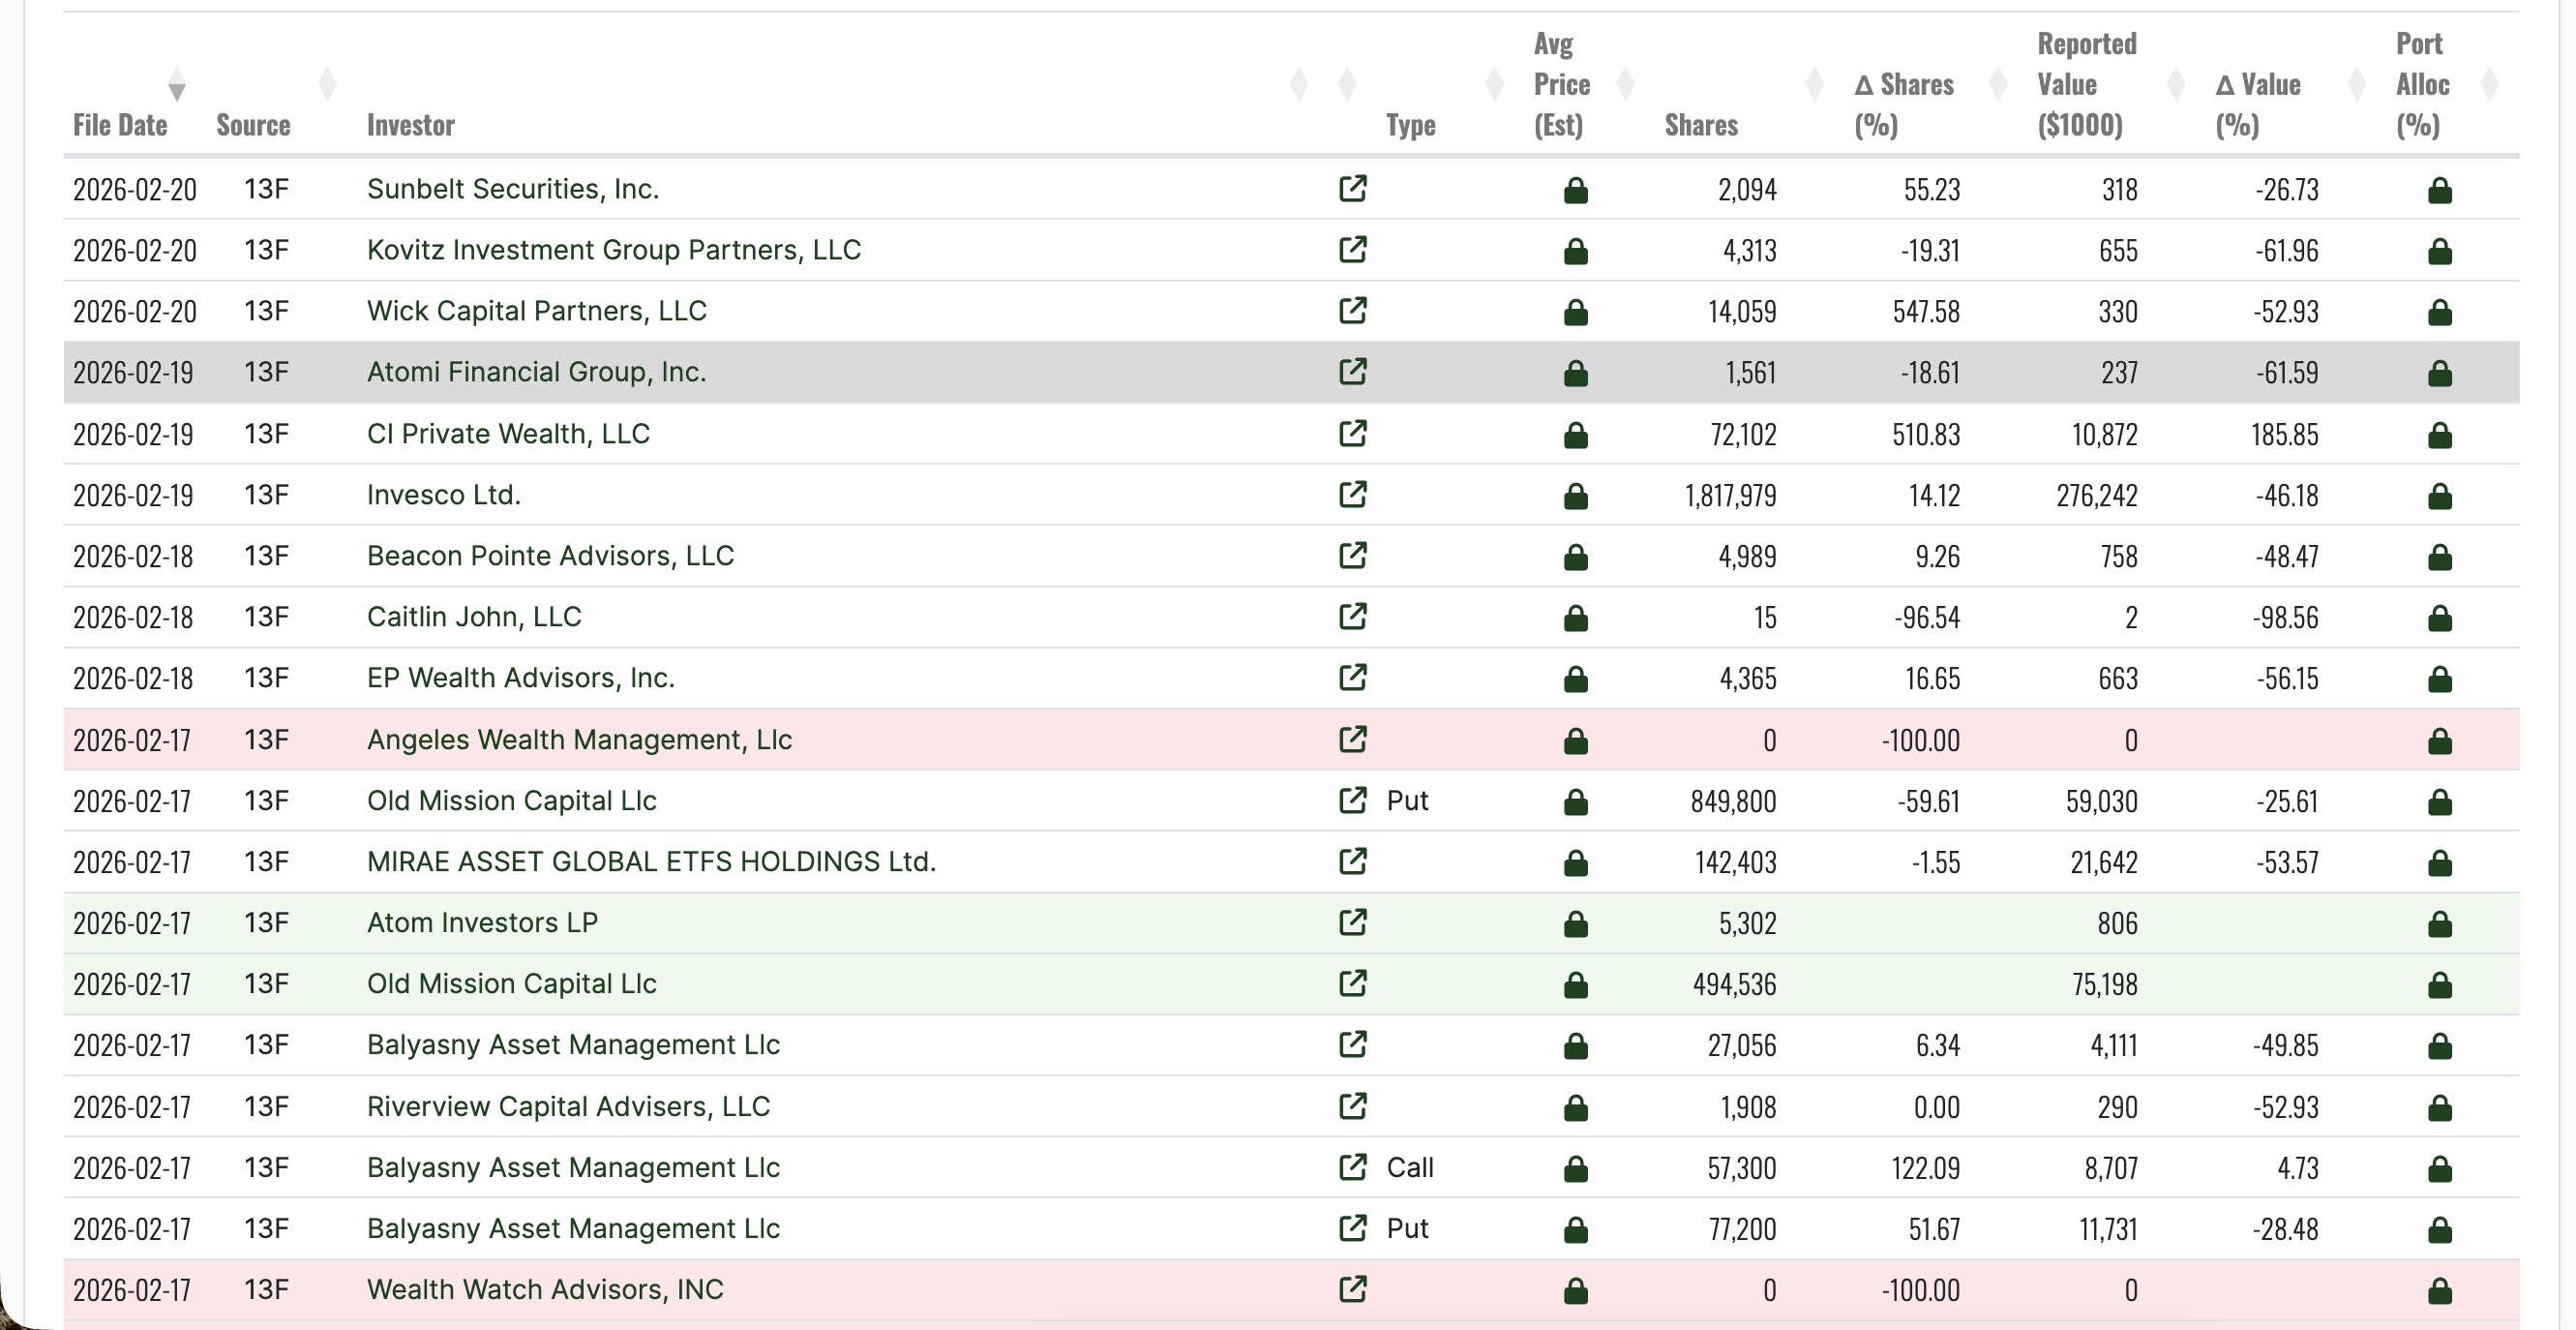
The MicroStrategy stock price has staged a notable rebound in recent weeks, but that recovery may now be facing its biggest test. With markets set to reopen for the last week of February, the stock remains highly sensitive to both Bitcoin’s weakness and shifting investor sentiment.
MSTR is currently trading near $131 after rebounding nearly 30% from its February 5 low. Despite this bounce, the stock is still down about 19% over the past month and more than 60% over the past three months.
This weak recovery now faces mounting pressure from 100% institutional exit disclosures, weakening momentum, and key technical resistance.
Institutional Selling Raises New Questions About MicroStrategy Recovery
The biggest warning sign for MicroStrategy stock price is coming from institutional investors themselves, who have recently revealed their positioning from the last quarter.
Recent 13F filings (lagging disclosures) reveal a clear pattern of mid-sized investors reducing or fully exiting Strategy positions.
Angeles Wealth Management and Wealth Watch Advisors both exited completely, cutting their holdings by 100%. Caitlin John LLC reduced its position by 96.54%, leaving only a negligible stake.
Want more insights like this? Sign up for Editor Harsh Notariya’s Daily Crypto Newsletter here.
Other major investors followed similar paths. Kovitz Investment Group cut its share count by 19.31%, while the value of its holdings fell nearly 62%.
Atomi Financial Group also reduced its exposure by 18.61%, with its position value dropping more than 61%. Even firms that maintained positions suffered heavy losses. Invesco increased its holdings by 14.12%, but the total value of its investment still fell by over 46%.
Such exits often signal declining confidence, especially when the news breaks during rebounds.
At the same time, MSTR’s technical structure is showing a hidden bearish divergence. Between November 18 and February 20, the stock formed a lower high, while the Relative Strength Index (RSI) formed a higher high.
RSI is a momentum indicator that measures the strength of price movements.
Because this divergence is appearing within a broader downtrend, it suggests the recent rebound may be losing strength.
This signal would strengthen if the stock fails to break above key resistance near $135.
These filings reveal positioning during the recent decline (reported in the previous quarter), highlighting weakening institutional conviction.
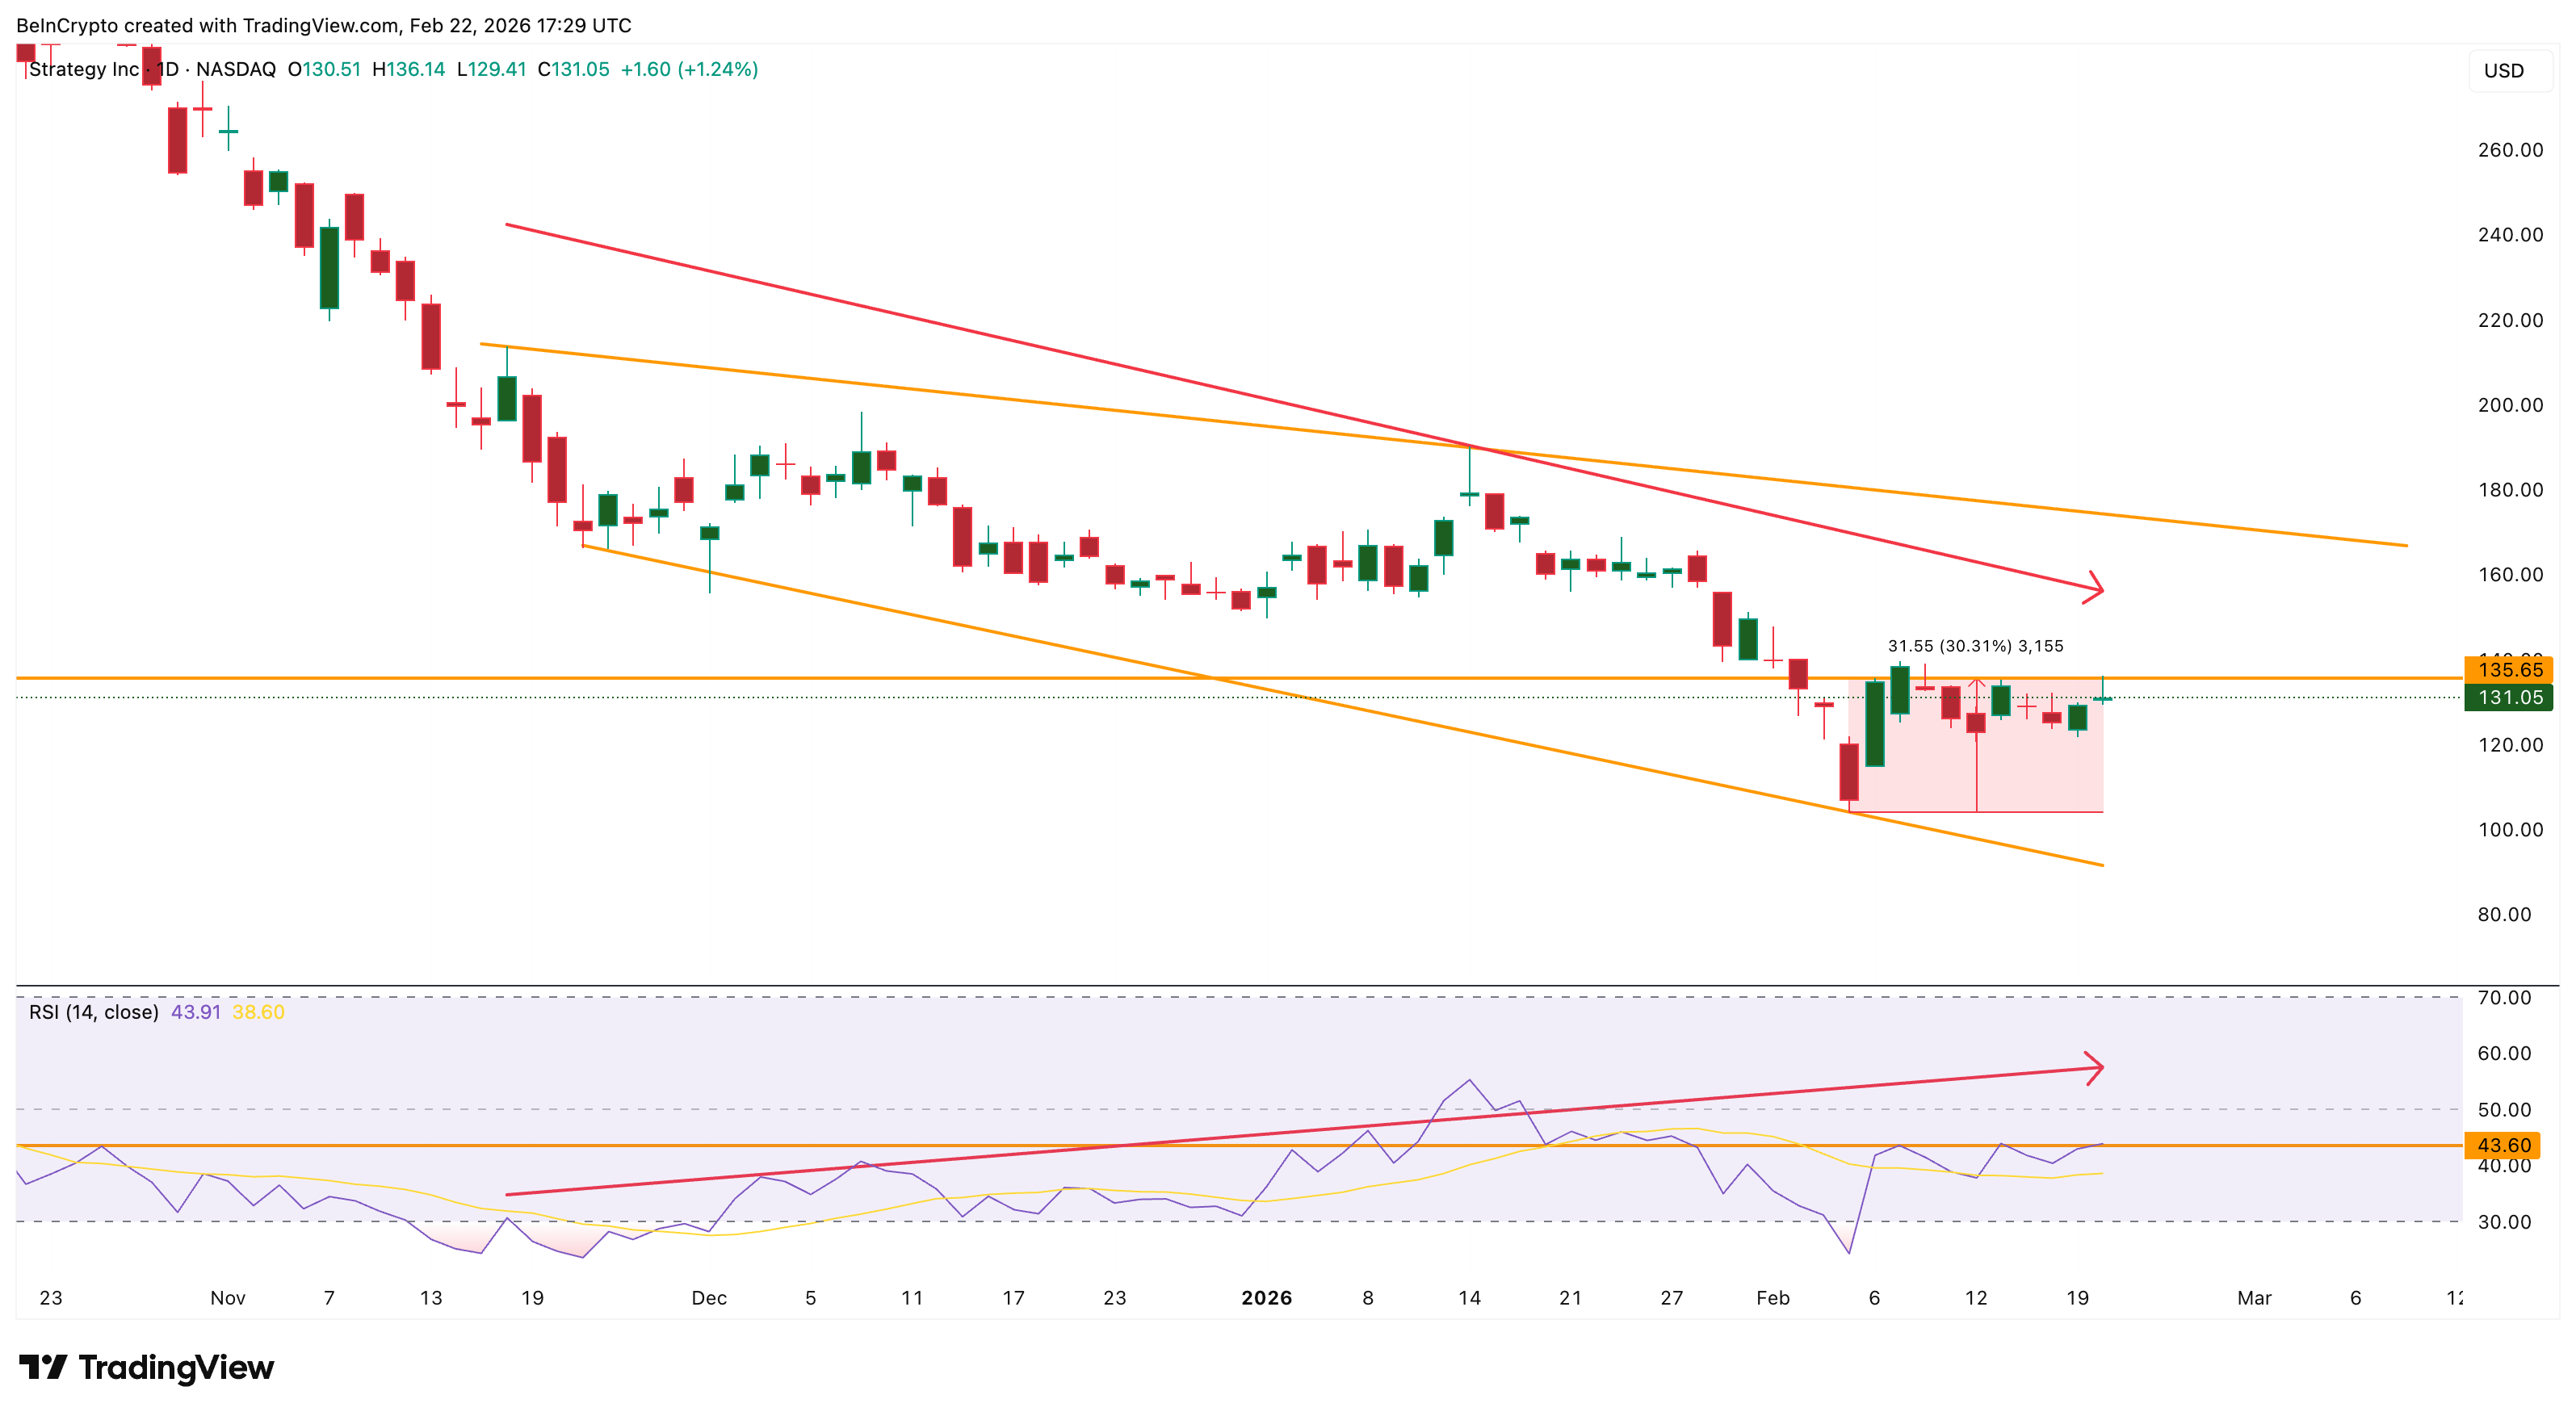
Declining Volume Suggests Weak Conviction Behind the Recovery
Technical volume indicators suggest that remaining support may not be strong.
One key metric is On-Balance Volume (OBV), which tracks cumulative buying and selling pressure. Since February 9, the MicroStrategy stock price has moved mostly sideways, but OBV has fallen much more sharply.
This shows that selling volume has been stronger than buying volume during the recovery.
When OBV declines faster than price, it usually signals weakening conviction among investors, possibly retail. This suggests that fewer participants are willing to accumulate the MSTR stock at current levels.
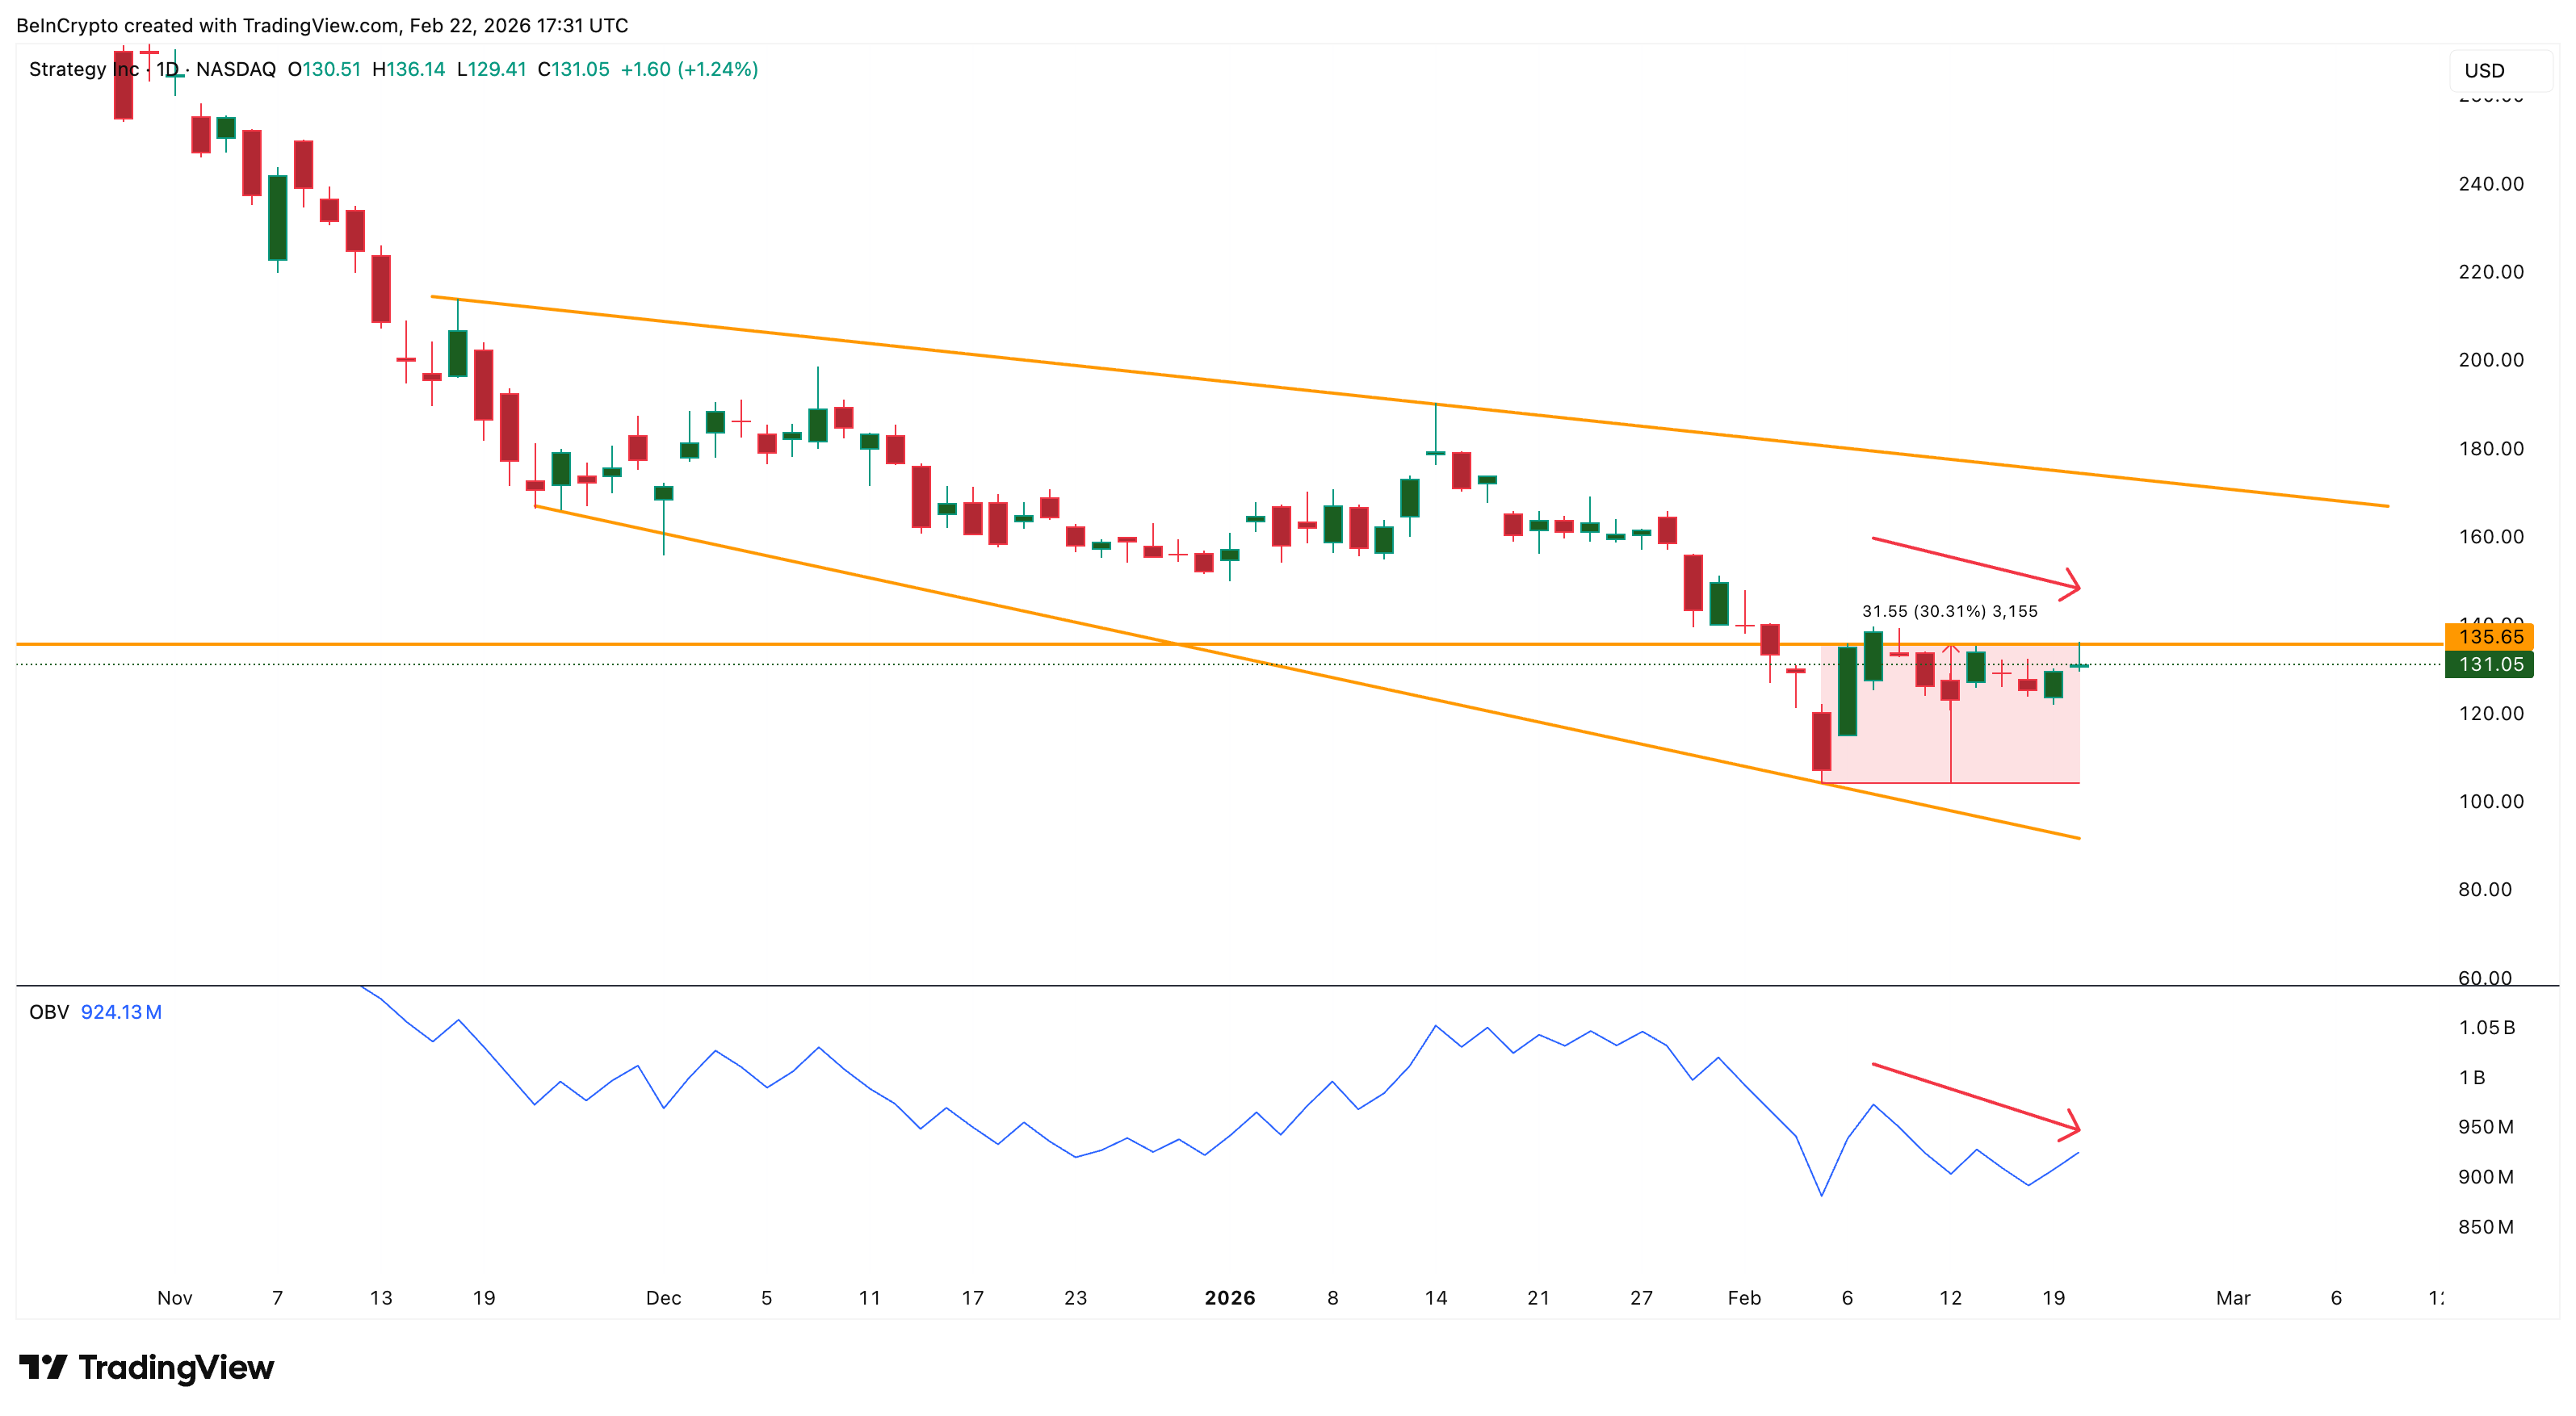
However, not all signals are negative. The Money Flow Index (MFI), which measures capital inflows and dip-buying activity, shows limited strength.
Between February 5 and February 19, MFI formed a slightly higher high even as the price struggled to continue rising.
MFI tracks buying and selling pressure using both price and volume. When MFI rises while price stalls, it shows that some investors are still buying dips. This dip buying may explain why MicroStrategy’s stock price has held above recent lows despite institutional exits and weak volume. This also explains 3% green tick over the past 5 days.
But dip buying alone rarely sustains long-term rallies. Without stronger participation from large investors, price recoveries often struggle to continue. This brings the focus to the most important factor now: key MSTR stock price levels.
Key Price Levels Could Decide MSRT’s Next Major Move
The MicroStrategy stock price is currently trading inside a falling broadening wedge pattern that has been forming since November. This structure reflects ongoing volatility and uncertainty.
For the recovery to continue, MicroStrategy must first break above $139. This level is especially important because it aligns with the 20-day Exponential Moving Average (EMA), a trend indicator that tracks short-term price direction while giving more weight to recent price changes. The last time MicroStrategy reclaimed this level in January, the stock rallied nearly 15% shortly after.
If MSTR breaks above $139, it could gain strength for a move toward $163.
However, downside risks remain significantly stronger. If the MicroStrategy stock price falls below $119, the current structure would weaken considerably. A deeper drop below $106 could open the path toward $96 and potentially $86.
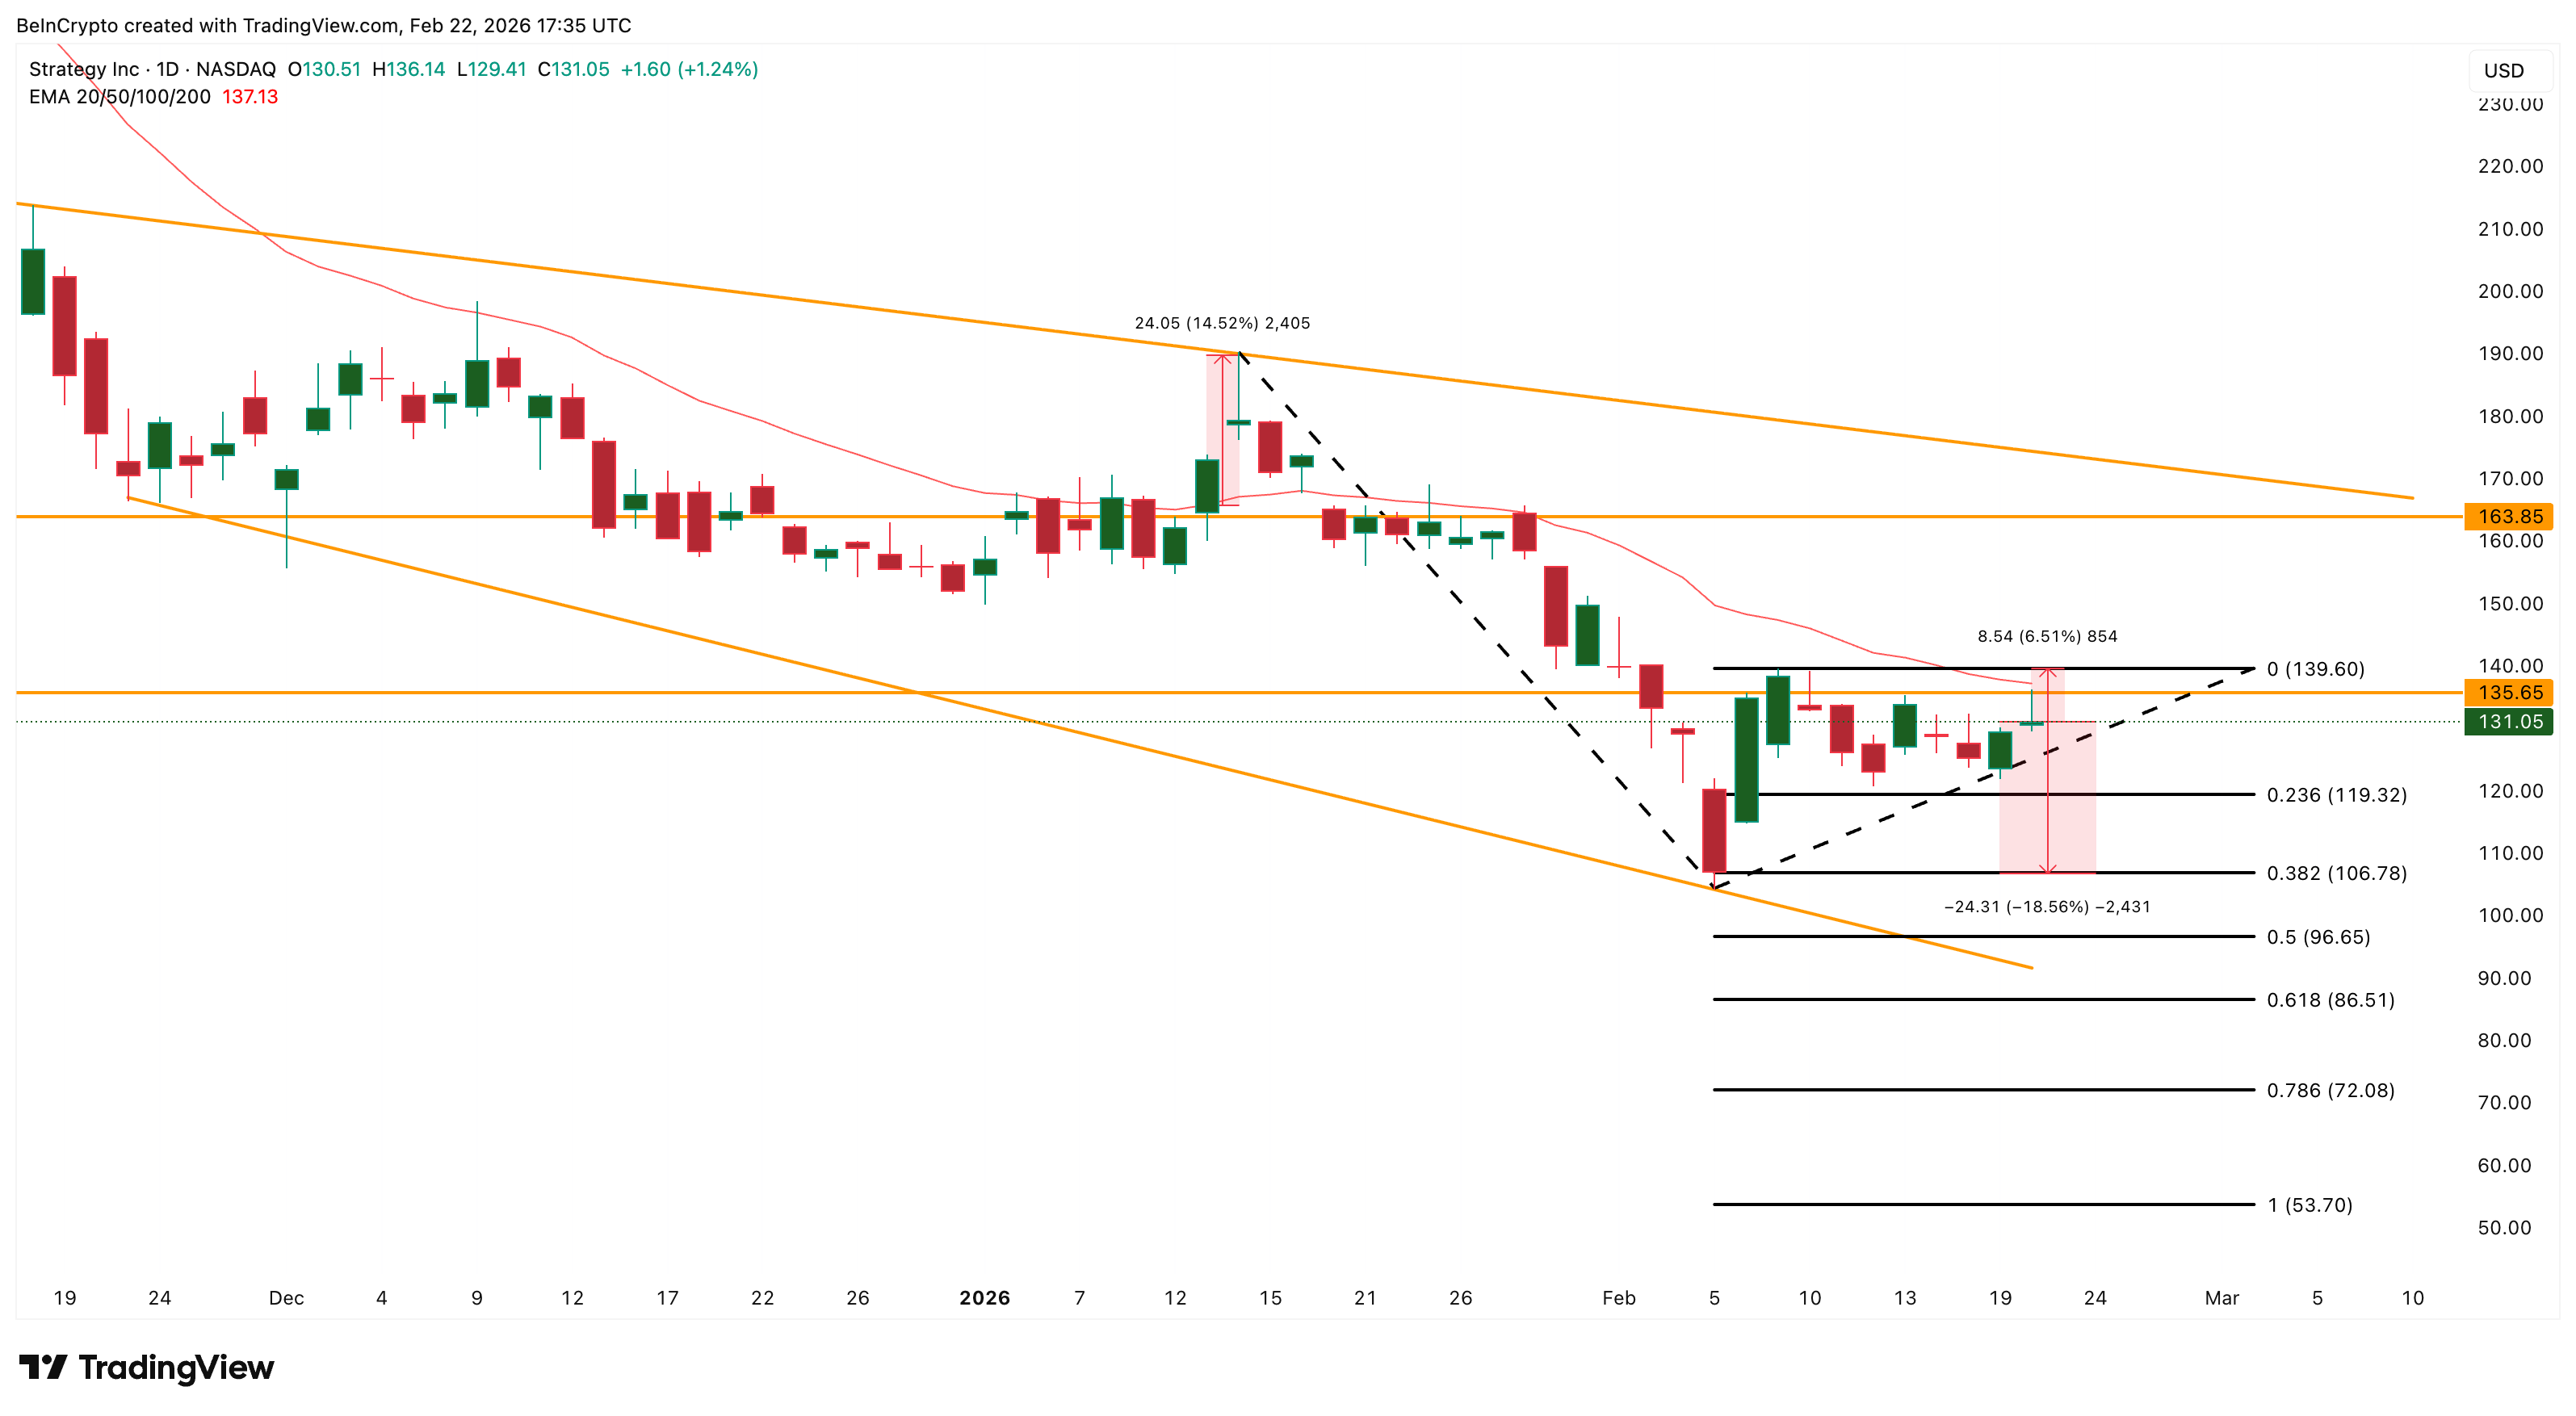
This would represent a decline of nearly 20% from current levels. MicroStrategy’s close relationship with Bitcoin makes this risk even more important.
The company currently holds over 717,000 BTC, meaning its valuation remains highly sensitive to Bitcoin price movements, which itself looks weak.
With institutional investor exits surfacing, volume weakening, and resistance overhead, the MicroStrategy stock price now faces a decisive moment. As markets reopen Monday, the next move could determine whether the recent 30% rebound holds or begins to reverse.
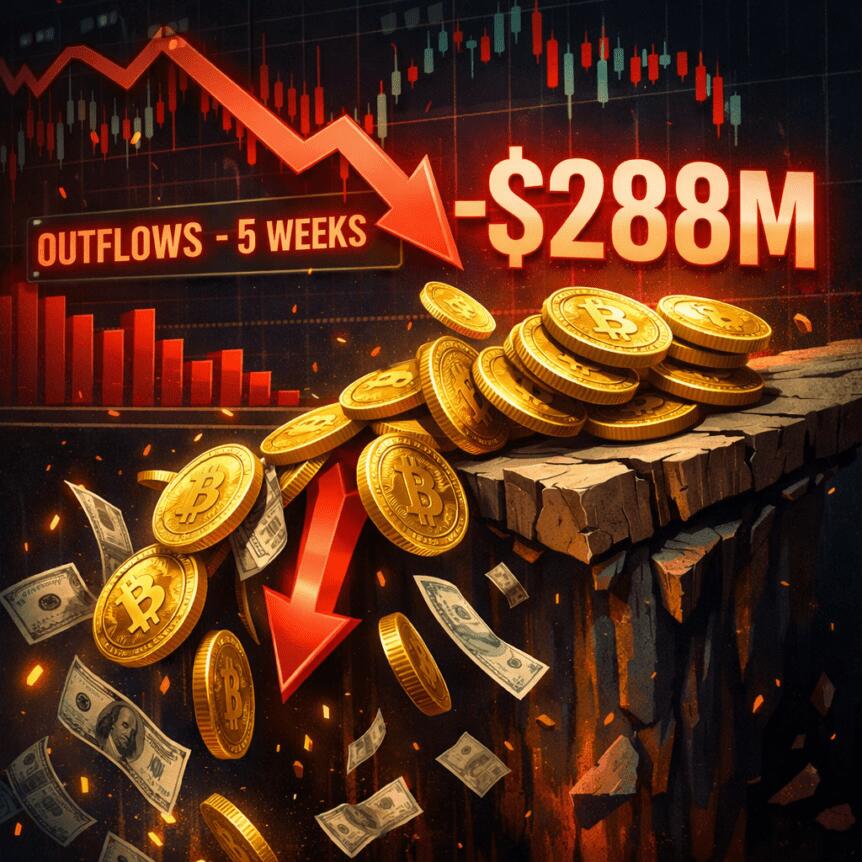
Crypto investment products continued to retreat last week, with outflows totaling $288 million, extending a five-week run of withdrawals that ranks as the longest streak since US spot Bitcoin ETFs began trading in 2024. The latest figure pushes year-to-date redemptions toward the $4 billion mark, although total outflows remain below the $6 billion pulled during the same period a year earlier. Across the broader crypto ETP landscape, trading activity cooled to $17 billion for the week—the quietest pace since mid-2025—underscoring subdued investor appetite amid lingering risk sentiment and regulatory headlines. Bitcoin led the exodus, while bearish bets persisted in short-BTC products. CoinShares also announced a price cut for Europe’s largest physically backed Bitcoin ETP, a move designed to enhance competitiveness, as detailed in the firm’s report and accompanying filing.
Key takeaways
- Last week’s crypto ETP outflows totaled $288 million, extending a five-week streak and lifting year-to-date withdrawals toward $4 billion.
- Bitcoin funds accounted for the lion’s share, with about $215 million pulled, while short-BITCOIN products drew inflows of $5.5 million—the strongest inflow among crypto assets.
- Ether funds declined by approximately $36.5 million, contributing to year-to-date losses near half a billion dollars; XRP and Solana saw modest inflows of around $3.5 million and $3.3 million.
- CoinShares reduced the management fee on the flagship BITC ETF to 0.15% effective immediately, a deliberate move to improve competitiveness for Europe’s largest physically backed Bitcoin ETP.
- US spot Bitcoin ETFs showed signs of renewed activity on a Friday, with volumes rising to about $3.7 billion, even as the week still closed in the red with roughly $316 million in net outflows.
Tickers mentioned: $BTC, $ETH, $XRP, $SOL, $BITC
Sentiment: Bearish
Market context: The ongoing withdrawal cycle in crypto ETPs appears to reflect cautious risk sentiment and selective participation around ETF products, even as some structural improvements—such as lower fees—seek to restore competitiveness. The broader environment includes macro headwinds and evolving regulatory scrutiny that influence investor appetite for crypto-linked products and the speed at which new products attract inflows.
Why it matters
The persistence of outflows in crypto investment products matters because it signals a cautious stance among professional and retail investors toward crypto-linked vehicles, despite constructive developments in the market, such as the introduction of lower-cost products. The outflows are not isolated to one asset class; they span Bitcoin ETPs, Ethereum funds, and smaller-cap crypto listings, illustrating a broad risk-off mood rather than a targeted bet against a single token.
Bitcoin remains the central driver of fund flows. With about $215 million leaving Bitcoin ETPs last week, the asset’s price dynamics continue to influence the mood of the broader ETP segment. Conversely, traders seeking to hedge or express bearish views with limited downside exposure pulled into short-BTC products, which attracted the largest inflow in the crypto-ETP space at $5.5 million. This pattern underscores the persistence of a bear tilt in certain pockets of the market, even as some participants diversify into other assets such as XRP and Solana, which posted modest inflows.
From a product perspective, CoinShares’ move to cut the BITC management fee to 0.15%—a permanent adjustment rather than a promotional incentive—highlights an ongoing alignment between pricing and accessibility. The objective is to attract more long-term holders to Europe’s leading physically backed Bitcoin ETP, potentially stabilizing flows if inflows follow the fee reduction. This is notable because BITC launched in January 2021 with a base fee of 0.98%, so the new rate represents a meaningful re-pricing in a segment that has faced stiff competition and fee pressure.
On the ETF front, spot Bitcoin ETF activity in the United States showed a surprising uptick on what was otherwise a downbeat week. SoSoValue data indicated daily volumes rising to about $3.7 billion, marking a notable shift after several weeks of thinning liquidity. While the week still closed with red ink—$315.9 million in net outflows—the move hints at renewed interest that could foreshadow a more active period if macro conditions remain supportive and if ETF providers continue to refine product features and liquidity channels.
The year-to-date picture remains challenging for Bitcoin ETPs, with net outflows around $1.3 billion in BTC ETPs alone, reflecting the broader struggle to sustain momentum in a market characterized by episodic volatility and regulatory crosswinds. The performance of Ether and other major assets further illustrates that traders are weighing different risk-return profiles, with ETH showing material outflows and XRP/SOL posting smaller inflows as market participants reallocate capital across a wider array of tokens and related products.
In a note accompanying the earnings move, CoinShares’ chief executive Jean-Marie Mognetti framed the pricing shift as a signal of structural change rather than a temporary promotion. The firm’s decision to reduce the BITC fee to 0.15% is intended to reflect an ongoing commitment to accessible pricing, ensuring that investment products remain competitive as demand evolves. Such moves can influence sentiments among institutional and sophisticated retail buyers who closely monitor fee levels when assessing exposure to crypto assets through ETPs.
What to watch next
- Monitor CoinShares’ next weekly flow update for any reversal or continuation of the outflow trend, including asset-specific moves in BTC, ETH, XRP, and SOL.
- Track whether BITC’s lower management fee translates into meaningful inflows in the coming weeks and whether similar pricing adjustments spread to other Europe-based crypto ETPs.
- Watch US spot Bitcoin ETF volumes in the next trading sessions, as a fresh wave of demand could alter the week-to-week flow balance.
- Observe whether BTC ETPs maintain their year-to-date outflow pace or show signs of stabilization amid price movements and investor sentiment shifts.
Sources & verification
- CoinShares weekly report (Volume 274) detailing digital asset fund flows and asset-level movements.
- CoinShares press release announcing the 0.15% management fee on BITC, Europe’s largest physically backed Bitcoin ETP.
- SoSoValue data on US spot Bitcoin ETF daily volumes and weekly flow dynamics.
- Cointelegraph coverage of spot Bitcoin ETF activity and the broader fund-flow landscape, including references to five weeks of net outflows.
Crypto flows, fee changes, and the evolving ETF landscape
Last week’s market activity underscored a cautious but evolving ETF environment. Bitcoin (CRYPTO: BTC) funds led the charge in outflows, underscoring the sensitivity of BTC-linked products to shifting risk appetite. Investment vehicles covering Ethereum (CRYPTO: ETH) also posted declines, while XRP (CRYPTO: XRP) and Solana (CRYPTO: SOL) saw smaller, more mixed moves that suggest a rebalancing among investors seeking diversified exposure. The divergence between BTC and altcoin flows, particularly with Bitcoin ETPs contributing substantially to the overall negative tone, highlights how the crypto-asset landscape remains tethered to macro and regulatory cues as much as to token-specific developments. The industry continues to test pricing dynamics and liquidity provisioning, with BITC (EXCHANGE: BITC) now operating at a reduced fee that could reshape competitive dynamics across European-listed crypto products.
On the volume front, Friday’s data from US spot Bitcoin ETFs showed resilience after a stretch of subdued activity, with daily volumes hitting the $3.7 billion mark. While the week finished with a net outflow, the uptick in volumes points to a potential reawakening of interest in physically backed exposures, particularly as investors reassess risk and reward amid volatility in price action and policy signals. The tweet- and data-backed signals surrounding ETF volumes are relevant for traders watching liquidity conditions, as increased activity can improve execution quality and narrow bid-ask spreads for large trades.
From a product design perspective, the BITC fee reduction is a meaningful, real-world adjustment. Lower fees can improve net returns for long-term holders and may help attract new participants who previously found European crypto ETPs comparatively expensive. The price cut—announced by CoinShares and described in public filings—reflects a broader industry trend toward more competitive cost structures as firms chase incremental inflows in a crowded European and global marketplace. While fee reductions do not guarantee immediate inflows, they set a framework in which investors may re-evaluate exposure levels and allocation across a spectrum of assets, including Bitcoin, Ether, XRP, and Solana, as observed in the latest weekly flows.
In sum, the current footpath for crypto ETPs remains mixed: persistent outflows in Bitcoin-focused products contrast with selective inflows in some altcoin-linked funds, while structural changes such as BITC’s fee cut add a new variable to consider for future allocations. The next few weeks will be telling as ETF providers—alongside market participants—assess whether price dynamics, regulatory updates, and ongoing product improvements translate into a more stable or even improving flow environment.

BitMine Immersion Technologies (BMNR) purchased 51,162 ether (ETH) last week, or roughly $98 million at current prices.
The latest purchase lifted the firm’s total holdings over 4.42 million tokens as of February 22, cornering 3.66% of the token’s total supply, the company said in its latest Monday update. It also holds 193 bitcoin, 691 million in cash, and equity stakes, including a $200 million investment in Beast Industries and a smaller investment in Eightco Holdings.
The company said it is generating $171 million in annualized revenue via staking over 3 million of its ETH holdings.
BMNR is down 2% in pre-market trading and lower by about 60% over the past six months.
With the price of ETH continuing to fall — down another 3% over the past 24 hours to $1,918 — the firm’s losses on its $16.4 billion in purchases now exceed $8 billion, according to DropsTab.
“In the midst of this ‘mini crypto winter,’ our focus continues to be on methodically executing our treasury strategy and steadily acquiring ETH and in turn, optimizing the yield on our ETH holdings,” BitMine chairman Thomas Lee said.
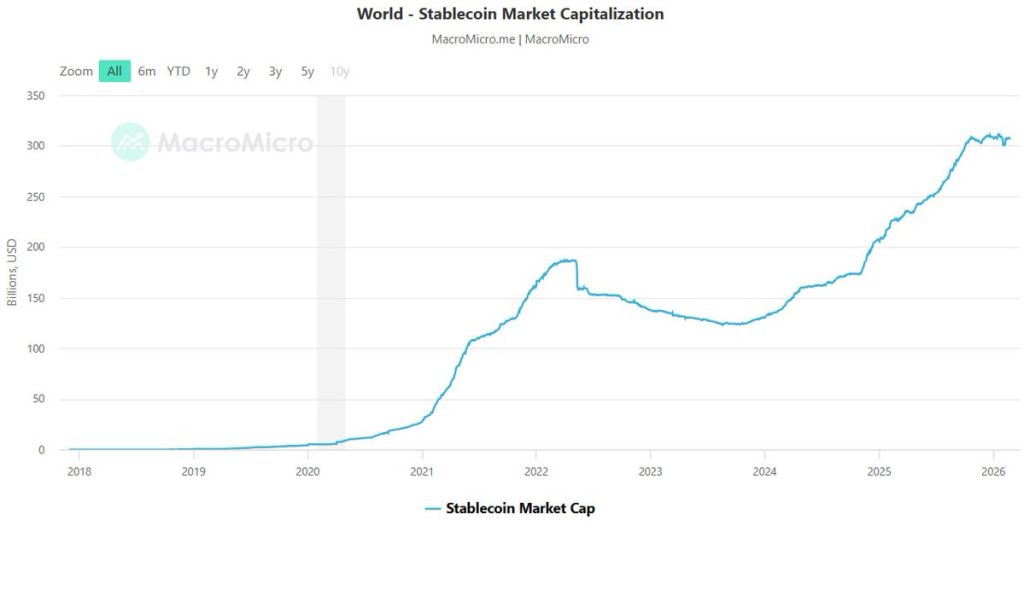
Crypto Stablecoins might be about to rewrite part of the US debt story. New research from Standard Chartered says the sector could drive up to $1T in fresh demand for US Treasury bills by 2028.
As stablecoin issuers grow, they are expected to become major buyers of government debt, turning digital dollars into a serious force in traditional finance.
Key Takeaways
- $2 Trillion Trajectory: Analysts project the total stablecoin market capitalization will surge to $2 trillion by the end of 2028, up from roughly $300 billion today.
- Treasury Scarcity: Issuers are expected to absorb approximately $1 trillion in short-term T-bills, creating a potential supply shortfall without Treasury adjustments.
- Regulatory Drivers: The GENIUS Act framework mandates high-quality liquid assets for reserves, forcing issuers to concentrate holdings in the 0-3 month debt sector.
Why Are Stablecoins Becoming a Financing Powerhouse?
Stablecoins are no longer just trading tools. They are turning into steady buyers of US government debt. After the GENIUS Act passed in July 2025, regulated issuers are required to hold reserves in high quality liquid assets, mainly short dated Treasuries.
Supply is sitting near $300B today. Standard Chartered sees the recent slowdown as temporary and expects strong growth ahead, especially from emerging markets.

As people in high inflation countries move into dollar stablecoins, the backing reserves flow straight into US debt. Crypto demand supports Treasury markets in the background.
Breaking Down the $1 Trillion Projection
Standard Chartered analysts Geoffrey Kendrick and John Davies broke down the mechanics.
They expect stablecoins to grow toward a $2T market cap by 2028. That expansion alone could create $0.8T to $1T in new demand for short dated Treasury bills, mainly at the front end of the yield curve.
In simple terms, stablecoin issuers may become some of the biggest buyers of T-bills. If issuance patterns stay the same, the report suggests around $0.9T in excess demand over the next three years.
About two thirds of that growth is projected to come from emerging markets. And most of it would be net new demand, not just a reshuffling of existing Treasury allocations.
That is a serious structural bid forming under US debt.
Implications for U.S. Debt Issuance
The scale is big enough that the US Treasury cannot ignore it.
If issuance does not adjust, short dated T bills could become tight. Treasury Secretary Scott Bessent has already hinted that stablecoins may become an important part of financing the US government.
It creates a two way benefit. The dollar strengthens its role in digital markets, and the government gains a steady buyer for its debt.
But tighter integration means tighter oversight. As new stablecoin rules advance, coordination between private issuers and public debt management will only grow.
Innovation is happening around different collateral models, yet Treasuries still sit at the center for regulatory approval.
Discover: Here are the crypto likely to explode!
The post Could Stablecoins Fix U.S Debt? Standard Chartered Sees $1T in Treasury Demand appeared first on Cryptonews.


The global momentum behind RWA tokenization has shifted from theoretical pilots to institutional-grade execution. As capital markets seek greater efficiency, transparency, and global reach, Brazil has emerged as a primary laboratory for this transformation.
This shift is driven by a unique combination of progressive regulation, a tech-savvy financial sector, and the search for lower operational costs. At the heart of this movement is the XDC Network, providing the neutral, public infrastructure necessary to bridge the gap between local debt markets and global liquidity.
The Dawn of the RWA Era in Latin America
Tokenization is no longer a buzzword for the distant future; it is a live, operational reality in Brazil. While many jurisdictions are still debating the legal frameworks for digital assets, Brazil’s Central Bank and Securities Commission (CVM) have fostered an environment where innovation can thrive.
The tokenization of fixed income instruments, specifically debentures, represents a significant step forward. By digitizing these traditional assets, issuers can offer enhanced traceability and a higher degree of transparency, which are essential for attracting international institutional capital.
The XDC Network has positioned itself as the one of the leaders in this evolution. Unlike early blockchain experiments that focused on speculative assets, XDC was designed with international trade and finance in mind. Its ability to handle frequent transactions with minimal fees makes it the ideal candidate for scaling RWA projects that require high performance and reliability.
USD One Billion Roadmap in Sight
VERT Capital, a leader in the Brazilian structured finance space, has recently announced the successful tokenization of two major Brazilian debentures on the XDC Network. This announcement marks a significant milestone not just for the companies involved but for the entire blockchain ecosystem.
This move effectively bridges the gap between different sectors of the economy, starting with Mottu, a growth leader in Latin American urban mobility and last-mile logistics. As a fast-moving, data-driven representative of Brazil’s new economy, Mottu has already tokenized approximately USD 60 million, with a total target of USD 93 million.
Complementing this innovation is the involvement of Banco Pine, a powerhouse in corporate and structured credit with a deep history of serving mid-market and large corporate clients. With their current tokenized volume reaching approximately USD 268 million, Banco Pine’s participation serves as a powerful signal that even the most established traditional financial institutions now recognize the tangible value and efficiency of moving complex debt instruments onto a public blockchain.
Together, these transactions bring the total volume tokenized on XDC via VERT to roughly USD 375 million. This volume is substantial even by global standards. More importantly, it demonstrates the network’s capacity to handle institutional-grade volume and complexity.
The partnership is now firmly on track to hit a targeted USD 1 billion in assets on the XDC Network by the end of 2026, a goal that would solidify XDC’s position as a global leader in the RWA space.
Public Blockchain: The Neutral Alternative to Private DLT
A critical differentiator in these issuances is the choice of XDC Network as a public blockchain over domain-specific, private Distributed Ledger Technology (DLT) networks. For years, the prevailing wisdom in banking was that private is safer. However, the industry is beginning to realize that private ledgers often recreate the very silos they were intended to break.
Private DLTs often attempt to emulate centralized systems. In doing so, they frequently fail to capture the true efficiencies of decentralization, such as global interoperability and 24/7 availability, while also forfeiting the mature, optimized performance of the centralized architectures they seek to replicate.
They create walled gardens that require complex, expensive integrations to talk to one another.
XDC Network, by contrast, serves as a neutral financial market infrastructure. It offers the best of both worlds:
- Public Accessibility: Anyone can verify the state of the ledger, enhancing trust and auditability.
- Institutional Governance: By utilizing smart-contract-level permissioning, XDC ensures full regulatory alignment. Access to specific functions or assets can be restricted to verified, KYC-compliant participants.
- Connectivity Layer: This approach positions tokenization not as a replacement for existing capital market systems, but as a layer of open infrastructure that connects local markets to a global pool of investors.
By embedding governance directly into the code, XDC allows for regulated decentralization, where the rules of the regulator are enforced automatically by the network protocol.
Surfing the Wave of Innovation
The leadership driving this initiative views the current landscape not as a temporary trend, but as a fundamental shift in the plumbing of global finance.
“These issuances demonstrate how public blockchain infrastructure can add real value to traditional fixed-income markets. By bringing debentures from companies like Mottu and Banco Pine onto the XDC Network, VERT is enhancing transparency, traceability, and global visibility for Brazilian assets, while maintaining full regulatory alignment.”
— Diego Consimo, Head of LATAM, XDC Network.
“This is exactly how we see tokenization evolving: not as a replacement of existing systems, but as a layer of open, neutral infrastructure that connects local capital markets to global investors.”
This vision of connectivity over replacement is key to institutional adoption. It allows legacy systems to integrate with blockchain at their own pace, slowly migrating functions to the chain as confidence grows.
Gabriel Braga, Director of Digital Assets at VERT Capital, views the technological shift through a more visceral lens. He notes that many traditional institutions are reacting to blockchain with fear, attempting to build lifeboats to survive what they perceive as a disruptive storm.
“Everyone sees this huge swell of tokenization already arriving on capital-markets shores. A common reaction is to see it as a threat and build one-size-fits-all lifeboats, hoping the next wave won’t grow even bigger. It will grow bigger. We should see it as an opportunity and learn how to surf it.”
Braga’s analogy highlights the difference between defensive innovation (private DLTs) and offensive innovation (public blockchain). Those who learn to surf use the power of the wave, the liquidity and openness of public networks, to move faster and further than those huddled in lifeboats.
Brazil as a Global RWA Leader
As these issuances demonstrate, Brazil is no longer just a participant in the digital asset space, it is a global frontrunner. The combination of high interest rates, a sophisticated banking system, and a clear regulatory path has made it the perfect environment for RWA tokenization to scale.
By leveraging XDC infrastructure, Brazilian companies are achieving a level of global visibility that was previously reserved for the largest multinational corporations. This democratizes access to capital, allowing companies like Mottu to tap into international markets with the same ease as a blue-chip bank.
Looking forward, the success of the Mottu and Banco Pine issuances serves as a blueprint for the next phase of financial evolution. As the XDC Network continues to grow, it reinforces its position as the preferred infrastructure for institutions that demand the benefits of a public, neutral ledger while operating within the rigorous boundaries of global financial regulation.
The path to USD 1 billion is more than just a target, it is a testament to the fact that the future of finance is open, transparent, and built on XDC.
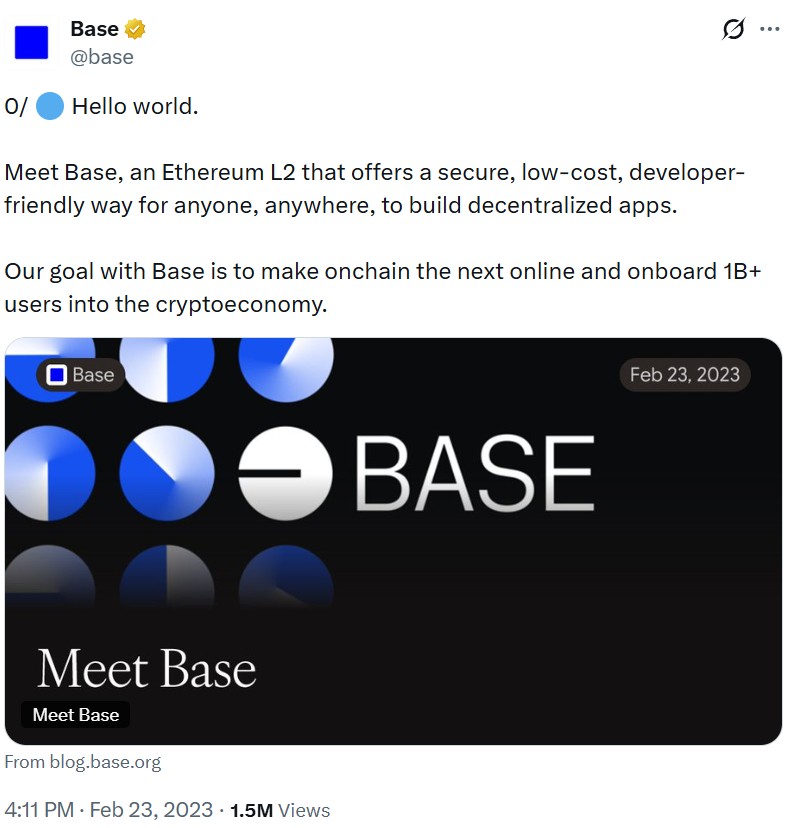
Base will transition to a unified, internally maintained stack, expected to be its biggest architectural shift since launch.
After debuting in 2023 as a rollup built on Optimism’s OP Stack, Coinbase’s Ethereum layer 2 is now consolidating its software into an in-house distribution, which can unlock faster upgrades and greater autonomy over its technical roadmap.
It has been exactly three years since Base launched its testnet. The network has experienced SocialFi explosions and ridden its own memecoin wave. It even went through a phase that both fascinated and unnerved Crypto Twitter as AI agents began transacting on its chain.
Here’s how it got here.

Friend.tech headlines Base’s “Onchain Summer” fest
Base’s mainnet opened to builders in July 2023, and users followed in August. The period after Coinbase cut the ribbon was promoted as “Onchain Summer.” In the first week, Base attracted 700,000 new users, who brought with them about $242 million in inflows.
Friend.tech was the headline act of Coinbase’s summer festival. It was a social app that allowed users to buy and sell access to their connections. The loudest voices on Crypto Twitter tested the industry’s newest toy, which also attracted the rich and famous outside the community. In less than two weeks after launching, it generated over $1 million in daily fees, surpassing Bitcoin at the time.
It didn’t last long.

By the end of August, fees and transaction volume had tanked, and the platform was declared “dead.”
A little over a year later, the team relinquished control of the project by ditching the admin rights of its smart contracts.
Base rides its own memecoin wave
The memecoin frenzy became one of the defining crypto stories in recent years, drawing in political figures and public personalities. Eventually, it prompted the US Securities and Exchange Commission to state that such tokens fall outside the scope of securities laws.
Solana is the go-to blockchain for memecoins. Its data shows the memecoin boom gaining momentum in late 2023, when its daily active addresses began climbing toward Ethereum’s levels. In March 2024, Solana decisively surpassed Ethereum on that metric when Base users started showing some post-Friend.tech signs of life.

From March 19 to 25, Cointelegraph Magazine found more than 380,000 ERC-20 tokens deployed on Base. That activity brought in fresh liquidity into Base’s DeFi ecosystem, and by June 2024, the layer 2 had flipped Ethereum in active addresses. It held on to that lead until December 2025.

AI agents begin transacting on Base
In the latter half of 2024, AI agents claimed the driver’s seat in crypto. As with memecoins, early experiments took off on Solana, such as Goatseus Maximus, ai16z and Truth Terminal.
Developers launched agent-linked tokens, autonomous trading bots and social accounts that presented themselves as autonomous onchain actors.
Related: Can Solana shed its memecoin image in 2026?
Coinbase CEO Brian Armstrong argued that crypto provides a natural financial rail for AI systems, as agents lack the legal identity required to open traditional bank accounts.
On Base, focus shifted to AI agents capable of holding balances, tipping users and interacting directly with smart contracts. In October 2024, Coinbase introduced “Based Agents,” a toolkit that allowed users to build AI agents equipped with crypto wallets.

The most visible Base-native experiment was Virtuals Protocol, which enabled users to create agents tied to tokens and onchain addresses.
One such Virtuals agent, Luna (not related to Terra), became the first on Base to autonomously execute onchain tips.
Virtuals later expanded to Solana in January 2025 to tap into its larger retail base. However, activity across AI-agent tokens soon slowed, and Virtuals cooled with it.
The second coming of SocialFi on Base
Base’s 2023 debut was followed by the breakout of Friend.tech. In 2025, SocialFi returned to Base in a different form, sparked by deeper integration with Coinbase’s consumer ecosystem.
That push was tied to Coinbase’s “super app” ambitions. Super apps are platforms that support a variety of 21st-century necessities, such as messaging, digital banking, ride sharing or even food delivery.
Related: Banks can’t seem to service crypto, even as it goes mainstream
Such platforms already exist in Asia. WeChat in China is used in the everyday lives of more than 1 billion users, combining messaging, payments and commerce. South Korea’s KakaoTalk and Japan’s Line serve similar functions in their respective markets. Social media giants like X and Meta have said they are exploring similar models.
In July 2025, Coinbase rebranded its wallet as the Base App, making its Ethereum layer 2 the default execution layer within its wallet ecosystem.
At the center of this phase was Farcaster, a decentralized social network where accounts are linked to crypto addresses. Posts, tips and token launches connected directly to onchain activity.
At the same time, Zora, which enables creators to mint and distribute tokenized content, saw bursts of activity in mid-2025 that contributed to measurable spikes in Base transactions and token launches. Tokens were often promoted on Farcaster.

The second coming of SocialFi on Base lasted longer than Friend.tech, but interest faded after the initial hype period. On Feb. 9, 2026, Coinbase announced it would sunset its Creator Rewards program and Farcaster-powered social feeds. The change does not directly affect Zora users, though activity there has also cooled from its peak.
Base becomes Ethereum’s most active layer 2
Throughout the first three years, Base showcased the distribution power of the largest US exchange, similar to how BNB Chain’s user activity is influenced by Binance.
Aside from their technical differences, Binance has attempted to distance itself from the blockchain it founded by attempting to give it its own brand, while Coinbase has kept Base close to its orbit.
Coinbase and its blockchain have ridden the tides of emerging trends such as memecoins and AI agents while becoming the center of creator economies and SocialFi applications.
Those trends came and went, but they did push Base to the top of the Ethereum layer-2 ladder. It now leads in users, transactions, fees and total value locked, according to data from Nansen and DefiLlama.

Trends onboarded users and distribution brought scale. Now, Base is consolidating its foundation. Whether the unified stack cements its lead or merely bookends its first growth era will define its next three years, as Ethereum’s focus shifts from L2s back to scaling the main chain.
Magazine: Bitcoin may take 7 years to upgrade to post-quantum: BIP-360 co-author
Cointelegraph Features and Cointelegraph Magazine publish long-form journalism, analysis and narrative reporting produced by Cointelegraph’s in-house editorial team and selected external contributors with subject-matter expertise. All articles are edited and reviewed by Cointelegraph editors in line with our editorial standards. Contributions from external writers are commissioned for their experience, research or perspective and do not reflect the views of Cointelegraph as a company unless explicitly stated. Content published in Features and Magazine does not constitute financial, legal or investment advice. Readers should conduct their own research and consult qualified professionals where appropriate. Cointelegraph maintains full editorial independence. The selection, commissioning and publication of Features and Magazine content are not influenced by advertisers, partners or commercial relationships.


The new details were published with the Core Team’s anniversary post. Here’s what Pioneers need to know.
Amid the growing wave of criticism against the lack of actual progress on many sensitive topics, the Core Team celebrated the first anniversary of the launch of the Open Network last week.
In a lengthy post, they outlined some of the key achievements, developments, and what’s ahead for the protocol. One of those was the introduction of Ecosystem Token Design, aimed at driving real utility to the Mainnet.
Pi has released specific details on the Ecosystem Token Design on Pi Network as a Pi Request for Comment (PRC) to the community. Learn more about ecosystem token design here, and read the GitHub page for further details. https://t.co/aBURnSxtQa
Feedback is welcome, and Pioneers…
— Pi Network (@PiCoreTeam) February 23, 2026
Ecosystem Token Design
The new framework unveiled by the team for ecosystem tokens on its Mainnet wants to address one of Web3’s most persistent challenges: the disconnect between token issuance and real-world utility.
The initiative focuses on enabling community-created tokens that support functional products and services rather than speculative fundraising, as Pi Network’s Core Team alleged is the case with many blockchain projects. This would be a structural shift they believe is essential for sustainable ecosystem growth.
They admitted that tokens remain one of the most powerful tools in Web3, but many projects fail to deliver meaningful utilization and products, creating a structural misalignment between token issuance and innovation.
In contrast, Pi Network argues that its ecosystem is uniquely positioned to take a different approach. Given its large and active user base and expanding app ecosystem, the team plans to integrate tokens directly into product development and adoption rather than speculative financing.
You may also like:
Tokens Designed for User Acquisition
The current launch programs promote a new token model centered on utility and user growth, the team said. Instead of issuing such assets simply to raise funds, projects distribute tokens to support user acquisition and embed them directly into product functionality. This structure allows:
- Users to hold projects accountable for product quality
- Continuous feedback and iteration for improvements
- Transparent and merit-based access to tokens
- Token use within real applications
This process enables Pioneers to stake the native token and utilize it to facilitate participation and coordination. The team wants to enhance sustainability and transparency through a few key design features – liquidity-first structure, working product requirement, and user engagement incentives.
They also asked the vast Pi Network community for their feedback and reviews. They will be able to provide their input before the final implementation. It’s worth noting, though, that some of the most recent feedback from Pioneers has been anything but positive, with countless users questioning the overall state of the Pi Network ecosystem.
Binance Free $600 (CryptoPotato Exclusive): Use this link to register a new account and receive $600 exclusive welcome offer on Binance (full details).
LIMITED OFFER for CryptoPotato readers at Bybit: Use this link to register and open a $500 FREE position on any coin!
Disclaimer: Information found on CryptoPotato is those of writers quoted. It does not represent the opinions of CryptoPotato on whether to buy, sell, or hold any investments. You are advised to conduct your own research before making any investment decisions. Use provided information at your own risk. See Disclaimer for more information.

Best Puffer Jacket (2026): Patagonia, Arc’teryx, REI

David Wilson Homes to launch Castra Park in Huntington, York
Fidelis Insurance Holdings stock hits 52-week high at 20.25 USD


-

 Video7 days ago
Bitcoin: We’re Entering The Most Dangerous Phase
-

 Crypto World6 days ago
Can XRP Price Successfully Register a 33% Breakout Past $2?
-

 Video4 days ago
XRP News: XRP Just Entered a New Phase (Almost Nobody Noticed)
-

 Fashion3 days ago
Weekend Open Thread: Boden – Corporette.com
-

 Sports6 days ago
GB's semi-final hopes hang by thread after loss to Switzerland
-

 Politics1 day ago
Baftas 2026: Awards Nominations, Presenters And Performers
-
 Tech6 days ago
The Music Industry Enters Its Less-Is-More Era
-

 Business6 days ago
Infosys Limited (INFY) Discusses Tech Transitions and the Unique Aspects of the AI Era Transcript
-

 Entertainment5 days ago
Kunal Nayyar’s Secret Acts Of Kindness Sparks Online Discussion
-

 Video6 days ago
Financial Statement Analysis | Complete Chapter Revision in 10 Minutes | Class 12 Board exam 2026
-

 Tech5 days ago
Retro Rover: LT6502 Laptop Packs 8-Bit Power On The Go
-
 Sports4 days ago
Clearing the boundary, crossing into history: J&K end 67-year wait, enter maiden Ranji Trophy final | Cricket News
-

 Business1 day ago
Mattel’s American Girl brand turns 40, dolls enter a new era
-

 Business22 hours ago
Law enforcement kills armed man seeking to enter Trump’s Mar-a-Lago resort, officials say
-

 Entertainment5 days ago
Dolores Catania Blasts Rob Rausch For Turning On ‘Housewives’ On ‘Traitors’
-

 Business5 days ago
Tesla avoids California suspension after ending ‘autopilot’ marketing
-
 NewsBeat4 hours ago
‘Hourly’ method from gastroenterologist ‘helps reduce air travel bloating’
-

 Politics6 days ago
Eurovision Announces UK Act For 2026 Song Contest
-

 Tech21 hours ago
Anthropic-Backed Group Enters NY-12 AI PAC Fight
-

 NewsBeat20 hours ago
Armed man killed after entering secure perimeter of Mar-a-Lago, Secret Service says