
Crypto World
Where Ethereum’s capital actually lives


Disclosure: This article does not represent investment advice. The content and materials featured on this page are for educational purposes only.
A new report shows that 58% of Ethereum’s top-holder capital sits outside ETH, reshaping how dominance, concentration, and systemic risk are understood.
Summary
- Aggregated rankings reveal $426b in top-address holdings versus $189b under ETH-only measurement, with nearly half of the Top-1,000 addresses changing once tokens are counted.
- Smart contracts now control nearly 40% of top-holder capital, signaling a structural shift from individual holders to protocol-driven mechanisms.
- The newly introduced Printing-Press Index (PPI) shows DeFi balances cluster around ~50% self-issued tokens, highlighting rising wrong-way risk and potential systemic fragility in a token-heavy market.
Ethereum’s largest balances look dramatically smaller through an ETH-only lens. When address holdings are evaluated by total on-chain assets, ETH plus ERC-20 tokens and stablecoins valued in USD, the apparent capital at the top expands by more than 2x. This isn’t just a valuation tweak: once tokens and stablecoins are included, smart contracts and protocol-controlled entities represent over 40% of top-holder capital, fundamentally altering the visible structure of Ethereum’s market.
What to know
- Once addresses are ranked by total USD holdings (ETH plus ERC-20 tokens and stablecoins), the leaderboard captures far more capital than ETH-only rankings. In the Aggregated Top-10,000, total balances amount to $426B, compared with $189B when measured by ETH alone, a 2.2x difference in the capital visible at the top. The composition also shifts: in the Top-1,000, only 537 addresses overlap between the ETH-only and aggregated rankings.
- This view also changes who appears to control Ethereum’s largest balances. In the Aggregated Top-1,000, smart contracts account for nearly 40% of the capital. The shift implies that a large share of Ethereum’s economic weight sits in automated, protocol-controlled structures rather than externally owned accounts, altering how concentration, liquidity, and counterparty exposure should be interpreted.
- A Printing-Press Index (PPI) helps separate externally sourced value from self-minted balance-sheet mass. In DeFi-related balances, self-issued components cluster around 50%, a level that moves from “detail” to systemic fragility because even modest selling pressure can trigger wrong-way dynamics and accelerate a death-spiral-style unwind. A practical risk threshold often begins around ~20%.
About Ethplorer.io report
This report uses an aggregated ranking of Ethereum addresses based on totalBalanceUsd, which includes ETH, ERC-20 tokens and stablecoins valued in USD.
The Beacon deposit contract is excluded because it is a technical registry, not a wallet. It only logs staking deposits, meaning the ETH shown there is not withdrawable capital. While traditional rankings often display about 77.8M ETH (~$258B) at this address, the economically relevant staking balance is closer to ~36M ETH (~$118B) – roughly 2.2x lower.
Token contracts are also excluded to focus on economically meaningful holders.
Altseason already happened: Just not on the price charts
Crypto markets have moved beyond price discovery and into a phase of power discovery. Prices, market caps and TVL are transparent, but it remains unclear who actually controls liquidity, issuance and systemic risk across Ethereum’s on-chain economy.
In earlier cycles, this distinction mattered less. Through most of 2017–2021, ETH represented the majority of Ethereum’s economic value, while tokens and stablecoins played secondary roles. ETH price and market cap were often sufficient proxies for economic influence.
That structure has since changed. By 2022–2023, token-denominated balances reached ETH in economic weight.
In Ethereum’s aggregated rating, ETH no longer dominates portfolios
According to the Ethplorer.io report, the top addresses hold about $426.3B in total value. Of this amount, $177.5B is held in ETH, roughly 42%, while the remaining ~58% is denominated in tokens. Stablecoins alone account for around 26% of the average large-address balance.
Importantly, this is not just a matter of composition. When ranked by Aggregated value, only 537 addresses overlap with the ETH-based Top-1,000, meaning nearly half of the largest holders emerge only once tokens are counted.
In that sense, a form of “alt-season” may have already occurred, just not in the way markets traditionally expect. Dominance did not arrive through broad price appreciation or new all-time highs, but quietly, through balance-sheet accumulation.
This disconnect helps explain why the shift went largely unnoticed. Market participants were watching charts, while structural dominance was changing on-chain.
What this reveals is not a failed altseason, but a transformed one. Capital did not rotate into altcoins through explosive price appreciation. Instead, it expanded laterally, across a growing number of protocols, tokens and smart contracts, while prices remained largely range-bound.
When size stops signaling strength
Over the past year, Top-100 addresses did not preserve capital better than the broader Top-1,000. Despite expectations of superior information or positioning at the very top, concentration did not translate into structural outperformance.
By calculating the Median balance (~$122M), the Maximum balance ($35.2B), and their ratio (Max / Median ~290×) for the Aggregated Top-1000, a clear conclusion emerges. Taken together, these metrics point to a shift from market risk to system risk. A nearly 290× gap between the largest and median balances reflects structural concentration rather than distributed exposure. In such an environment, losses are driven less by adverse price movements and more by the liquidity conditions and mechanics of leading protocols.
For investors, the implication is practical rather than theoretical.
In a token-heavy, sideways market, strategies centered on capital preservation and yield capture, staking, liquid staking, restaking, and stablecoin-based returns appear more consistent with how large holders are actually positioning on-chain than speculative bets on illiquid tokens or leveraged exposure.
In other words, structural change is already reflected in balances, while expectations continue to follow charts.
If tokens now represent the majority of Ethereum’s economic weight, the more important question is no longer whether this shift exists, but what risks it introduces. Especially when a growing share of that capital is self-issued.
The Printing-Press Index: Measuring self-minted wealth
To separate externally sourced capital from value inflated by self-issuance, the Printing-Press Index (PPI) is calculated by Ethplorer as the share of a project’s own tokens within its total token-denominated portfolio:
PPI = Own tokens (USD) / Total tokens (USD).
*Only liquid assets are included. Spam tokens are filtered using Ethplorer.
At a group level, the results are uneven:
- DeFi protocols cluster around ~50% self-issued tokens (e.g. UNI, AAVE, MNT).
- Centralized exchanges average ~7% (BNB, CRO, LEO), but with notable outliers:
- Within the Bitget-linked address group, 31 related addresses hold roughly $11B in total assets, of which ~$3.25B is denominated in BGB, implying a group-level PPI of ~30%.
As Ethereum’s economy shifts toward tokens, balance size becomes a weaker indicator of risk. High PPI introduces a well-documented structural risk known as wrong-way risk, where a system’s stability depends on the value of its own token.
At low levels (roughly 10-20%), self-issued tokens function as a design feature. Beyond ~40-50%, the system enters a fragile regime: modest external pressure can impair confidence, compress liquidity, and trigger reflexive sell-offs characteristic of a death-spiral dynamic. At this point, PPI shifts from a descriptive metric to a signal of systemic vulnerability.
The UST-LUNA collapse represents the extreme case, with a PPI near 100%, where self-referential backing led to a reflexive unwind once confidence broke.
The FTX-FTT case shows that even ~40% self-issued exposure can destabilize a system when liquidity thins.
In both cases, balance-sheet size masked fragility rooted in token self-dependence.
In short
In a token-heavy market, what matters is no longer how big a balance is, but what it consists of. PPI provides a practical filter for assessing balance-sheet quality, separating externally sourced capital from value amplified through self-issuance. In a market where structural dominance has already shifted and prices remain range-bound, attention naturally moves from chasing expansion to managing exposure. For analysts and investors, monitoring how capital is composed, not just how much exists, becomes central to evaluating resilience, concentration and risk in a post-ETH-dominance landscape.
Smart contracts vs. HODLers: When risk moves from holders to mechanisms
When Ethereum was conceived in 2013, Vitalik Buterin framed it in his White Paper not as a currency system, but as a platform for self-executing smart contracts and decentralized applications. Aggregated on-chain data now shows that Ethereum’s largest holders increasingly reflect this architecture:
When viewed through an ETH-only lens, smart contracts appeared as a minority participant in Ethereum’s wealth distribution. Aggregated balances change that picture materially.
In the Aggregated Top, smart contracts control nearly 40% of total capital, roughly three times their share in ETH-only rankings.
This is not just a classification shift, it is a risk transfer.
When capital sits in externally owned accounts, risk is tied to individual behavior. When capital moves into smart contracts, risk becomes embedded in mechanisms: code logic, collateral design, liquidity assumptions and token economics.
For analysts and investors, this changes how exposure should be evaluated.
A large balance no longer implies resilience. What matters is whether that balance is externally sourced, or recursively backed by its own issuance. In a contract-dominated landscape, headline TVL or balance size can mask fragility rather than signal strength.
Operationally, this shifts analysis from protocol narratives to address-level balance inspection.
Evaluating a protocol increasingly means identifying its associated on-chain entities, aggregating their balances, and measuring how much of that capital is represented by the project’s own token. This process relies on address attribution and tagging rather than price charts alone.
This is where PPI becomes operational rather than theoretical.
Using tagged project addresses, available across modern blockchain explorers, analysts can quantify self-issued exposure directly. A PPI above roughly 20-30% signals rising wrong-way risk, where protocol stability increasingly depends on the market value of its own token rather than external capital.
Final insight: What the new structure of Ethereum actually means
Ethereum’s on-chain data no longer supports analysis based on ETH balances alone. Once capital is viewed in aggregated USD terms, a different market structure emerges, one that materially changes how exposure, dominance and risk should be interpreted:
- Smart contracts are no longer marginal holders, they are core economic actors.
With nearly 40% of top-holder capital controlled by contracts, risk increasingly resides in protocol mechanics rather than individual decision-making. - The altseason did not disappear, it changed form. Capital expanded across protocols and balance sheets rather than through price appreciation, explaining why structural dominance shifted without new All-Time Highs.
- Balance size is no longer a proxy for resilience. High PPI levels show that large balances can be internally reinforced by self-issued tokens, introducing wrong-way risk even in systems that appear well-capitalized.
- Exposure analysis must shift from narratives to balance composition. Evaluating protocols now requires inspecting aggregated balances, address attribution, and self-issued exposure, not just TVL, token price or brand perception.
Disclosure: This content is provided by a third party. Neither crypto.news nor the author of this article endorses any product mentioned on this page. Users should conduct their own research before taking any action related to the company.


Ripple’s CTO emeritus David Schwartz recently engaged in an interesting exchange on X, responding to a post about XRP with a meme and supporting comments.
Summary
- David Schwartz responded to Solana with a meme, fueling the ongoing XRP-Solana rivalry.
- XRP’s integration on Solana through wrapped tokens highlights growing blockchain collaboration.
- XRP Ledger sees increased activity, but AI tools may cause failed transactions and higher fees.
Meanwhile, the interaction occurred after a statement from Solana Foundation President Lily Liu, which sparked reactions from the crypto community, particularly surrounding the future of blockchain gaming.
The conversation began when Solana’s official X account responded to a tweet from the Solana Foundation President, Lily Liu, who had stated that blockchain gaming was “not coming back.” In response, an X user jokingly announced they were switching chains and asked for a recommendation. Solana’s official account replied, saying,
“we hear XRP is nice this time of year.”
This prompted Ripple CTO emeritus David Schwartz to engage with the tweet from XRP-friendly exchange Bitrue. Bitrue had shared Solana’s tweet, and Schwartz responded with a GIF meme saying, “You’re goddamn right,” further fueling the ongoing discussion about XRP and Solana’s relationship. This playful back-and-forth highlighted the ongoing rivalry and camaraderie between the two blockchain ecosystems.
In December 2025, XRP made its way onto the Solana blockchain via Hex Trust’s wrapped XRP (wXRP) token. This move allowed XRP to be traded alongside the Ripple USD stablecoin (RLUSD) on the Solana network, marking a significant step in the collaboration between the two blockchains. The integration also raised curiosity about how these ecosystems could coexist and complement each other.
Schwartz’s response reflects the growing relationship between the two projects. Despite the ongoing competition in the blockchain space, it appears that XRP and Solana are finding ways to collaborate and engage with each other’s communities.
XRP Ledger activity and AI coding
Meanwhile, XRP Ledger (XRPL) has seen a spike in activity recently, with XRPL validator Vet suggesting that increased use of AI tools and scripts might be contributing to the rise in transactions. While this increase in activity is positive, Vet pointed out that it often results in complex queries or failed transactions, which can overload public infrastructure.
One user experienced a costly mishap, spending over $2,000 in transaction fees due to failed XRP Ledger transactions. Vet cautioned that while AI tools may improve efficiency, users should remain cautious and oversee their transactions to prevent potential issues.
VanEck, a prominent investment firm, has observed a shift in the Bitcoin (BTC) options market, highlighting growing defensive positioning from investors. The recent surge in put option demand and the drop in call option premiums signal a cautious outlook for Bitcoin’s price. This trend reflects investor concerns about macroeconomic factors and market volatility.
Summary
- Bitcoin’s put/call ratio hits 0.84, showing increased demand for downside protection.
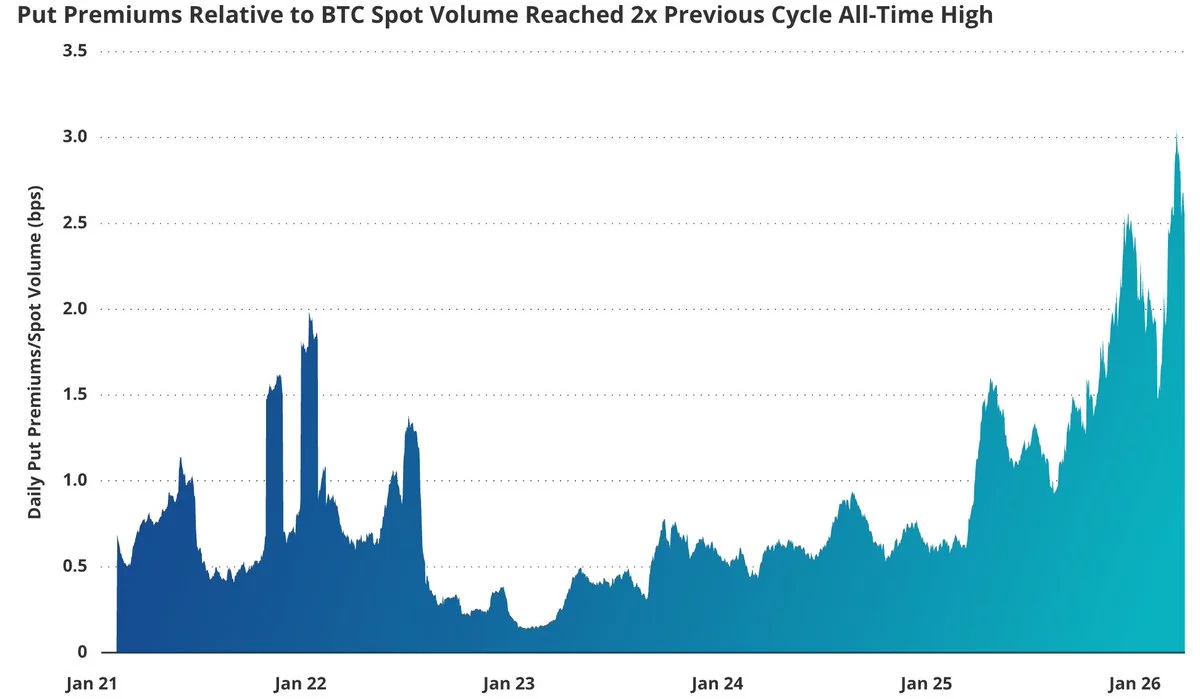
- Put premiums hit record highs, signaling growing caution in the market.
- Despite price declines, Bitcoin shows signs of stabilization with reduced volatility and leverage.
In early 2026, the Bitcoin options market has shown signs of heightened caution. VanEck’s analysis reveals that the put/call open interest ratio has risen to 0.84, the highest level since June 2021, reflecting stronger demand for downside protection.
Over the past 30 days, investors spent approximately $685 million on put options, signaling their concern for further price declines. Meanwhile, premiums on call options fell about 12%, to around $562 million, suggesting that bullish sentiment has waned.
This shift in sentiment coincides with a 19% decline in Bitcoin’s price over the last month. Despite this drop, spot prices have stabilized, and the market has entered a phase of consolidation, with volatility decreasing from 80 to 50. The drop in futures funding rates, which fell from 4.1% to 2.7%, further suggests that leverage in the market has cooled.

VanEck’s report indicates that the demand for downside protection is at its highest level in recent cycles. The put premiums relative to spot volume have reached an all-time high, with put premiums three times higher than levels seen during the market stresses of mid-2022. This suggests that investors are willing to pay a premium to hedge against further price drops, signaling a defensive stance.
The options skew, where put options are more expensive than call options, reflects this growing concern. As of March 2026, the cost of protecting against price drops is significantly higher than the cost of betting on price increases, with implied volatility on puts averaging 66, which is 16 points higher than realized volatility. Historically, this type of skew has often been seen before Bitcoin’s price rebounds.
Industry trends and network activity
Despite the heightened caution in the options market, other indicators show that the Bitcoin market is stabilizing. On-chain activity, such as transaction volume and daily active addresses, has declined, reflecting a more subdued speculative environment. However, long-term holder selling seems to be slowing down, which could be a positive sign for the market’s stability.
Bitcoin’s price recently surged to $70,000 before correcting, indicating potential signs of a cyclical bottom. VanEck’s CEO, Jan VanEck, has suggested that this may signal a recovery for Bitcoin, as the market adjusts to lower volatility and reduced leverage.
Bitcoin (BTC) erased much of its US-Iran war-driven gains this week, moving back in sync with the broader downtrend in risk assets, mainly US equities.
Key takeaways:
-
Bitcoin’s positive flip in S&P 500 correlation has historically preceded average declines of around 50% since 2018.
-
BTC is exposed to a broader risk-asset sell-off due to rising macro pressure.
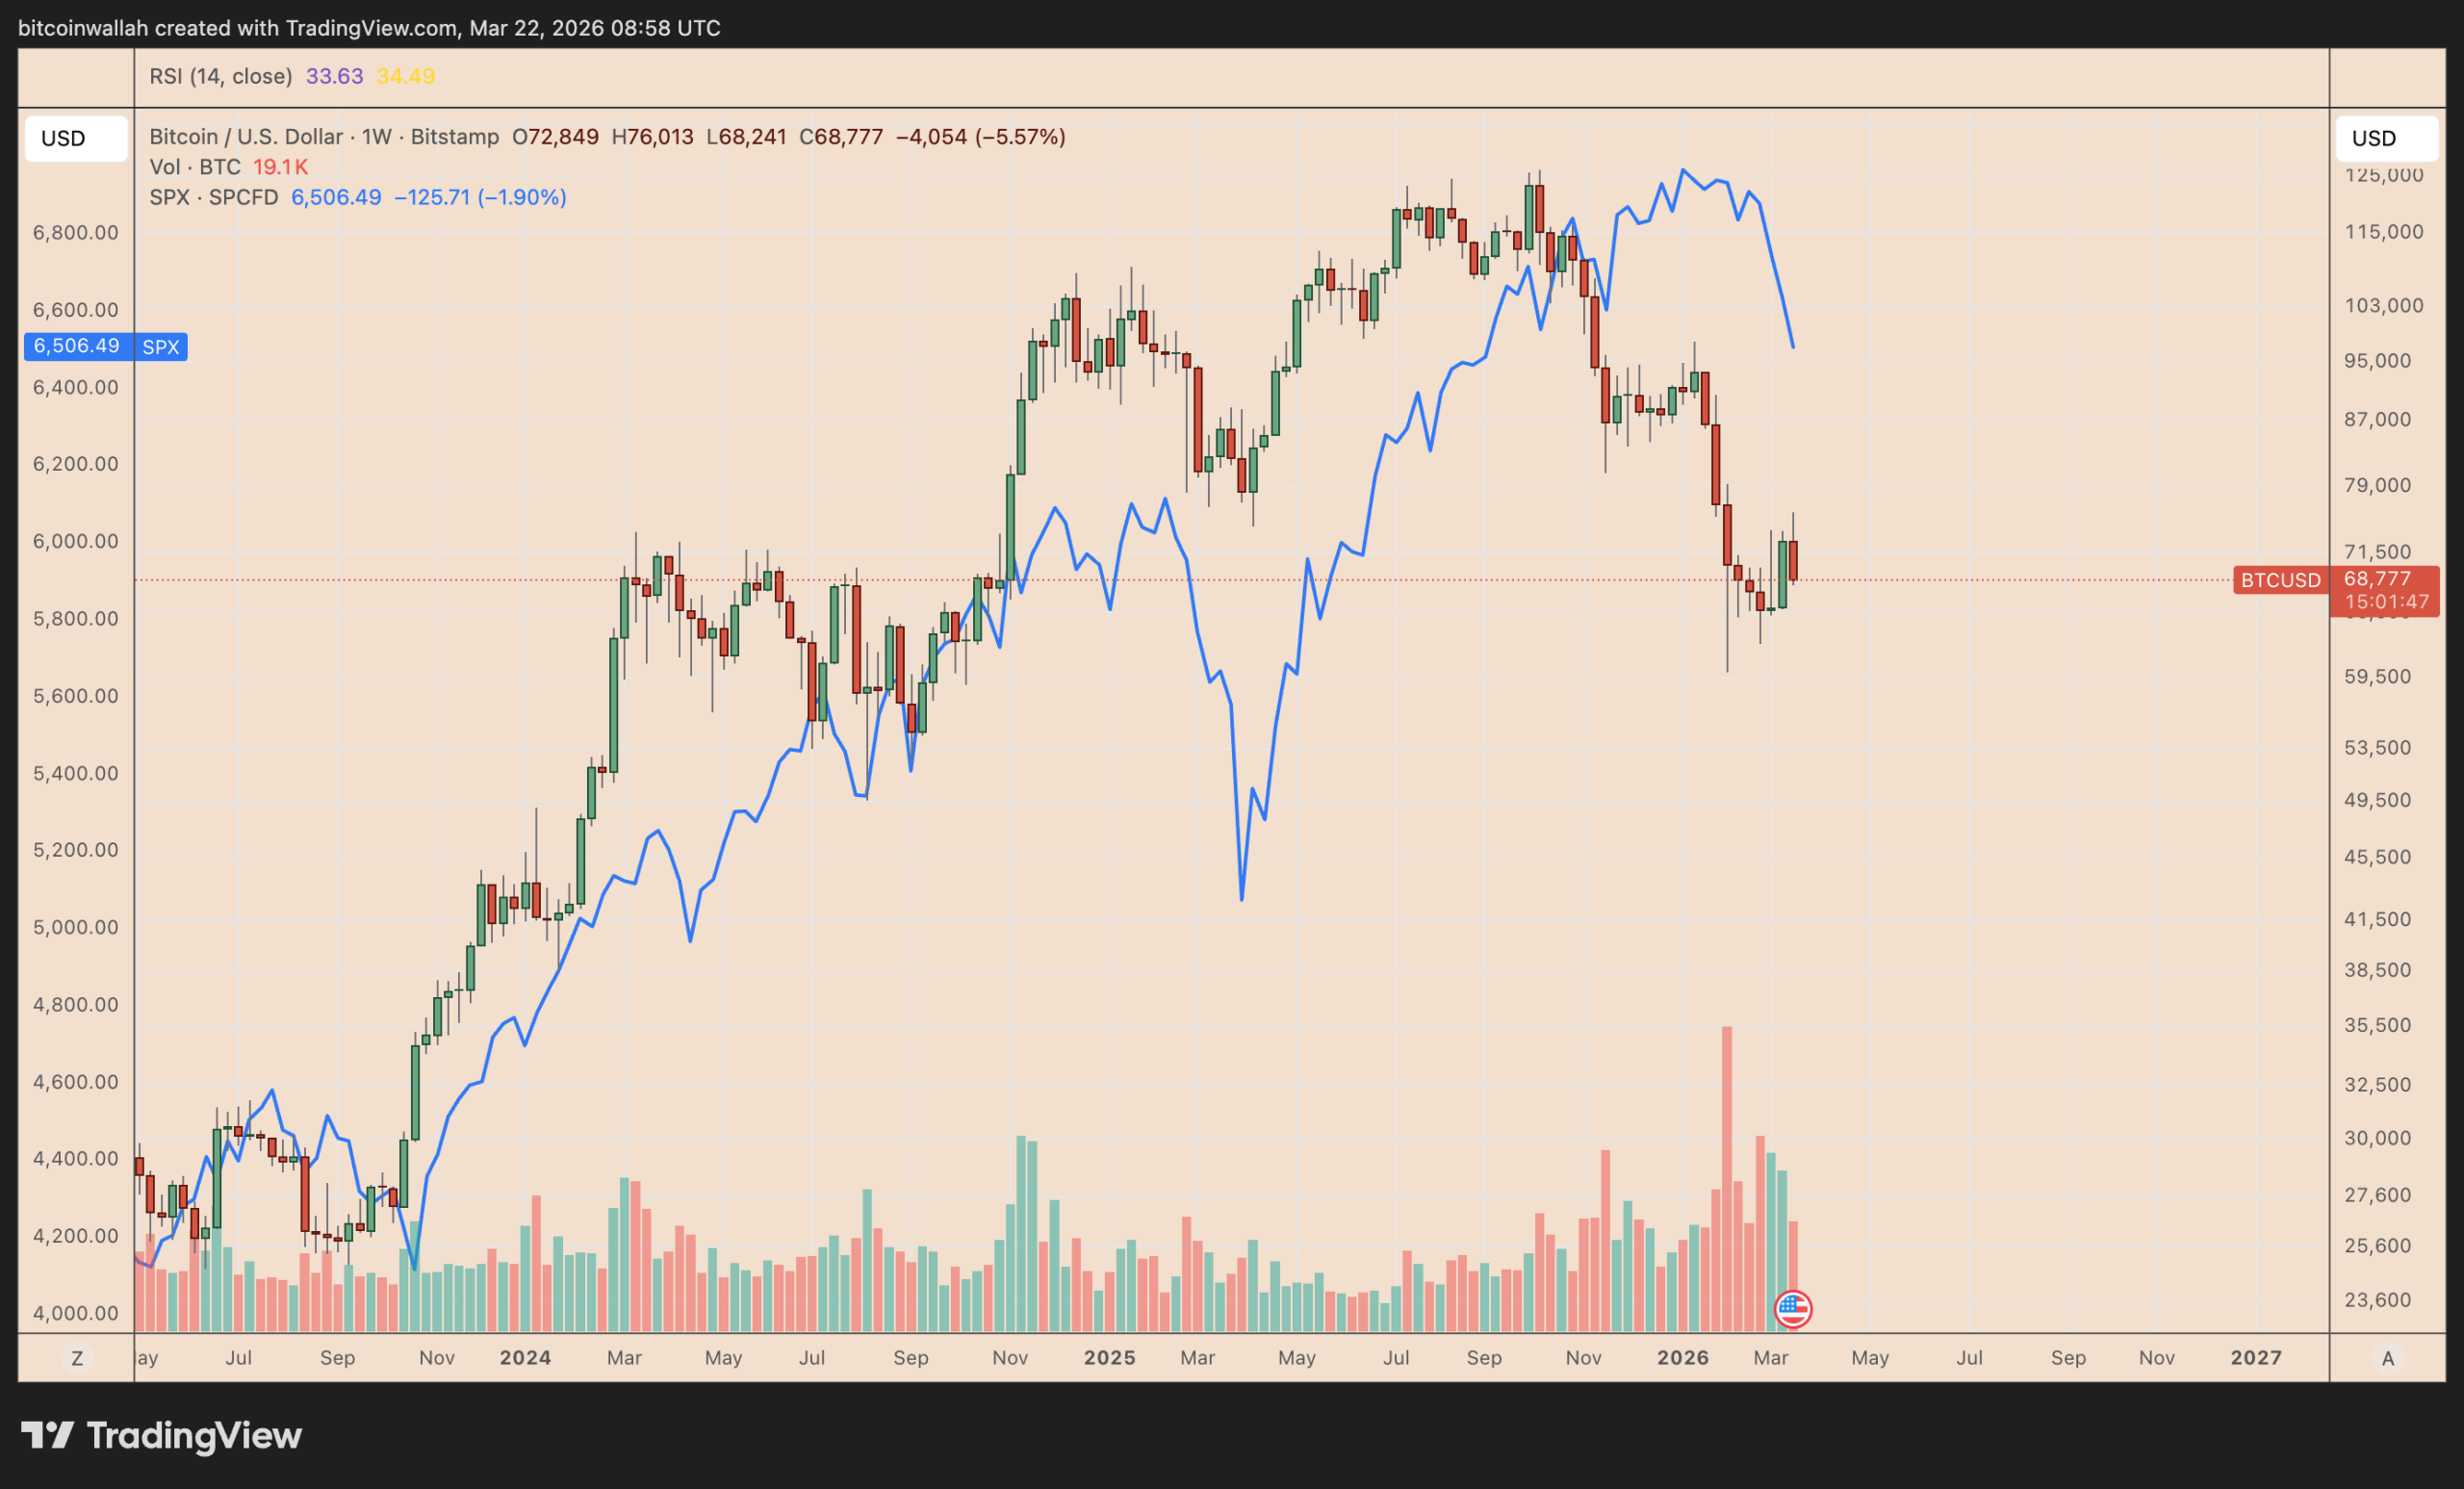
As of Sunday, BTC/USD had fallen 5.65% week-to-date to about $68,700, while the S&P 500 (SPX) closed the week down 1.90%.

That renewed correlation is now signaling a greater risk of further downside in the Bitcoin market.
BTC drops 50% on average when it starts following stocks
The bearish warning for Bitcoin comes from a weekly correlation metric comparing BTC and the S&P 500 (SPX), the US equity benchmark index.
As of Saturday, the 20-week rolling correlation between BTC and SPX was 0.13, up from its recent nadir of around -0.5.

Since 2018, such sharp recoveries in BTC-SPX correlation have been preceding broader Bitcoin market declines, averaging at about -50%.
“It is a warning sign that the stock market is going to collapse and take BTC with it,” said analyst Tony Severino.

A 50% drop from Bitcoin’s current price would imply a downside target of roughly $34,350 if the historical pattern repeats. Multiple analysts have projected Bitcoin to drop as low as $30,000–$40,000 in 2026.
In 2020 and 2022, Bitcoin’s declines lagged by several months, unfolding after classic “bull traps” in which BTC rallied alongside rising SPX correlation before reversing and wiping out those gains.
Related: Bitcoin options signal fear even as BTC ETF outflows remain relatively low
Macro conditions, such as elevated oil prices, inflation, and lower odds of the Federal Reserve cutting interest rates, support the bearish outlook for Bitcoin and equities over the coming months.
Strategy pause adds to cautious outlook
Bitcoin’s renewed correlation with equities is also coinciding with a pause in corporate accumulation.
Strategy (MSTR), one of the largest Bitcoin holders, hasn’t bought BTC via the sales of its STRC preferred stock this week, according to data resource STRC.LIVE.

Its last acquisition, announced March 16, added 22,337 BTC worth $1.57 billion, bringing total holdings to 761,068 BTC. Bitcoin rallied by around 10.50% in the same period, beating US stocks.
Strategy’s STRC-fueled buying helped support Bitcoin’s rally during the US–Iran war. With no fresh purchases this week, BTC is more exposed to the potential sell-off in stocks.
This article does not contain investment advice or recommendations. Every investment and trading move involves risk, and readers should conduct their own research when making a decision. While we strive to provide accurate and timely information, Cointelegraph does not guarantee the accuracy, completeness, or reliability of any information in this article. This article may contain forward-looking statements that are subject to risks and uncertainties. Cointelegraph will not be liable for any loss or damage arising from your reliance on this information.


In early 2026, a wave of layoffs across the crypto industry has raised concerns about the reasons behind the job cuts. While some companies cite macroeconomic factors, such as weak token prices, others frame their workforce reductions as part of a broader shift toward integrating AI into their operations.
Summary
- Major crypto firms, including Algorand and Gemini, cut staff due to market downturn and AI adoption.
- AI adoption in crypto companies leads to workforce reductions, with claims of increased efficiency.
- Job cuts across the industry mirror the challenges faced during the 2022 crypto winter.
Several major crypto firms, including Algorand, Gemini, Crypto.com, and Messari, have laid off staff in recent weeks. Algorand, for instance, announced it would cut 25% of its fewer than 200 employees, citing “the uncertain global macro environment” and the ongoing crypto downturn.
Similarly, Gemini Space Station (GEMI) announced it would eliminate roughly 200 positions in February, increasing to 30% by mid-March. Crypto.com also joined the list, trimming 12% of its workforce, about 180 employees.
In addition to these major companies, OP Labs, the team behind the Optimism layer-2 blockchain, laid off 20 employees, while PIP Labs, the team behind Story Protocol, reduced its staff by 10%. Messari, a crypto data provider that now emphasizes AI, made its third round of layoffs since 2023, though the number of affected employees was not disclosed.
Reasons for layoffs: Macro conditions or AI integration?
The official explanations for these layoffs vary. Algorand attributed its staff cuts to the broader economic conditions and weak token prices, such as its ALGO token trading at $0.09, down 98% from its 2019 peak.
However, many companies framed their layoffs as a pivot towards AI integration. Gemini, for instance, emphasized the necessity of AI, stating, “AI is now too powerful not to use at Gemini,” and warned that not adopting AI would soon be akin to using a typewriter instead of a laptop.
Crypto.com echoed this sentiment, stating that integrating AI into their processes resulted in increased efficiency, requiring fewer workers. CEO Kris Marszalek argued that companies not pivoting toward AI would fail. The shift towards AI adoption is seen as part of a broader trend in the industry, with AI being increasingly incorporated into workflows to reduce costs and improve productivity.
Consolidation and industry shrinkage
Industry observers pointed to broader trends of consolidation and cost-cutting. Entire sectors within crypto, such as restaking, decentralized physical infrastructure networks (DePIN), and layer-2s, which once boasted abundant talent, have experienced significant contraction. The reduction in these sectors’ activities has led companies to downsize and adjust to new market conditions.
Dan Escow, founder of crypto recruitment agency Up Top, noted,
“I see no real indication that these layoffs have anything to do with AI workforce replacement at scale.”
Instead, he suggested that the layoffs were primarily driven by the need for companies to cut costs and survive amidst ongoing challenges in the market.
The broader job market in crypto also reflects this downturn. New job postings on major crypto job boards dropped significantly, running at only 6.5 per day in January 2026, down approximately 80% from the previous year.
In addition, the job cuts from the companies mentioned in this article alone account for about 450 layoffs. This recent surge in layoffs follows the trend of the 2022 crypto winter, when over 26,000 job losses were tracked throughout the year.

In a development that underscores the heightened scrutiny around India’s crypto sector, CoinDCX co-founders Sumit Gupta and Neeraj Khandelwal were reportedly detained by Thane Police over allegations tied to a crypto investment fraud case. The Economic Times reported the arrest, citing local officials, while other outlets indicated the founders were summoned for questioning rather than formally arrested, illustrating the evolving and sometimes contradictory nature of the case.
The centerpiece of the case is a website alleged to imitate the CoinDCX platform and a first information report filed by a 42-year-old insurance consultant who claims to have lost about 71 lakh Indian rupees (roughly $75,000) after being lured to invest via the fake site. In a post on X, CoinDCX said the FIR was false and filed as a conspiracy by impersonators who redirected funds to third-party accounts with no connection to the exchange. The company said it is fully cooperating with law enforcement and stressed that brand impersonation and cyber fraud are growing issues for India’s digital-finance ecosystem.
Key takeaways
- Alleged arrest tied to a branded impersonation fraud case; local reporting varies on whether Gupta and Khandelwal were arrested or summoned for questioning.
- The FIR centers on a counterfeit CoinDCX site and a loss claim of about 71 lakh INR (~$75,000) from a 42-year-old insurance consultant.
- CoinDCX asserts the FIR is a conspiracy by impersonators and that funds were moved to third-party accounts unrelated to the exchange; the firm says it is cooperating with authorities.
- Scale of brand impersonation: CoinDCX said more than 1,212 impersonation websites targeting its coindcx.com domain were reported between April 1, 2024, and January 5, 2026.
Impersonation case and alleged fraud
The core allegations hinge on a counterfeit CoinDCX website designed to mislead investors and divert them to fraudulent destinations. The FIR, reportedly filed by a 42-year-old insurance consultant, claims losses of approximately 71 lakh INR. While media coverage varies on whether the founders were arrested or questioned, the episode highlights a persistent vulnerability in India’s crypto landscape: brand impersonation and fraudulent schemes that prey on users seeking mainstream platforms.
CoinDCX’s response and ongoing investigation
CoinDCX issued a statement via X denying the FIR as false and described as “a conspiracy by impersonators” the attempt to pin wrongdoing on its founders. The exchange emphasized that the funds in question were diverted to third-party accounts without any connection to CoinDCX. The firm reiterated its cooperation with law enforcement and framed the incident as part of a broader wave of impersonation and cyber fraud targeting digital finance users. The company also signaled a broader commitment to user education and awareness as part of its response strategy.
Phishing and security challenges in India’s crypto landscape
The incident arrives against a backdrop of growing concern about phishing and brand impersonation in India’s crypto space. CoinDCX has warned that impersonation and domain-squatting attacks have become increasingly common as criminals attempt to capitalize on public trust in recognizable platforms. The company said it has logged thousands of impersonation attempts, with more than 1,212 fake sites impersonating its coindcx.com domain reported across a period spanning 2024 to early 2026. The episode reflects a broader, ongoing problem of deceptive online schemes that target crypto users in India.
Broader risk environment for investors and Web3
Experts note that the Indian market is contending with a surge in online investment scams. Data cited by Insights IAS from India’s Ministry of Home Affairs indicate that investment scams accounted for about 76% of all financial losses in 2025. On a global scale, Web3 platforms faced substantial losses from hacks and exploits in 2025—reported at around $3.95 billion—underscoring the risk environment facing users and operators alike.
CoinDCX’s trajectory amid growth and scrutiny
Founded in 2018 and based in Mumbai, CoinDCX has established itself as one of India’s leading crypto exchanges. Its valuation rose to about $2.45 billion following a funding round that included Coinbase Ventures in October 2025, marking a high-profile milestone for Indian crypto infrastructure. The exchange has also faced its share of security incidents; in July 2025, attackers reportedly stole roughly $44 million from an internal operational account, a breach that CoinDCX described as one of the month’s largest losses, while stressing that customer assets remained unaffected. The episode added to concerns about internal controls and security governance within crypto firms, even as the platform continued to push for mainstream adoption and regulatory clarity.
As authorities continue to investigate the latest allegations, observers will be watching for official statements from Thane Police and any subsequent charges or clarifications. The case could influence how regulators in India approach exchange transparency, user protection, and branding risks, particularly as the country charts its path toward broader crypto participation and governance.
What remains uncertain is how the investigation will unfold and what it could mean for CoinDCX’s brand and user trust in the near term. Investors, users, and builders should monitor regulatory responses, updates from law enforcement, and how exchanges reinforce anti-impersonation measures as part of a broader push for safer digital finance in India.


Brazil’s new Finance Minister, Dario Durigan, has decided to delay a public consultation on crypto taxation.
Summary
- Brazil’s Finance Minister halts crypto tax consultation to avoid election-year controversy.
- Durigan shifts focus to tech regulation and financial reforms, postponing crypto tax issues.
- Brazil remains the largest crypto market in Latin America despite tax consultation delay.
At the same time, this move comes as the government shifts its focus toward the October presidential election. Durigan, who took office last Friday, aims to avoid controversial tax measures during this politically sensitive period.
Durigan’s decision to pause the consultation on crypto taxation is seen as part of a broader fiscal delay strategy. The consultation was expected to address the tax treatment of crypto flows, particularly those involving stablecoins.
The Brazilian central bank had recently finalized rules that brought crypto service providers under financial sector regulations, requiring them to obtain operational authorization. These rules also placed stablecoin transactions and virtual assets used for international transfers under foreign exchange market oversight.
The Finance Ministry consultation was seen as the next step in Brazil’s evolving crypto framework, but Durigan’s decision to shelve it signals that tax measures will not be a priority during an election year. The sources close to the matter indicated that Durigan aims to conserve political capital and avoid potentially divisive issues in Congress.
Instead of crypto-related taxation, Durigan’s legislative priorities will center around big tech regulation, financial institution crisis management, and the Redata data center investment program. These issues align with his broader goal of driving economic development and fostering a favorable business environment in Brazil.
The delay in the crypto tax consultation is also part of a wider pause on fiscal proposals, including a previous plan to end tax exemptions on investment securities. This proposal, which failed to gain traction in Congress last year, may be postponed until after the 2026 presidential mandate.
Moreover, Brazil remains the largest crypto market in Latin America, ranking fifth globally in the Chainalysis Global Crypto Adoption Index. The country has seen increased institutional interest in crypto, with major investments such as Paradigm’s $13.5 million Series A funding for the stablecoin startup Crown.
Despite the tax consultation being on hold, crypto service providers must still meet the compliance deadline set for November 2026.


A stablecoin linked to the crypto project Resolv Labs, Resolv USR (USR), has lost its peg to the US dollar after an attacker exploited the token’s contract.
Summary
- Resolv USR lost its peg after an attacker minted millions of unbacked tokens.
- The hacker quickly converted the minted tokens into stablecoins and Ether.
- Resolv Labs has paused operations and is investigating the exploit, with a recovery plan underway.
Meanwhile, the attacker was able to mint millions of tokens without backing, leading to a sharp devaluation of the token. Resolv Labs has paused the protocol to prevent further damage and is working on a recovery plan.
Resolv Labs confirmed the exploit on Sunday, explaining that an attacker had minted 50 million USR tokens using $100,000 worth of the stablecoin USDC. Crypto security company PeckShield later reported that the attacker also managed to mint an additional 30 million USR tokens. The vulnerability in USR’s contract allowed the attacker to create unbacked tokens, contributing to the token’s depeg from the US dollar.
According to D2 Finance, the minting function in the contract was compromised. The company suspects that either the oracle was manipulated, the off-chain signer was compromised, or the amount validation process was flawed, enabling the minting of excess tokens.
After the exploit, the attacker moved the newly minted USR tokens to various crypto protocols, swapping them for stablecoins like USDC and USDt, and then converting them into Ether (ETH). This aggressive exit strategy caused USR’s value to plummet. The token fell as low as 50 cents, and liquidity issues and slippage worsened across protocols. On Curve Finance, the token briefly crashed to 2.5 cents.
At the time of writing, USR was trading around 87 cents, still approximately 13% below its intended $1 peg. The token had a rapid price recovery on Curve Finance, climbing to 84.5 cents after hitting its low point at 2:38 am UTC.
Resolv Labs has paused all protocol functions to prevent further malicious activity. The team is actively investigating the exploit and working on a recovery plan.
The exploit comes at a time when crypto-related hacks have decreased, with $49 million lost in February compared to $385 million in January. However, the attack highlights the continued risks and vulnerabilities within the crypto space, especially in decentralized finance protocols.


The U.S. Commodity Futures Trading Commission (CFTC) has provided more details on its pilot program that allows cryptocurrencies to be used as collateral in derivatives markets. The new guidance was issued in response to frequently asked questions about the program that began last year.
Summary
- CFTC allows crypto as collateral in derivatives, following a pilot program.
- FCMs must apply a 20% capital charge for Bitcoin and Ether positions.
- Crypto cannot be used for uncleared swaps, but is allowed for cleared transactions.
The CFTC’s recent notice outlines the procedures for futures commission merchants (FCMs) wishing to participate in the pilot program. FCMs are required to file a notice with the Market Participants Division and specify the date they will begin accepting crypto assets as margin collateral. This development is part of the CFTC’s ongoing efforts to integrate crypto assets into traditional financial markets.
The CFTC’s pilot allows for the use of crypto as collateral in derivatives transactions, a move that aligns with the crypto industry’s push for 24/7 trading and immediate settlement. The guidance issued in December clarified which tokenized assets can be used as collateral and how they should be valued and calculated for trading positions.
Capital Charges and Aligning with SEC Guidelines
The CFTC made it clear that its guidance on capital charges would align with the Securities and Exchange Commission (SEC). Futures commission merchants must apply a 20% capital charge for positions in Bitcoin and Ether, while stablecoins will carry a 2% charge. This move is aimed at ensuring that both agencies maintain consistent regulatory approaches to crypto.
During the first three months of the pilot, FCMs can only accept Bitcoin, Ether, and stablecoins as collateral. They are also required to file weekly reports detailing the total amount of crypto held across customer account types. After three months, other cryptocurrencies can be accepted as collateral, and the reporting requirements will be lifted.
The CFTC also specified that proprietary payment stablecoins are the only ones that can be deposited as residual interest in customer segregated accounts. Additionally, the use of crypto and stablecoins as collateral for uncleared swaps is prohibited.
Crypto assets cannot be used as collateral for uncleared swaps. However, derivatives clearing organizations can accept Bitcoin, Ether, and stablecoins as initial margin for cleared transactions if the assets meet CFTC’s credit, market, and liquidity risk requirements.


Kalshi, a prediction market company, has faced a temporary setback in Nevada. A state judge issued a temporary restraining order, blocking the company from operating for 14 days. The decision follows concerns that Kalshi’s event contracts might violate Nevada’s gambling laws.
Summary
- Kalshi faces a 14-day ban in Nevada after violating the state’s gambling regulations.
- Nevada regulators claim Kalshi’s event contracts are unlicensed gambling under state law.
- Kalshi fights back in multiple states, including Arizona and Massachusetts, over illegal gambling accusations.
On Friday, Carson City District Court Judge Jason Woodbury granted a temporary restraining order, siding with the Nevada Gaming Control Board’s motion to block Kalshi. This comes after the company offered event contracts related to sports, elections, and entertainment, which Nevada regulators view as a form of unlicensed gambling.
The court ruling states that Kalshi is prohibited from offering such contracts in Nevada, as these are considered “sports pools” under state law. Kalshi, however, has not responded to the ruling.
Nevada Gaming Control Board Chair Mike Dreitzer emphasized the state’s responsibility to protect the public, asserting that prediction markets like Kalshi could facilitate illegal gambling.
“Prediction markets, to the extent they facilitate unlicensed gambling, are illegal in Nevada,” Dreitzer said in a statement to Reuters.
Kalshi had argued that its contracts fall under the jurisdiction of the Commodity Futures Trading Commission (CFTC), not Nevada’s gaming regulations. The company has fought similar accusations in other states, asserting that its activities are federally regulated.
However, Judge Woodbury rejected Kalshi’s defense, stating that the legal authority currently favors Nevada’s stance. The court’s decision sets a precedent for ongoing legal battles regarding prediction markets and their regulation across state lines.
Moreover, Kalshi is currently engaged in multiple legal disputes with state regulators. This includes a case in Massachusetts, where a state judge banned the company from offering sports event contracts, though this ban was later lifted on appeal.
Additionally, Arizona has filed criminal charges against Kalshi, accusing the company of running an illegal gambling operation. Kalshi CEO Tarek Mansour has labeled these charges as “total overstep.”


CoinDCX, an Indian cryptocurrency exchange backed by Coinbase, is embroiled in a fraud case involving its founders, Sumit Gupta and Neeraj Khandelwal.
Summary
- CoinDCX founders questioned over a $75K fraud involving fake websites impersonating the platform.
- Over 1,200 websites impersonating CoinDCX were reported, highlighting rising cyber fraud in India.
- Investment scams accounted for 76% of all financial losses in India in 2025, according to reports.
Meanwhile, the founders were questioned by authorities following allegations of their involvement in a crypto investment scam. However, CoinDCX denies the accusations and attributes the fraud to impersonators using its brand for fraudulent activities.
The controversy started after a complaint from a 42-year-old insurance consultant, who claimed to have lost around 71 lakh rupees (roughly $75,000) after investing in a fake website posing as CoinDCX. The Thane Police reportedly arrested Gupta and Khandelwal on allegations of criminal breach of trust. However, other reports suggested that the founders were merely questioned by the authorities rather than arrested.
CoinDCX responded to the claims, stating that the complaint was part of a broader scheme by fraudsters who impersonated the exchange. The company clarified that it had no connection to the fake website and assured the public that funds were diverted by external parties unrelated to the exchange.
CoinDCX has emphasized that brand impersonation and cyber fraud are growing issues in India’s digital finance sector. The exchange stated that it is fully cooperating with law enforcement authorities in their investigation and stressed the importance of educating users about online fraud.
The company revealed that between April 2024 and January 2026, over 1,200 websites had impersonated its domain. This highlights the increasing risks of phishing attacks targeting crypto users in India, with CoinDCX working to combat such fraud.
A Broader Issue of Investment Scams
The case comes amid a rise in investment scams in India, which accounted for 76% of all financial losses in 2025, according to data from the Ministry of Home Affairs. Globally, Web3 platforms also faced significant losses due to hacking and exploitation, amounting to nearly $4 billion in 2025.
CoinDCX, founded in 2018, is one of India’s leading crypto exchanges, with a valuation of $2.45 billion after an investment from Coinbase Ventures in 2025. Despite the recent controversy, the platform remains committed to maintaining user security and combating fraudulent activities.

Tokyo Metro Stock: Defensive Infrastructure With Yen Upside (OTCMKTS:TKMTY)

David Schwartz joins XRP-Solana meme war on X
10 Western Movies Absolutely Anyone Can Enjoy


-

 Tech7 days ago
Your Legally Registered ‘Motorcycle’ Might Not Count Under Proposed US Law
-

 Fashion2 days ago
Weekend Open Thread: Adidas – Corporette.com
-

 Politics2 days ago
Jenni Murray, Long-Serving Woman’s Hour Presenter, Dies Aged 75
-
 Tech5 days ago
Are Split Spacebars the Next Big Gaming Keyboard Trend?
-

 Crypto World14 hours ago
Best Crypto to Buy Now: Strategy Just Spent $1.57 Billion on Bitcoin During Fear While Early Investors Quietly Enter Pepeto for 150x Potential
-

 News Videos4 days ago
RBA board divided on rate cut, unusually buoyant share market | Finance Report | ABC NEWS
-

 Crypto World15 hours ago
Bitcoin Price News: Bhutan Sells $72 Million in BTC Under Fiscal Pressure, but the Smart Money Entering Pepeto Sees What the Market Does Not
-

 Business7 days ago
Search for Savannah Guthrie’s Mother Enters Seventh Week with No Arrests
-
 Crypto World2 days ago
NIO (NIO) Stock Plunges 6.5% as Shelf Registration Sparks Dilution Worries
-

 Business6 days ago
Australian shares drop as Iran war enters third week
-

 Crypto World6 days ago
Crypto Lender BlockFills Enters Chapter 11 with Up to $500M in Liabilities
-

 Politics4 days ago
The House | The new register to protect children from their abusers shows Parliament at its best
-

 Fashion6 days ago
25 Celebrities with Curly Hair That Are Naturally Beautiful
-

 Tech2 days ago
inKONBINI Lets You Spend Summer Days Behind the Register
-

 Crypto World4 days ago
Canada’s FINTRAC revokes registrations of 23 crypto MSBs in AML crackdown
-
 Politics5 days ago
Real-time pollution monitoring calls after boy nearly dies
-
 NewsBeat4 days ago
Residents in North Lanarkshire reminded to register to vote in Scottish Parliament Election
-

 Business6 days ago
Meta planning major layoffs as AI spending and automation reshape workforce
-

 News Videos4 days ago
PARLIAMENT OF MALAWI – PAC MEETING WITH REGISTRAR OF FINANCIAL ON AMARYLLIS HOTEL – INQUIRY LIVE
-
 Crypto World7 days ago
U.S. Oil Companies Post Record Profits as Oil Prices Break $100
You must be logged in to post a comment Login