
Crypto World
Why $70,000 Is the Most Critical Level Right Now
Bitcoin continues to face intense selling pressure, breaking below its yearly lows amid escalating geopolitical tensions between the United States and Iran. This risk-off backdrop has accelerated downside momentum, and while further weakness remains possible, the market is increasingly approaching levels that could trigger a short-term consolidation phase in the days ahead.
Bitcoin Price Analysis: The Daily Chart
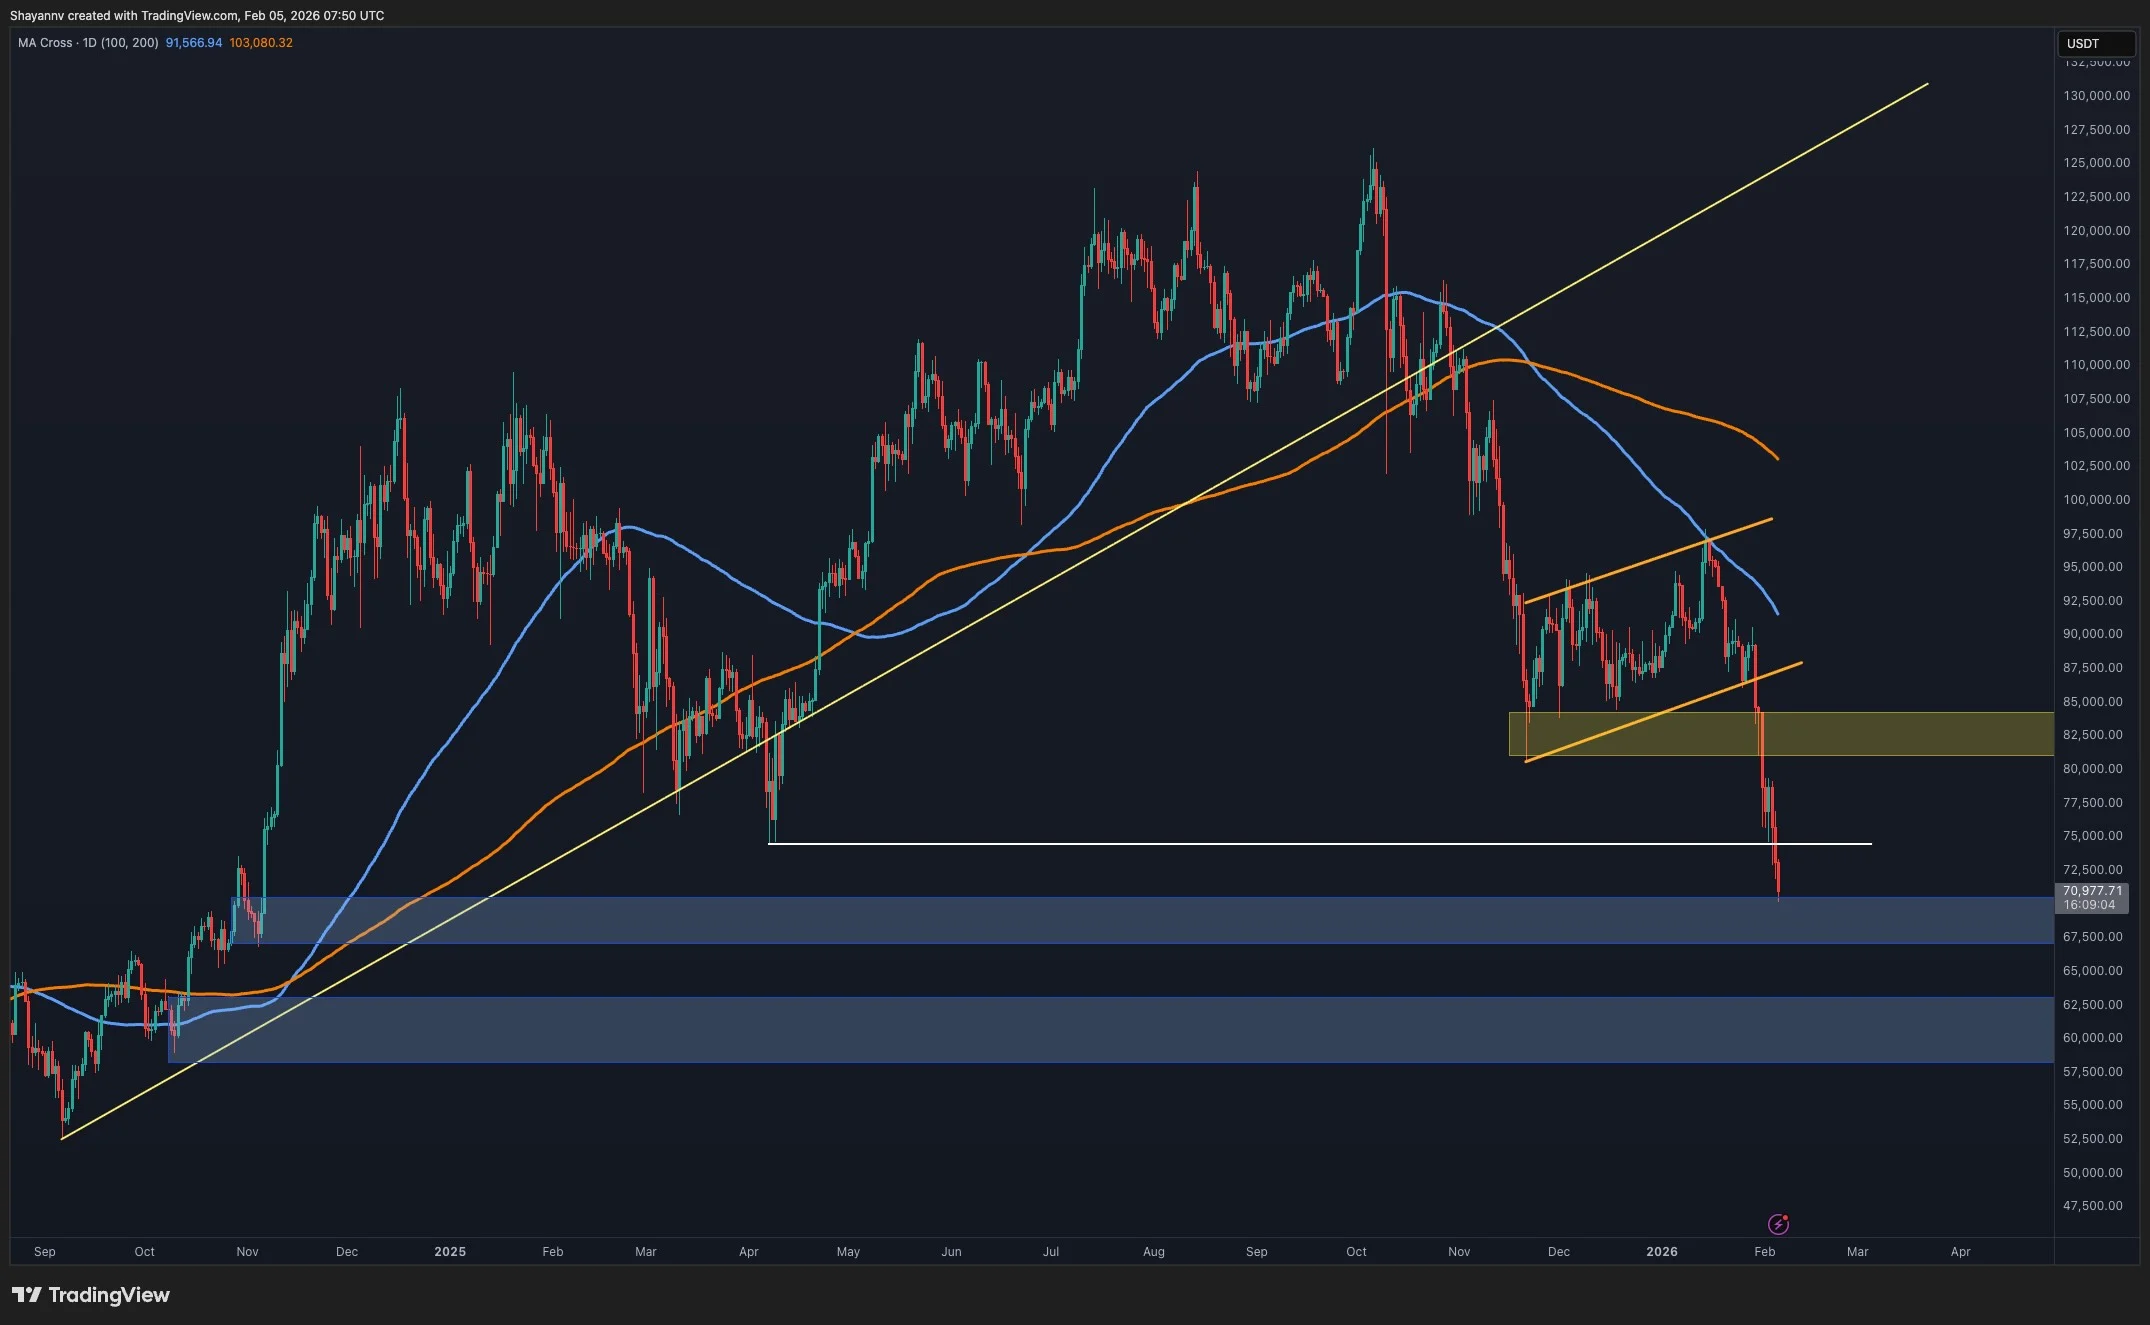
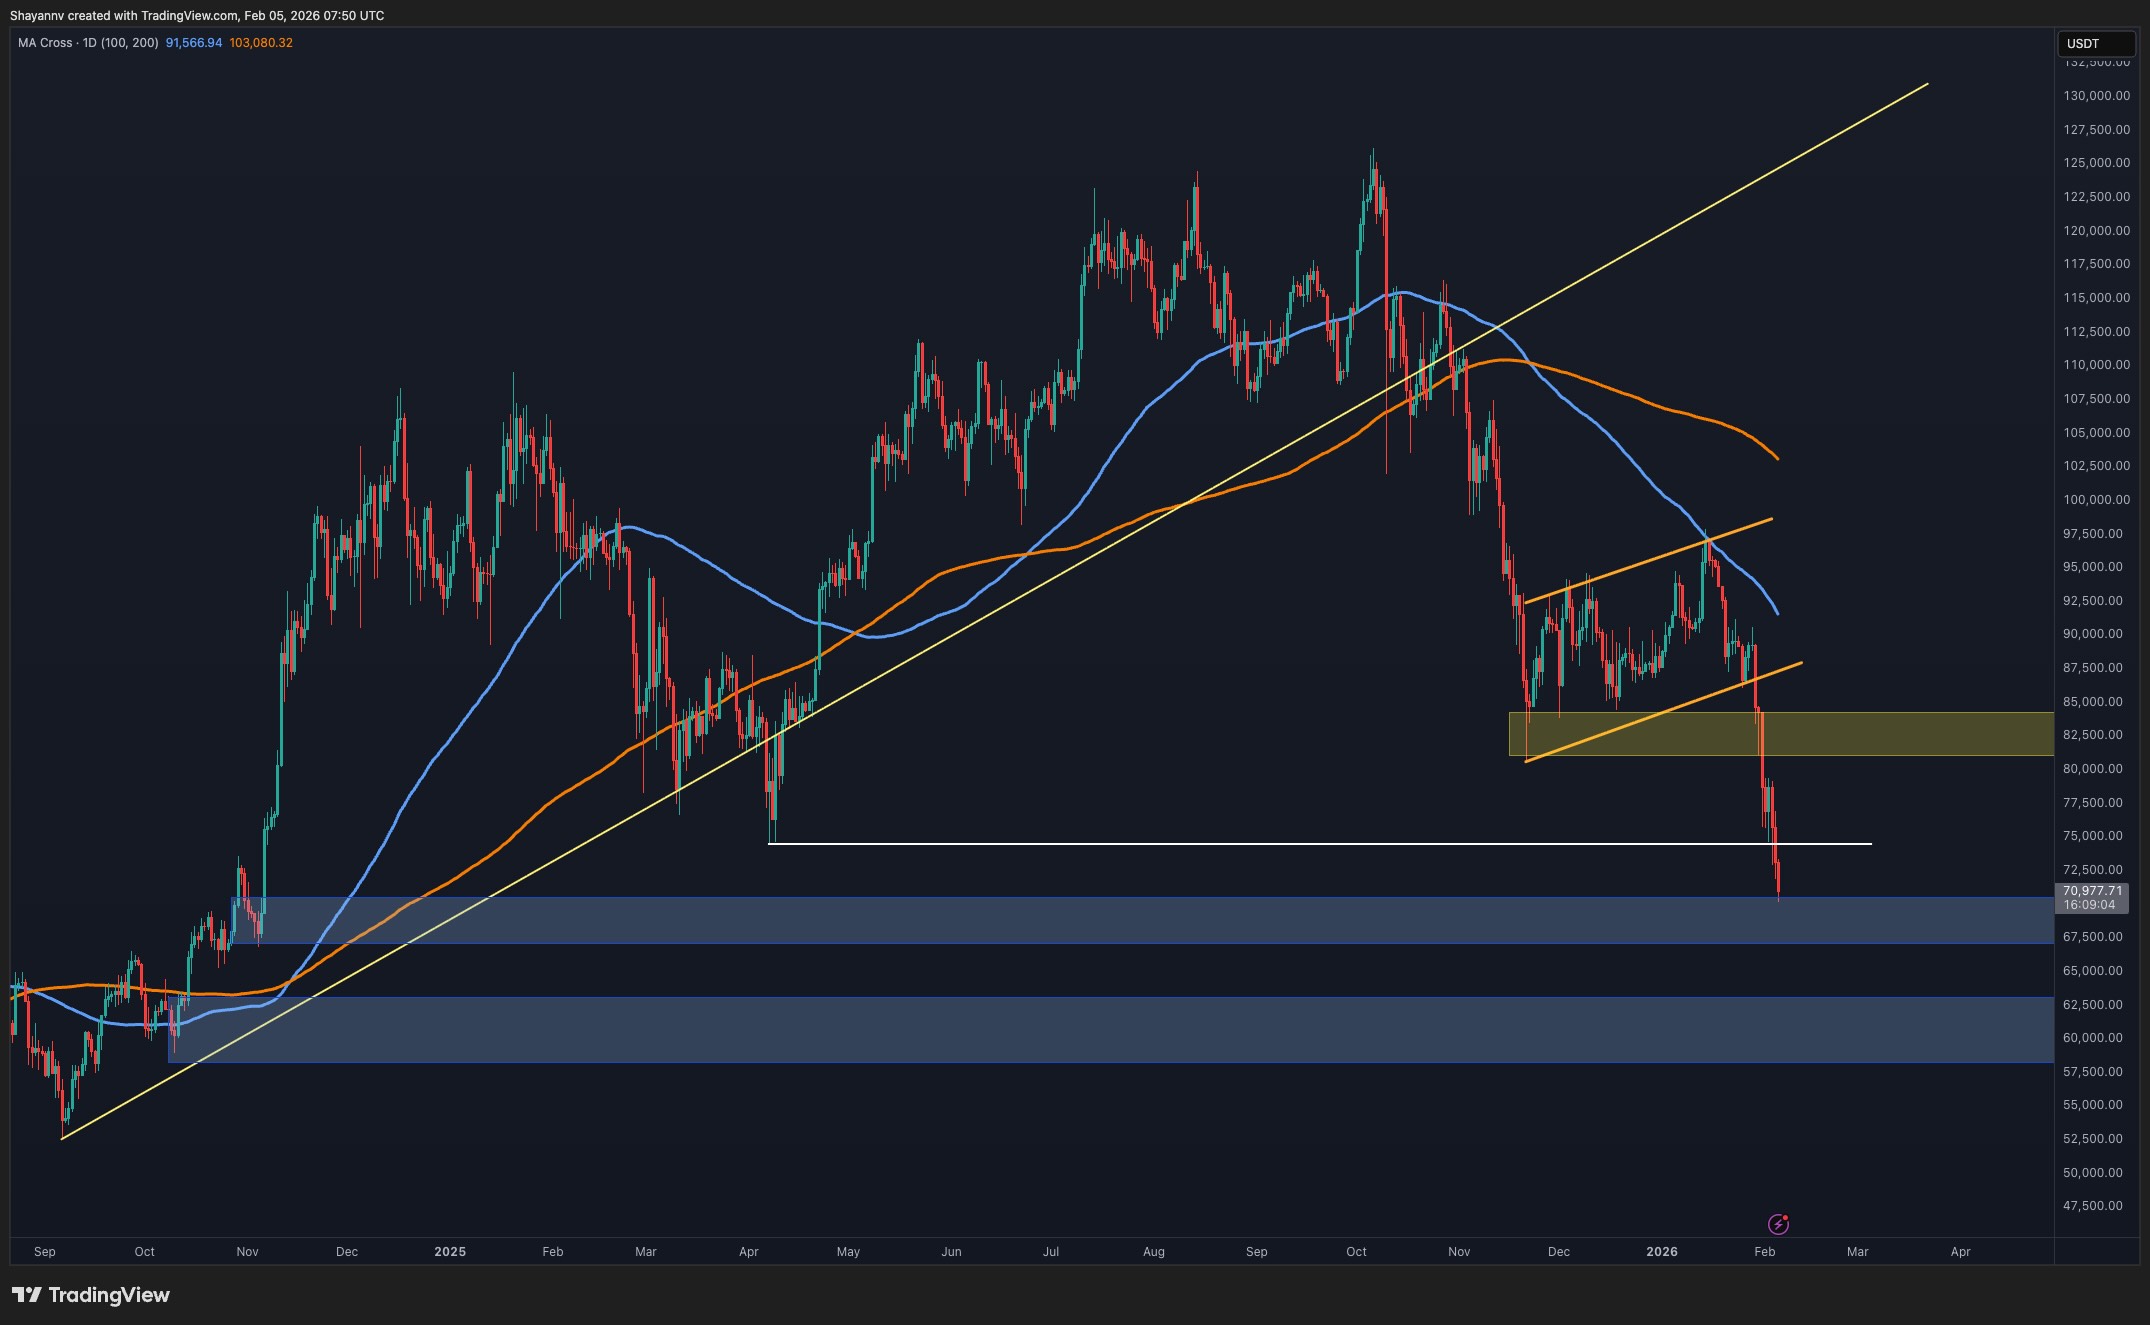
On the daily timeframe, BTC has been hit by aggressive sell-side activity, driving the price decisively below key support levels, including the major yearly low at $74K. The decline has now extended into the $70K psychological zone, a historically significant area where resting demand and dip-buying interest are likely to emerge.
If this demand region succeeds in absorbing selling pressure and fresh buyers step in, the current downtrend may pause, allowing the market to transition into a corrective consolidation phase. In that scenario, the price action would likely stabilize within a $70K–$80K range as the market cools off. However, a clear failure to hold the $70K level would expose Bitcoin to another downside leg, with the next notable support located near the $63K region.
BTC/USDT 4-Hour Chart
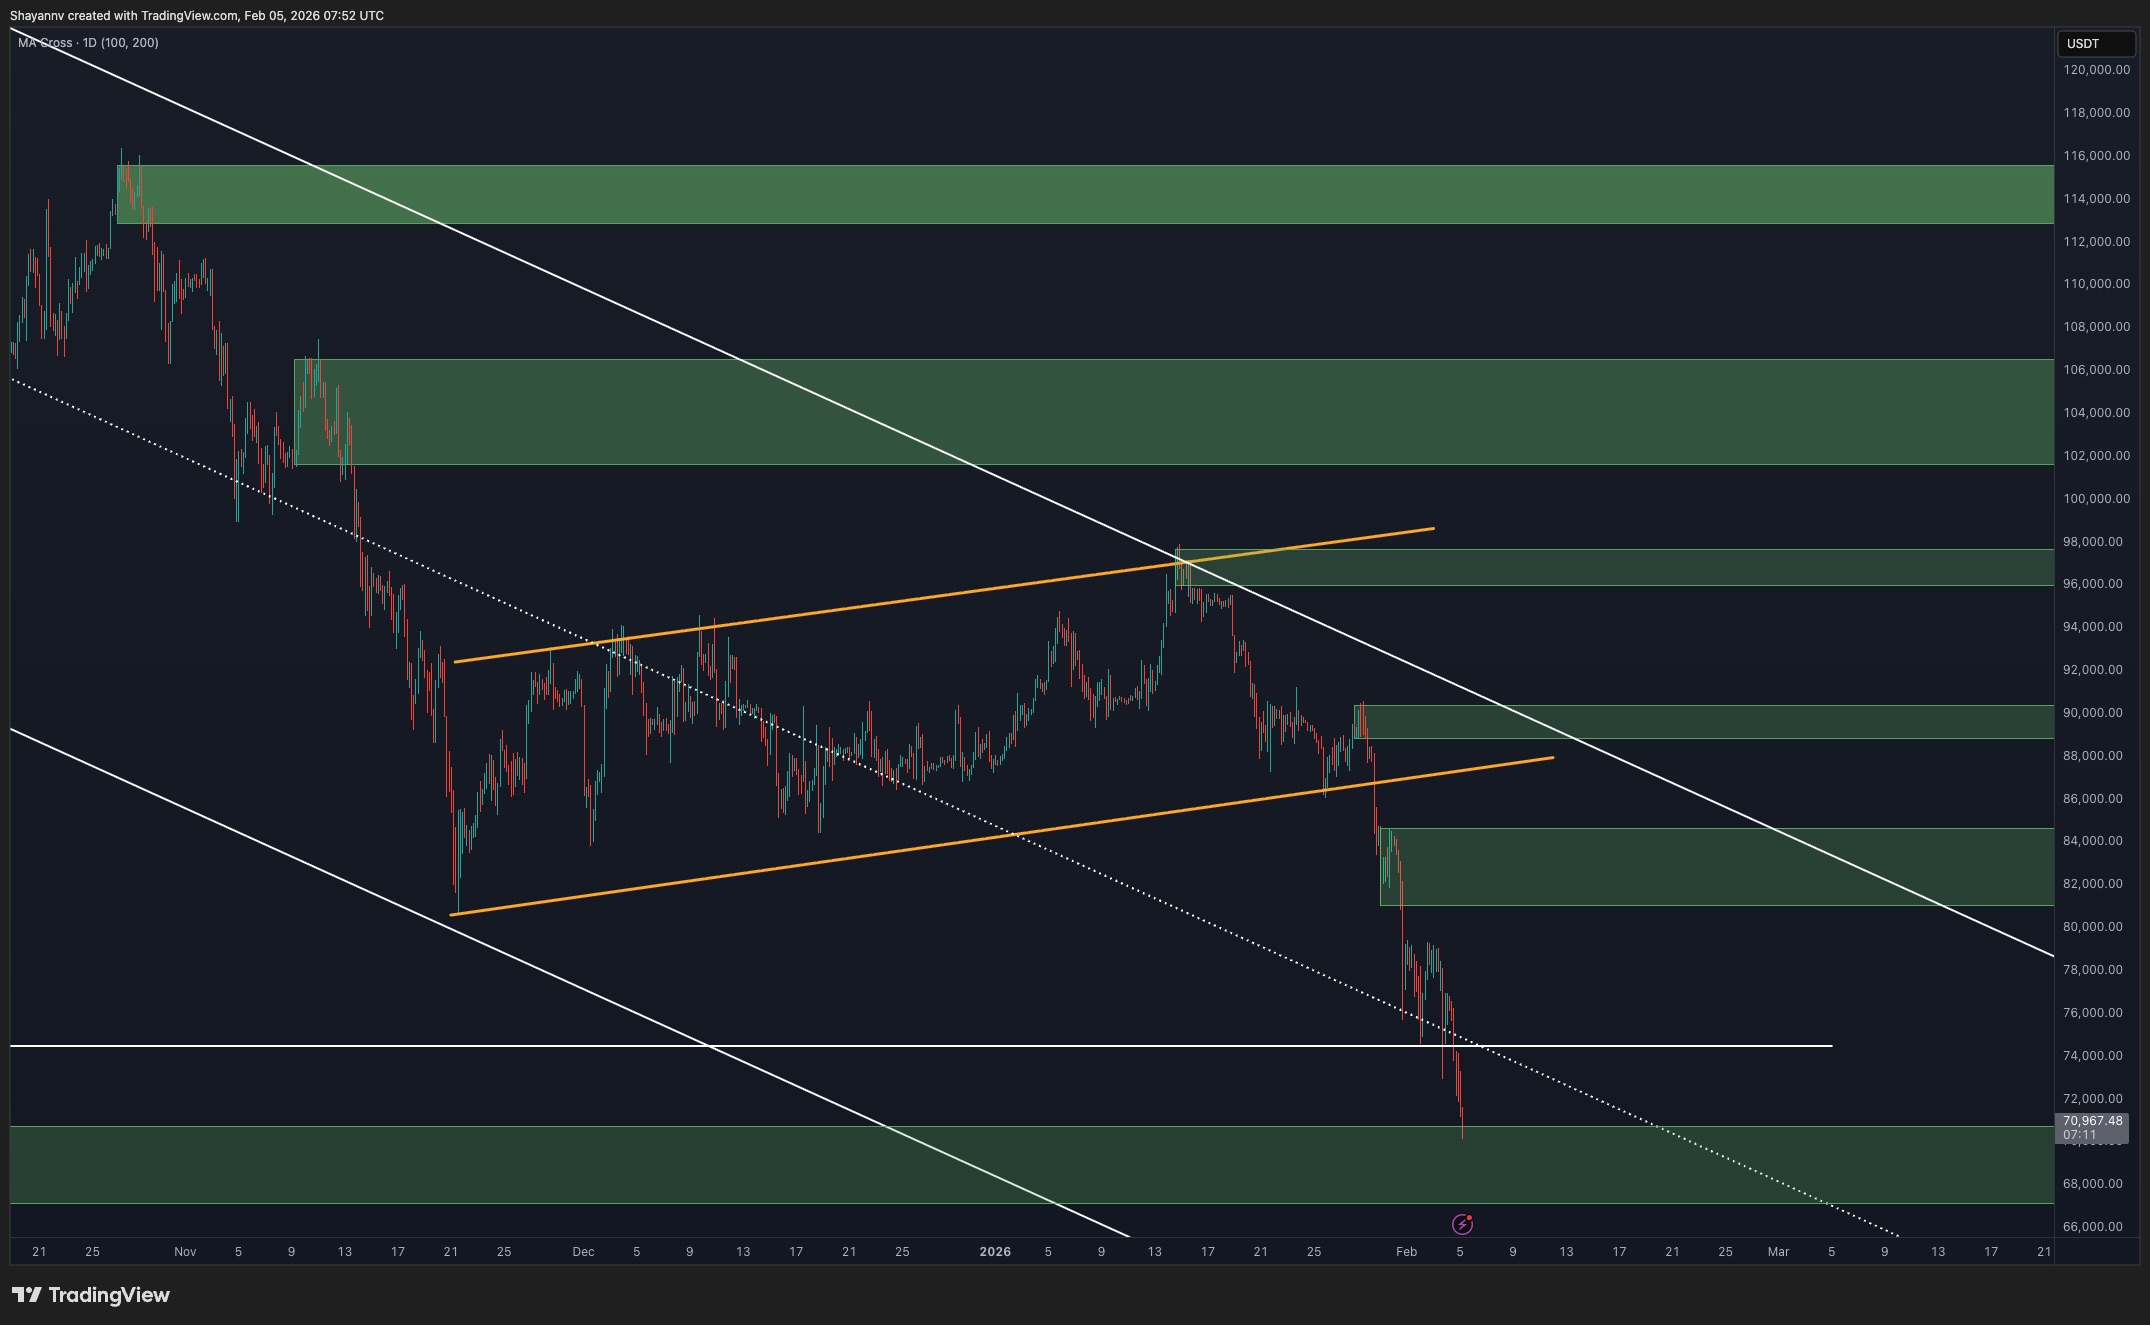
From a lower-timeframe perspective, the 4-hour chart shows Bitcoin trading within a well-defined bearish channel, confirming a structurally weak market environment. The asset recently broke below the channel’s midline near $74K, triggering an impulsive sell-off toward the lower boundary of the structure.
Despite the sharp decline, Bitcoin has now reached a critical support level at $70K, which also carries strong psychological importance for market participants. Given the speed and intensity of the recent move, the market is likely in need of a consolidation and corrective phase. As a result, the most probable near-term scenario is choppy, range-bound price action around the $70K support until a clearer directional signal emerges. In the event of a relief bounce, the $75K and $80K supply zones stand out as the primary upside targets.
Sentiment Analysis
The futures average order size chart shows a notable shift in participant behavior as Bitcoin trades around the $70K region. The appearance of green dots at this level signals renewed whale participation, indicating that large players are actively engaging when price revisits this zone. Importantly, this is not an isolated event. The previous two occasions when Bitcoin traded around the same price range were also accompanied by green dots, reinforcing the idea that this area has historically attracted whale interest.
This repeated pattern suggests that the $70K region is perceived by large market participants as a favorable accumulation or positioning zone rather than an area for aggressive distribution. In contrast to periods dominated by red dots, which reflect retail-heavy or reactive selling, the return of green dots points to more strategic, higher-conviction activity in the futures market.
If this behavior persists and whale participation continues to strengthen around current levels, it increases the probability of a short- to mid-term rebound. Large orders entering at these prices can absorb selling pressure and act as a catalyst for stabilization, potentially setting the stage for a relief move higher if broader market conditions allow.

SECRET PARTNERSHIP BONUS for CryptoPotato readers: Use this link to register and unlock $1,500 in exclusive BingX Exchange rewards (limited time offer).
Disclaimer: Information found on CryptoPotato is those of writers quoted. It does not represent the opinions of CryptoPotato on whether to buy, sell, or hold any investments. You are advised to conduct your own research before making any investment decisions. Use provided information at your own risk. See Disclaimer for more information.

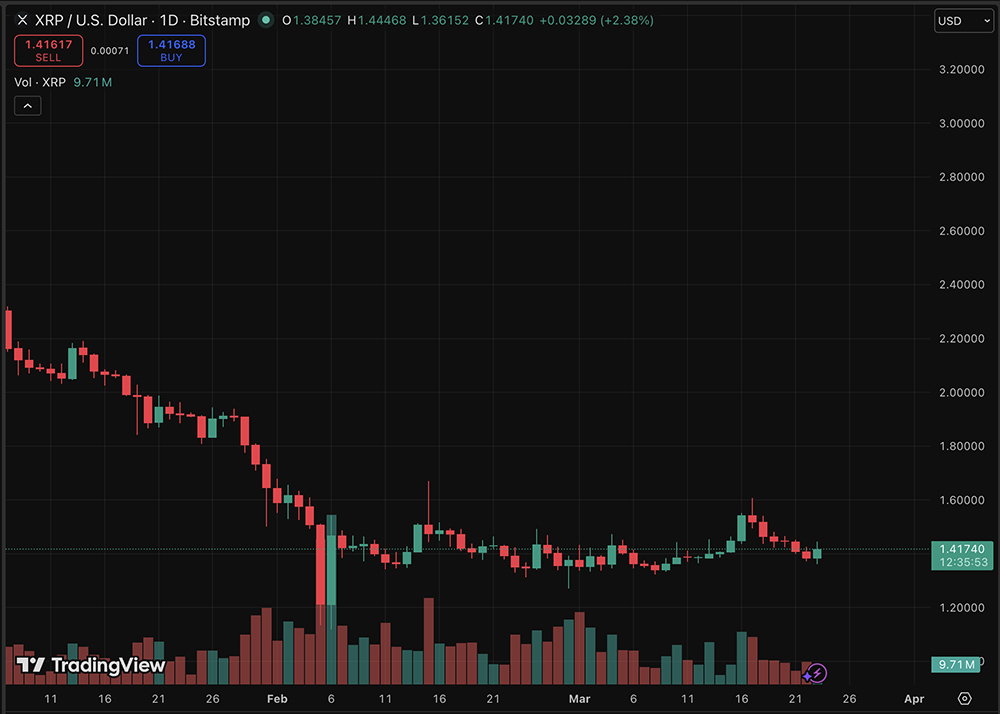
XRP is trading at the $1.40 price level, down just 1% over 24 hours, as the prediction says crypto markets will pull back further despite new U.S. regulatory clarity classifying the token as a digital commodity.
The classification, confirmed by the SEC and CFTC, handed bulls a headline victory, but the rally fizzled fast. We hit a wall of macro aggression: a hawkish Federal Reserve stalling rate cuts and a geopolitical oil spike to above $100 per barrel, before dropping this hour to under $90.
The $1.40 level, once a floor, has turned into a ceiling and a battleground for the week ahead.

XRP Price Prediction: Will Ripple Reclaim $1.50 Amid Macro Headwinds?
The technical landscape for Ripple’s native token is precarious. While the asset benefits from established support following the May 2025 SEC settlement, the failure to hold above $1.45 suggests buyer exhaustion. Trading volumes have thinned as capital rotates into commodities; oil prices above $112 act as a liquidity sponge, soaking up risk capital.
If bulls cannot reclaim $1.45 within 48 hours, the next logical support sits significantly lower. Conversely, a clean break above $1.45, fueled perhaps by institutional flows into spot ETFs, could target $1.55.
On-chain data signals XRP may be near a bottom, but the macro environment demands caution. With rates stuck at 3.50%-3.75%, the cost of capital remains high, dampening the leverage needed for a sustained breakout.
BREAKING: — Watcher.Guru (@WatcherGuru) March 18, 2026
 Federal Reserve leaves interest rates unchanged, remains at 3.50% – 3.75%.
Traders should watch the $1.30 support level closely. A breakdown here validates the pressure seen since the start of 2026, potentially exposing the asset to a deeper flush toward $1.30. Is the market pricing in a delay to altcoin season? The data points to a temporary risk-off sentiment.
Maxi Doge Targets Early Mover Upside as XRP Tests Key Levels
While major cap assets like XRP wrestle with interest rate realities and oil shocks, a subset of traders is rotating into high-velocity presales unaffected by Brent crude charts. Capital is seeking volatility in new narratives. Enter Maxi Doge ($MAXI), a new entrant aggressively targeting the “degen” trading subculture with a distinct leverage-king aesthetic.
The project has raised more than $4,6 million thus far, priced at $0.000281 per token and a staking reward bonus of 66%. Unlike standard meme tokens that rely solely on cute imagery, Maxi Doge integrates holder-only trading competitions and a “Maxi Fund” treasury designed for liquidity injections. It appeals to the high-risk demographic with the tagline “Never skip leg-day, never skip a pump.”
Meme coin liquidity is thinning elsewhere, yet $MAXI continues to attract inflows due to its specific market fit: a 240-lb canine juggernaut embodying a 1000x leverage trading mentality. For traders exhausted by XRP’s slow grind against the $1.40 resistance, this presale offers a high-variance alternative built for the current volatility. However, early-stage tokens carry inherent risks; dynamic APY staking provides an incentive for holding, but market timing remains critical.
The post XRP Price Prediction: SEC Clarity Meets Fed and Oil Shock as We Watch 1.40 appeared first on Cryptonews.


Crypto fear index slumps as investors dump XRP, SOL and AAVE, rotate into cash and stables, and test whether extreme fear sets up the next recovery leg.
Summary
- Crypto Fear & Greed Index falls to 8, locking in one of the deepest “extreme fear” readings of this cycle as traders dump risk across majors like XRP, SOL and DeFi plays such as AAVE.
- Total crypto market cap holds around $2.36 trillion even as investors aggressively de‑risk and rotate out of high‑beta altcoins into cash and stablecoins.
- Analysts warn that “extreme fear grips the market,” but note that structurally, such levels have historically preceded major recovery phases in both Bitcoin and large altcoins.
Crypto investors woke up to a sharply darker mood as the Crypto Fear & Greed Index fell to 32, cementing the market’s return to “extreme fear” territory after weeks of mounting macro and geopolitical pressure. The single‑digit reading underscores how quickly sentiment has flipped from cautious optimism to outright risk aversion, even though the total cryptocurrency market capitalization still hovers near $2.36 trillion.
According to data provider Alternative.me, a score of 8 sits at the bottom of the index’s 0–100 range and signals that “investors are extremely worried” about near‑term downside. A flash note from CoinEx described the latest move bluntly: “Crypto Fear & Greed Index drops to 8, extreme fear grips the market,” highlighting that selling has been broad‑based across spot and derivatives venues, with names like XRP and SOL now firmly in correction territory.
Despite the collapse in sentiment, several trackers show aggregate market cap holding or even rising slightly, with some estimates pointing to roughly $2.36 trillion in total crypto value after a modest 2–3% 24‑hour gain. As one March market recap put it, “the total cryptocurrency market capitalization has actually increased by about +2.87% in the last 24 hours, reaching approximately $2.36 trillion,” suggesting that fear and flows are no longer perfectly aligned.
Within that headline number, however, rotation has been brutal under the surface. Large‑cap altcoins such as XRP (XRP) and SOL (SOL) have seen outsized intraday swings as traders shed beta, while DeFi bellwether AAVE (AAVE) has become a high‑conviction short for some funds concerned about leverage and protocol risk. Milk Road’s composite sentiment gauge echoes that bifurcation: the market has spent roughly 62% of the past eight years in “fear” or “extreme fear,” yet major assets have still trended structurally higher over that period. “The boilerplate interpretation,” the site notes, is simple – “be greedy when others are fearful, and be fearful when others are greedy.”
The latest plunge to 8 extends what some analysts describe as one of the longest “fear streaks” since at least 2019, with social metrics now matching the kind of stress last seen during mid‑2022 liquidations. In an early‑March note titled “The Heartbeat of the Crypto Market,” one strategist wrote that escalating conflict and the effective closure of key oil chokepoints have pushed investors into “capital preservation mode,” driving the index down from 22 to low‑teens readings in a matter of days.
For traders, the key question is whether this 8 print marks a capitulation low or just another step down in a longer deleveraging cycle that continues to pressure altcoins and DeFi names like AAVE. While history offers no guarantees, previous extreme fear clusters have often coincided with discounted entry points for long‑term capital — a dynamic that some institutional desks are already watching closely as they weigh when to step back into XRP, SOL and the broader market.
Crypto World
Stablecoin yield in crypto Clarity Act won’t allow rewards on balances, latest text says


Crypto industry insiders got their first look at the revised market structure bill in the Senate, and the opening impression was that the language on allowable stablecoin yield was overly narrow and unclear, according to a person familiar with the current draft.
The new language, which was announced Friday by Senators Angela Alsobrooks and Thom Tillis, would ban yield payments for simply holding a stablecoin. It would also restrict any approach that makes the program in any way equivalent to a bank deposit, and it applies further limits to other potentially allowed activities, the person said, adding that the mechanics of determining activities-based stablecoin rewards is left uncertain.
The crypto industry got this first look at the revised section of the Digital Asset Market Clarity Act on Monday in a closed-door review on Capitol Hill in Washington, representing an attempt to clear a roadblock in the effort to get a hearing in the Senate Banking Committee. Bankers had insisted that stablecoin rewards look nothing like interest-bearing bank deposits, because they argued the competing product could hamstring the industry and strangle lending. So, the compromise will allow rewards programs on users’ stablecoin activities but not balances.
A similar version of the Clarity Act passed in the House of Representatives last year, and another version cleared a markup hearing in the Senate Agriculture Committee. The banking panel represents a big step that would get the legislation to a place where lawmakers could prepare a final, combined version that would get a vote of the overall Senate.
The stablecoin yield lobbying fight between the crypto sector and the banking industry had stifled progress on the legislation for a while. But it’s not the only sticking point. The industry will still need to see the final approach to oversight of the decentralized finance (DeFi) space, which had remained an area of concern for Democrats who had wanted to ensure illicit finance protections. And the Democrats have also insisted on a need for a ban on senior government officials profiting personally from the crypto industry — a provision aimed squarely at President Donald Trump.
Though the industry recorded a tremendous win last year when the Guiding and Establishing National Innovation for U.S. Stablecoins (GENIUS) Act became the first major U.S. law to govern a segment of the crypto industry, it was meant as the less important first step of a one-two policy approach that concludes with the Clarity Act.
That full-fledged arrival of crypto into the U.S. financial system will eliminate regulatory uncertainty for any investors who have been hesitant about involvement in the sector. Digital assets insiders believe it will open flood gates among institutional investors and developers who want to build atop the technology.

TLDR
- Aave DAO approved the Request for Comment proposal to begin discussions on deploying Aave V4 on Ethereum mainnet.
- The governance vote closed after four days with 100% support from participating members.
- The ARFC marks the first non-binding stage before a formal onchain Aave Improvement Proposal vote.
- Aave V4 introduces a modular Hub and Spoke architecture to unify liquidity and isolate risk.
- The Liquidity Hub will consolidate supplied assets while Spokes will set individual lending and collateral rules.
Aave DAO has approved a Request for Comment proposal to start discussions on deploying Aave V4 on Ethereum mainnet. The vote closed after four days with 100% support on Aave’s governance platform. The measure now moves the protocol closer to a binding onchain proposal and eventual rollout this year.
Aave DAO Backs Initial Governance Stage for V4
Aave DAO used its governance platform to pass the non-binding Aave Request for Comment proposal. The vote recorded full support after a four-day voting period. As a result, the process now advances to the next governance phase.
The ARFC serves as the first step in Aave’s decentralized governance framework. It allows contributors and token holders to refine technical and risk details before a binding vote. After community feedback, Aave Labs will submit an Aave Improvement Proposal for onchain approval.
Aave Labs, led by Stani Kulechov, will coordinate the next submission. The team will work with security and risk advisors to define final risk parameters. The snapshot proposal states that deployment preparations will continue during this review period.
Aave V4 Introduces Modular Hub and Spoke Architecture
Aave V4 represents the next major upgrade of the onchain lending protocol. The upgrade introduces a modular Hub and Spoke architecture to improve liquidity efficiency. The design aims to unify liquidity while isolating risk profiles.
According to official documentation, the Liquidity Hub will consolidate supplied assets into a single unified pool. Individual Spokes will connect to the Hub under distinct lending rules and collateral policies. Each Spoke will define its own risk parameters and user conditions.
The new structure addresses the issue of siloed liquidity within the protocol. It also allows markets to operate under separate risk frameworks while sharing liquidity depth. The snapshot proposal states, “Liquidity depth is maximized, risk is priced with precision, and a wider range of lending activity can be supported onchain.”
The documentation also confirms deeper integration of Aave’s native GHO stablecoin within V4. The upgrade will introduce a revamped liquidation engine to improve efficiency. Together, these changes aim to expand supported market structures within one framework.
Governance Changes and Security Review Shape Deployment
The governance move follows internal changes among core contributors. BGD Labs and Aave Chan Initiative announced plans to step back when their contracts expire. Their announcements followed Kulechov’s “Aave Will Win” proposal on governance restructuring.
Kulechov’s proposal calls for greater DAO control over Aave Labs’ revenue and intellectual property. In exchange, the DAO would manage a defined budget for operations and development. The proposal also urges stakeholders to prioritize Aave V4 deployment.
Kulechov has also called for streamlined governance procedures within the protocol. He has encouraged faster coordination between contributors and token holders. These proposals remain under discussion within the community.
Aave V4 has completed roughly 345 days of cumulative security review. The process included manual audits, formal verification, invariant testing, fuzzing, and a public security contest. The DAO ratified a $1.5 million security budget to support these efforts.


The largest Ethereum treasury company added another 65,341 ETH last week.
Bitmine Immersion Technologies, the publicly traded company pursuing what it calls the ‘Alchemy of 5%’ of Ethereum’s total supply, said its combined crypto and cash holdings have reached $11 billion as it ramps up purchases amid the U.S.-Iran conflict.
Chairman Thomas Lee framed ETH’s recent performance as evidence of crypto’s resilience during geopolitical turmoil. He noted that ETH has risen 18% since the Iran war commenced, outperforming equities, while gold, a traditional safe-haven asset, has fallen by more than 15%.
“Crypto is demonstrating itself to be a good ‘wartime’ store of value,” Lee said in the company’s weekly update.
As of March 22, Bitmine held 4,660,903 ETH, representing 3.86% of ETH’s total circulating supply of 120.7 million. The company said it acquired 65,341 ETH in the past week, an uptick from its prior weekly pace of 45,000–50,000 tokens.
Lee said the acceleration reflects his view that ETH is in the “final stages of the ‘mini-crypto winter.’”
Bitmine launched its Ethereum treasury strategy in late June 2025, when the former Bitcoin miner raised $250 million in a private placement backed by Founders Fund, Pantera, Galaxy Digital, and others — sending its stock up nearly 700%. By August, the firm had surpassed $6.6 billion in ETH holdings, becoming the world’s largest corporate Ethereum holder. It crossed the 2% supply threshold by September.
The company now claims the second-largest overall crypto treasury, behind Strategy Inc., which holds 761,068 BTC valued at roughly $52 billion.
Bitmine also holds 196 BTC, a $200 million stake in Beast Industries, a $95 million position in Eightco Holdings (ORBS), and $1.1 billion in cash.
Lee also pointed to momentum around the CLARITY Act, the crypto market structure bill that passed the House in July 2025 with bipartisan support. He cited Polymarket odds showing a 68% probability the legislation will be signed into law before year-end, calling it a “positive fundamental catalyst for Ethereum.”
The bill’s progress through the Senate has been slower, with stablecoin yield provisions emerging as the central sticking point between banks and crypto firms. President Trump has publicly pressured the banking industry over the dispute.
This article was written with the assistance of AI workflows. All our stories are curated, edited and fact-checked by a human.
TLDR:
- Silver dropped from $121.64 to $65 in 53 days, with 25% of the loss coming after Jane Street’s filing went public.
- Jane Street increased its SLV holdings by 500x in Q4 2025, quietly becoming the ETF’s largest shareholder ahead of the crash.
- SEBI fined Jane Street a record $570M for running a stock-buying scheme in India to profit from larger short options positions.
- No US regulator has demanded Jane Street’s full derivatives exposure in silver for January 29 and 30, the crash dates.
Silver has lost nearly 50% of its value in just 53 days, dropping from an all-time high of $121.64 to around $65. The sharp decline has drawn attention to Jane Street, a high-frequency trading firm with a documented history of controversial trading practices.
Analysts and market observers are now questioning the firm’s role in the crash, given its massive, undisclosed position in the silver ETF, SLV.
Jane Street’s Hidden Stake in SLV
In Q4 2025, Jane Street quietly accumulated 20.67 million shares of SLV, the world’s most liquid silver ETF. That figure is up from just 41,100 shares the quarter before — a 500x increase.
The position, valued at approximately $1.3 billion, made Jane Street the largest SLV holder, ahead of BlackRock and Morgan Stanley.
This stake was not publicly known while silver was rallying toward its January 29 peak. On January 30, silver collapsed 30% within 30 hours.
That was the worst precious metals crash since 1980. The CME raised margin requirements mid-crash, triggering further cascading liquidations.
The 13F filing revealing Jane Street’s position only became public on February 25. After that disclosure, silver dropped an additional 25%.
As Bull Theory posted on social media, “Silver hit ATH $121.64 on January 29, 2026. Today it sits at $65, a 46% collapse, and 25% of that drop happened AFTER February 25, 2026.”
A Pattern Documented in India and Crypto
Jane Street’s trading practices have already attracted regulatory scrutiny in two other markets. India’s SEBI issued a 105-page order against the firm, resulting in the largest fine in the regulator’s history. SEBI impounded $570 million from Jane Street after finding market manipulation across 18 expiry days.
In those sessions, Jane Street bought large amounts of index stocks in the morning to push prices higher. At the same time, it built short options positions 7.3 times larger than its stock exposure.
By afternoon, it offloaded the stocks, the index fell, and the options paid out. On one day, the firm reportedly lost $7.5 million on stocks while making $89 million on options.
In the crypto market, the bankruptcy administrator for Terraform Labs filed an 83-page federal lawsuit against Jane Street.
The lawsuit alleged the firm used non-public information to avoid over $200 million in losses tied to the $40 billion Terra/LUNA collapse. Blockchain forensics reportedly traced key wallet activity back to Jane Street through Coinbase records.
The Question No Regulator Has Asked
A 13F filing only discloses long equity positions. It does not show short positions, options exposure, or full derivatives books. That gap means Jane Street’s net silver position on January 29 and 30 remains unknown.
The physical silver backing SLV is held by JPMorgan. In 2020, JPMorgan paid $920 million to resolve CFTC charges related to eight years of precious metals market manipulation. That remains the largest CFTC sanction on record.
No US regulator has publicly demanded a full accounting of Jane Street’s complete silver derivatives exposure around the time of the crash.
As Bull Theory noted online, “If the India playbook was running in silver, the $1.3B ETF stake was just the cost. The options position on the other side was the profit.”
None of this has been proven in US courts, though the documented regulatory history raises questions that remain unanswered.
Strategy is increasingly turning to perpetual preferred stocks to fund its Bitcoin strategy, with the company adding 90,000 BTC to its balance sheet so far this year.
Michael Saylor’s Strategy has announced several capital-raising programs totaling $44.1 billion to fund Bitcoin purchases, including the sale of common shares and two of its dividend-paying equity vehicles.
Strategy plans to raise up to $21 billion by selling Strategy (MSTR) stock and another $21 billion from its high-yield perpetual preferred stock, Stretch (STRC), via new at-the-market programs, the company said in an 8-K filing to the US Securities and Exchange Commission on Monday.
Strategy also intends to sell up to $2.1 billion worth of Strike (STRK) — another of its perpetual preferred stock offerings. The company didn’t specify a timeline for the issuances, stating that shares may be sold “from time to time.”

Strategy has been marketing its securities as a way for investors to gain exposure to Bitcoin, which is currently down nearly 70% from its all-time high. The company is currently carrying an unrealized loss of 6.3% on its Bitcoin holdings.
Strategy’s revised ATM equity program enables it to sell more shares incrementally into the open market rather than relying on fewer large-scale capital raises from external investors, as it previously did through convertible debt.
Related: Bitcoin spot volumes fall to 2023 lows as BTC rallies remain news-led
Strategy’s preferred stocks, such as STRC and STRK, give investors monthly dividends while enabling Strategy to grow its Bitcoin holdings without issuing additional MSTR common shares.
Strategy added 90K BTC to its treasury in 3 months
Strategy said it bought 1,031 Bitcoin worth $76.6 million in its latest purchase on Monday, adding to its larger-than-usual purchases this month, which include 17,994 Bitcoin on March 9 and 22,337 Bitcoin on March 16 for a combined $2.9 billion.
Strategy now holds 762,099 Bitcoin worth $54 billion, having added nearly 90,000 Bitcoin to its treasury across the first three months of 2026.
Magazine: Big Questions: Can Bitcoin save you from the dreaded Cantillon Effect?

Bitcoin rose about 4% in minutes after news that U.S. President Donald Trump signaled a temporary de-escalation of the Iran conflict and a path toward negotiations. The move in traditional markets was mixed: oil briefly spiked before retreating, while the S&P 500 advanced, yet Bitcoin’s derivatives indicators continued to suggest a cautious posture and limited conviction for a sustained breakout above the recent resistance near $68,000.
Analysts pointed to a disconnect between the spot price bounce and what the derivatives market was signaling. Bitcoin futures were trading at a modest premium over the spot, a sign that demand for leveraged bullish bets remains restrained. The two-month futures were pricing in roughly a 2% annualized premium, well below the neutral band usually seen around 4% to 8%. That estreched premium implies market participants are not confident enough to press the gas on bullish exposure, even as BTC flirted with higher levels and briefly approached $76,000 in the prior session.
Key takeaways
- Bitcoin futures sit at a roughly 2% annualized premium, below the neutral range, indicating cautious demand for bullish leverage.
- Derivatives data point to muted upside conviction: the April 24, $80,000 call on Deribit traded at about 0.017 BTC, with 31 days to expiry and implied volatility near 48%, implying roughly a 20% probability of reaching $80,000 by expiry.
- Stablecoin funding remains calm, with OKX data showing a 1.3% premium to the USD/CNY rate, suggesting no urgent demand imbalances in the region.
- The macro backdrop—Fed’s pause on rate cuts, elevated energy costs, and mixed risk-on signals—continues to temper Bitcoin’s risk appetite despite short-term relief rallies.
Two-month futures reflect a tempered risk appetite
Despite the intraday rally, the closest futures curve remained relatively subdued. Laevitas data show the two-month Bitcoin futures annualized premium hovering near 2%, a level that signals modest willingness to take on longer-dated bullish bets but stops short of the exuberance that characterized more bullish phases. In practical terms, traders are demanding less compensation for the longer settlement, which translates into a cautious stance rather than a rally-driven squeeze.
For context, a more typical bullish curve would carry a higher premium to reflect the cost of carrying a position for longer, especially during periods of renewed demand for upside exposure. The persistent softness in the futures slope has been a recurring feature over the past month, even as spot prices moved through波 around the mid-to-high $60,000s and briefly north of $70,000 earlier in the period. This dynamic underscores a broader theme: a stubborn lack of conviction among buyers that the market can sustain a breakout without additional catalysts.
Options signal a cautious stance on outsized moves
Options data corroborate a cautious mood. Deribit’s market for the April 24 options shows the $80,000 call trading at approximately 0.017 BTC, with 31 days left to expiry and an implied volatility around 48%. The pricing implies roughly a 20% chance of reaching the $80,000 threshold by expiry—a probability that, in crypto markets, reflects a comparatively modest expectation for a large, single-session move. In other words, traders are not pricing in a high-likelihood surge that would push BTC above the prior highs within the near term.
The combination of a low call premium and relatively subdued implied volatility adds up to a market that is comfortable with limited upside risk, but not confident enough to chase a dramatic breakout. This dynamic aligns with the broader narrative witnessed in other risk assets while Bitcoin remains tethered to macro-driven headwinds rather than idiosyncratic catalysts in the crypto space.
Macro context remains the primary driver of sentiment
Beyond the crypto-specific data, Bitcoin’s path continues to be shaped by the wider market environment. The Federal Reserve’s decision to pause rate cuts has kept fixed-income instruments attractive relative to risk assets, a factor that tends to cap speculative capital flows into volatile assets like BTC. Concurrently, energy prices and geopolitical tensions continue to exercise a palpable influence on risk sentiment. While a relief rally can occur in a supportive moment, the prevailing backdrop—higher financing costs and ongoing macro uncertainty—tends to constrain sustained upside for Bitcoin.
In this context, a 3% rebound in broader equity indices on a given day does not automatically translate into a durable shift in crypto risk appetite. Market participants appear to be weighing a potential macro regime shift—one where inflation pressures abate and central banks ease—against the immediate risks of a slower economy and ongoing geopolitical frictions. Against that backdrop, Bitcoin’s peers and on-chain indicators have shown mixed signals, highlighting a market that is still searching for a clearer directional impulse.
What to watch next
As traders rotate through macro headlines and micro-structural data, several key themes will shape Bitcoin’s near-term trajectory. A sustained move above the $68,000–$70,000 region could invite a fresh wave of hedging and speculative activity, but it would likely need to be supported by a shift in the futures curve toward a more positive premium. Conversely, a renewed stress in energy markets or a hawkish turn from central banks could reinforce risk-off dynamics and push BTC back toward recent support levels near $65,000 or lower.
In the near term, investors will be watching the interplay between the macro backdrop and the crypto derivatives market. If the two-month futures premium remains compressed and the options market continues to price in limited upside, the market will likely require a tangible catalyst—whether a policy signal, a breakthrough in adoption, or a clearer geopolitical development—to re-energize bullish bets. Until then, Bitcoin’s path may continue to be characterized by cautious consolidations rather than decisive breakouts.
Look for ongoing updates on how shifts in macro policy, energy pricing, and global risk sentiment influence the balance between spot demand and derivatives positioning, as these factors will likely determine whether Bitcoin can sustain any relief rallies or remain tethered to its current, more restrained trajectory.
TLDR
- The Solana Foundation released a report outlining a customizable privacy framework for institutions.
- The report presents privacy as a spectrum with four distinct operational modes.
- The framework includes pseudonymity, confidentiality, anonymity, and fully private systems.
- The Solana Foundation said enterprises can combine privacy tools within one blockchain network.
- The report links privacy controls with compliance tools such as auditor keys.
The Solana Foundation has released a new report that outlines a customizable privacy framework for institutions. The document states that enterprises require flexible disclosure controls rather than full transparency. The foundation said privacy options can operate on Solana without reducing network performance.
The report, titled “Privacy on Solana: A Full-Spectrum Approach for the Modern Enterprise,” sets out a structured model for privacy. It states that companies need control over data visibility and counterparties. The foundation presented privacy as a configurable feature within one blockchain system.
Solana Foundation Outlines Privacy Spectrum for Enterprises
The Solana Foundation defined four privacy modes within its proposed framework. These modes include pseudonymity, confidentiality, anonymity, and fully private systems. The report stated, “For enterprises, privacy is a spectrum, not a switch.”
The foundation explained that pseudonymity hides identities behind wallet addresses while keeping transaction data public. It said confidentiality allows known participants to encrypt balances and transfer amounts. It added that anonymity conceals identities but keeps transaction records visible on-chain.
The report described fully private systems as shielding both identity and transaction data. It cited zero-knowledge proofs and multiparty computation as supporting technologies. The foundation stated that companies can combine these methods within a single network.
The document argued that no single model fits all enterprise needs. It stated that firms may select privacy levels based on operational and regulatory requirements. It emphasized that each privacy level remains compatible with the broader Solana ecosystem.
Framework Links Privacy Controls With Compliance Tools
The report stated that financial institutions often must verify transactions without exposing counterparties. It added that payroll processors cannot publish employee salary data on public ledgers. The foundation positioned its framework as a response to these operational constraints.
The Solana Foundation said its high throughput and low latency enable advanced encryption methods at near-web speeds. It argued that network performance supports encrypted order books and private credit assessments. The report described these features as practical under current network conditions.
The document also addressed regulatory requirements tied to anti-money laundering rules. It introduced “auditor keys” that allow approved parties to decrypt transaction details when required. The report stated that wallets can prove compliance status without disclosing full identity data.
The foundation wrote, “Privacy is a market requirement. Customers expect it and applications require it.” It added that enterprises can choose encrypted balances, zero-knowledge anonymity, or multiparty confidential computing.
The report stated that each privacy mode maps to a defined compliance path. It explained that companies can mix tools such as hidden transaction amounts or selective data access. The Solana Foundation released the report on Monday as part of its institutional outreach efforts.


Iran-linked attacks are hammering Dubai’s property and gold while oil jumps and airspace shuts, pushing some crypto workers out and reinforcing Bitcoin as mobile war‑risk hedge.
Summary
- Iran-linked missile and drone attacks have rattled Dubai’s real estate and gold markets, forcing crypto workers to reassess risk.
- Long-term residents still see Dubai as a safe, flexible base for crypto, but highly mobile professionals are already rotating to Hong Kong and other hubs.
- War-driven stress on oil, the Strait of Hormuz and inflation is reinforcing Bitcoin’s “flight asset” narrative, even as liquidity and leverage remain fragile.
Dubai’s position as a premier crypto hub is now colliding, in real time, with the hard math of war: missiles, airspace closures, and a property index that has fallen roughly 20–30% since late February as Iran’s conflict with the US and Israel spilled across the Gulf.
In a recent WuBlockchain Space episode, co‑founder of MegaETH Shuyao Kong describes the moment that abstraction turned into physical risk: “By the afternoon, missiles started flying overhead… that night, I was on the phone with my co‑founder while interception blasts were still going off overhead.” Yet even as she evacuated via Oman, she stresses that “over the medium to long term, I’m still very bullish on Dubai… Right now, Dubai just happens to be in its own bear‑market phase.”
At the same time, market data is catching up with that “bear‑market phase.” The Dubai Financial Market real estate index has plunged around 30% from roughly 16,000 points to the 11,500–11,700 area in just weeks, wiping out 2026 gains and echoing the sentiment reversal among leveraged offshore wealth parked in UAE assets. Housing sales have dropped more than 25–30% since the war began, as buyers step to the sidelines even while prime assets hold better than the headline index implies.
The second leg of the story is gold. Dubai, “the biggest gold gray market in the world” in Shuyao’s words, is now seeing bullion offered at discounts of up to about $30 per ounce versus London benchmarks as flight bans and partial airspace closures leave metal stranded. “Now that it’s hard to move gold out, prices there are lower,” she notes. “So yes, comrades, this is why you should still believe in Bitcoin.” That line is not just ideology: disruptions to oil flows through the Strait of Hormuz and IRGC attacks on Gulf energy infrastructure have already pushed Brent crude above $104–$110 per barrel, complicating inflation and driving spasms in Bitcoin price action from roughly $73,000 down toward the $67,000–$72,300 zone as risk appetite whipsaws.
For crypto markets, this is where the macro and micro collide. One crypto.news analysis notes that the effective closure of Hormuz, through which about 15% of global oil passes, is feeding a “perfect storm” of energy shock plus hot US inflation, forcing traders to reprice rate‑cut odds and hitting Bitcoin and equities together. Another piece shows how IRGC strikes on Qatar’s LNG hub and UAE energy assets have driven oil above $110, with JPMorgan cutting its S&P 500 target and warning that a 30% oil spike historically precedes demand destruction and recession. In parallel, BitMEX co‑founder Arthur Hayes has argued that a prolonged U.S.–Iran war plus spiking Brent will eventually force the Federal Reserve “back to the printer,” which he frames as structural rocket fuel for BTC.
On the ground, the war is reshaping who stays and who leaves. Exchange worker Jarseed, who moved to Dubai in March 2024 because “the crypto scene felt dense and active” and praised a life where “when you say you work in crypto, there’s no sense of having to be cautious,” quietly exited to Hong Kong in December after sensing rising tail risk: “Anyone who’s been paying attention knows this round may have been more serious, but the broader conflict… has been there all along.” He describes a city where many exchange employees have “bought homes, moved their families over, and their kids are going to school there,” making them far stickier than the digital‑nomad class that can rotate capital and residency on short notice.
This bifurcation is becoming visible in industry logistics. Token2049’s Dubai edition has already been postponed to April 2027 due to security concerns over the Iran–Israel–US war, even as other events and day‑to‑day life continue under interception sirens and sporadic debris damage in neighborhoods like JBR and around DIFC. In the meantime, Hong Kong’s licensing push and Singapore’s still‑tight regime give capital an obvious hedge: a way to be “in Asia, in size” without daily missile‑defense risk.
Yet neither Shuyao nor Jarseed thinks this automatically kills Dubai’s hub status. For now, they see a repricing of risk rather than an exodus: “For people who actually live in Dubai long term… there hasn’t been this huge panic or a universal rush to leave,” he says. The harder question is whether repeated rounds of Iran‑linked escalation, oil shocks, and airspace closures turn Dubai into a high‑beta proxy on Gulf war risk — and whether, as one LinkedIn analysis put it, that simply accelerates a rotation of movable capital into Bitcoin as “global financial insurance” when real estate and gold can’t move.
If physical assets in Dubai are now visibly “in the blast radius” of geopolitical risk, the logic of crypto as a mobility hedge becomes less abstract. Whenever airspace shuts and bank rails slow, stablecoins and Bitcoin are the instruments that still clear value cross‑border, 24/7, with no need to queue at DXB. That helps explain the persistent bid in BTC around the $70,000 area despite violent liquidations, including over $450 million in long positions wiped as Iran’s Gulf strikes and $110 oil triggered a leverage flush on derivatives venues like Hyperliquid.
For Dubai, the near‑term path is binary and brutally simple. Either interception systems keep working, energy targets remain the priority, and the city continues to function as a discounted, higher‑yield hub where property and gold occasionally trade “cheap” in dollar terms — or saturation, miscalculation, or political escalation pushes the conflict into residential and financial districts in a way that forces a structural outflow of people, capital, and events. In that world, the same crypto workers who once flocked to Dubai for tax efficiency and lifestyle would likely treat the city’s boom as a completed trade — and rotate, again, to the next jurisdiction willing to offer regulatory clarity, low taxes, and something closer to peacetime airspace.

Jessie J Rushed To The Hospital After Car Incident In China

Music festivals made more accessible for disabled fans

Thailand promotes wellness tourism to attract affluent international travelers

Smart energy pays enters the US market, targeting scalable financial infrastructure

Why Israel is blocking foreign journalists from entering

Bitcoin: We’re Entering The Most Dangerous Phase

Income Statement in Nepali || Multi Step || Class 12 Account Financial Statement || BBS 1st Year

Money Is Powerful. #viral #status #like #motivation #trending #funny #money #video #havegoals #bhai

XRP BREAKING 5 DAYS NEWS! It’s Happening NOW?!
-
 Crypto World3 days ago
NIO (NIO) Stock Plunges 6.5% as Shelf Registration Sparks Dilution Worries
-

 Fashion3 days ago
Weekend Open Thread: Adidas – Corporette.com
-

 Politics3 days ago
Jenni Murray, Long-Serving Woman’s Hour Presenter, Dies Aged 75
-
 Tech6 days ago
Are Split Spacebars the Next Big Gaming Keyboard Trend?
-

 Crypto World2 days ago
Best Crypto to Buy Now: Strategy Just Spent $1.57 Billion on Bitcoin During Fear While Early Investors Quietly Enter Pepeto for 150x Potential
-

 News Videos5 days ago
RBA board divided on rate cut, unusually buoyant share market | Finance Report | ABC NEWS
-

 Crypto World2 days ago
Bitcoin Price News: Bhutan Sells $72 Million in BTC Under Fiscal Pressure, but the Smart Money Entering Pepeto Sees What the Market Does Not
-

 Politics6 days ago
The House | The new register to protect children from their abusers shows Parliament at its best
-

 Tech4 days ago
inKONBINI Lets You Spend Summer Days Behind the Register
-
 Politics6 days ago
Real-time pollution monitoring calls after boy nearly dies
-

 Crypto World5 days ago
Canada’s FINTRAC revokes registrations of 23 crypto MSBs in AML crackdown
-

 Sports13 hours ago
Remo Stars and Kano Pillars Strengthen Survival Hopes in NPFL
-
 NewsBeat5 days ago
Residents in North Lanarkshire reminded to register to vote in Scottish Parliament Election
-

 News Videos5 days ago
PARLIAMENT OF MALAWI – PAC MEETING WITH REGISTRAR OF FINANCIAL ON AMARYLLIS HOTEL – INQUIRY LIVE
-

 Politics4 days ago
Gender equality discussions at UN face pushbacks and US resistance
-

 Business1 day ago
No Winner in March 21 Drawing as Prize Rolls to $133 Million for Next
-

 Business5 days ago
Who Was Alex Pretti? 5 Key Facts About the ICU Nurse Killed by Federal Agents in Minneapolis
-

 Sports12 hours ago
Gary Kirsten Accuses Pakistan Cricket Board Of ‘Interference’, Mohsin Naqvi Responds
-

 Tech1 day ago
Give Your Phone a Huge (and Free) Upgrade by Switching to Another Keyboard
-

 Sports3 days ago
2026 Kentucky Derby horses, odds, futures, preview, date: Expert who nailed 12 Derby-Oaks Doubles enters picks
You must be logged in to post a comment Login