

Crypto World
Why Bitcoin’s 47% Drop From $126K Is Not the Crisis It Appears to Be

TLDR:
- Bitcoin’s cycle bottoms have grown shallower each time, falling from -92.7% in 2011 to -68.5% in 2022.
- BTC is currently 47% below its October 2025 ATH of $126K, with Fear and Greed at single digits.
- Green drawdown days near all-time highs are growing faster than red days for the first time in Bitcoin’s history.
- Comparing the 2025 selloff to 2018 may be the wrong framework, as structural data points to a maturing asset.
The latest Bitcoin selloff has renewed fears of a prolonged bear market, but historical drawdown data suggests this cycle may not follow the same path as those before it.
Bitcoin currently trades roughly 47% below its October 2025 all-time high of $126,000. Fear and Greed readings sit at single digits.
Yet 15 years of drawdown data, when mapped against the present, paints a different picture from what many traders are expecting.
Past Cycles Carried Far Deeper and Longer Drawdowns
In 2011, Bitcoin collapsed 92.7% from its peak. Nearly every day of its young existence was spent deep in drawdown territory.
The 2013–2015 cycle followed with a 72% decline, adding over 1,500 days of brutal losses to the historical record.
By 2017, Bitcoin had logged more than 2,500 drawdown days, and red still dominated the distribution chart. The 2018 bear market then pushed losses to 78.4%, reinforcing the same deep correction band between -60% and -80%. Those cycles defined what analyst Sminston With described as “the old Bitcoin.”
The critical pattern across all those cycles, however, is one of gradual improvement. Each successive bottom came in shallower than the one before it.
The sequence runs as follows: -92.7%, -87%, -84%, -77%, and then -68.5% in 2022. That consistent upward shift in the floor is not coincidental.
The current selloff, sitting at approximately -47%, has not yet approached any of those prior cycle bottoms. That alone separates this moment from what traders experienced in 2018 or 2015, even if sentiment feels comparable.
Structural Shifts in How Bitcoin Spends Its Time
After the 2021 bull cycle, a measurable change appeared in the drawdown distribution. Green bars, representing days spent within 0% to -15% of an all-time high, began growing at a faster rate than any prior period. Bitcoin was simply spending more time near its highs than it ever had before.
Sminston With noted that “green-white oscillations are replacing the deep red plunges,” referring to the shift away from the severe, prolonged corrections that once dominated Bitcoin’s history.
The transition zone between -15% and -35% has also grown, with Bitcoin spending close to 90 days there following the October 2025 peak.
This does not mean further downside is impossible. Some market participants are still calling for $40,000 or even $25,000.
However, the data shows that Bitcoin’s worst drawdowns have been getting structurally shallower, cycle after cycle, and the time spent near all-time highs has been growing.
The question the data raises is straightforward. If each cycle bottom has come in less severe than the last, and if Bitcoin is spending more time in the green regime than ever before, then comparing 2025 to 2018 may simply be the wrong framework for this moment.


Zcash price has crashed this year, erasing most of the gains made last year as profit-taking continued and as competition fears rise.
Summary
- Zcash price has slumped by 66% from its highest level in November last year.
- Ethereum plans to launch stealth addresses, while Cardano is working on Midnight.
- ZEC has moved to the distribution phase of the Wyckoff Theory.
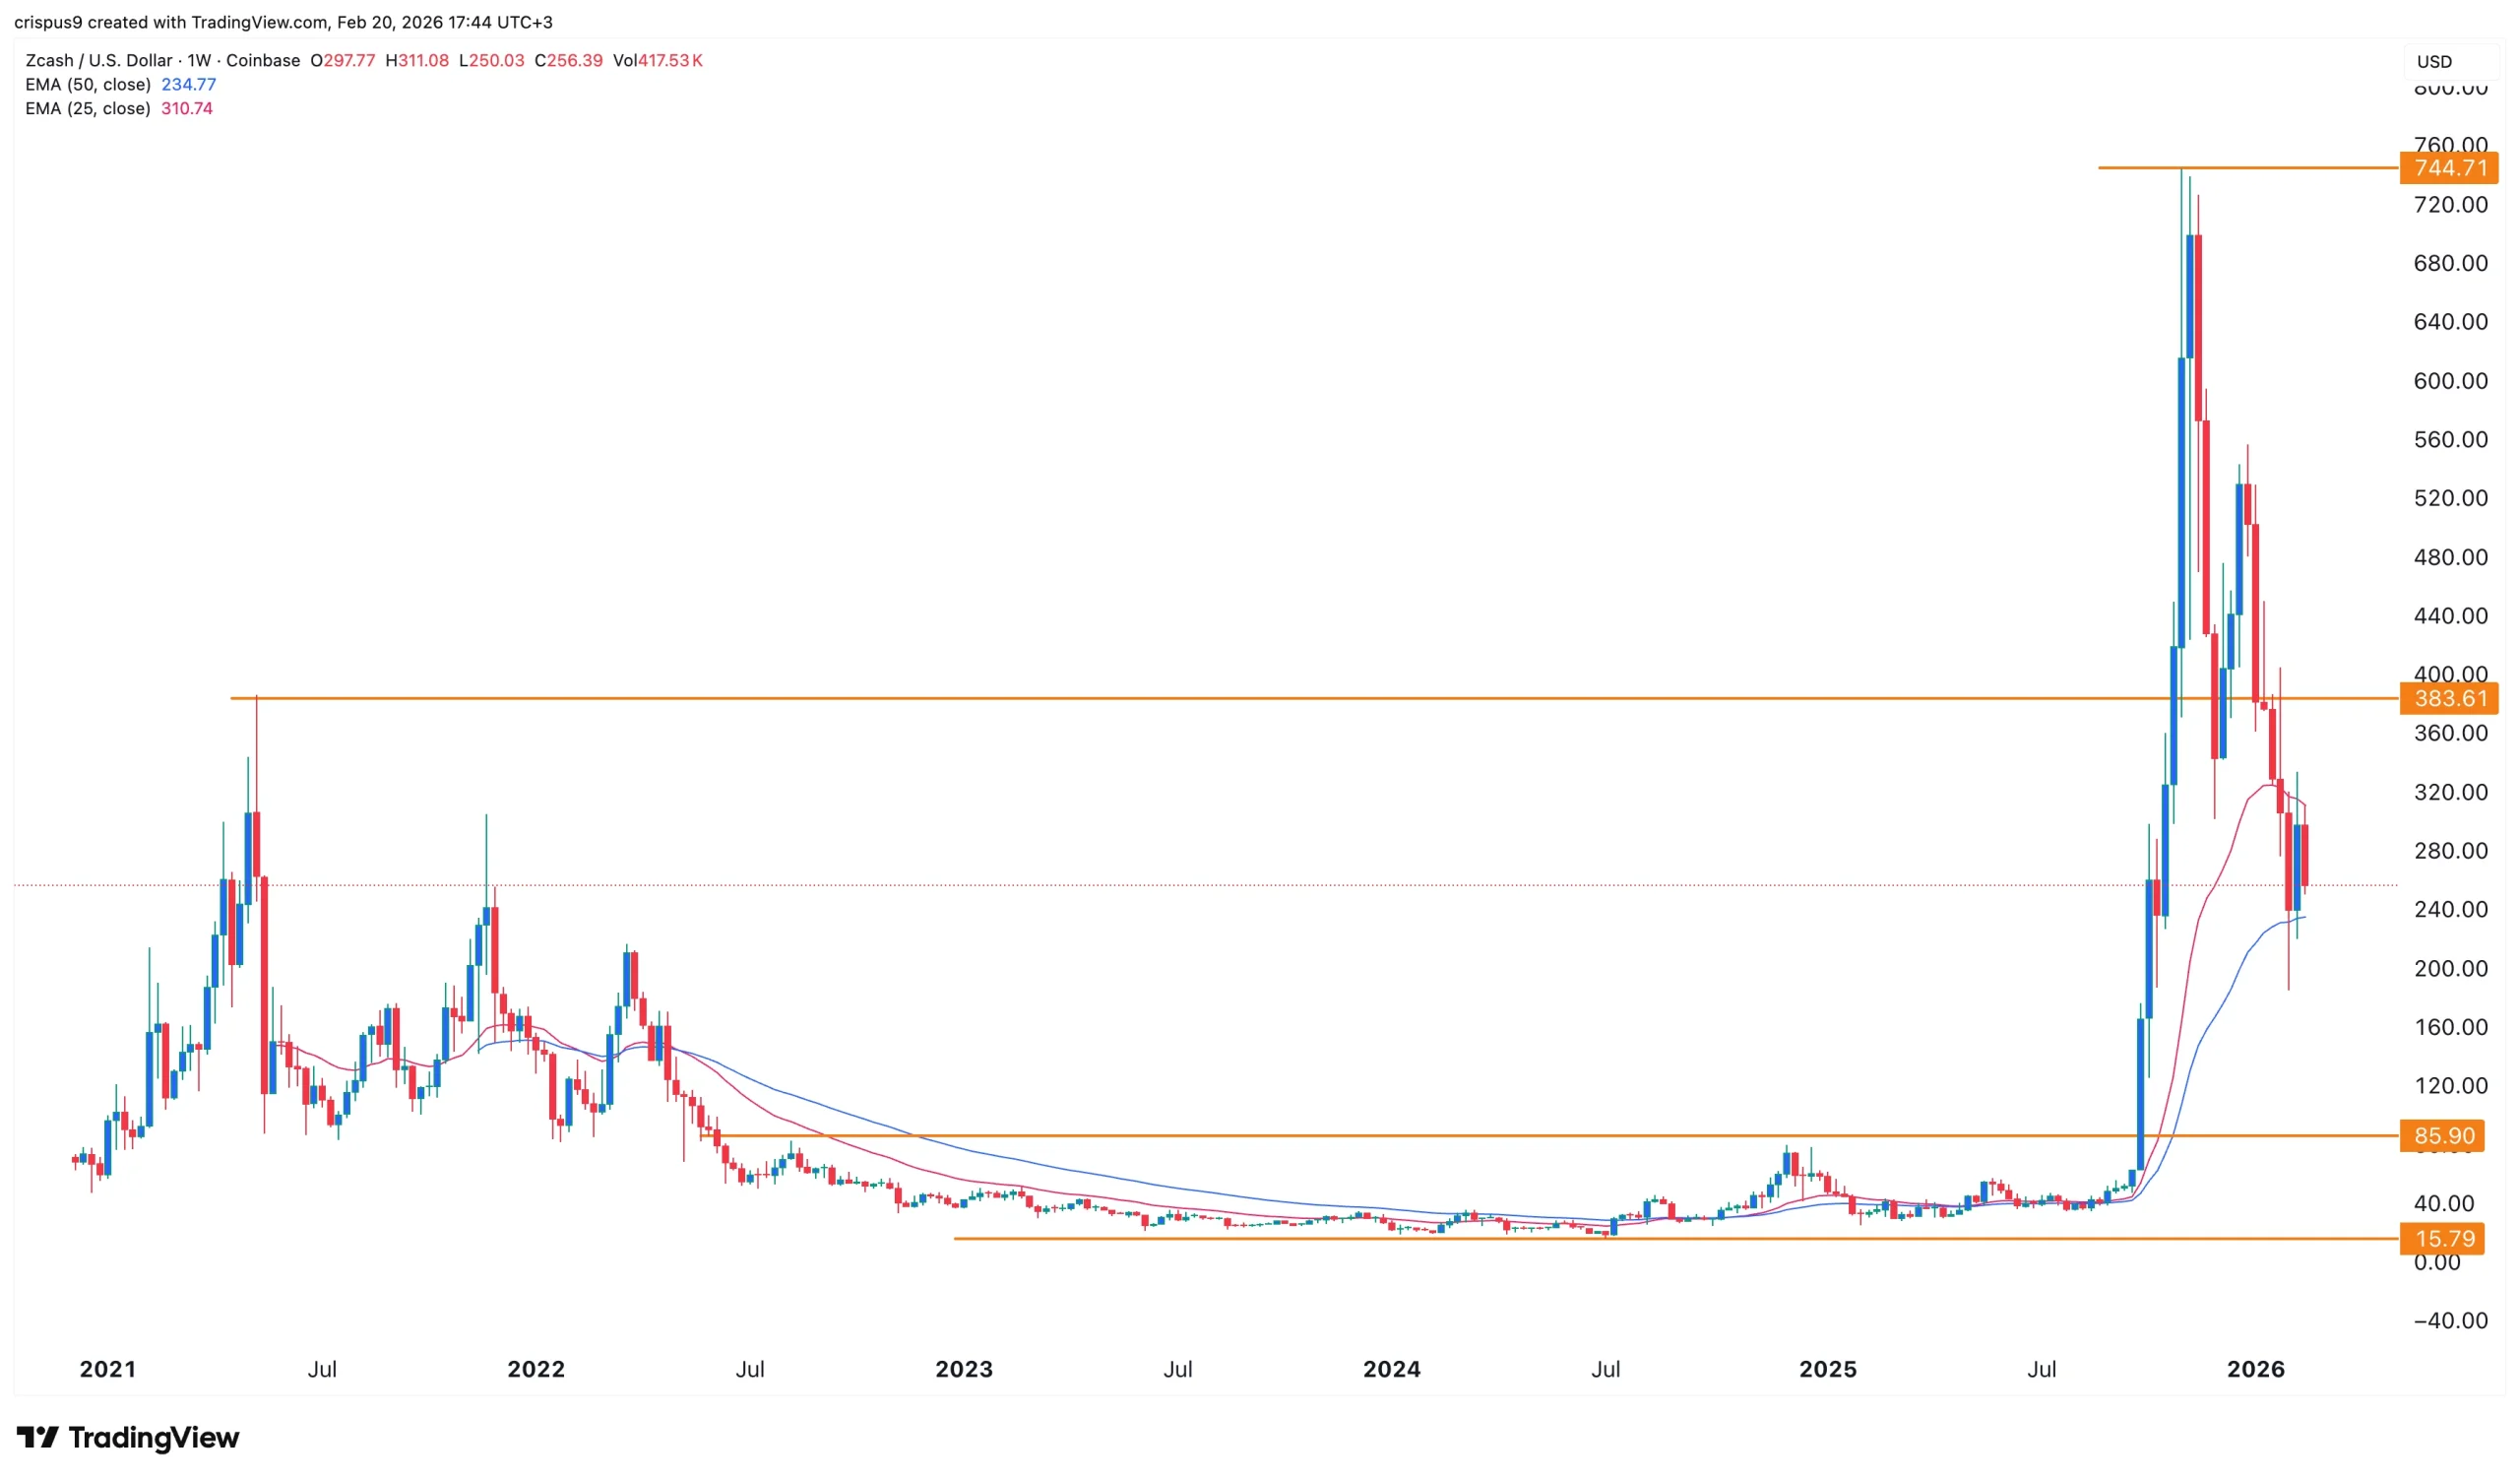
Zcash (ZEC) token dropped to a low of $250 on Friday, down by 66% from its highest level in November last year. This crash has brought its market capitalization from nearly $12 billion to the current $4.21 billion.
The ongoing Zcash price crash aligns with the broader crypto market plunge that has affected Bitcoin and other top altcoins like Ethereum and Cardano.
At the same time, there are concerns that competition is rising in the privacy industry. The biggest competition will come from Ethereum, which plans to launch stealth addresses as part of the ERC-5565.
Stealth addresses aim to solve a key challenge that has existed for many years, where Ethereum transactions are public. As a result, sender and receiver data will now become private, a strategy that emulates Zcash’s shielded addresses.
Ethereum is also working on a strategy to implement zero-knowledge proofs in the layer-1 network, which will improve its privacy features
Cardano, on the other hand, is working on Midnight, a zero-knowledge proof-based sidechain that will have advanced features. The mainnet launch will happen in March this year.
Meanwhile, data compiled by CoinGlass shows that Zcash’s futures open interest has dropped in the past few months, a sign that its demand has waned. It has dropped to $377 million from last year’s high of over $1.38 billion.
Zcash price technical analysis
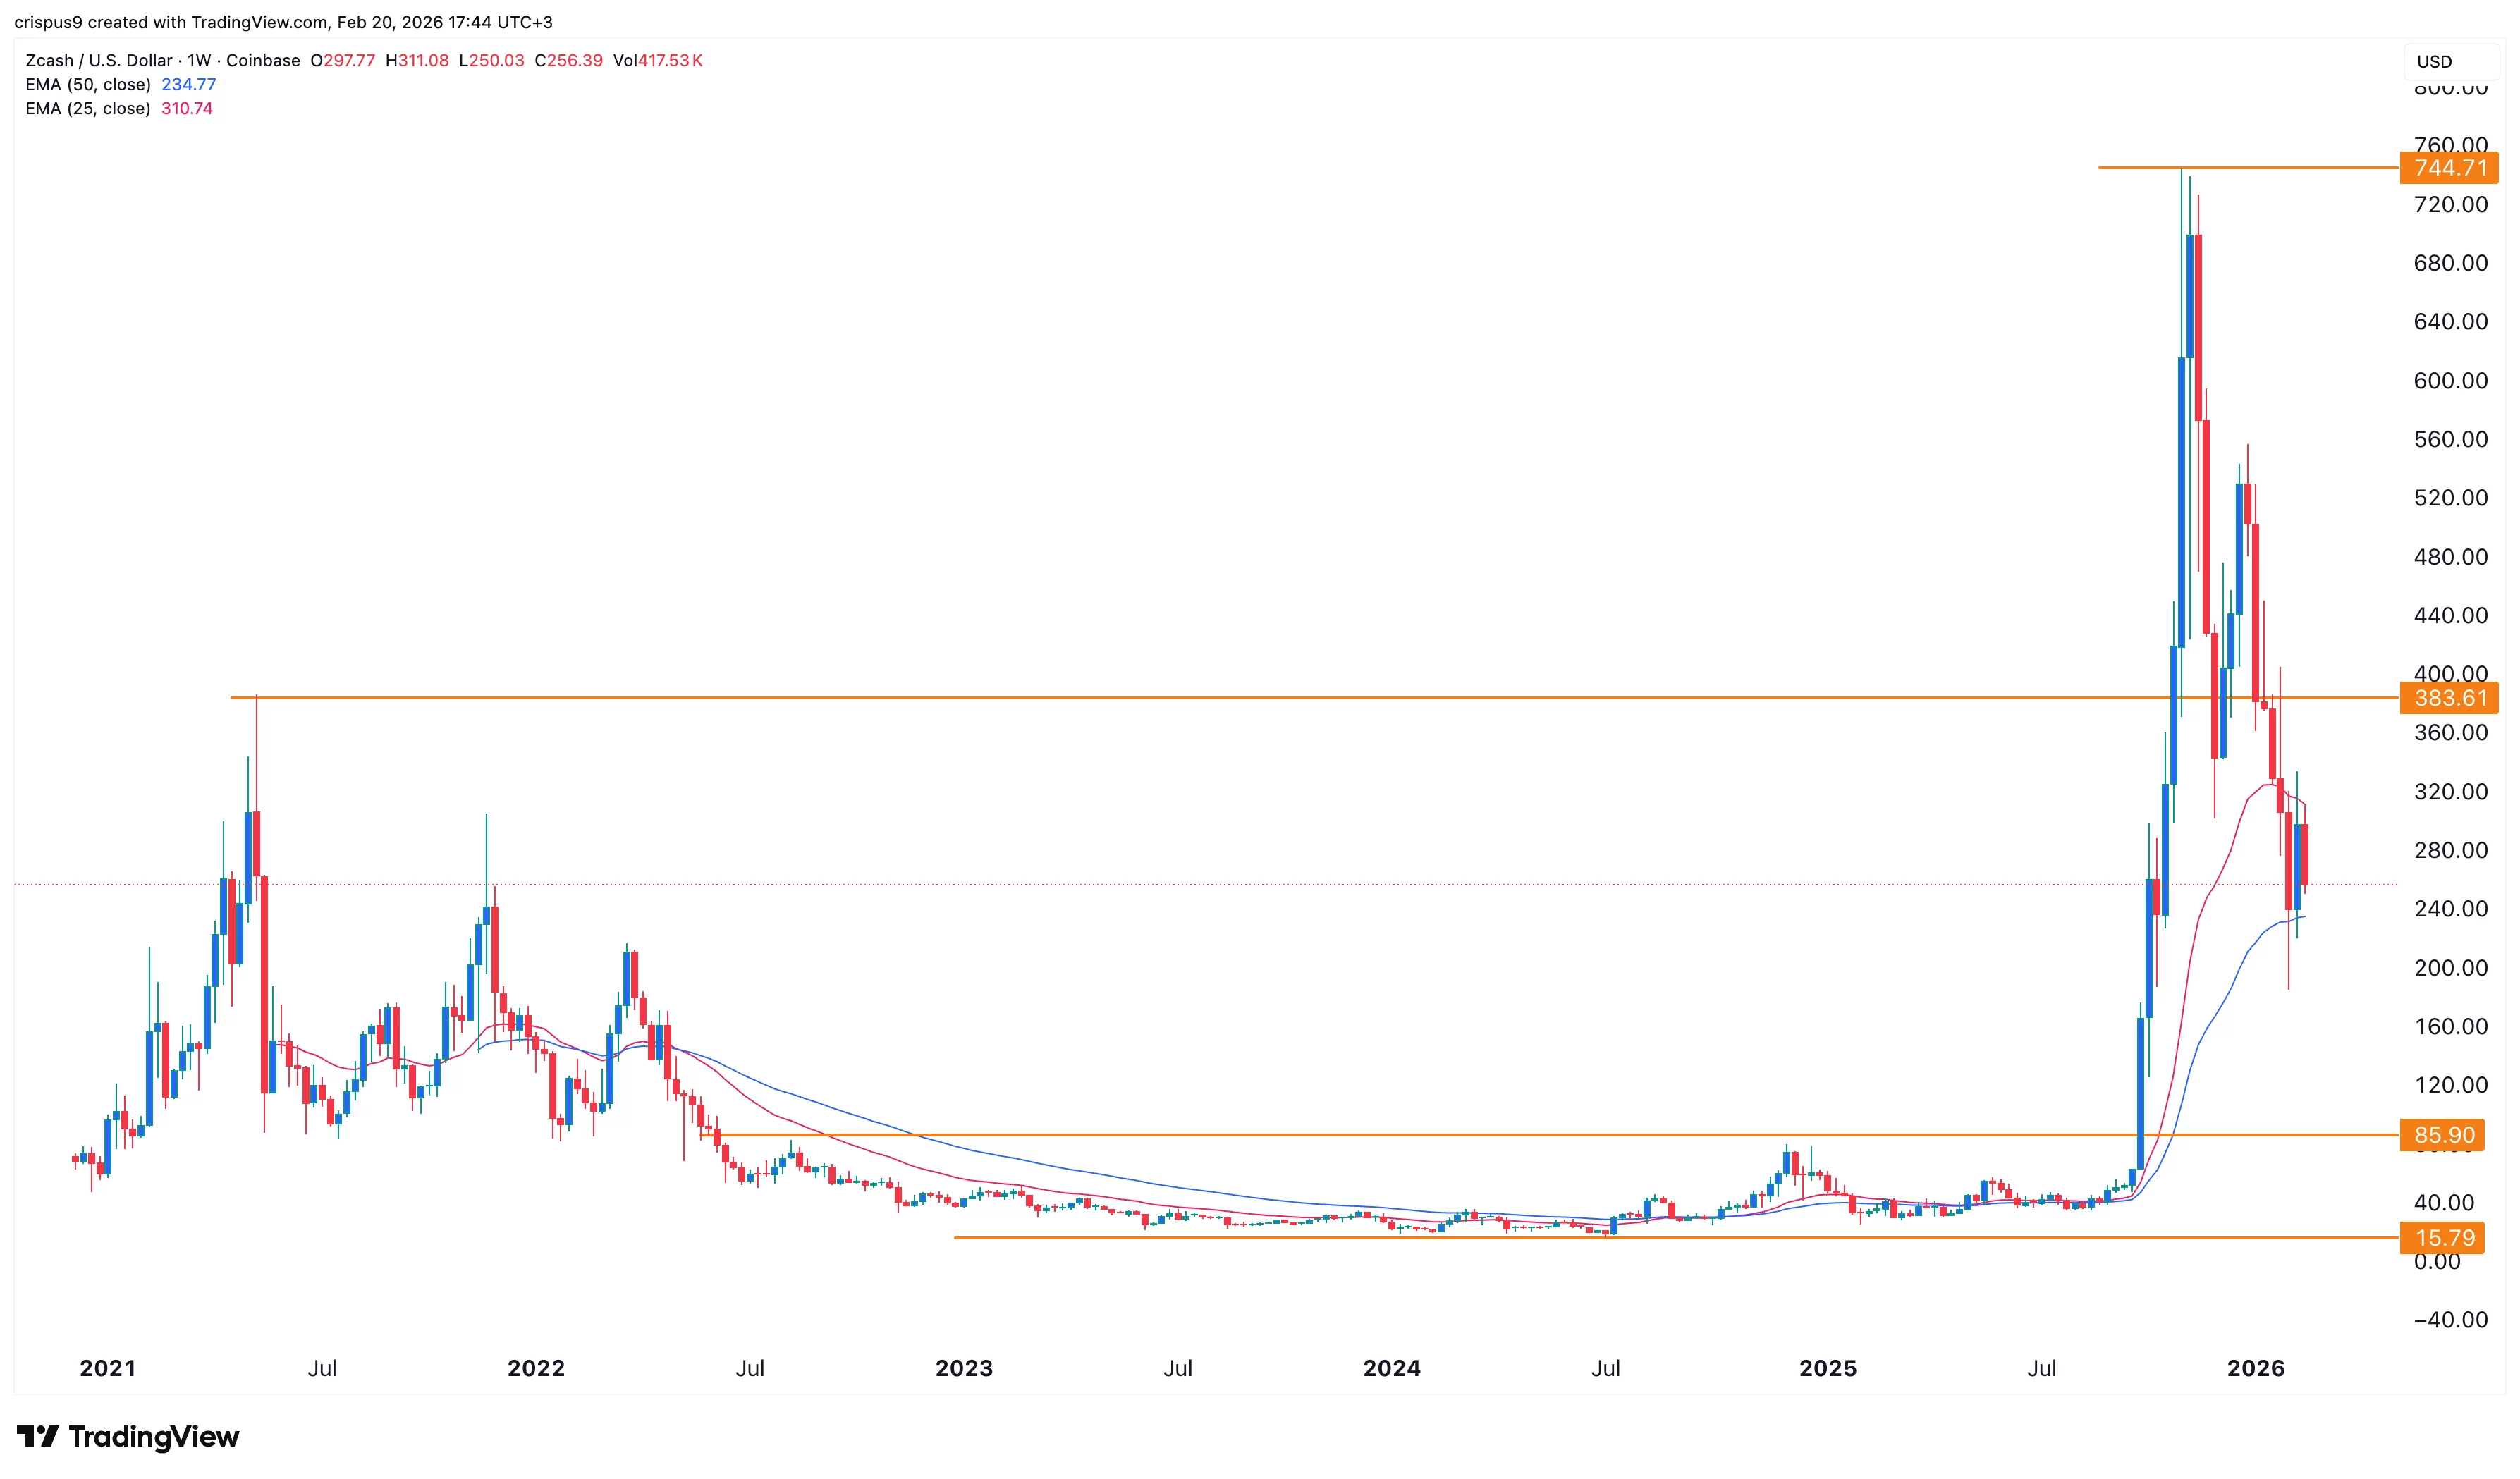
The weekly chart shows that the Zcash price remained in a narrow range between the key support and resistance levels at $15 and $85, respectively. This consolidation was part of the accumulation phase of the Wyckoff Theory.
It then surged and moved to a high of $745 as part of the mark-up phase. Therefore, the ongoing retreat is part of the markdown and distribution of the Wyckoff Theory.
It has now moved below the key support level at $385, its highest level in May 2021. Also, it has moved below the 50-week and 100-week Exponential Moving Averages.
ZEC price is also forming a bearish pennant pattern, a popular continuation sign in technical analysis. Therefore, the most likely scenario is where it continues falling, potentially to the next key support level at $200.
Crypto World
How AI is helping retail traders exploit prediction market ‘glitches’ to make easy money


A fully automated trading bot executed 8,894 trades on short-term crypto prediction contracts and reportedly generated nearly $150,000 without human intervention.
The strategy, described in a recent post circulating on X, exploited brief moments when the combined price of “Yes” and “No” contracts on five-minute bitcoin and ether markets dipped below $1. In theory, those two outcomes should always add up to $1. If they don’t, say they trade at a combined $0.97, a trader can buy both sides and lock in a three-cent profit when the market settles.
That works out to roughly $16.80 in profit per trade — thin enough to be invisible on any single execution, but meaningful at scale. If the bot was deploying around $1,000 per round-trip and clipping a 1.5-to-3% edge each time, it becomes the kind of return profile that looks boring on a per-trade basis but impressive in aggregate. Machines don’t need excitement. They need repeatability.
It sounds like free money. In practice, such gaps tend to be fleeting, often lasting milliseconds. But the episode highlights something bigger than a single glitch: crypto’s prediction markets are increasingly becoming arenas for automated, algorithmic trading strategies, and an emerging AI-driven arms race.
As such, typical five-minute bitcoin prediction contracts on Polymarket carry order-book depth of roughly $5,000 to $15,000 per side during active sessions, data shows. That’s several orders of magnitude thinner than a BTC perpetual swap book on major exchanges such as Binance or Bybit.
A desk trying to deploy even $100,000 per trade would blow through available liquidity and wipe out whatever edge existed in the spread. The game, for now, belongs to traders comfortable sizing in the low four figures.
When $1 isn’t $1
Prediction markets like Polymarket allow users to trade contracts tied to real-world outcomes, from election results to the price of bitcoin in the next five minutes. Each contract typically settles at either $1 (if the event happens) or $0 (if it doesn’t).
In a perfectly efficient market, the price of “Yes” plus the price of “No” should equal exactly $1 at all times. If “Yes” trades at 48 cents, “No” should trade at 52 cents.
But markets are rarely perfect. Thin liquidity, fast-moving prices in the underlying asset and order-book imbalances can create temporary dislocations. Market makers may pull quotes during volatility. Retail traders may aggressively hit one side of the book. For a split second, the combined price might fall below $1.
For a sufficiently fast system, that’s enough.
These kinds of micro-inefficiencies are not new. Similar short-duration “up/down” contracts were popular on derivatives exchange BitMEX in the late 2010s, before the venue eventually pulled some of them after traders found ways to systematically extract small edges. What’s changed is the tooling.
Early on, retail traders treated these BitMEX contracts as directional punts. But a small cohort of quantitative traders quickly realized the contracts were systematically mispriced relative to the options market — and began extracting edge with automated strategies that the venue’s infrastructure wasn’t built to defend against.
BitMEX eventually delisted several of the products. The official reasoning was low demand, but traders at the time widely attributed it to the contracts becoming uneconomical for the house once the arb crowd moved in.
Today, much of that activity can be automated and increasingly optimized by AI systems.
Beyond glitches: Extracting probability
The sub-$1 arbitrage is the simplest example. More sophisticated strategies go further, comparing pricing across different markets to identify inconsistencies.
Options markets, for instance, effectively encode traders’ collective expectations about where an asset might trade in the future. The prices of call and put options at various strike prices can be used to derive an implied probability distribution, a market-based estimate of the likelihood of different outcomes.
In simple terms, options markets act as giant probability machines.
If options pricing implies, say, a 62% probability that bitcoin will close above a certain level over a short time window, but a prediction market contract tied to the same outcome suggests only a 55% probability, a discrepancy emerges. One of the markets may be underpricing risk.
Automated traders can monitor both venues simultaneously, compare implied probabilities and buy whichever side appears mispriced.
Such gaps are rarely dramatic. They may amount to a few percentage points, sometimes less. But for algorithmic traders operating at high frequency, small edges can compound over thousands of trades.
The process doesn’t require human intuition once it’s built. Systems can continuously ingest price feeds, recalculate implied probabilities and adjust positions in real time.
Enter the AI agents
What distinguishes today’s trading environment from prior crypto cycles is the growing accessibility of AI tools.
Traders no longer need to hand-code every rule or manually refine parameters. Machine learning systems can be tasked with testing variations of strategies, optimizing thresholds and adjusting to changing volatility regimes. Some setups involve multiple agents that monitor different markets, rebalance exposure and shut down automatically if performance deteriorates.
In theory, a trader might allocate $10,000 to an automated strategy, allowing AI-driven systems to scan exchanges, compare prediction market prices with derivatives data, and execute trades when statistical discrepancies exceed a predefined threshold.
In practice, profitability depends heavily on market conditions and on speed.
Once an inefficiency becomes widely known, competition intensifies. More bots chase the same edge. Spreads tighten. Latency becomes decisive. Eventually, the opportunity shrinks or disappears.
The larger question isn’t whether bots can make money on prediction markets. They clearly can, at least until competition erodes the edge. But what happens to the markets themselves is the point.
If a growing share of volume comes from systems that don’t hold a view on the outcome — that are simply arbitraging one venue against another — prediction markets risk becoming mirrors of the derivatives market rather than independent signals.
Why big firms aren’t swarming
If prediction markets contain exploitable inefficiencies, why aren’t major trading firms dominating them?
Liquidity is one constraint. Many short-duration prediction contracts remain relatively shallow compared with large crypto derivatives venues. Attempting to deploy significant capital can move prices against the trader, eroding theoretical profits through slippage.
There is also operational complexity. Prediction markets often run on blockchain infrastructure, introducing transaction costs and settlement mechanisms that differ from those of centralized exchanges. For high-frequency strategies, even small frictions matter.
As a result, some of the activity appears concentrated among smaller, nimble traders who can deploy modest size, perhaps $10,000 per trade, without materially moving the market.
That dynamic may not last. If liquidity deepens and venues mature, larger firms could become more active. For now, prediction markets occupy an in-between state: sophisticated enough to attract quant-style strategies, but thin enough to prevent large-scale deployment.
A structural shift
At their core, prediction markets are designed to aggregate beliefs to produce crowd-sourced probabilities about future events.
But as automation increases, a growing share of trading volume may be driven less by human conviction and more by cross-market arbitrage and statistical models.
That doesn’t necessarily undermine their usefulness. Arbitrageurs can improve pricing efficiency by closing gaps and aligning odds across venues. Yet it does change the market’s character.
What begins as a venue for expressing views on an election or a price move can evolve into a battleground for latency and microstructure advantages.
In crypto, such evolution tends to be rapid. Inefficiencies are discovered, exploited and competed away. Edges that once yielded consistent returns fade as faster systems emerge.
The reported $150,000 bot haul may represent a clever exploitation of a temporary pricing flaw. It may also signal something broader: prediction markets are no longer just digital betting parlors. They are becoming another frontier for algorithmic finance.
And in an environment where milliseconds matter, the fastest machine usually wins.


Such searches about BTC’s demise reached their highest levels in a while.
“The news about my death is greatly exaggerated.” Guess what, bitcoin is dead – again. At least according to people who search for that on Google and, of course, those who proclaim its demise.
Such instances in the past, though, have been followed by intense rallies as BTC typically tends to move in the opposite direction of what the crowd expects from it.
GOOGLE SEARCHES FOR “BITCOIN IS DEAD” JUST HIT ATHs.
This is the HIGHEST level since the FTX crash.
The generational rally is starting now. pic.twitter.com/EMkkC4scEq
— Rekt Fencer (@rektfencer) February 20, 2026
Bitcoin Is Dead Searches on the Rise
It’s worth noting that when we tried to recreate the same search for “Bitcoin Is Dead” on Google Trends, the results were somewhat different from what Rekt Fencer reported. The analyst said these queries on the world’s largest search engine had just hit ATHs, but our graph showed that the peak was in December 2025.
The levels are still quite high now, and have risen in the past few weeks, especially since BTC’s price tumbled from $90,000 to $60,000 by February 6. The retail crowd, which is usually Google Trends’ user base, has increased the searches for bitcoin’s untimely death.
Interestingly, the number of queries now is a lot higher than what happened after the FTX crash in late 2022. At the time, the uncertainty levels were through the roof, with many questioning the overall state of the market since one of its giants had just collapsed in days. Shortly after, bitcoin crumbled to $16,000 in what was a full-on bear market.
BTC’s crash at the time was for more than 75%, while this time, it retraced by a more modest 52% from top to bottom. Yet the crowd’s sentiment seems much more fragile now. However, most comments below Rekt Fencer’s post agreed that such negative feelings typically lead to immediate and impressive price reversals.
You may also like:
Dead 477 Times
Bitcoin used to be proclaimed dead so many times in the past, especially in its early and more volatile days, that websites had to be created to track all those obituaries. Two of the most popular ones – the obituaries page at 99bitcoins and bitcoindeaths – show close numbers. According to the former, BTC has been called dead 467 times, while the latter shows 477 such occasions.
The last such examples were from February when one Deutsche Bank strategist said BTC must no longer be considered ‘digital gold,’ or a Financial Times columnist argued that even at $69,000, BTC’s price is still too high.
Well, bitcoin didn’t die after each of those 467/477 death proclamations. Just the opposite; it returned stronger than ever, attracting new sorts of investors, reaching new price peaks, growing its network usage, and so on. Why should we believe things should be any different now?
SECRET PARTNERSHIP BONUS for CryptoPotato readers: Use this link to register and unlock $1,500 in exclusive BingX Exchange rewards (limited time offer).

Silver price has had a brutal yet fascinating start to 2026. After surging to an all-time high near $121 on January 29, the metal crashed nearly 47% by February 6. But since then, silver has staged a relentless 32% recovery to trade near $84 on February 20.
With markets closed on the 21st and 22nd, the question heading into March is clear: is this recovery the real deal, or does more pain lie ahead? The technicals and positioning data paint a nuanced picture. A consolidation is likely before the next decisive move, but the weight of evidence leans bullish.
Cup Formation, Hidden Bearish Divergence, And Signs Of Consolidation
The XAG/USD daily chart reveals a developing cup pattern, with the impulse wave originating from November 21, 2025, peaking at $121 on January 29, and pulling back to $63.85 on February 6. The recent recovery toward $84 is now approaching the neckline of this formation.
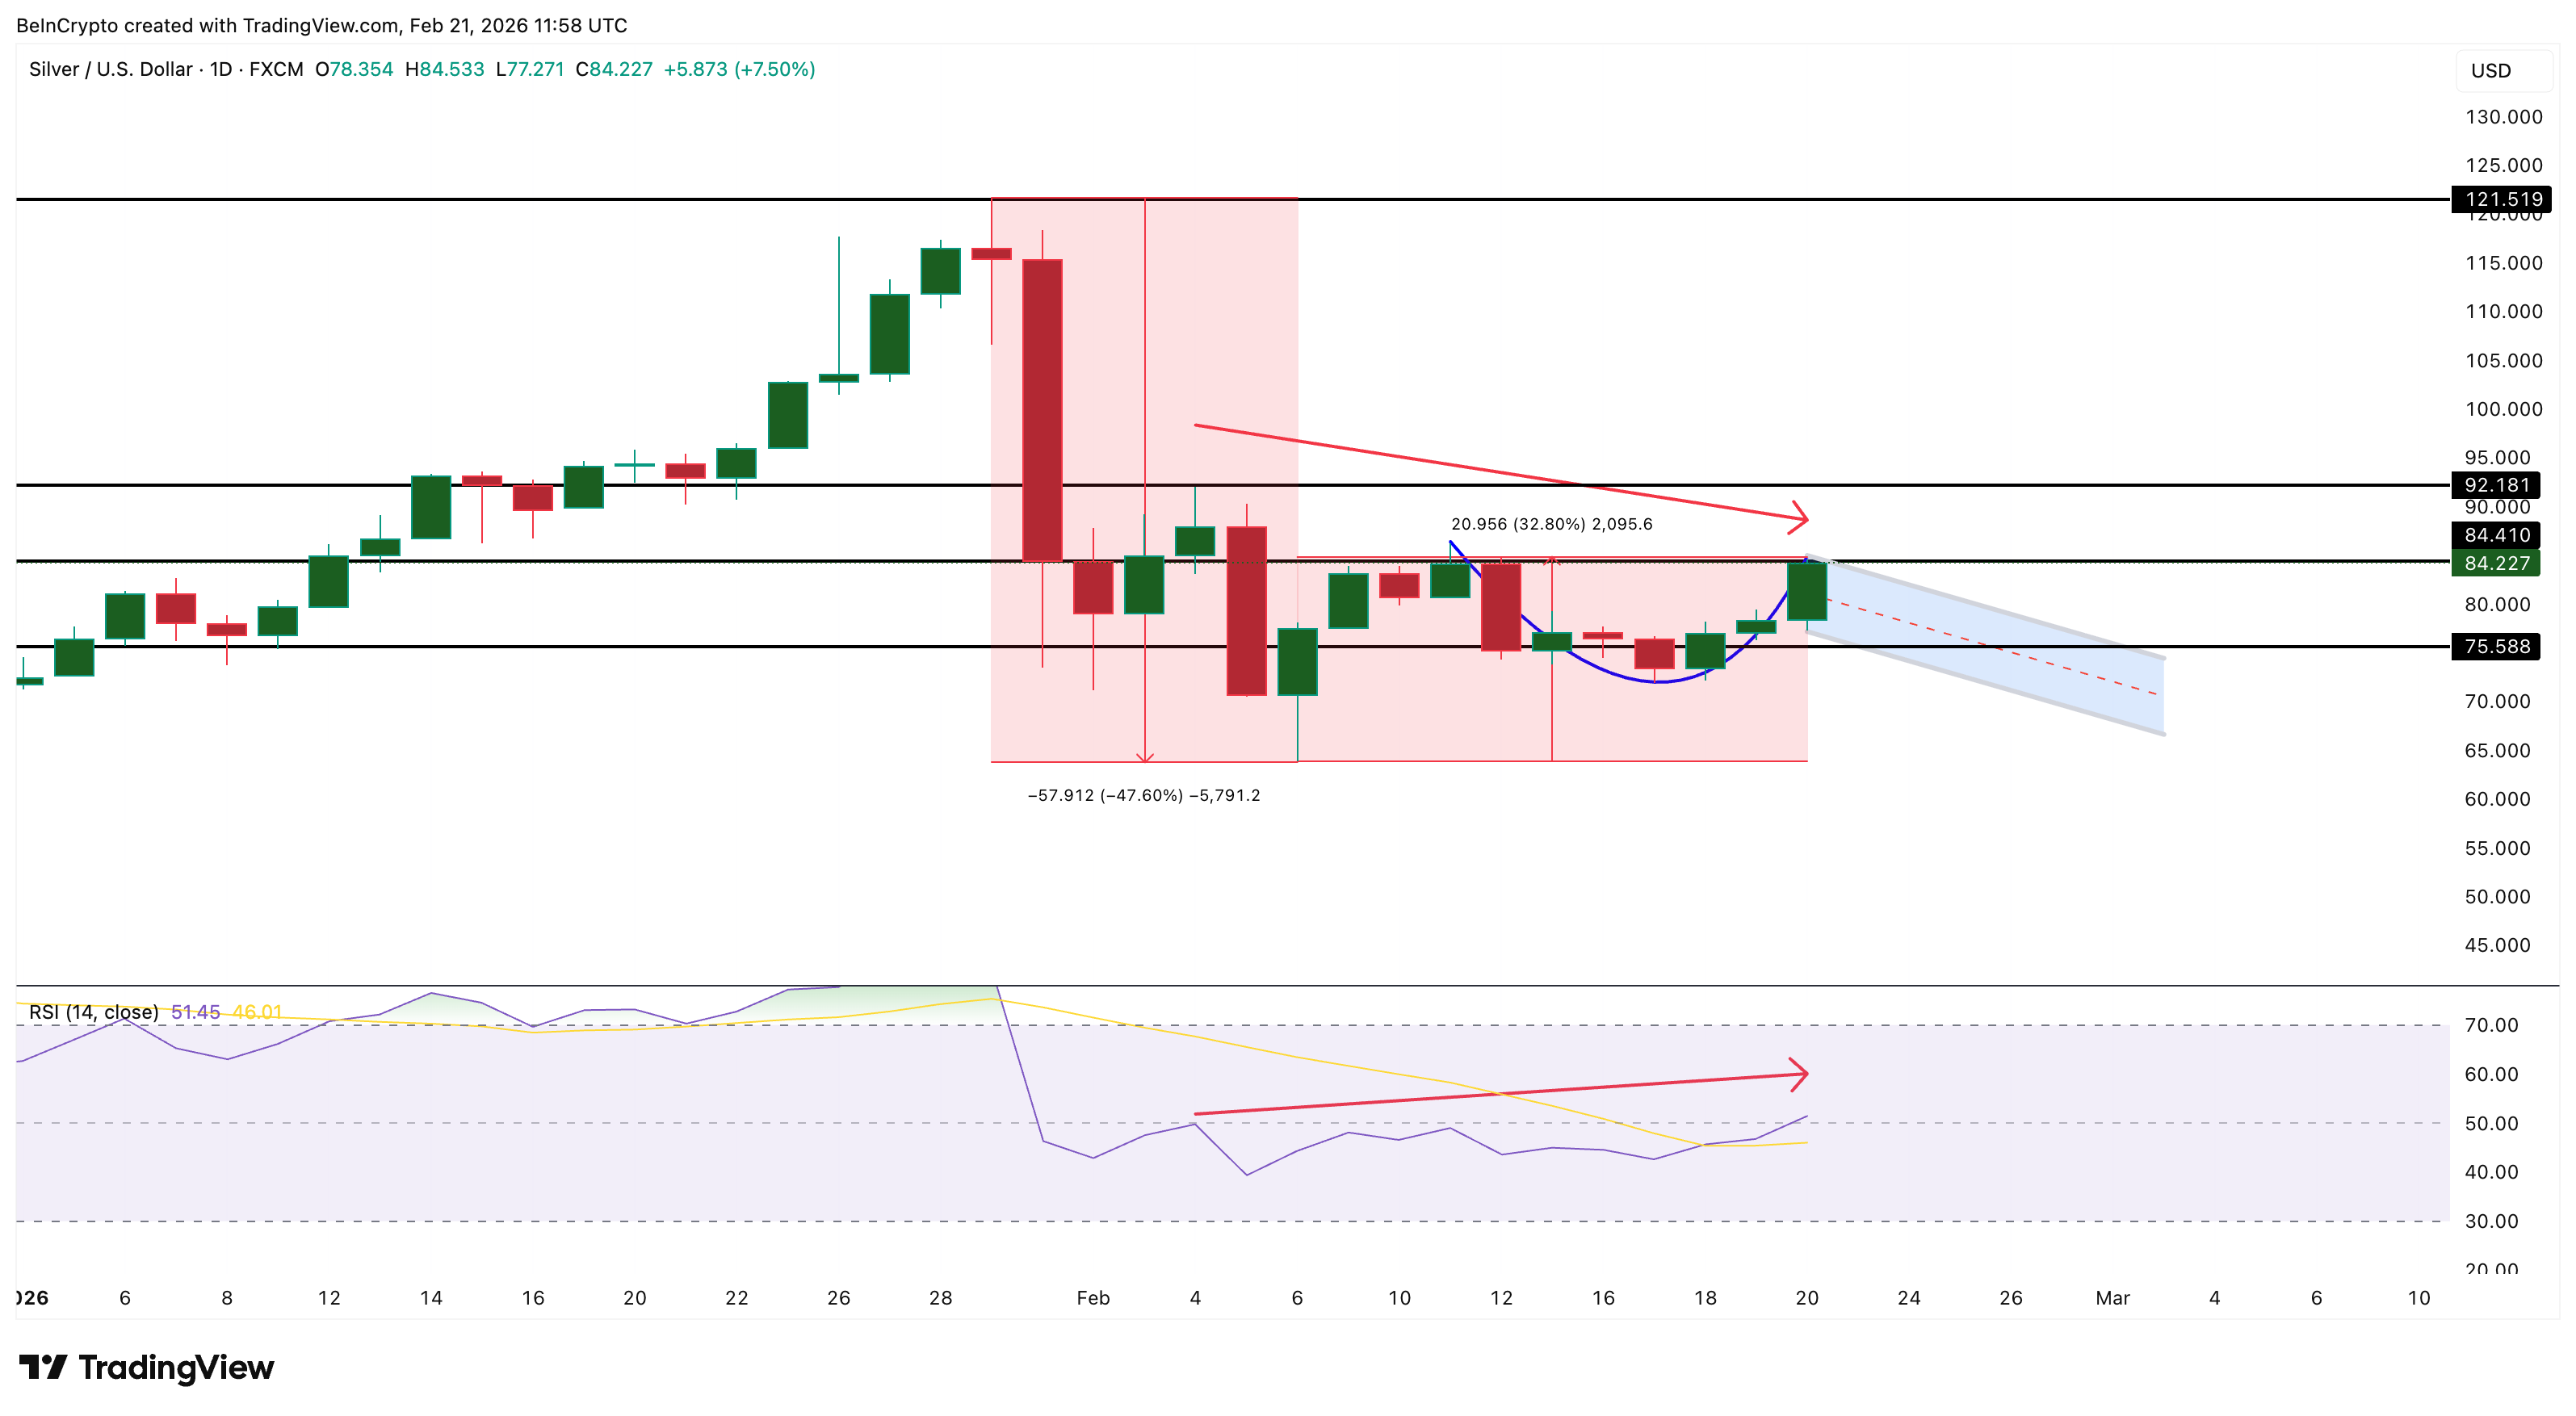
Between February 4 and February 20, silver is printing a lower high setup. But the relative strength index (RSI), a momentum indicator, during the same period is forming a higher high: a hidden bearish RSI divergence.
This signals that, despite apparent RSI strength, the price trend favors consolidation before a decisive move. This pattern holds as long as the next candle remains below $92 (the previous high) and the RSI continues to climb.
Smart money betting is betting on consolidation as well.
If the current consolidation develops into a handle, it must still hold above $75 to keep the bullish structure intact.
The cup-and-handle pattern gains validity on a clean daily close above $84. However, some consolidation is expected first — and the supporting indicators explain why a pause here is healthy rather than concerning.
Miners Lead, Silver Futures Lag: The Physical-Paper Divergence
The Global X Silver Miners ETF (SIL), trading above $107, adds early validation to the bullish case. SIL peaked at $119 on January 26 — three days before silver spot topped on January 29. Miners leading on the way up and holding relatively firm on the recovery is a classic bullish leading indicator.
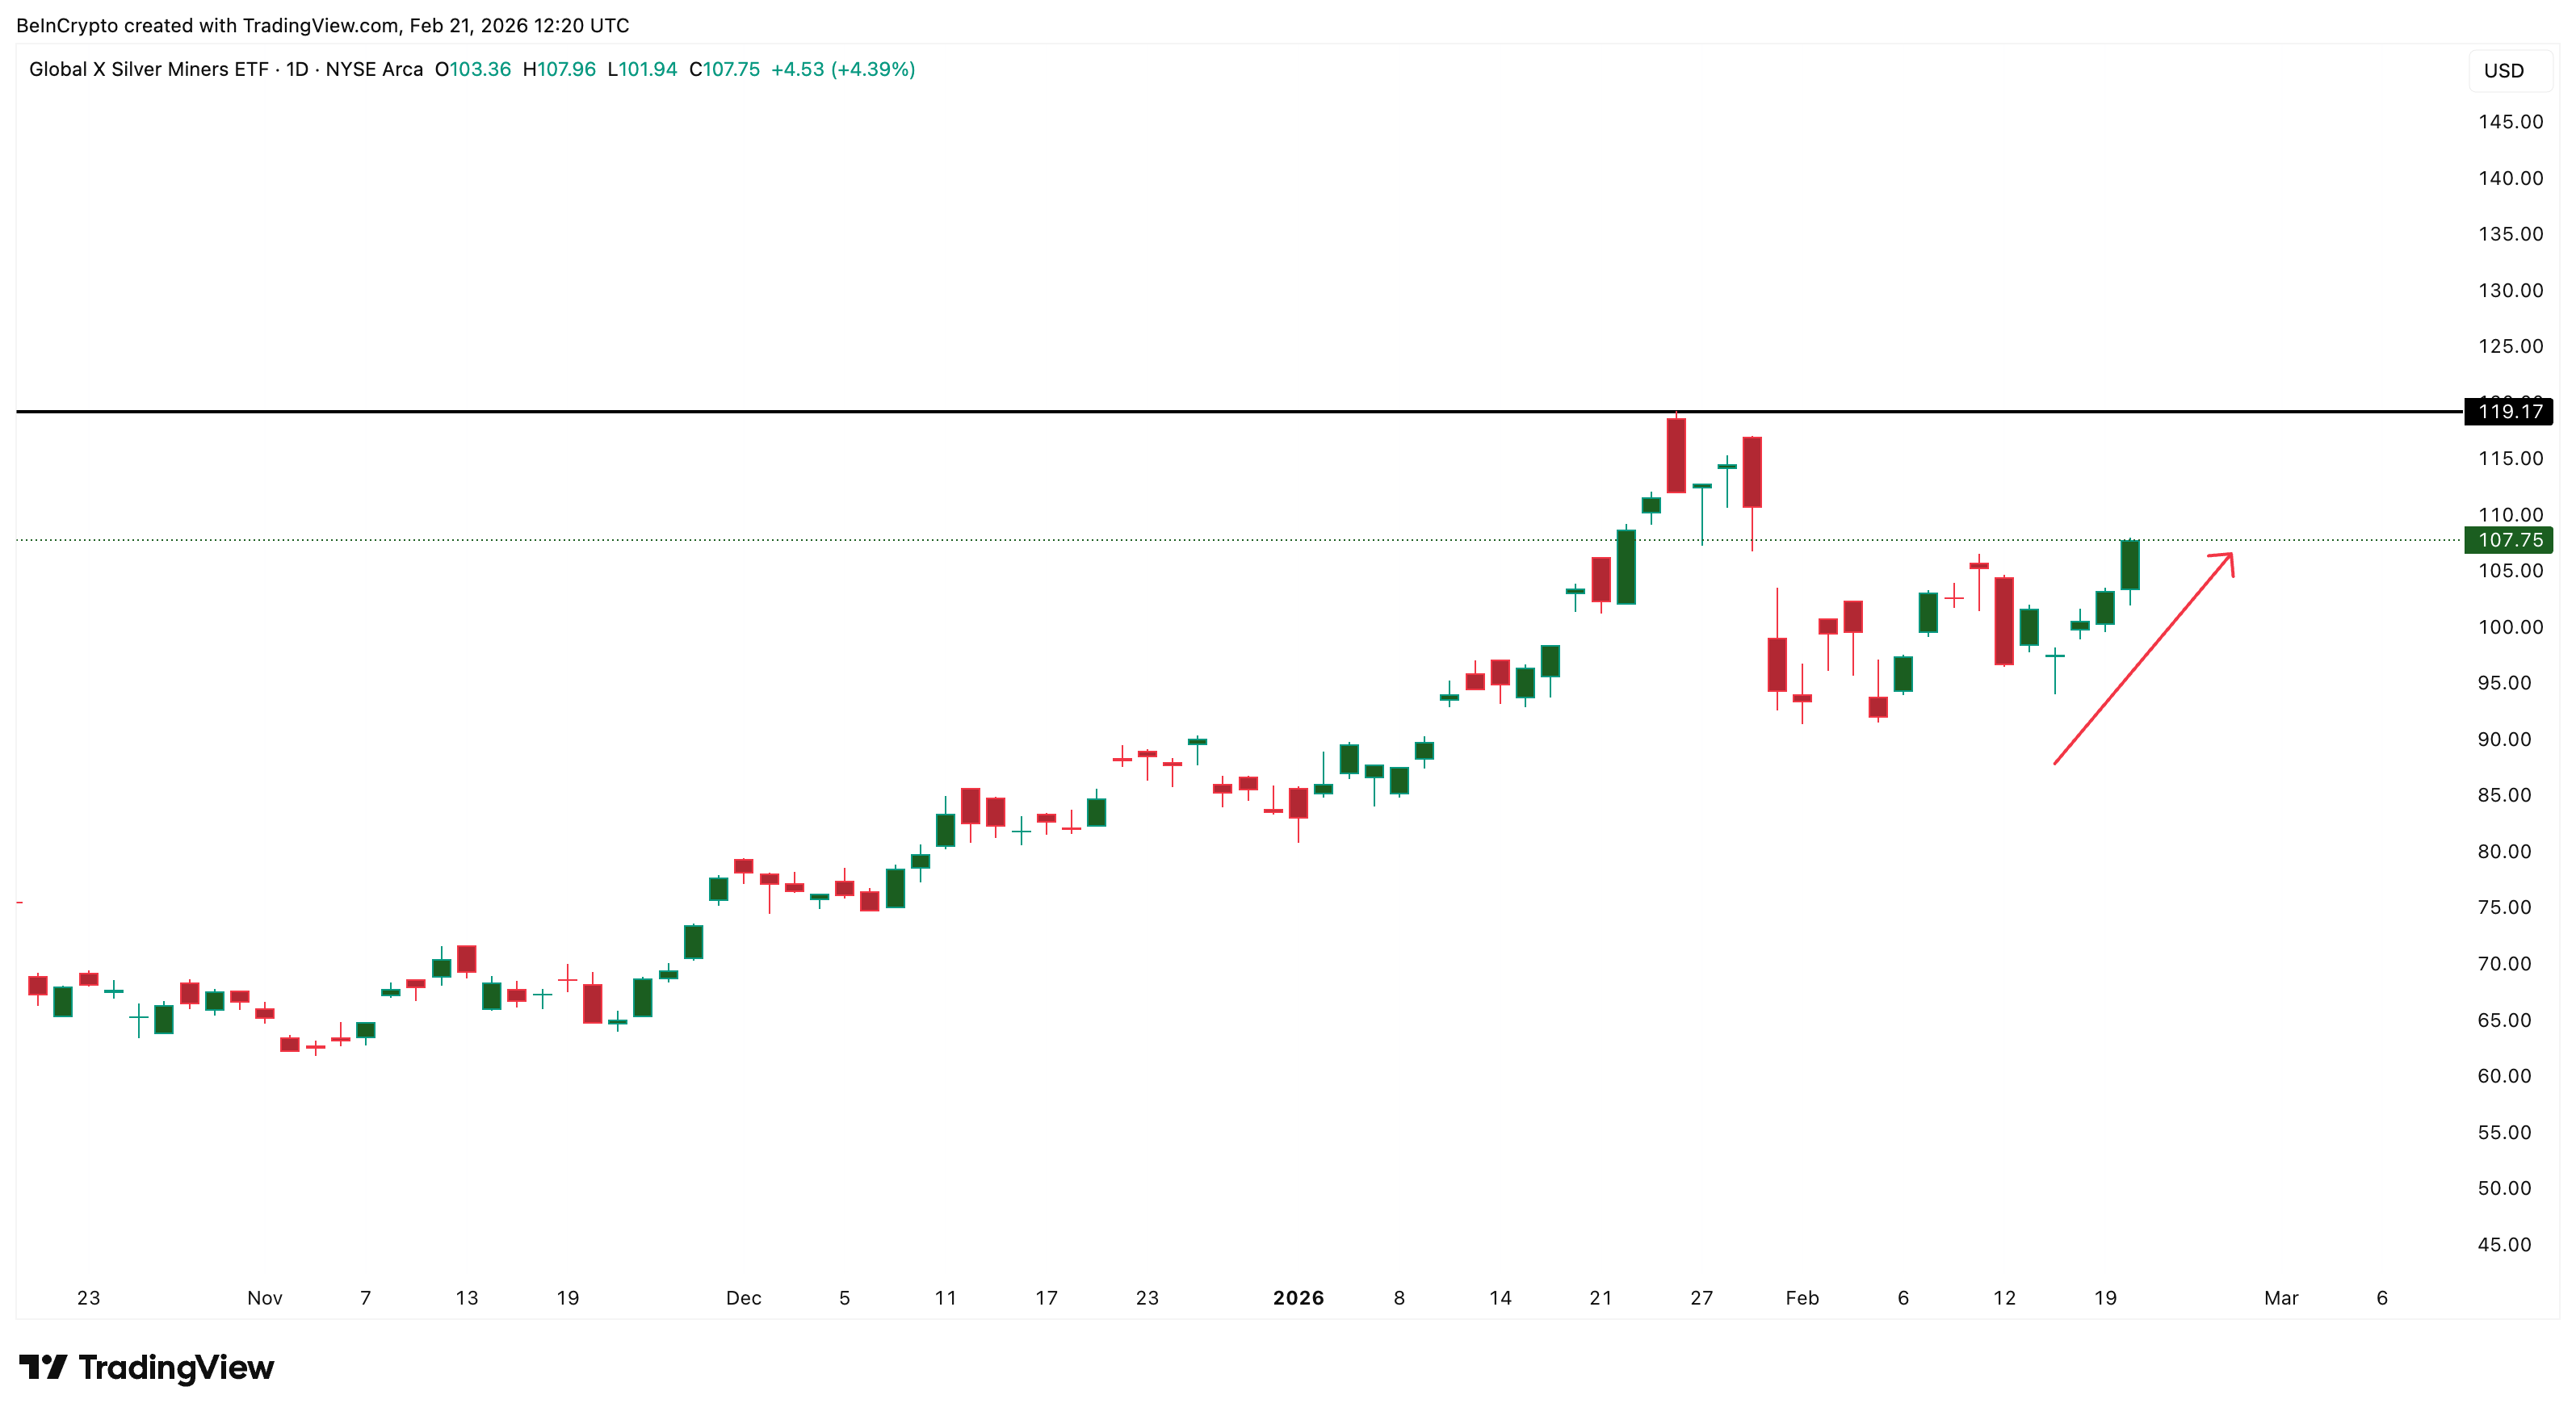
Mining companies have direct visibility into industrial order books and production demand, and their resilience suggests the fundamental picture remains intact despite the January liquidation. When miners hold while the metal consolidates, it typically signals that the next move is higher, not lower.
The disconnect between this physical market’s strength and the futures market’s hesitancy defines the current silver landscape.
COMEX silver futures (SI1!) are trading around $82 — below the spot price of $84. This backwardation (futures below spot) is rare and significant. It means buyers are willing to pay a premium for physical silver now rather than wait for future delivery.
The market is pricing urgency into spot, signaling physical tightness in the supply chain.
However, open interest on SI1! has been steadily declining since February 6, even as the Silver price rose from $63 to $82. A rising price amid falling open interest is the signature of a short-covering rally — traders who were short after the crash are buying back their positions, pushing the price higher.
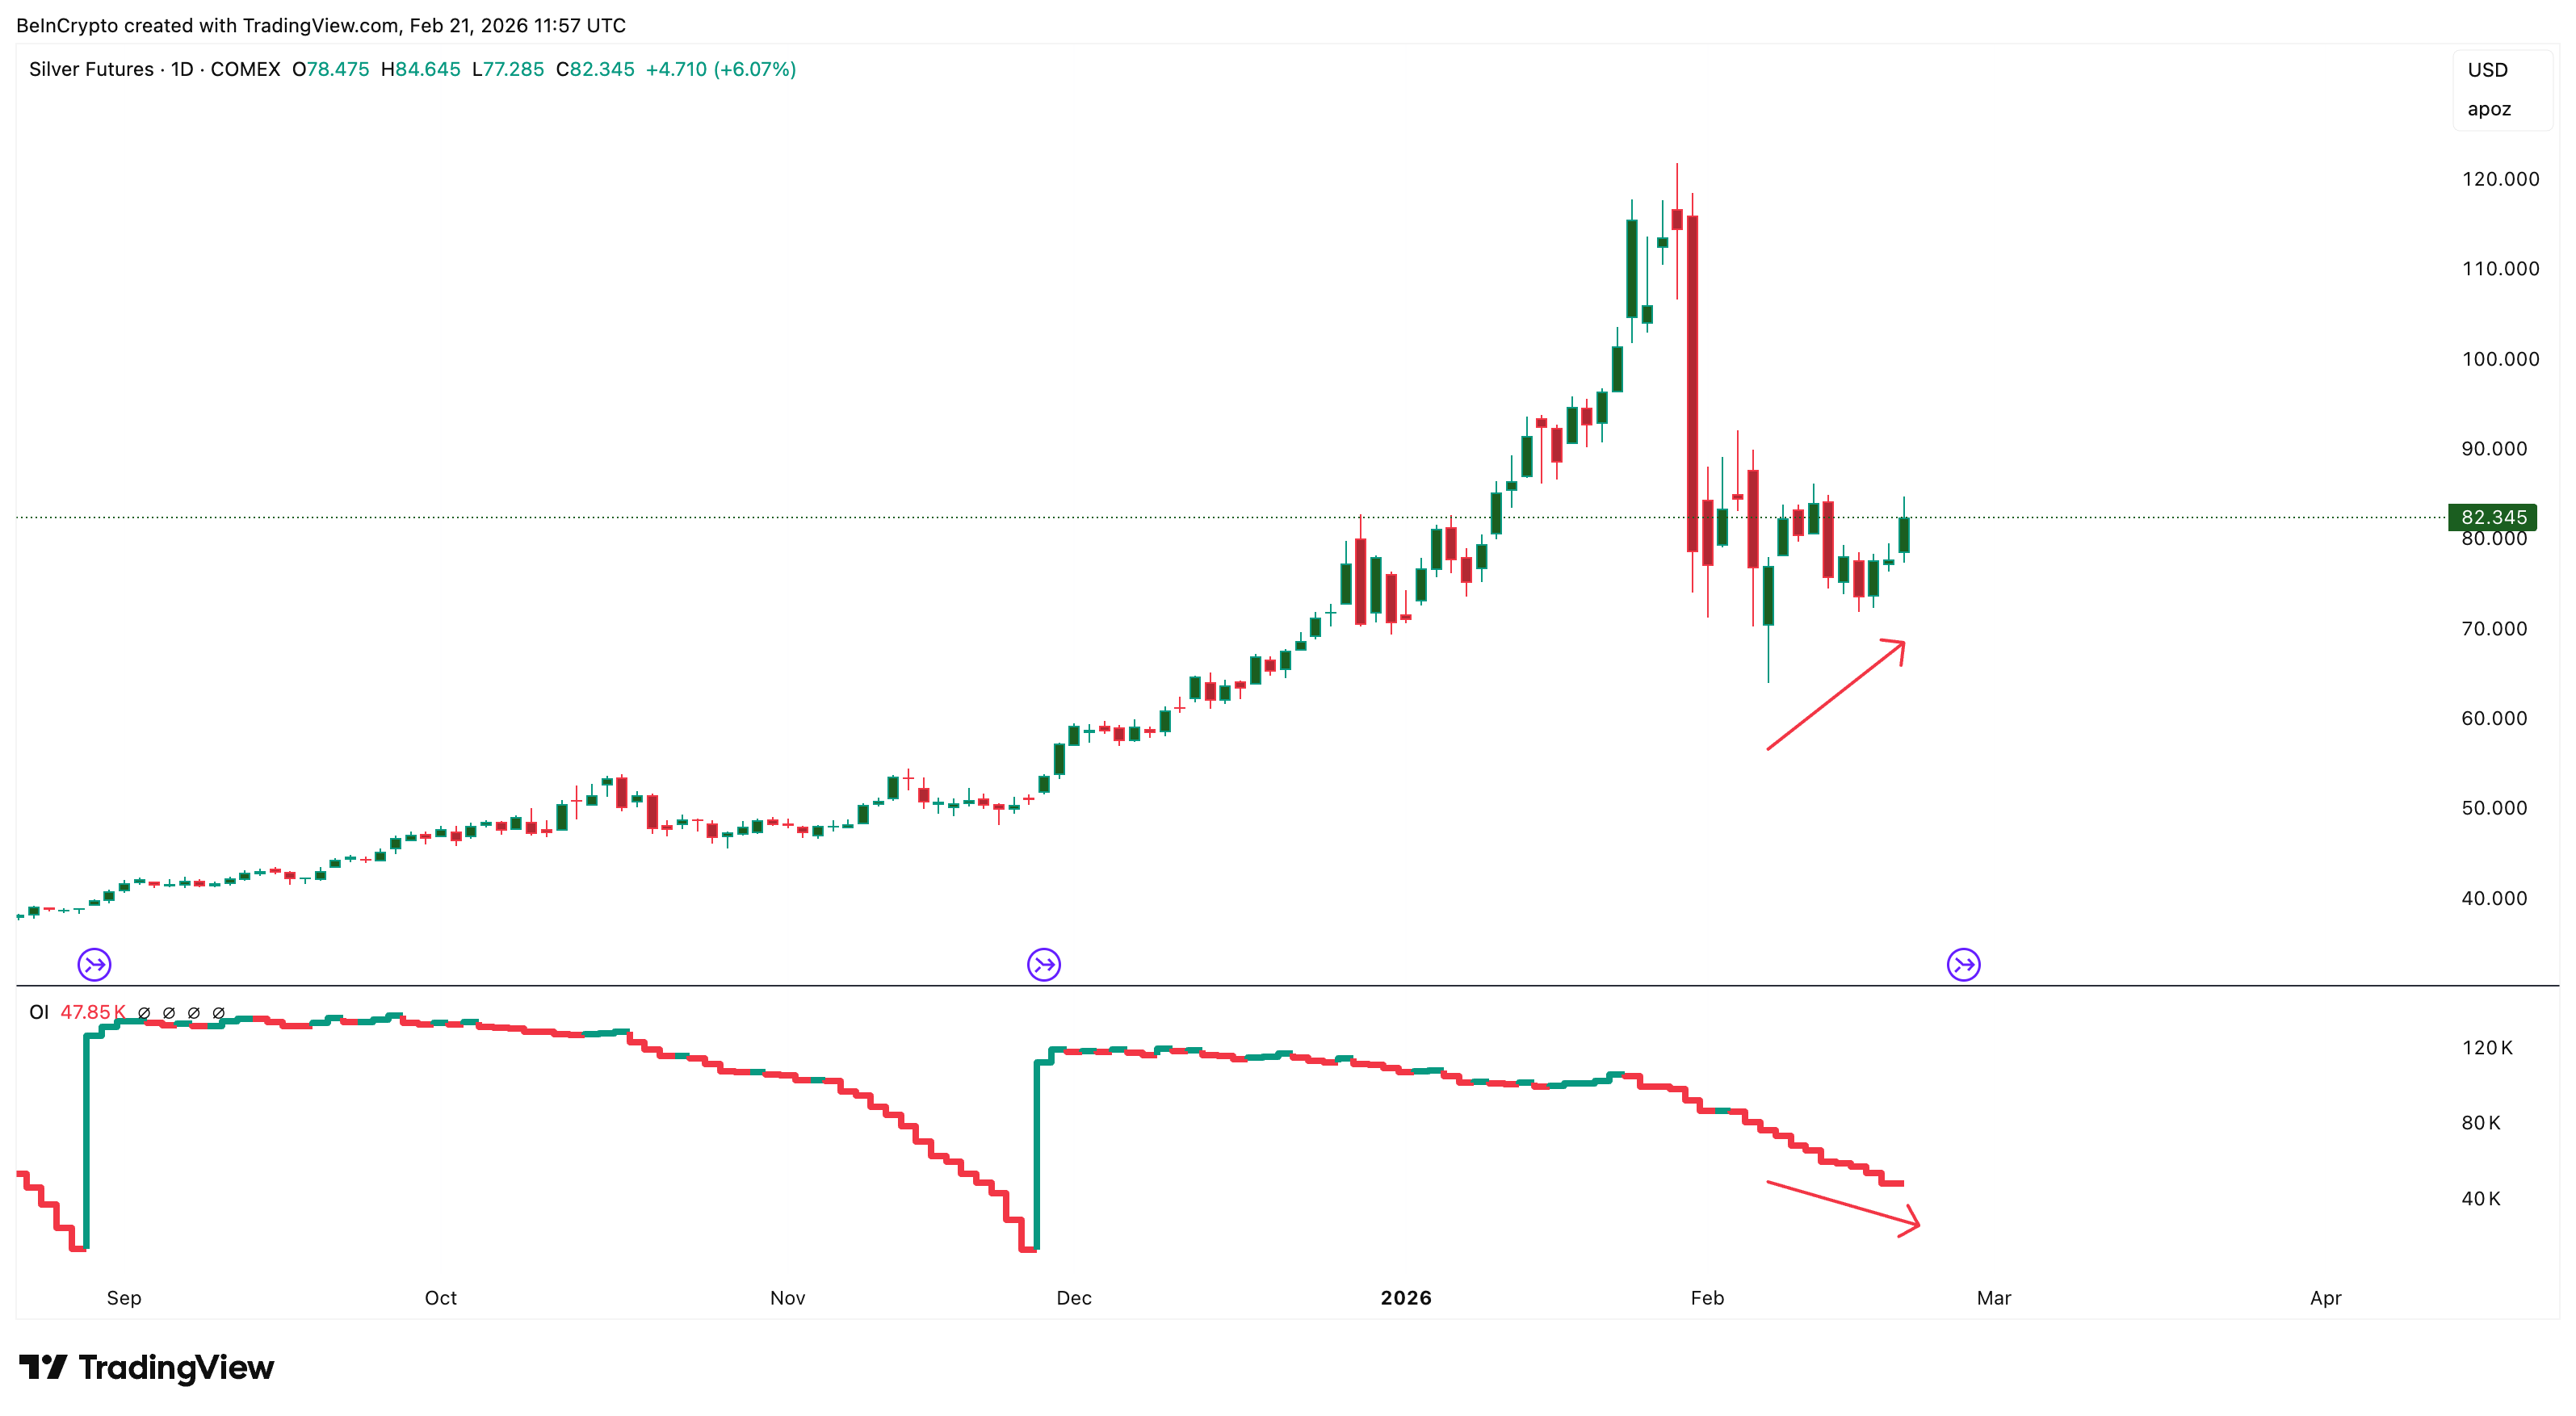
This is not fresh money entering yet. It is the aftermath of the January wipeout clearing out. Short covering rallies have a natural ceiling, and once covering is exhausted, the price needs new buyers to sustain momentum.
This is where the transition to consolidation becomes the most probable near-term path — the short-covering fuel is running low, but the next wave of buying hasn’t arrived yet, as explained later.
Dollar Divergence, Gold Ratio Risks, And Hedge Funds On The Sidelines
The macro and positioning layers explain why consolidation is healthy rather than dangerous.
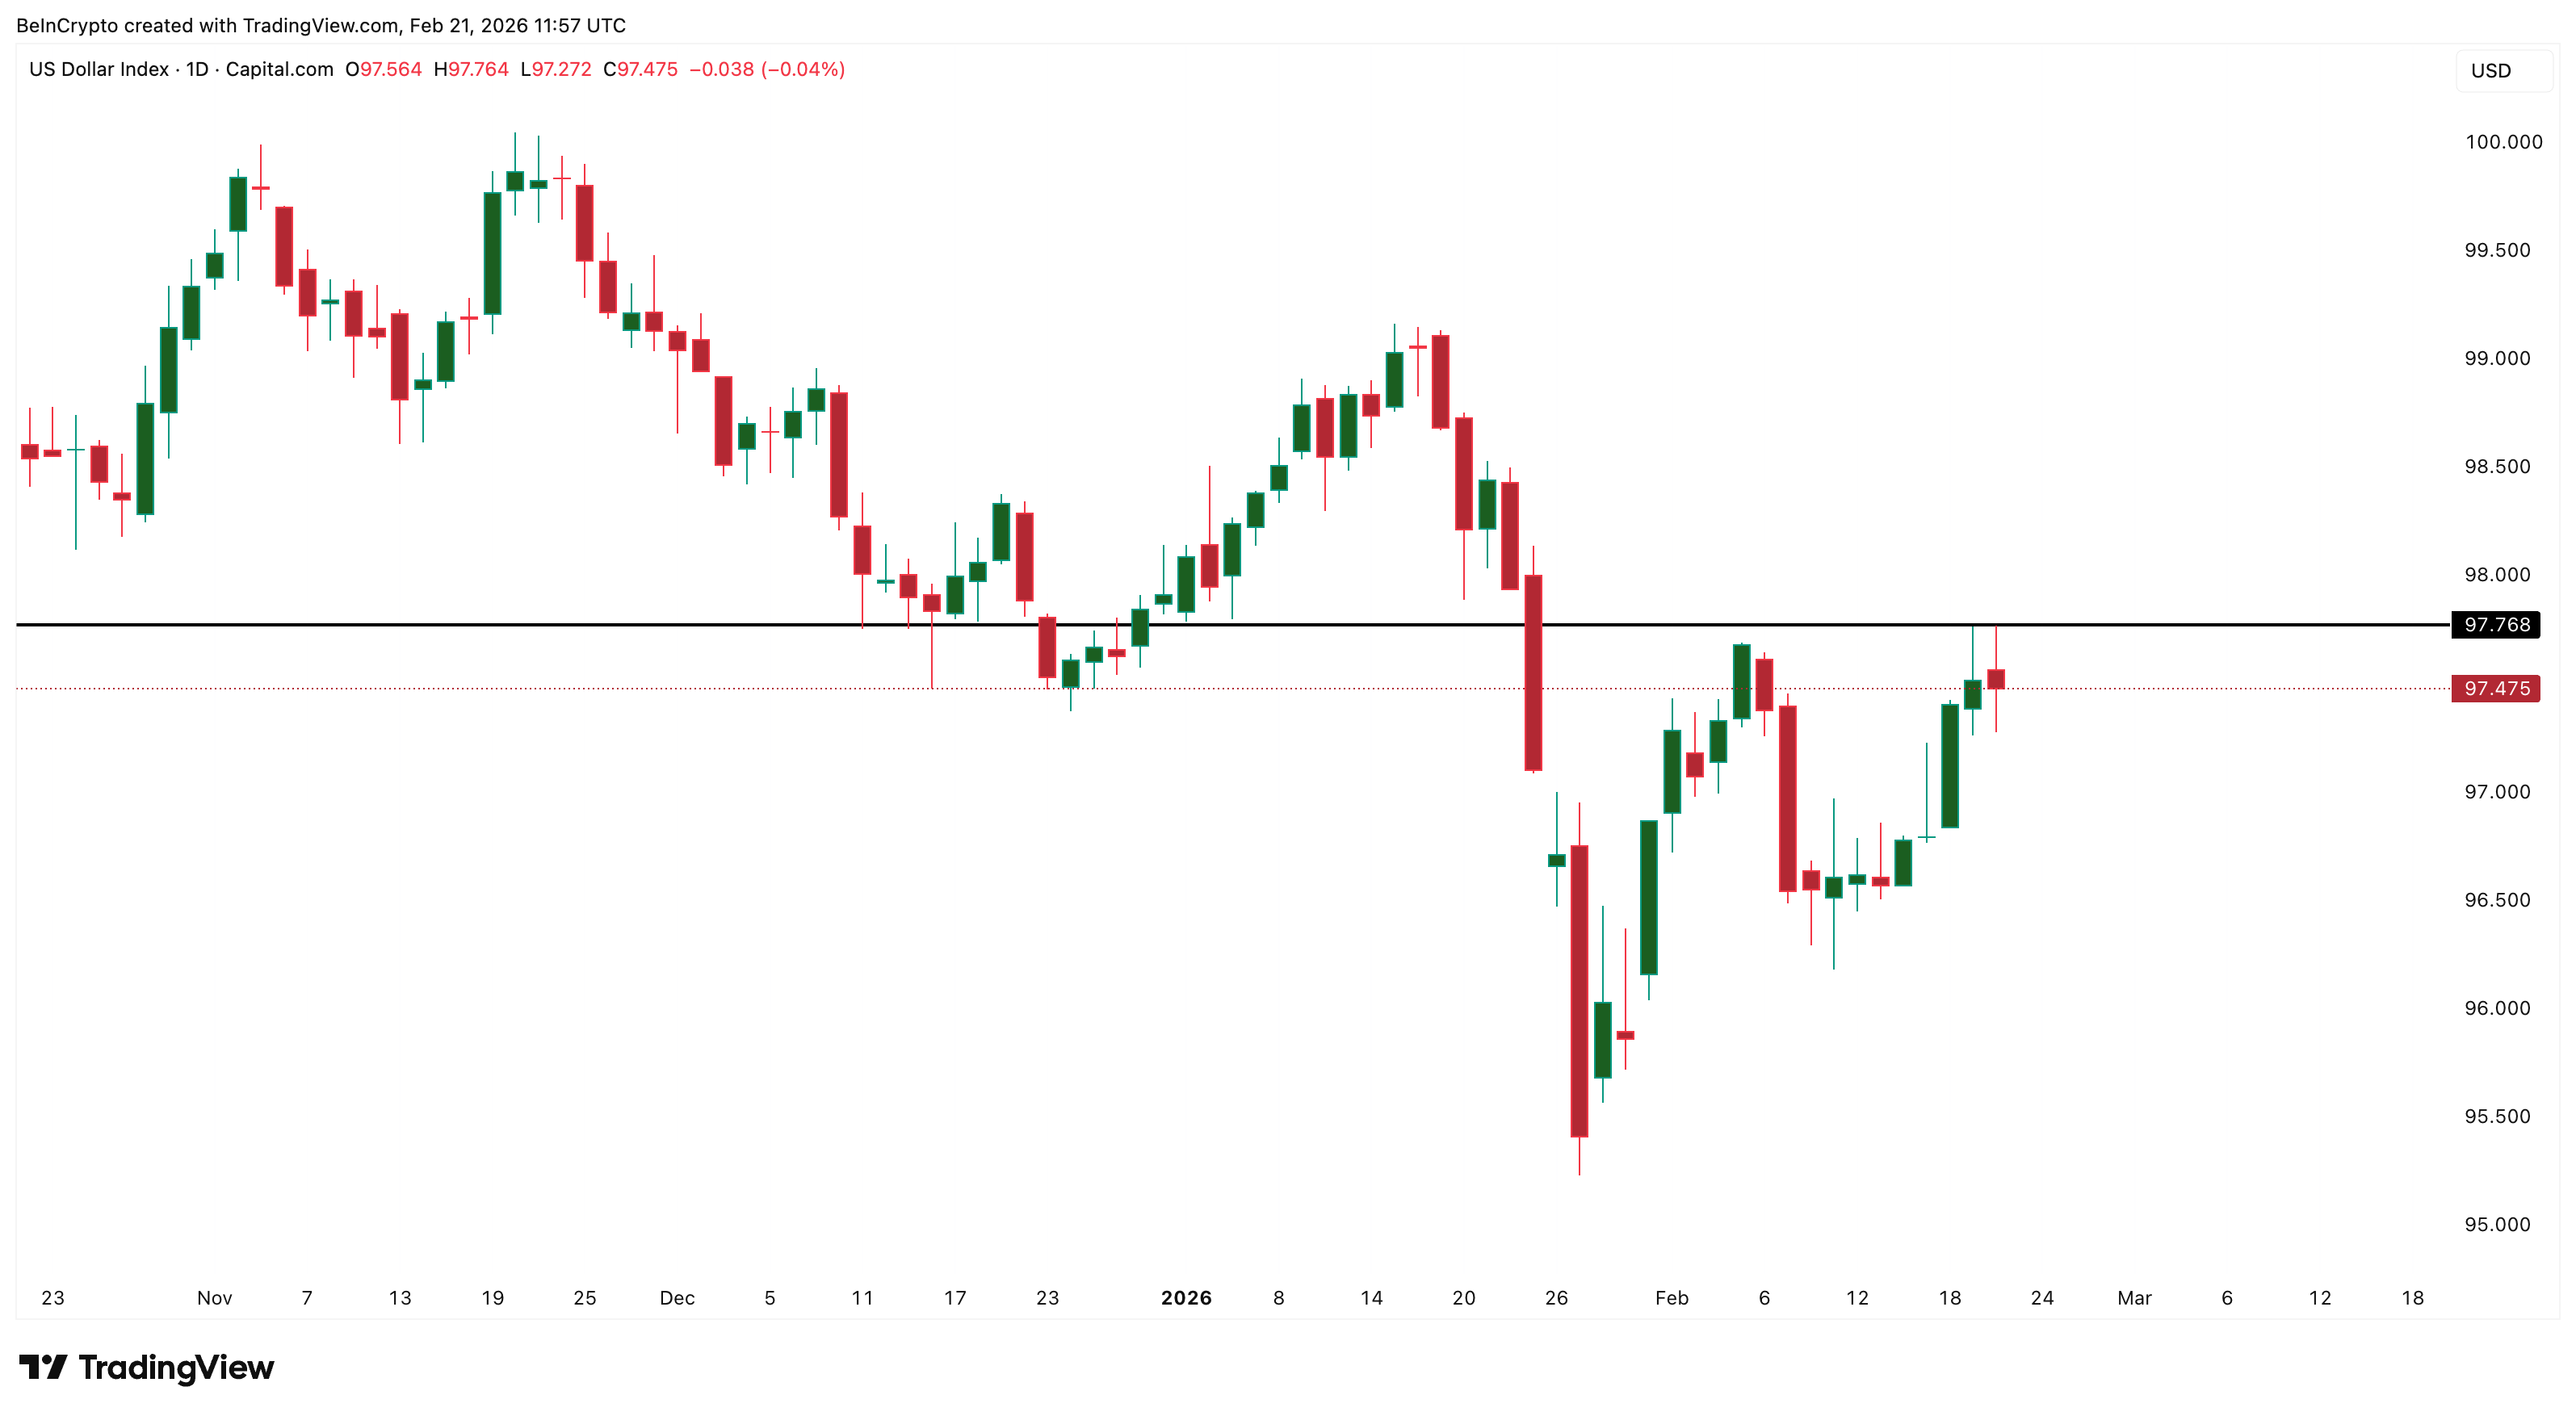
The US Dollar Index (DXY) sits above 97, having risen steadily since February 11. But since February 17, silver decoupled and started rising alongside the dollar. This is one of the strongest signals in the current setup. When silver rises despite dollar headwinds, it means underlying demand. Buyers want silver now, regardless of what the dollar is doing.
The Gold-Silver Ratio (XAUXAG) adds a layer of caution. Currently at 60, the ratio has been declining since February 17, meaning silver has been outperforming gold.
However, the ratio is consolidating inside a bullish flag pattern. A breakout above the upper trendline could push it toward 70 or higher.
If that happens, gold would reclaim dominance over silver — the market rotating back from silver’s risk-on appeal toward gold’s safe-haven purity.
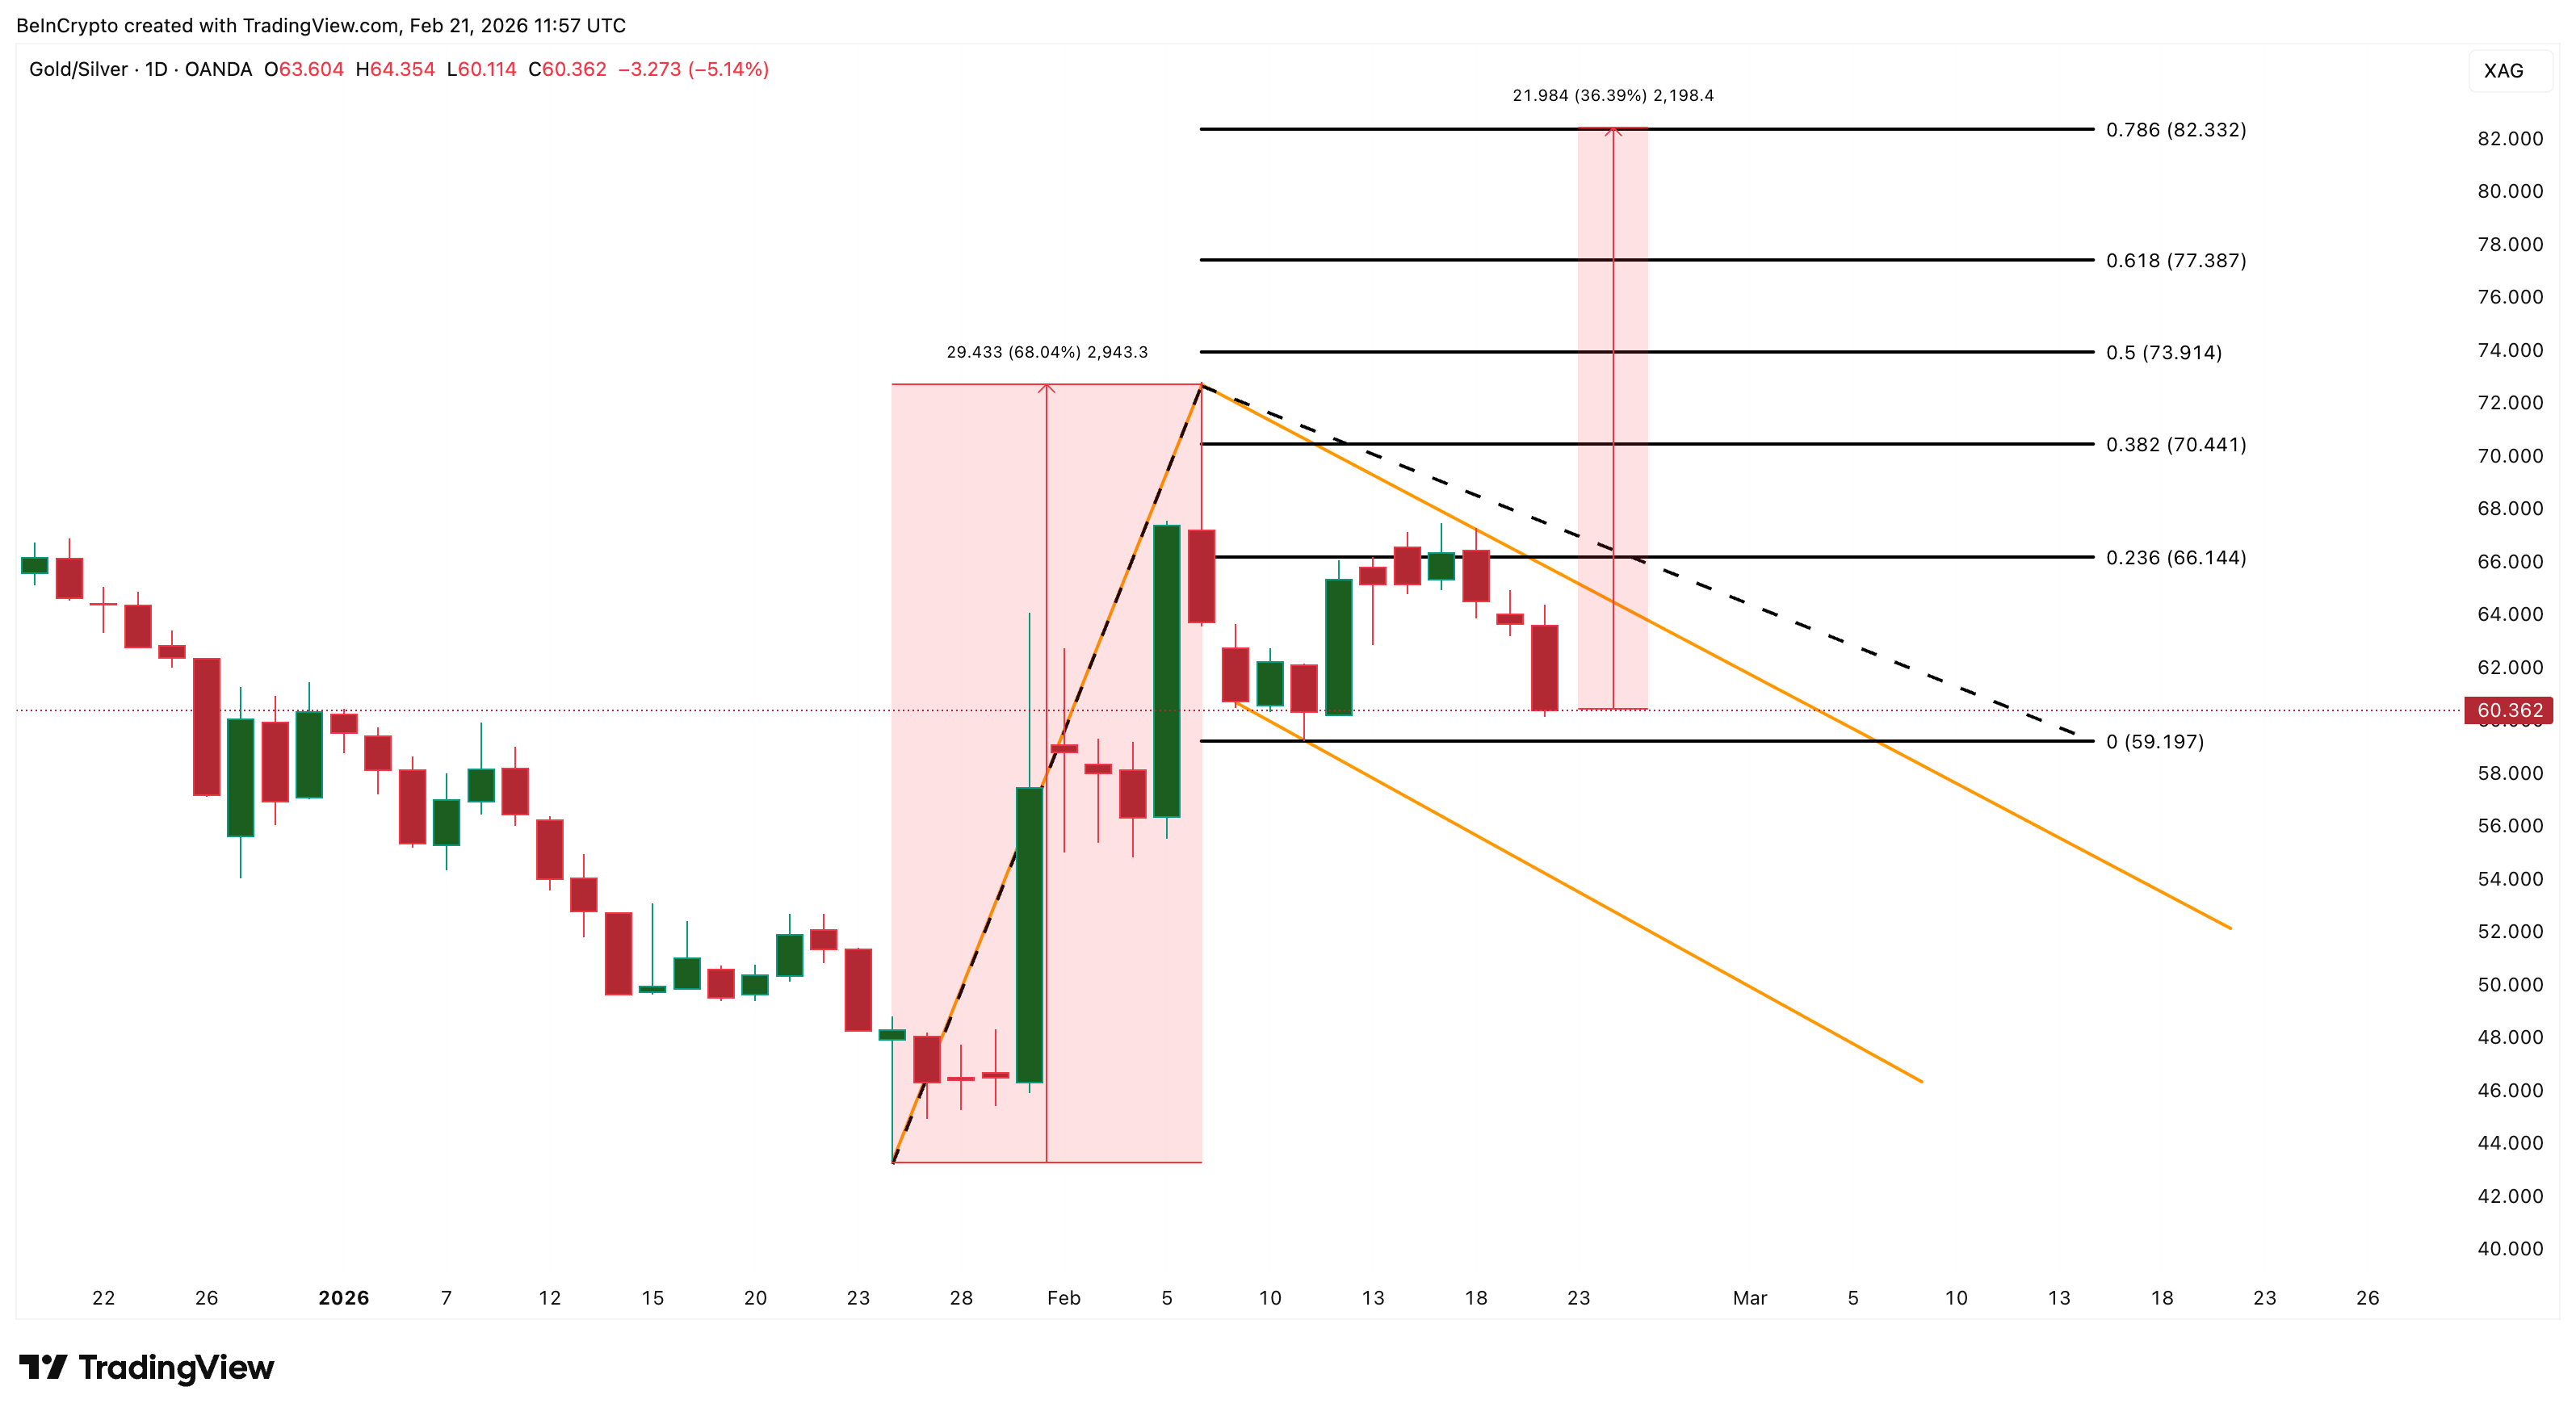
This would cap silver’s upside momentum or trigger a pullback. As long as the flag holds without breaking upward, silver’s outperformance can continue, but this is a risk to watch in March.
The tiebreaker comes from the COT (Commitment of Traders) report dated February 17. Managed Money — hedge funds and Commodity Trading Advisors — holds a net long position of just 5,472 contracts. During the rally to $121, hedge funds were positioned at multiples of this level.
A reading this low means the speculative heavyweights are still on the sidelines, waiting for a confirmed base before committing capital.
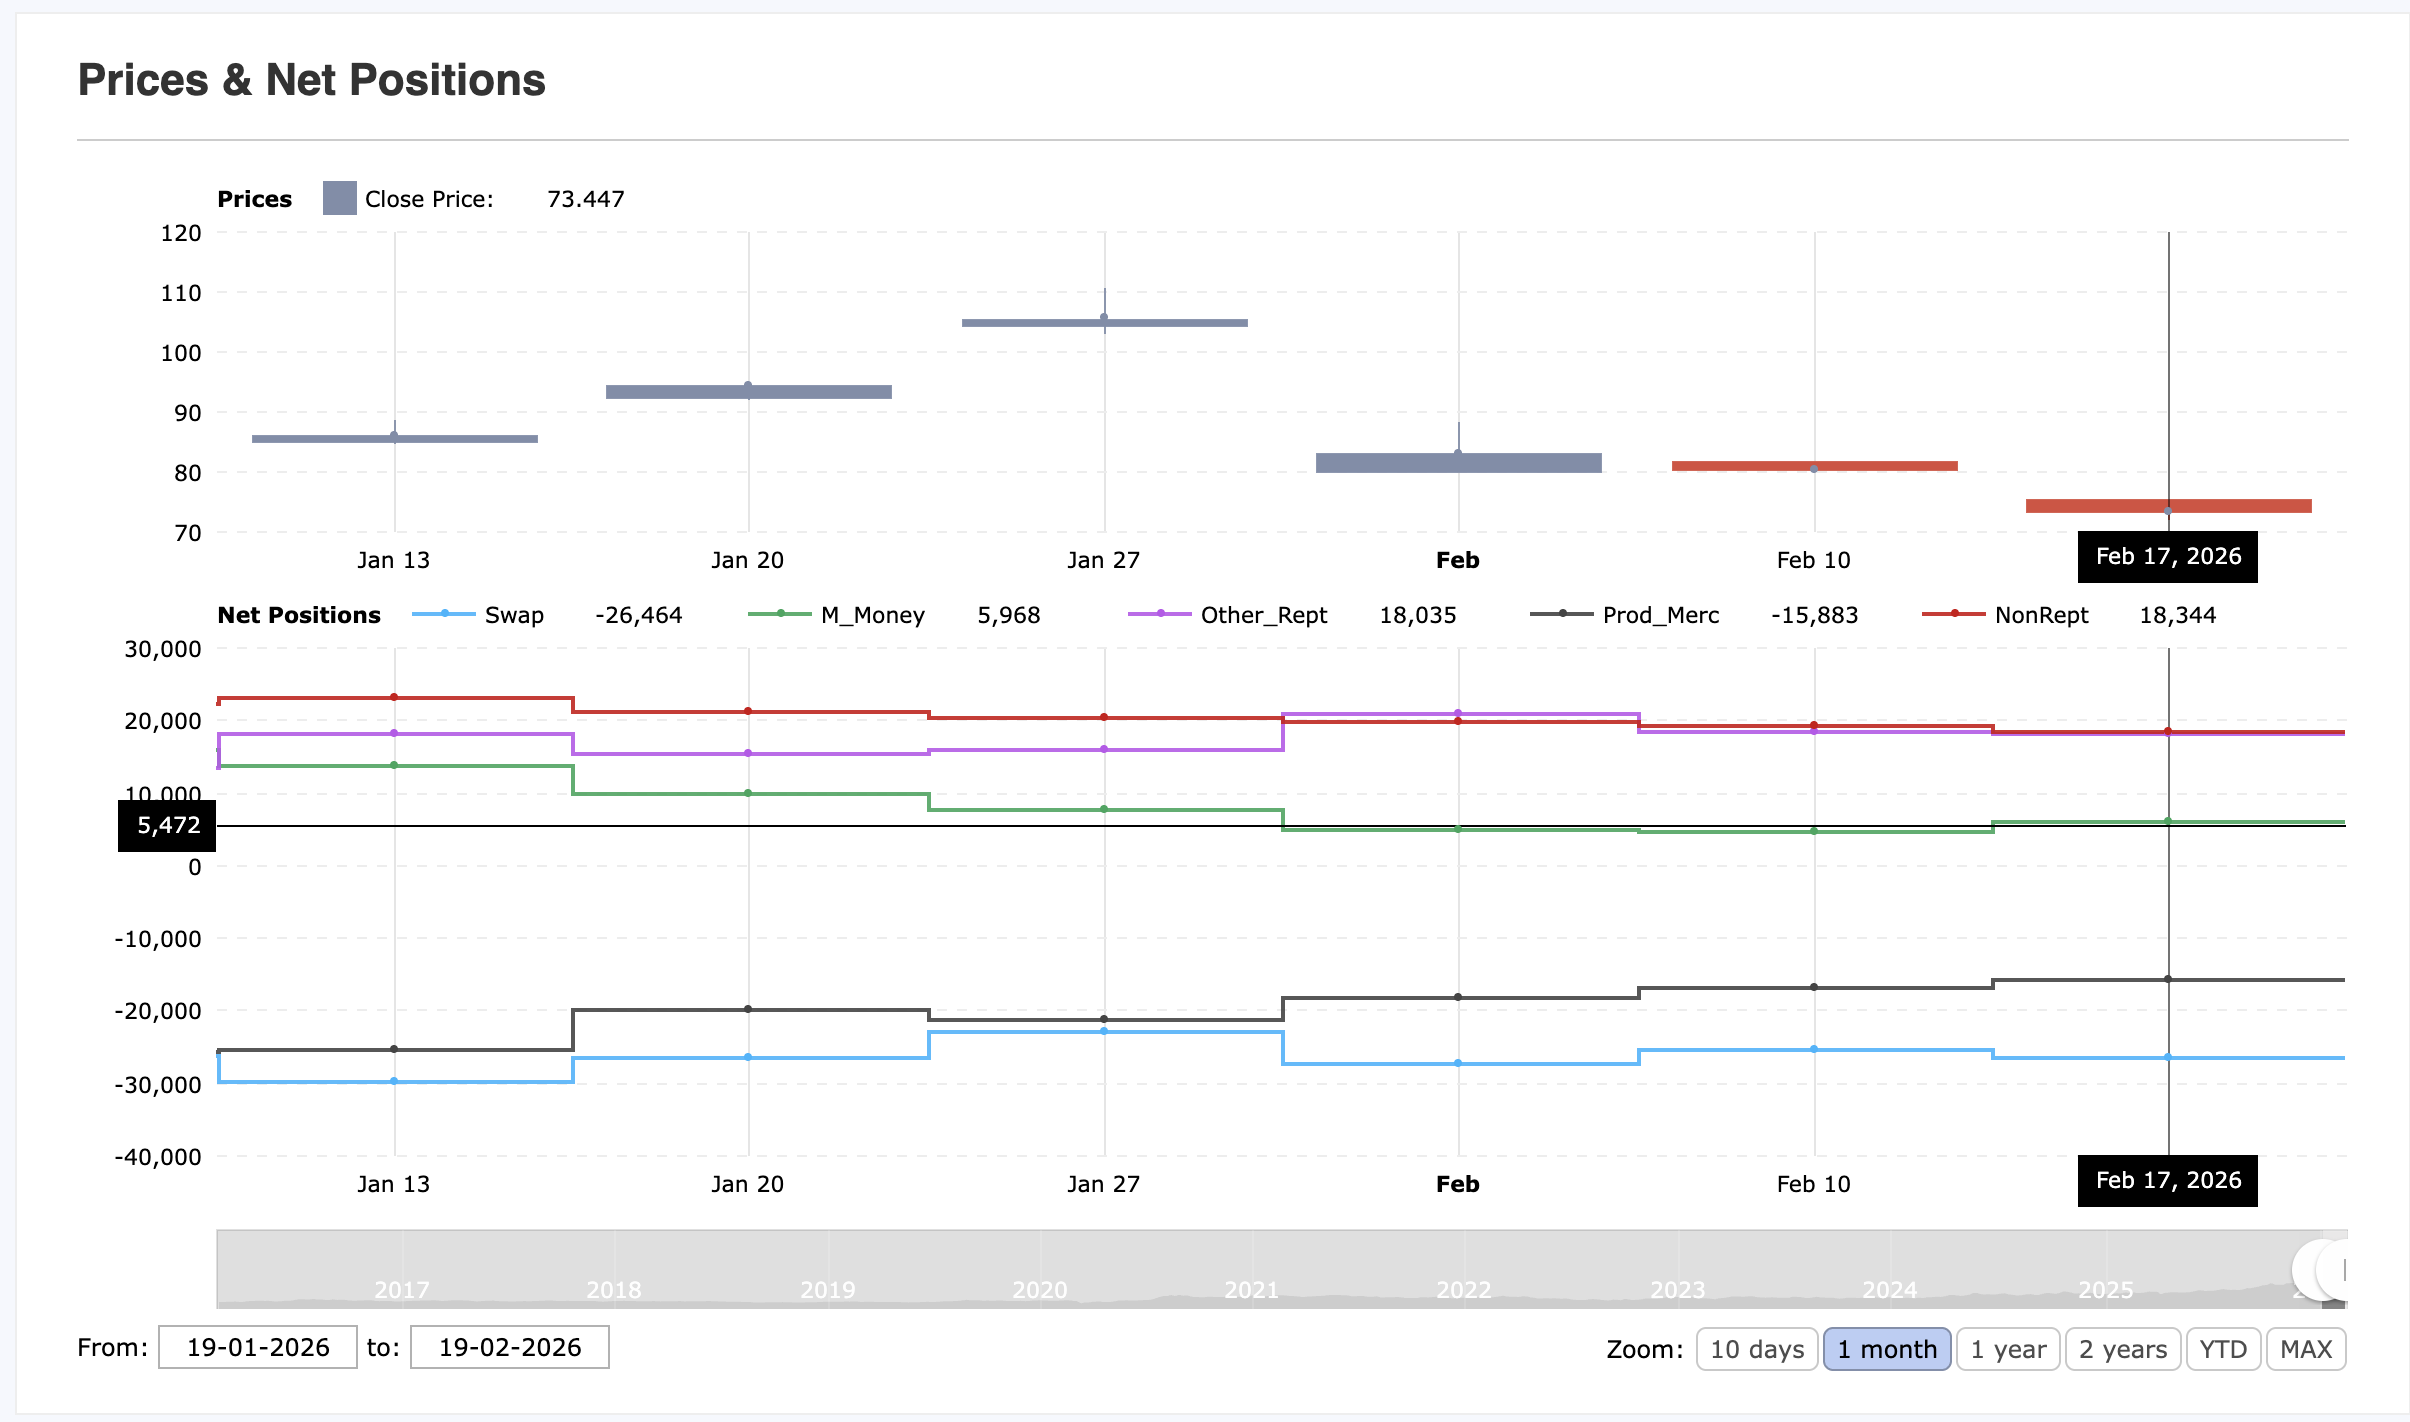
This is simultaneously the most bullish medium-term signal and the clearest explanation for near-term consolidation. There is massive room for fresh institutional buying when hedge funds re-enter. But they need to see a stable base and a clear breakout — likely above $92 — before stepping in.
March 2026 Outlook: Silver Price Levels To Watch
Four of seven key indicators lean bullish. These include Miners leading via SIL strength, backwardation confirming physical demand urgency, dollar-silver divergence showing genuine underlying buying pressure, and hedge funds barely positioned with massive room to re-enter.
Plus, three indicators urge caution. These include declining COMEX open interest, hidden bearish divergence, and the gold-silver ratio’s bullish flag threatening to rotate momentum back toward gold.
The most probable path for March: silver consolidates between $75 and $92 as the market builds a base that gives Managed Money the confidence to re-enter.
A daily close above $84 confirms the cup-and-handle neckline. A push above $91–$92 validates the full breakout and opens the door to $100 — a psychologically significant level likely achievable by mid-March.
Extended targets of $121 (a retest of the all-time high) and $136 (the full Fibonacci extension) become realistic if the rally sustains through March with rising open interest confirming fresh institutional participation.
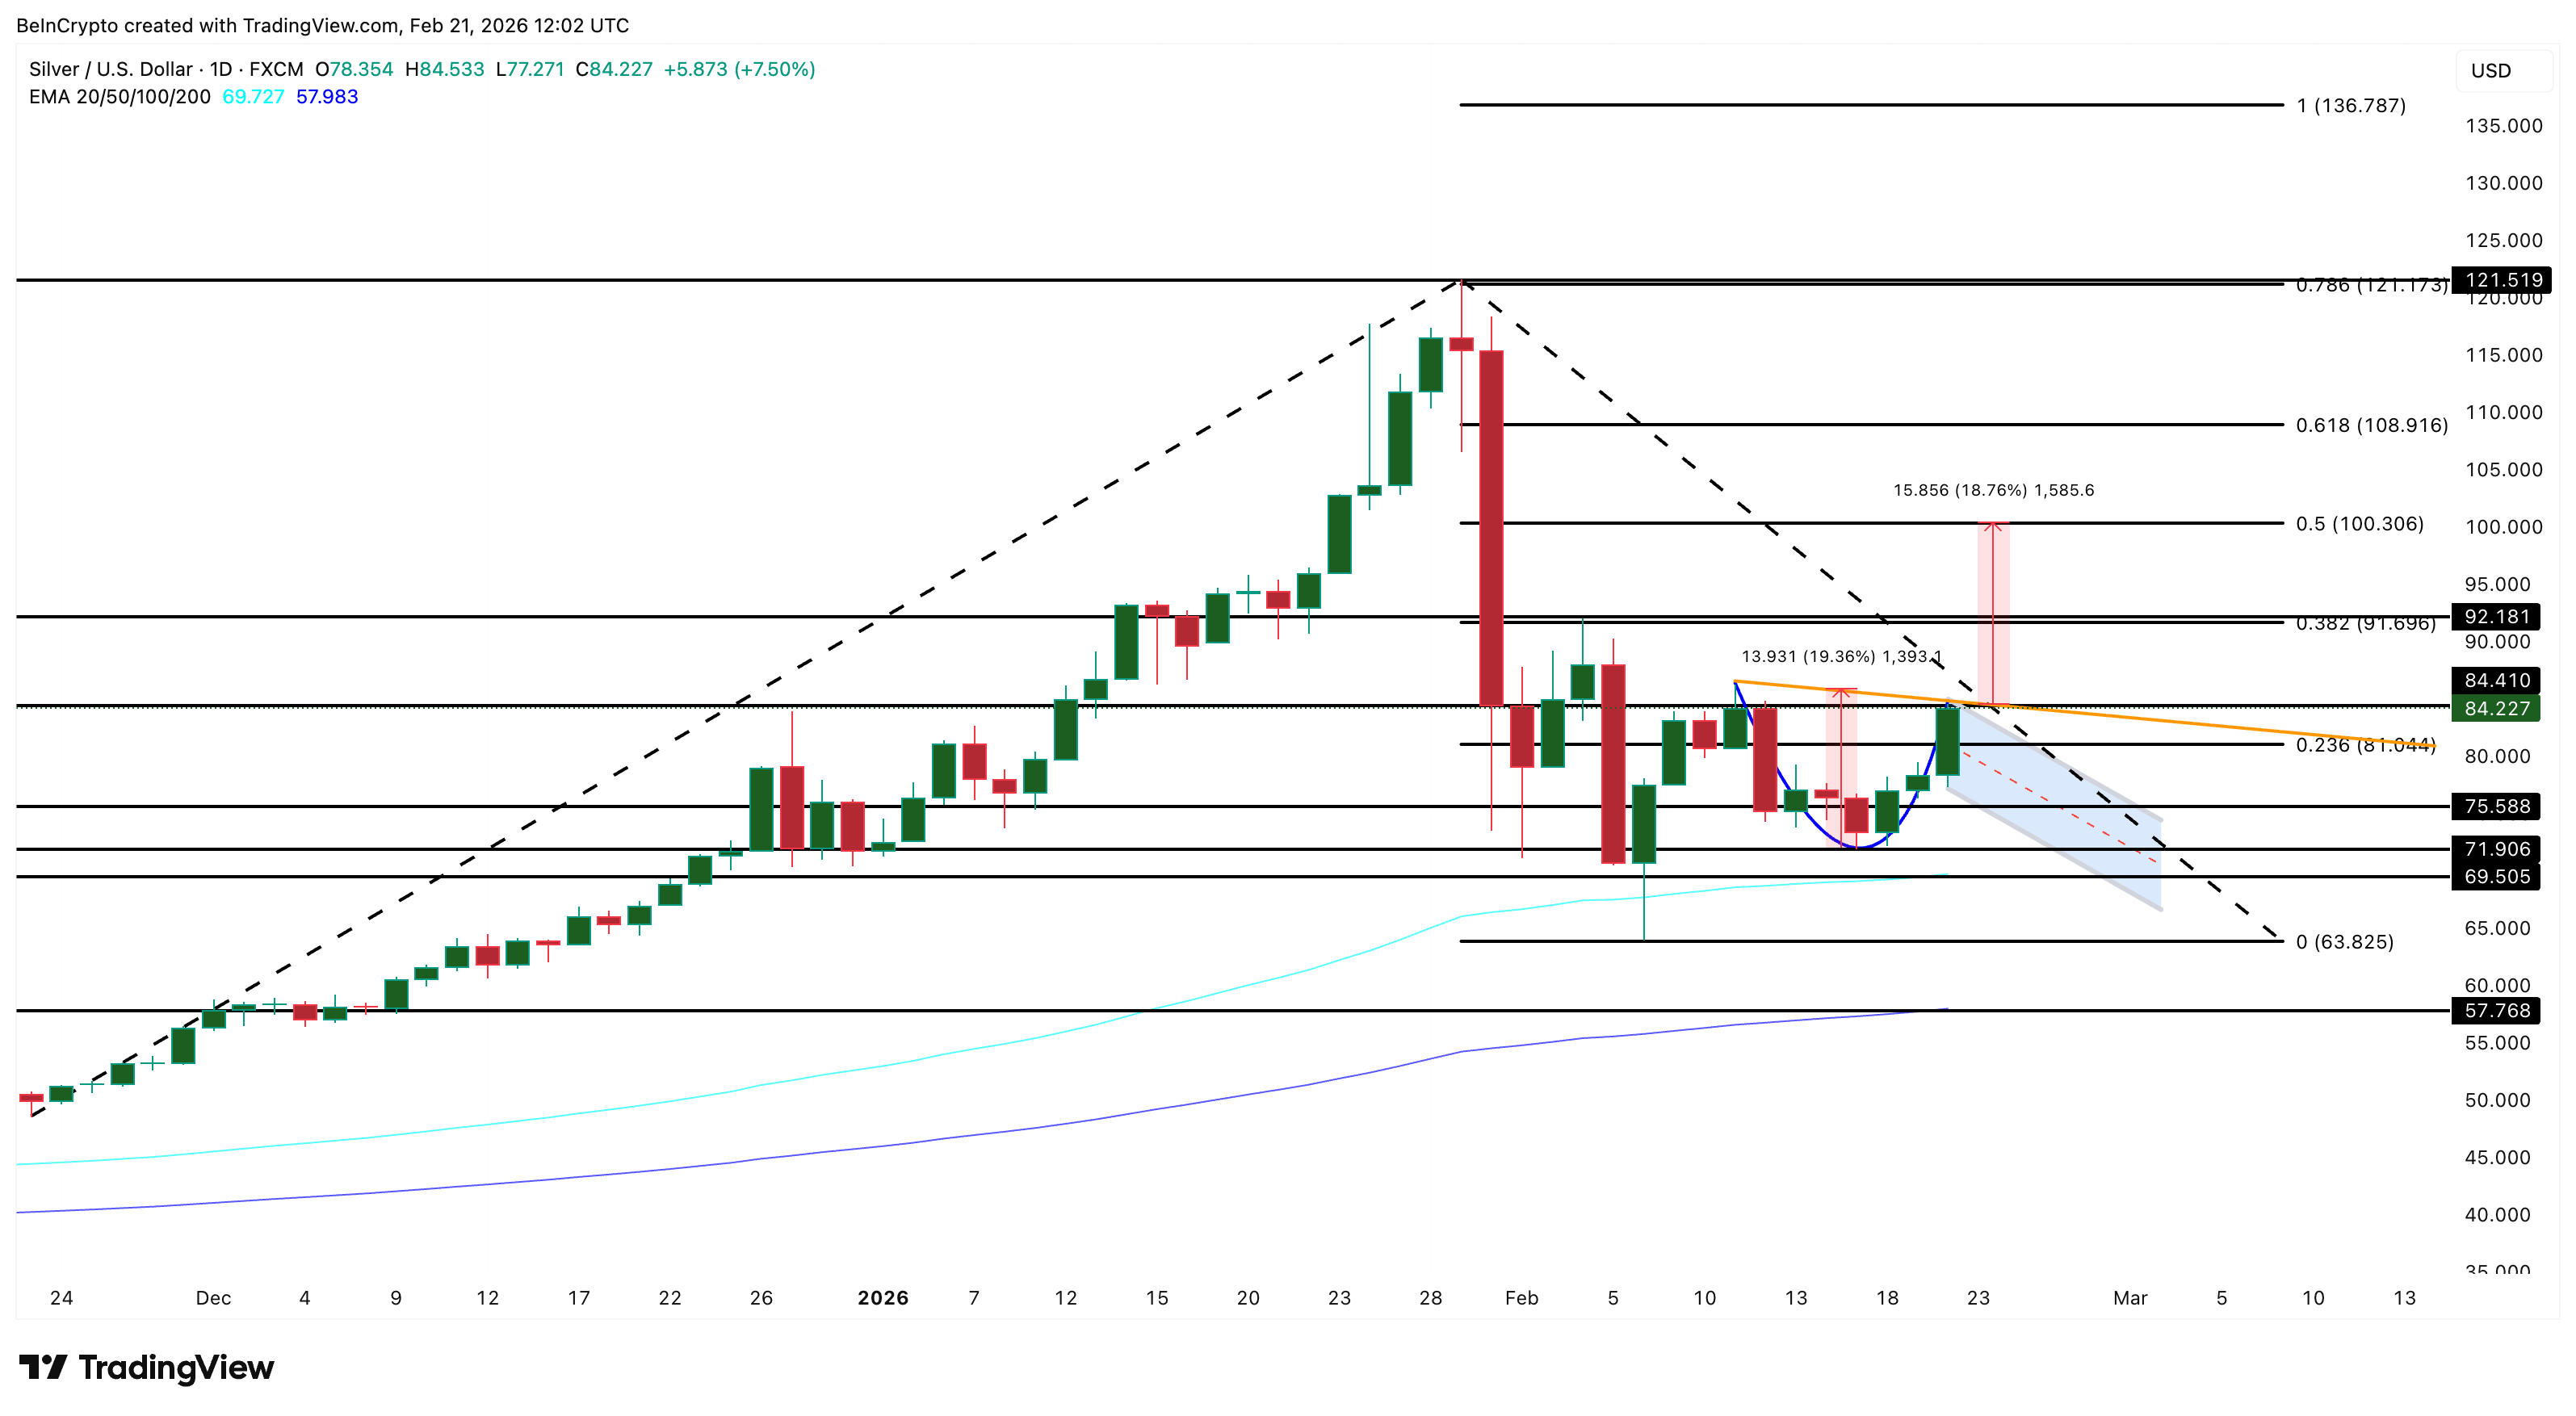
On the downside, $75 is the line in the sand. A daily close below $75 cracks the cup structure and invites a retest of $71. Losing $71 invalidates the cup formation entirely, exposing the 100-day moving average at $69.
Below that, the 200-day moving average at $57 represents one of the strongest structural support levels on the chart.
The bearish scenario gains traction if DXY surges above 100. Or the gold-silver ratio decisively breaks out of its bullish flag. Or if upcoming US economic data reinforces a higher-for-longer Fed stance, crushing rate-cut expectations.

IoTeX, a decentralized identity protocol, is examining unusual activity tied to one of its token safes after on-chain analysts flagged a potential security incident. In a Saturday post on X, the team said it was fully engaged, working around the clock to assess and contain the situation, with early estimates suggesting losses may be lower than circulating rumors. IoTeX said it has coordinated with major exchanges and security partners to trace and freeze funds tied to the attacker, and that monitoring would continue while updates are issued to the community. The event coincided with a sharp move in its native token, IOTX, which declined more than 8% in the past 24 hours to about $0.0049, per CoinMarketCap data.
Key takeaways
- Estimated losses from the incident are around $4.3 million, according to on-chain researchers.
- A private key tied to the compromised wallet is suspected to have been exposed, enabling unauthorized withdrawals.
- The wallet reportedly held USDC (CRYPTO: USDC), USDT (CRYPTO: USDT), IoTeX’s own token (CRYPTO: IOTX), and wrapped Bitcoin (CRYPTO: WBTC).
- Stolen assets were swapped into Ether (CRYPTO: ETH) and approximately 45 ETH were bridged to Bitcoin (CRYPTO: BTC).
- IoTeX’s IOTX price moved lower, signaling a market reaction to the breach.
- Industry observers note that many projects struggle to recover from hacks due to mismanaged responses and reputational damage.
Tickers mentioned: $BTC, $ETH, $WBTC, $USDC, $USDT, $IOTX
Sentiment: Bearish
Price impact: Negative. The breach and preliminary loss estimates contributed to a material drop in IOTX, which fell about 8% over 24 hours to around $0.0049.
Market context: The IoTeX incident underscores ongoing security risks in the crypto ecosystem, where fast-moving on-chain investigations, exchange cooperation, and cross-chain tracing are increasingly central to containment and potential recovery efforts.
Why it matters
The IoTeX event highlights the fragility of hot wallets and the speed at which attackers can move funds across chains. When a private key tied to a token safe is compromised, the window for containment narrows rapidly as attackers liquidate holdings through decentralized exchanges and bridge assets across networks. The loss of roughly $4.3 million, or a substantial portion of it, can ripple through a project’s liquidity and user trust, especially for a platform focused on identity and privacy where user confidence is paramount.
Initial disclosures stress that IoTeX has engaged with major crypto exchanges and security partners to trace and potentially freeze the stolen funds. That level of collaboration is critical, given the cross-chain nature of the theft—assets were moved from a compromised wallet into other assets and then shifted across protocols. The fact that the attacker converted a portion of the stolen holdings into Ether and bridged a segment of that value to Bitcoin illustrates the classic pattern of attempting to launder proceeds while attempting to complicate recovery efforts for investigators and custodians alike.
Beyond the immediate financial impact, the incident feeds into a broader debate about resilience in crypto projects. Historically, a large share of projects impacted by hacks struggle to recover, not solely due to direct losses but as a result of damaged user trust and liquidity withdrawal. Industry observers emphasize that premature or unclear communications during the initial hours can exacerbate losses and erode confidence, even when technical fixes are ultimately deployed. The broader Web3 security community has long argued that robust incident response plans, transparent updates, and proactive fund-tracing strategies can improve outcomes, but they require organizational readiness that many teams still lack.
Analysts also point to the reputational toll. Even after funds are recovered or secured, projects can face protracted liquidity challenges and user flight. In parallel, regulators and auditors are increasingly scrutinizing protocols’ security postures, making timely disclosures and rigorous post-incident governance essential to long-term viability. These dynamics weigh on investor sentiment as the market recalibrates risk premiums for teams with evolving security practices and incident histories.
What to watch next
- IoTeX updates on the investigation, including any identified wallet addresses and the status of the compromised safe.
- Any formal announcements from involved exchanges about frozen funds or cooperation with investigators.
- On-chain tracing progress revealing whether additional assets remain at risk or have been isolated.
- Future security disclosures from IoTeX, including steps to strengthen custody and reduce exposure to private-key compromises.
- Industry commentary on lessons learned and potential shifts in cross-chain handling and wallet security practices.
Sources & verification
- IoTeX’s official X post describing the investigation and ongoing containment efforts.
- Specter Analyst’s on-chain findings outlining the suspected keys compromise, asset mix, and the $4.3 million loss.
- CoinMarketCap data showing IOTX price movement to around $0.0049 in the 24-hour window following the incident.
- Commentary from immunefi and Kerberus executives referenced in related security coverage about breach response, recovery rates, and reputational impact.
IoTeX security incident: investigators race to trace $4.3 million in losses
IoTeX’s response began with a transparent acknowledgment that an anomalous activity tied to one of its token safes warranted a full review. The company emphasized that it is “fully engaged, working around the clock to assess and contain the situation,” and it noted cooperation with major exchanges and security partners to trace and freeze funds linked to the attacker. While early estimates suggested that losses could lie below the most vocal rumors, the evolving on-chain picture pointed to a more substantial weakness in the wallet’s protection than initially anticipated.
On-chain researcher Specter outlined a sequence of events that raised alarm bells. A private key associated with the affected wallet appeared compromised, enabling the theft and rapid movement of assets. The wallet’s holdings encompassed multiple tokens, including USDC (CRYPTO: USDC), USDT (CRYPTO: USDT), IoTeX’s own token (CRYPTO: IOTX), and wrapped Bitcoin (CRYPTO: WBTC). The total value of confiscated funds was estimated at roughly $4.3 million. After extraction, the attackers reportedly swapped a portion of the loot for Ether (CRYPTO: ETH) and bridged approximately 45 ETH to BTC (CRYPTO: BTC). The credible linkage of several addresses and transaction patterns suggested an effort to obfuscate trail and cross-chain activity as funds moved through liquidity venues and bridge layers.
The public timeline included references to addresses associated with the suspected attacker and rapid interchanges across decentralized exchanges. The pattern—swift token swaps and cross-chain hops—aligns with common strategies employed by attackers seeking to minimize traceability and maximize speed to liquidity. While the exact provenance of the breach remains under investigation, the broader takeaway is clear: a private-key exposure in a single wallet can trigger a cascade of consequences across multiple assets and chains.
In parallel with the security-focused updates, market data reflected a knee-jerk reaction. IoTeX’s native token (IOTX) experienced a material price drop in the wake of the incident, underscoring how security events can translate into short-term liquidity stress and a shift in investor sentiment. The incident also placed renewed emphasis on the role of custodianship and incident-response readiness in the crypto ecosystem, particularly for projects that operate in the decentralized identity and privacy sphere where user trust is foundational.
Looking ahead, the industry will be watching how IoTeX negotiates recovery, if any, for affected users and whether the incident triggers any governance or security enhancements. The data points from this event—private-key exposure, rapid asset exfiltration, cross-chain movement, and the subsequent market reaction—will likely shape risk assessments for similar protocols and influence best practices for hot-wallet security testing and incident management in the months ahead.


CME Group, the derivatives exchange giant favored by Wall Street, said it will begin offering 24/7 trading for its cryptocurrency futures and options on May 29, a major milestone in how traditional institutions access crypto markets.
The move, the exchange said, aims to meet growing demand from professional investors who want to manage risk continuously even during weekends, when crypto volatility often spikes as institutional venues are closed.
The decision to open around the clock was driven by growth, said Tim McCourt, CME’s global head of equities and FX, adding that crypto derivatives across CME venues hit a record $3 trillion in notional volume last year.
“Client demand for risk management in the digital asset market is at an all-time high,” he said.
‘Violent price swings’
However, this move will have an even greater impact on how crypto trades on weekends.
While crypto markets have always been live around the clock, CME’s derivatives — widely traded by hedge funds and institutions for their strict regulatory oversight — usually shut down on Friday evening and reopen on Sunday, while the spot market stays open 24/7.
That discrepancy contribute to the well-known “CME gaps,” the empty price area between Friday’s close and Sunday’s open, leaving institutions exposed to weekend price swings without the ability to hedge.
Experts say CME’s shift to always-on trading could reshape liquidity and trading dynamics across both institutional and retail crypto markets, especially around the weekends.
“The most violent price swings happen precisely when institutional venues are dark,” said Bobby Ong, co-founder of CoinGecko. “CME’s move is a structural acknowledgment of what CoinGecko data has shown for years.”
He said liquidation cascades during the weekend were a “predictable consequence” of thin, fragmented liquidity, noting that “CME [is] finally closing that gap.”
Less dramatic moves
What this will essentially do is make trading more seamless between weekdays and weekends.
Adam Haeems, head of asset management at Tesseract Group, said the change “closes one of the last structural gaps between crypto-native markets and regulated derivatives infrastructure.”
Institutional flows that pause on Friday and restart on Sunday will continue uninterrupted, reducing the risk and cost of holding positions through weekends. He added that weekend volatility has been “a direct consequence of this structural mismatch,” and continuous trading should help compress those price swings and narrow spreads.
However, this doesn’t guarantee a total reduction of massive swings; rather, price action will likely be more gradual.
Haeems cautioned that simply keeping the venue open doesn’t guarantee deep liquidity. “Institutional desks may not staff weekend risk-taking at the same intensity as weekdays,” he said. “The improvement will be real but gradual.”
For retail traders, the change may mean less dramatic Monday price action.
“Tighter pricing and fewer of those jarring Monday-morning gap moves,” said Haeems. “The CME gap has historically filled more than 90% of the time — retail traders who track futures structure will notice that signal fading.”
Bitcoin as a macro risk proxy
Maxime Seiler, CEO of trading firm STS Digital, echoed that the change offers clear benefits to institutions, especially those wary of the forced liquidation mechanisms on crypto-native platforms.
“The ability to trade futures and options on CME without the risk of auto-deleveraging is a huge selling point,” he said.
He also pointed to a shift in how bitcoin may be used over weekends as a professional tool to hedge global risk events when other assets are not available to trade.
“With other markets closed, bitcoin could increasingly function as a proxy for broader macro risk, pricing in global events in real time.”

Blue Owl Capital’s (OWL) announcement this week that it would sell $1.4 billion in loans to raise liquidity for investors in a retail-focused private credit fund has triggered alarm bells across financial markets, with more than one prominent analyst drawing direct parallels to two Bear Stearns hedge fund collapses that foreshadowed the 2008 financial crisis — and for bitcoin investors, the implications could be profound.
While there was no damage across the major stock market averages, Blue Owl shares fell about 14% for the week and are now lower by more than 50% year-over-year. Other major private-equity players, including Blackstone (BX), Apollo Global (APO), and Ares Management (ARES), also suffered sizable declines.
It stirred some painful memories for those who suffered through the 2008 global financial crisis (GFC).
In August 2007, two Bear Stearns hedge funds collapsed after suffering heavy losses on subprime mortgage-backed securities, while BNP Paribas froze withdrawals in three funds, citing an inability to value U.S. mortgage assets. Credit markets seized up, liquidity evaporated, and what seemed like an isolated incident spiraled into the global financial crisis.
“Is this a ‘canary-in-the-coalmine’ moment, similar to August 2007,” asked former Pimco head Mohamed El-Erian. “There’s plenty to think about here, starting with the risks of an investing phenomenon in [artificial intelligence] markets that has gone too far,” he continued. El-Erian was quick to point out that while the risks could be systemic, they don’t appear to be anywhere near the magnitude of the 2008 crisis.
Blue Owl’s issue may or may not be another Bear Stearns moment, but if it is, what might that mean for bitcoin?
First, private credit stress doesn’t automatically mean bitcoin rallies. In fact, in the short term, tighter credit conditions can hurt risk assets, bitcoin and the broader crypto market among them. While bitcoin wasn’t around during the 2008 meltdown (more on that later), the price action as the Covid crisis was unfolding — about a 70% decline from mid-February 2020 to mid-March — is illuminating.
The U.S. government’s Federal Reserve’s eventual response, though, could be powerfully bullish for bitcoin. In 2020, trillions of dollars were injected into the economy, helping send BTC from a low of below $4,000 to more than $65,000 about a year later.
The 2007-2008 playbook followed a similar trajectory: initial credit market stress, equity market denial, banking sector contagion, then massive central bank intervention. If Blue Owl represents the “first domino” — as former Peter Lynch associate George Noble suggested — the sequence could repeat with private credit replacing subprime mortgages as the trigger.
“Chancellor on brink of second bailout for banks”
One of the major outcomes of the 2008 event was the creation of Bitcoin.
The world’s original cryptocurrency was born during the global financial crisis, in part because its mysterious creator (or creators), Satoshi Nakamoto, was disillusioned with governments and central banks conjuring up hundreds of billions, if not trillions, of dollars with little more than a few keystrokes on a computer.
Another major part of the world’s largest digital asset was to create a parallel digital currency that would allow direct peer-to-peer online payments without the need for a financial institution or any government intervention. Essentially, hope was to create a direct alternative to a legacy banking system that had just proved fragile enough to bring down the global financial order through the meddling of centralized entities.
In fact, Bitcoin’s first-ever block, the so-called Genesis Block on Jan. 3, 2009, was embedded by Satoshi with “Chancellor on brink of second bailout for banks.” That was the headline in The Times of London that day as the U.K. government and the Bank of England engineered a response to the ongoing troubles in that country’s financial sector.
Worth essentially zero on that day and unknown to all but a small handful of “cypherpunks,” bitcoin, 17 years later, has a market cap topping $1 trillion and has the largest asset managers on the planet calling it a near-essential asset to own for most portfolios.
Bitcoin, as we now know it, of course, is different from the original cryptocurrency in 2009. Today, the notion of “store of value” and “digital gold” has come and gone. What was supposed to be anti-establishment has become part of the larger financial system. Large holders are hoarding massive amounts of bitcoin on their balance sheets, financial giants are offering bitcoin to the masses via exchange-traded funds, and even some government entities are buying for their strategic reserves.
So does the Blue Owl failure mean another resurgence of Bitcoin’s original thesis and, in turn, another bull run? Time will tell, but if this event turns out to be El-Erian’s “canary,” signalling another sizable crisis, the global financial system might be in for a rude awakening, and Bitcoin might just become the solution, whatever form it’s taken 17 years later.
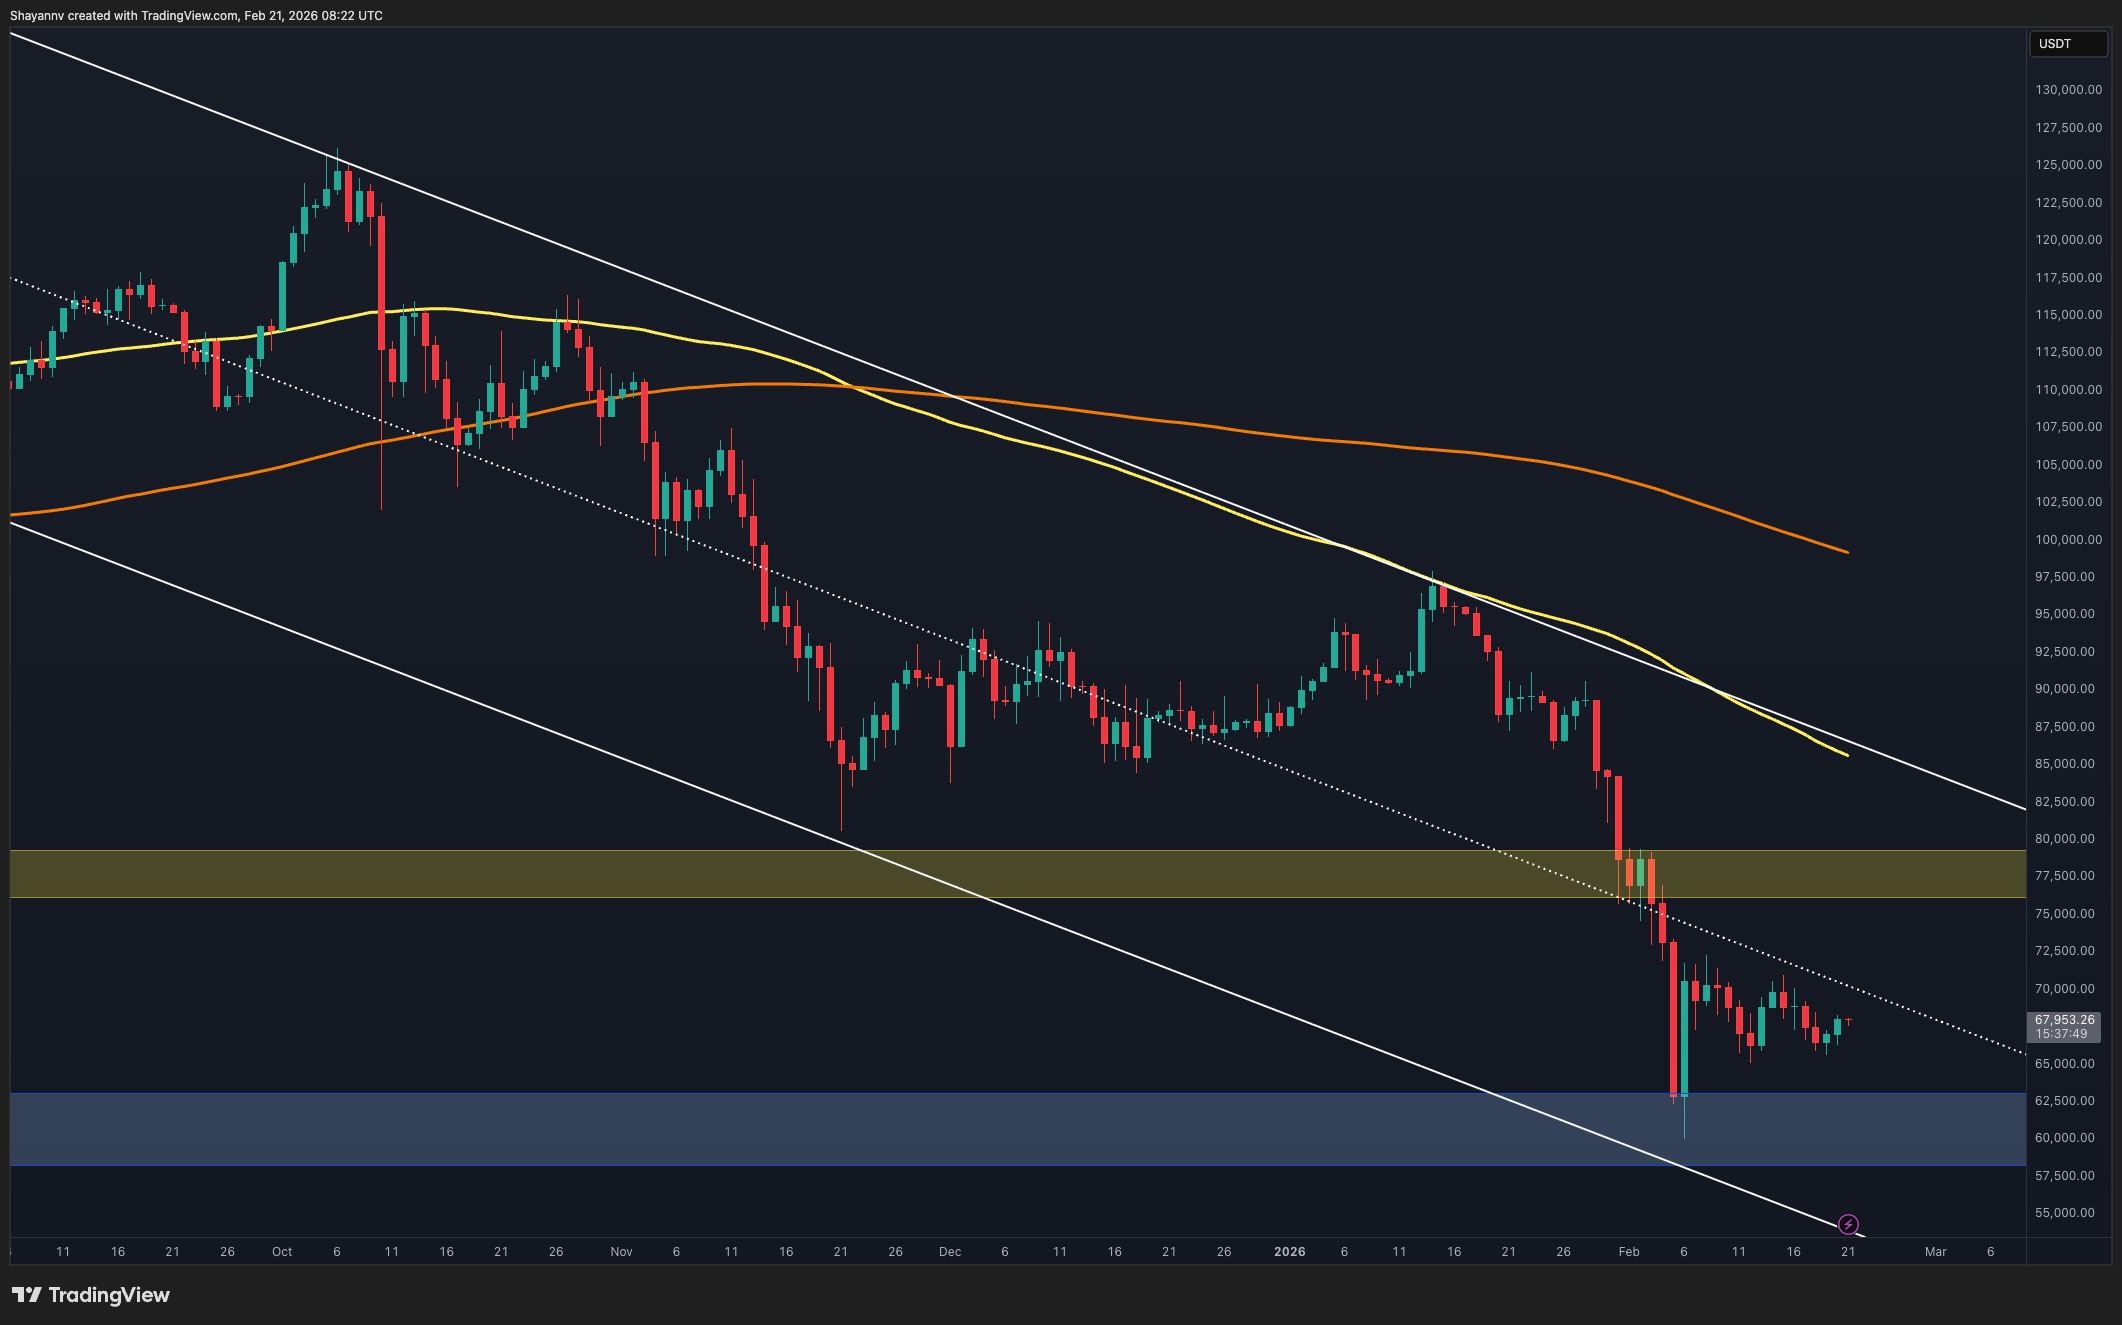
Bitcoin’s recent breakdown toward the $60K region triggered aggressive volatility, and the asset is now attempting to stabilize near a key demand base. Both higher- and lower-timeframe indicators suggest the market is approaching a decision point, with leverage dynamics adding another layer of sensitivity.
Bitcoin Price Analysis: The Daily Chart
On the daily timeframe, Bitcoin continues to trade within a well-defined descending channel, consistently forming lower highs and lower lows. The recent sell-off drove price directly into the $60K–$63K demand zone, where buyers reacted and prevented an immediate continuation lower.
However, the broader structure remains bearish. The price is still below the 100-day and 200-day moving averages, both of which are sloping downward and acting as dynamic resistance. The $75K–$80K region now stands as a significant supply zone, aligning with prior breakdown structure and acting as the first major obstacle in case of a recovery.
As long as BTC remains capped below the mid-channel resistance and the moving averages, any rebound should be considered corrective. A sustained hold above the $60K base is critical; otherwise, renewed selling pressure could push the price toward deeper levels within the channel.

BTC/USDT 4-Hour Chart
On the 4-hour timeframe, Bitcoin is consolidating inside a tightening symmetrical triangle following the sharp rebound from the $60K low. The structure reflects short-term equilibrium after extreme volatility, with the upper boundary acting as dynamic resistance and the ascending lower trendline providing near-term support.
The asset is currently compressing near the apex, signaling that a breakout is likely imminent. A bullish breakout above the triangle could trigger a move toward the $74K–$76K resistance zone, which aligns with the previous breakdown area and local supply. On the other hand, a downside break would expose the $60K demand region once again and potentially open the door for a deeper liquidity sweep.

Sentiment Analysis
The Estimated Leverage Ratio on Binance has recently declined sharply alongside price, indicating that a significant portion of leveraged positions has been flushed from the market. This deleveraging phase reduces immediate systemic risk and suggests that some excess speculative exposure has already been cleared.
Currently, leverage levels are stabilizing at relatively lower readings compared to prior peaks. While this reduces the probability of an aggressive long squeeze in the immediate term, it also means that any new expansion in leverage could amplify the next breakout from the current consolidation.
Overall, Bitcoin is at a technically sensitive level. The price is consolidating above a major daily demand zone, the short-term structure is compressing, and leverage has reset. The next directional move will likely be driven by a decisive breakout from the 4-hour triangle, with $60K as the key downside pivot and the $75K region as the first major upside barrier.

The post Bitcoin Price Analysis: How Important Is It for BTC to Reclaim the $70K Resistance? appeared first on CryptoPotato.
Crypto World
Cardano (ADA) Trading Activity Hits 6-Month Low as Mutuum Finance (MUTM) Gains Attention After Testnet Launch

Trading activity for Cardano (ADA) has fallen to a six-month low. Analysts note that ADA’s liquidity and on-chain engagement have cooled, highlighting a period of stagnation for one of the crypto market’s early blue-chip assets. In contrast, Mutuum Finance (MUTM) has garnered attention following the launch of its testnet. The new crypto offers a protocol that allows users to lend and borrow in a non-custodial manner.
Cardano Sees Sharply Reduced Trading Activity
Cardano (ADA) has experienced a slowdown in market activity over the past six months. Weekly decentralized exchange trading volume has dropped over 94% from 19.1 million ADA in August 2025 to just 1.17 million ADA by mid-February 2026. This decline mirrors the token’s price, which has retraced 68% over the same period.
Despite this weakness, early signs of a potential recovery are emerging. Cardano’s daily chart now shows an inverse head-and-shoulders formation. However, the increase in profitable supply from 6% to around 10% introduces profit-taking risks, as some investors may sell when returns are regained. While Cardano battles fading investor interest, DeFi crypto Mutuum Finance experiences the exact opposite. Its presale continues to see growing investor attention.
Mutuum Finance Presale Maintains Strong Momentum
Mutuum Finance draws strong investor interest following its public debut on the Sepolia testnet in 2026. Now in Phase 7, the token is priced at $0.04, a 4x increase from $0.01 in phase one. The current phase presents a narrowing entry window, with a limited allocation remaining for presale participants and a confirmed listing price of $0.06. The presale features gradual price increases, including a 20% jump in the upcoming phase. This approach rewards early participation, while delayed entry means paying more for the same number of tokens.
Mutuum Finance has officially launched its V1 Protocol on the Sepolia testnet, allowing users to interact with the platform in a safe testing environment using test tokens instead of real funds. This testnet enables participants to explore the protocol’s lending, borrowing, and staking features while helping the team refine performance and security before the mainnet goes live.

Core features available on the testnet include:
- Liquidity pools and mtTokens, which are receipt tokens that track deposits, interest, and lending activity within the protocol.
- Debt tokens that represent borrowers’ loan positions.
- A liquidator bot that automatically protects the protocol by liquidating unsafe loans if collateral levels drop too low.
- A Portfolio dashboard where investors can monitor deposits, loans, and collateral levels
- Support for ETH, USDT, LINK & WBTC assets
Why the testnet launch is important
- It validates the protocol before mainnet launch
- It allows users to test features without financial risk
- It helps identify bugs and improve security
- Builds trust and transparency
- Demonstrates that the platform is functional
Looking ahead, Mutuum Finance plans multichain deployment and Layer-2 integration to enhance transaction speed and accessibility when the protocol goes live. The presale has drawn participation from over 19,020 investors, with the testnet debut recently sending the funds raised past $20.60 million.
Collateral-Backed Lending Supports Stability
Mutuum Finance features a native stablecoin designed to provide stability for DeFi participants. Users can deposit other assets as collateral to mint the stablecoin and receive corresponding debt tokens that represent their obligations. This ensures all issued stablecoins are fully backed.
A user may, for instance, deposit 4,500 USDC as collateral to mint 4,000 units of the Mutuum Finance stablecoin. Over time, this loan may gain a $500 borrow interest. Once the borrower settles the loan, the 5,000 units of the Mutuum Finance stablecoin (4,500 loan plus 500 interest) are removed from circulation, and the corresponding debt tokens are destroyed, releasing the 4,500 USDC collateral back to the user. This mechanism maintains solvency and transparency while supporting flexible borrowing.
Peer-to-Peer Lending Expands Investment Options
Mutuum Finance offers Peer-to-Contract (P2C) and Peer-to-Peer (P2P) lending. P2C follows a pool-based lending model in which lenders deposit funds into shared liquidity pools, and borrowers access loans from these pools while paying interest. P2P allows users to create customized lending agreements outside liquidity pools, providing flexibility for volatile assets.
For example, an investor could offer $12,000 worth of a volatile token, such as PEPE, as collateral for an $8,000 USDT loan at 13% borrow APY. A lender will then review and accept these agreements, enabling tailored opportunities.
As Cardano’s trading activity hits a six-month low with DEX volume down 94%, investor attention is shifting toward Mutuum Finance (MUTM), a new crypto in presale. The DeFi crypto is gaining attention following its testnet launch, with presale funds now exceeding $20.62 million. Its $0.04 token price represents a discounted entry with strong growth potential ahead. This positions it as a strong alternative while legacy assets like ADA experience slow growth.
For more information about Mutuum Finance (MUTM) visit the links below:
Website: https://mutuum.com/
Linktree: https://linktr.ee/mutuumfinance
Disclaimer: This is a Press Release provided by a third party who is responsible for the content. Please conduct your own research before taking any action based on the content.


The ProShares GENIUS Money Market ETF (IQMM) shattered all records by logging $17 billion in first-day trading volume. The ETF invests in very short-term US government debt, making it extremely low risk and similar to holding cash.
This ETF is designed so institutions, including stablecoin issuers, can use it as a safe place to store money while earning a small yield. However, market structure experts warn the staggering sum reflects a massive, behind-the-scenes corporate treasury migration rather than a sudden wave of retail investor mania.
IQMM’s Historic Launch Redraws How Stablecoin Issuers Hold Dollar Reserves
Bloomberg Senior ETF Analyst Eric Balchunas noted that BlackRock’s highly successful Bitcoin fund, IBIT, only pulled then the unprecedented $1 billion in day-one volume. IBIT is the largest Bitcoin fund with over $50 billion in assets.
However, Balchunas stated that IQMM’s launch is “multitudes beyond the all-time record for an ETF.”
“I was wrong about this ETF, I just figured it would be niche at best as people would use $BIL or $SHV as money market substitutes,” he wrote on the social media platform X.
According to him, the fund appears to be a textbook example of a “bring your own assets” strategy, in which an institutional client pre-arranges the transfer of existing off-balance-sheet capital into a newly regulated wrapper.
Initially, industry experts assumed ProShares had secured a lucrative deal with a major stablecoin issuer, such as Boston-based Circle.
“Would assume ProShares cut a deal with one of the major US-based stablecoin issuers. Looking at assets, believe that would only leave Circle,” Nate Geraci, president of NovaDius Wealth Management, claimed.
This is because IQMM is not a standard cash-equivalent fund as it is a purpose-built regulatory compliance vehicle. It was designed specifically to meet the strict legal reserve requirements established by the Guiding and Establishing National Innovation for US Stablecoins (GENIUS) Act.
Signed into law last year, the legislation mandates that domestic stablecoin issuers maintain one-to-one backing with highly liquid assets. It also strictly caps eligible US Treasury maturities at 93 days to prevent forced selling during periods of market stress.
However, Balchunas later clarified the true, decidedly less glamorous source of the record-breaking inflow.
“The call is coming from inside the house, literally, ProShares own funds are all now using IQMM now for their cash positions. Big time BYOA and not as exciting but arguably smart vs paying another fund co,” he added.
Still, crypto research firm 10X Research said the IQMM’s record launch proves that stablecoin reserves could rapidly migrate into transparent structures.
According to the firm, ProShares’ IQMM represents an unprecedented bridge between traditional financial markets and the digital asset economy.
The fund allows stablecoin issuers to park their dollar reserves in a highly liquid, transparent, and heavily regulated ETF wrapper, rather than shouldering the operational burden of managing complex, private portfolios.
“This is massive because it institutionalizes stablecoin backing, reduces opacity risk, and could channel hundreds of billions of dollars in digital dollar reserves directly into Treasury markets under the GENIUS framework,” the firm added.
By institutionalizing stablecoin backing, the traditional US financial system has effectively pulled crypto’s monetary base onshore.

Zcash price slumps as Ethereum plans stealth addresses and ZK privacy features

What You Need To Know Before Going Abroad For Surgery

Ireland side to play England, Saturday at 2.10pm


-

 Video5 days ago
Bitcoin: We’re Entering The Most Dangerous Phase
-

 Tech7 days ago
Luxman Enters Its Second Century with the D-100 SACD Player and L-100 Integrated Amplifier
-

 Crypto World4 days ago
Can XRP Price Successfully Register a 33% Breakout Past $2?
-

 Sports4 days ago
GB's semi-final hopes hang by thread after loss to Switzerland
-

 Fashion20 hours ago
Weekend Open Thread: Boden – Corporette.com
-

 Video2 days ago
XRP News: XRP Just Entered a New Phase (Almost Nobody Noticed)
-
 Tech4 days ago
The Music Industry Enters Its Less-Is-More Era
-

 Business4 days ago
Infosys Limited (INFY) Discusses Tech Transitions and the Unique Aspects of the AI Era Transcript
-

 Entertainment3 days ago
Kunal Nayyar’s Secret Acts Of Kindness Sparks Online Discussion
-

 Video4 days ago
Financial Statement Analysis | Complete Chapter Revision in 10 Minutes | Class 12 Board exam 2026
-

 Tech3 days ago
Retro Rover: LT6502 Laptop Packs 8-Bit Power On The Go
-
 Sports2 days ago
Clearing the boundary, crossing into history: J&K end 67-year wait, enter maiden Ranji Trophy final | Cricket News
-

 Entertainment3 days ago
Dolores Catania Blasts Rob Rausch For Turning On ‘Housewives’ On ‘Traitors’
-

 Business3 days ago
Tesla avoids California suspension after ending ‘autopilot’ marketing
-
 NewsBeat6 days ago
The strange Cambridgeshire cemetery that forbade church rectors from entering
-

 Politics4 days ago
Eurovision Announces UK Act For 2026 Song Contest
-

 Crypto World3 days ago
WLFI Crypto Surges Toward $0.12 as Whale Buys $2.75M Before Trump-Linked Forum
-
 NewsBeat6 days ago
Man dies after entering floodwater during police pursuit
-

 Crypto World2 days ago
83% of Altcoins Enter Bear Trend as Liquidity Crunch Tightens Grip on Crypto Market
-
 NewsBeat1 day ago
Andrew Mountbatten-Windsor latest: Police search of Royal Lodge enters second day after Andrew released from custody